1. Introduction
Thanks to the evolution of telecommunication technologies, the use of telemedicine (TLM) has spread rapidly in different areas. This paper focuses on
Telemonitoring, which provides the acquisition and management of the patients’ vital parameters from a remote location, so as to be continuously monitored at home. Blood pressure (BP) is one of the principal vital signs. The continuous and non-invasive remote monitoring of BP has been widely investigated in the past decades with the aim of preventing and treating hypertension. The idea of using PPG signal, collected in a optical non-invasive method, which is easy to obtain and can be used to detect blood volume fluctuations, has been explored. The amount of light scattered, reflected, or transmitted, calculated using the Beer–Lambert law, can provide an indication of changes in overall blood volume [
1]. PPG, with respect to other biological signals, has a higher mobility, thus allowing continuous monitoring during everyday-life activity. Nevertheless, PPG has been widely used to measure blood oxygen; it has also been related to arterial blood pressure waveform [
2], where Pulse Transit Time (PTT) and the Pulse Wave Velocity (PWV) have been calculated from the Electrocardiogram and the PPG signals. Other works also try to estimate BP deriving either the PTT or the PWV [
3]. However, these methods require the use of two devices to acquire both electrocardiogram and photoplethysmogram, thus limiting the subject’s freedom of movement. In order to overcome the above-mentioned synchronization problem, some studies have tried to determine the nonlinear relationship between PPG and ABP. In [
4], 21 features and a multilayer feed-forward back propagation ANN with 21 input neurons and two output neurons, to estimate Systolic and Diastolic blood pressure, have been used, and satisfactory results have been achieved. In this work we implemented an ANN model able to estimate the SP starting from the PPG signal only. The paper is organized as follows. In
Section 2, the state of the art is presented. In
Section 3, the Materials and Methods are discussed. In
Section 4, results are presented, and in
Section 5, the conclusions are reported.
2. State of the Art
Several methods exist to measure BP, divided into two main categories: invasive blood pressure (IBP) and non-invasive blood pressure (NIBP) measurement systems. The first ones are used in the intensive care unit (ICU) and allow the beat-to-beat accurate monitoring of the patient’s BP. However, they may cause hematoma, infections, and possible occurrence of thrombi. Being invasive, they can only be used in hospital.
NIBP measurement systems are divided into cuff-based and cuff-less. Cuff-based methods are routinely used in the clinical practice and at home by the patients themselves. The main disadvantages are the intermittent monitoring and the discomfort caused by the inflation of the cuff. Cuff-less methods are more recent and represent an efficient approach for continuous home monitoring. The most common cuff-less method is based on the Pulse Wave Velocity (PWV) analysis. That is because arterial stiffness increases the propagation velocity of the pressure wave, which implies an increase in blood pressure [
5]. For example, in [
2], PTT, defined as the time lag between ECG and PPG, was calculated to derive PWV, which was then correlated with blood pressure readings using a standard linear curve fitting algorithm.
Although in the literature there are many works demonstrating the huge potential of PTT to enable cuff-less BP measurement, they require a calibration stage and the use of two sensors placed at a known distance. In order to overcome these drawbacks, the idea of using pure PPG signal based method has taken off. Photoplethysmography is a simple and low-cost optical technology able to detect change in light absorption due to blood volume fluctuations. The system is composed of:
PPG sensors are placed on the skin surface, and the amount of light detected by the PPG photo-detector provides important information about the performance of the vascular system. PPG waveform encompasses two different components. The physiological blood volume fluctuations, at each heart beat, are responsible of the pulsatile component (AC). On the other hand, the slow varying baseline (DC) is imputable to breathing, thermoregulation and sympathetic nervous system activity.
However, the correlation between PPG morphology and BP is nonlinear, and a morphological analysis on PPG signal is necessary in order to extract features useful to estimate the blood pressure. The today solutions are to first extract the morphological features from PPG and then estimates Systolic and Diastolic blood pressure. Nevertheless, the PPG signal is highly susceptible to motion artifacts, resulting in distorted signal and meaningless data zones [
6], hence the interest in using ANN to correctly analyze it, removing uninformative signal portion. Deep Neural Networks have been widely used in classification, analysis, and biological signal segmentation, such as ECG and PPG [
7]. In [
8], Soltane et al. using an ANN has been able to categorize PPG signal in pathological and healthy, with a rate of success equals to 94.7%. Thanks to the advances of Deep Neural Networks, the PPG removing artifacts turns out to be not as challenging as it used to be. In [
6], an unsupervised Convolutional Neural Network has been able to detect and remove artifacts in a PPG signal. In [
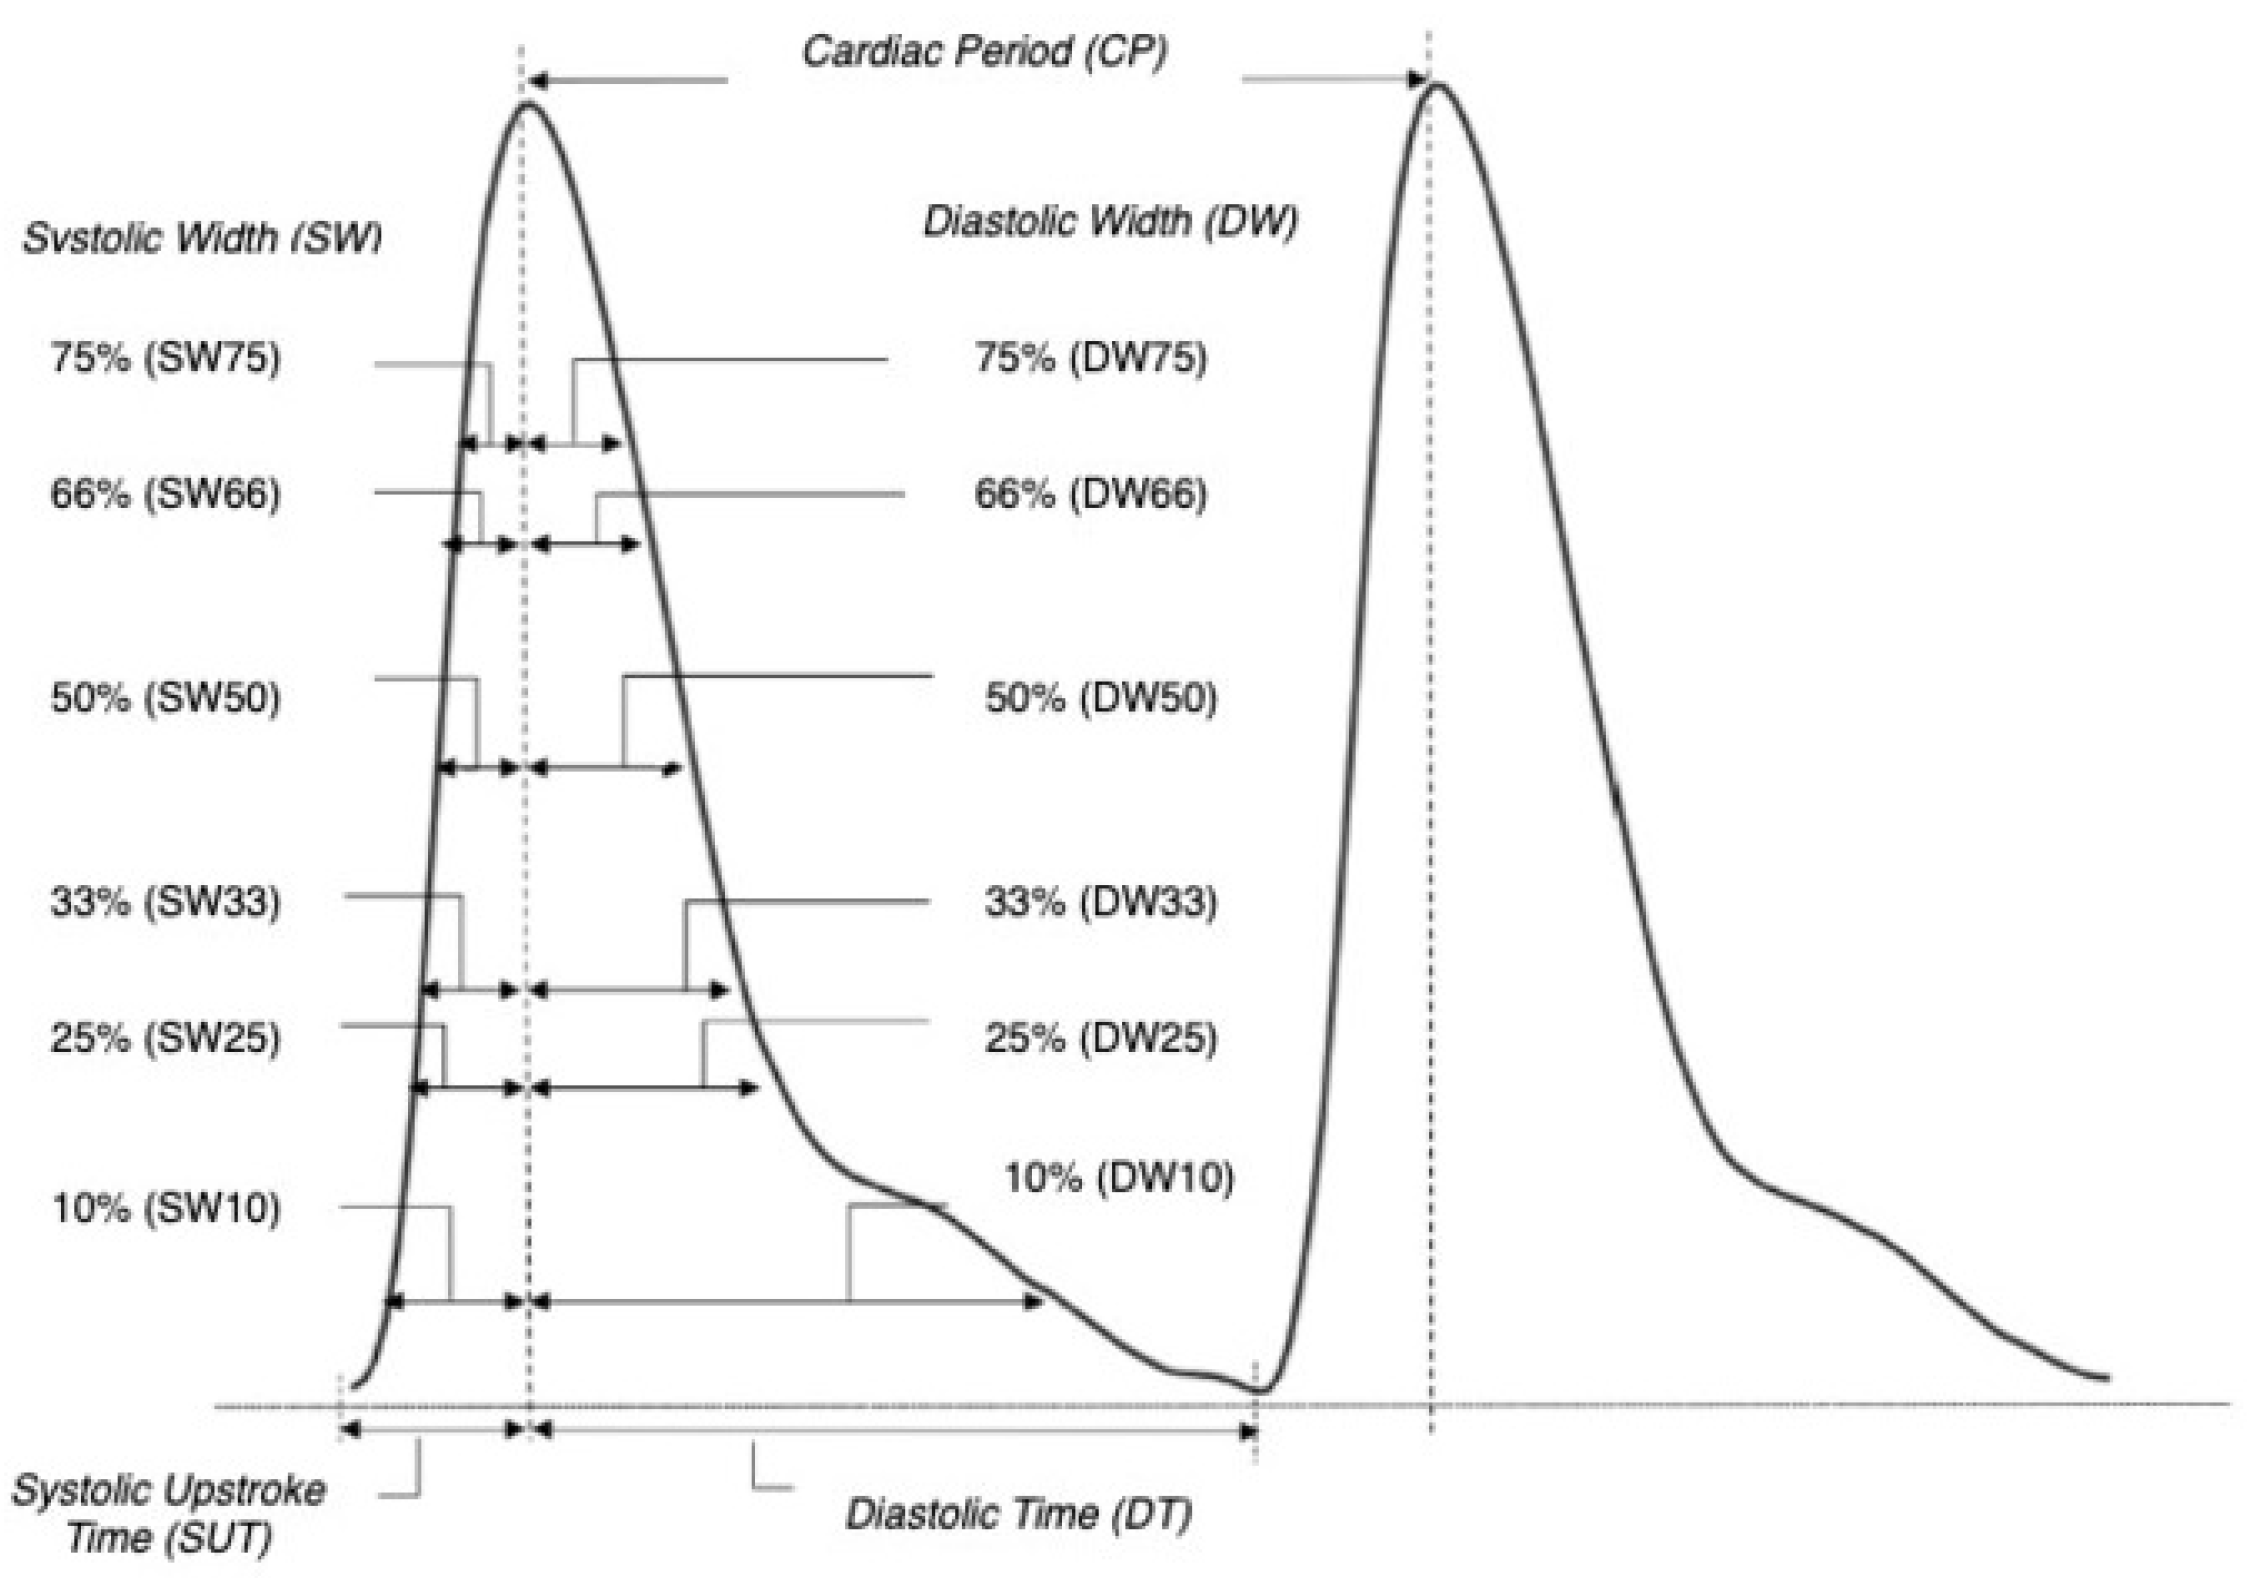
4], an ANN is used to estimate systolic and diastolic blood pressure values, from twenty-one time domain features, extracted from 15,000 PPG periods (
Figure 1). In [
9], in addition to the time-domain features, frequency and complexity-analysis domain features were computed, so as to describe PPG periods morphology, complexity, amplitude and phase in the frequency domain. The performance of [
9] has been evaluated on the MIMIC III database and on their everyday-life dataset collected at Jozef Stefan Institute (JSI). In [
10], a PPG signal, a velocity plethysmogram (first derivative of PPG) and an accelerated plethysmogram signal (second derivative of PPG and an important indicator of arteriosclerosis), are fed into an autoencoder, to extract different features from the conventional ones, effective for the blood pressure estimation.
3. Materials and Methods
This project, developed at the Remote Monitoring group, STMicroelectronics in Agrate Brianza, Italy, is divided into two parts:
Our first database, containing PPG and arterial blood pressure signals from 47 patients in ICU, was derived from
MIMIC III (MIMIC III is a large, freely available clinical database). Signals were pre-processed in
Matlab R2019a; a 4th order Butterworth low-pass filter with a cutoff frequency of 6.6 Hz was used to remove high-frequency noise from the ABP signal, and the
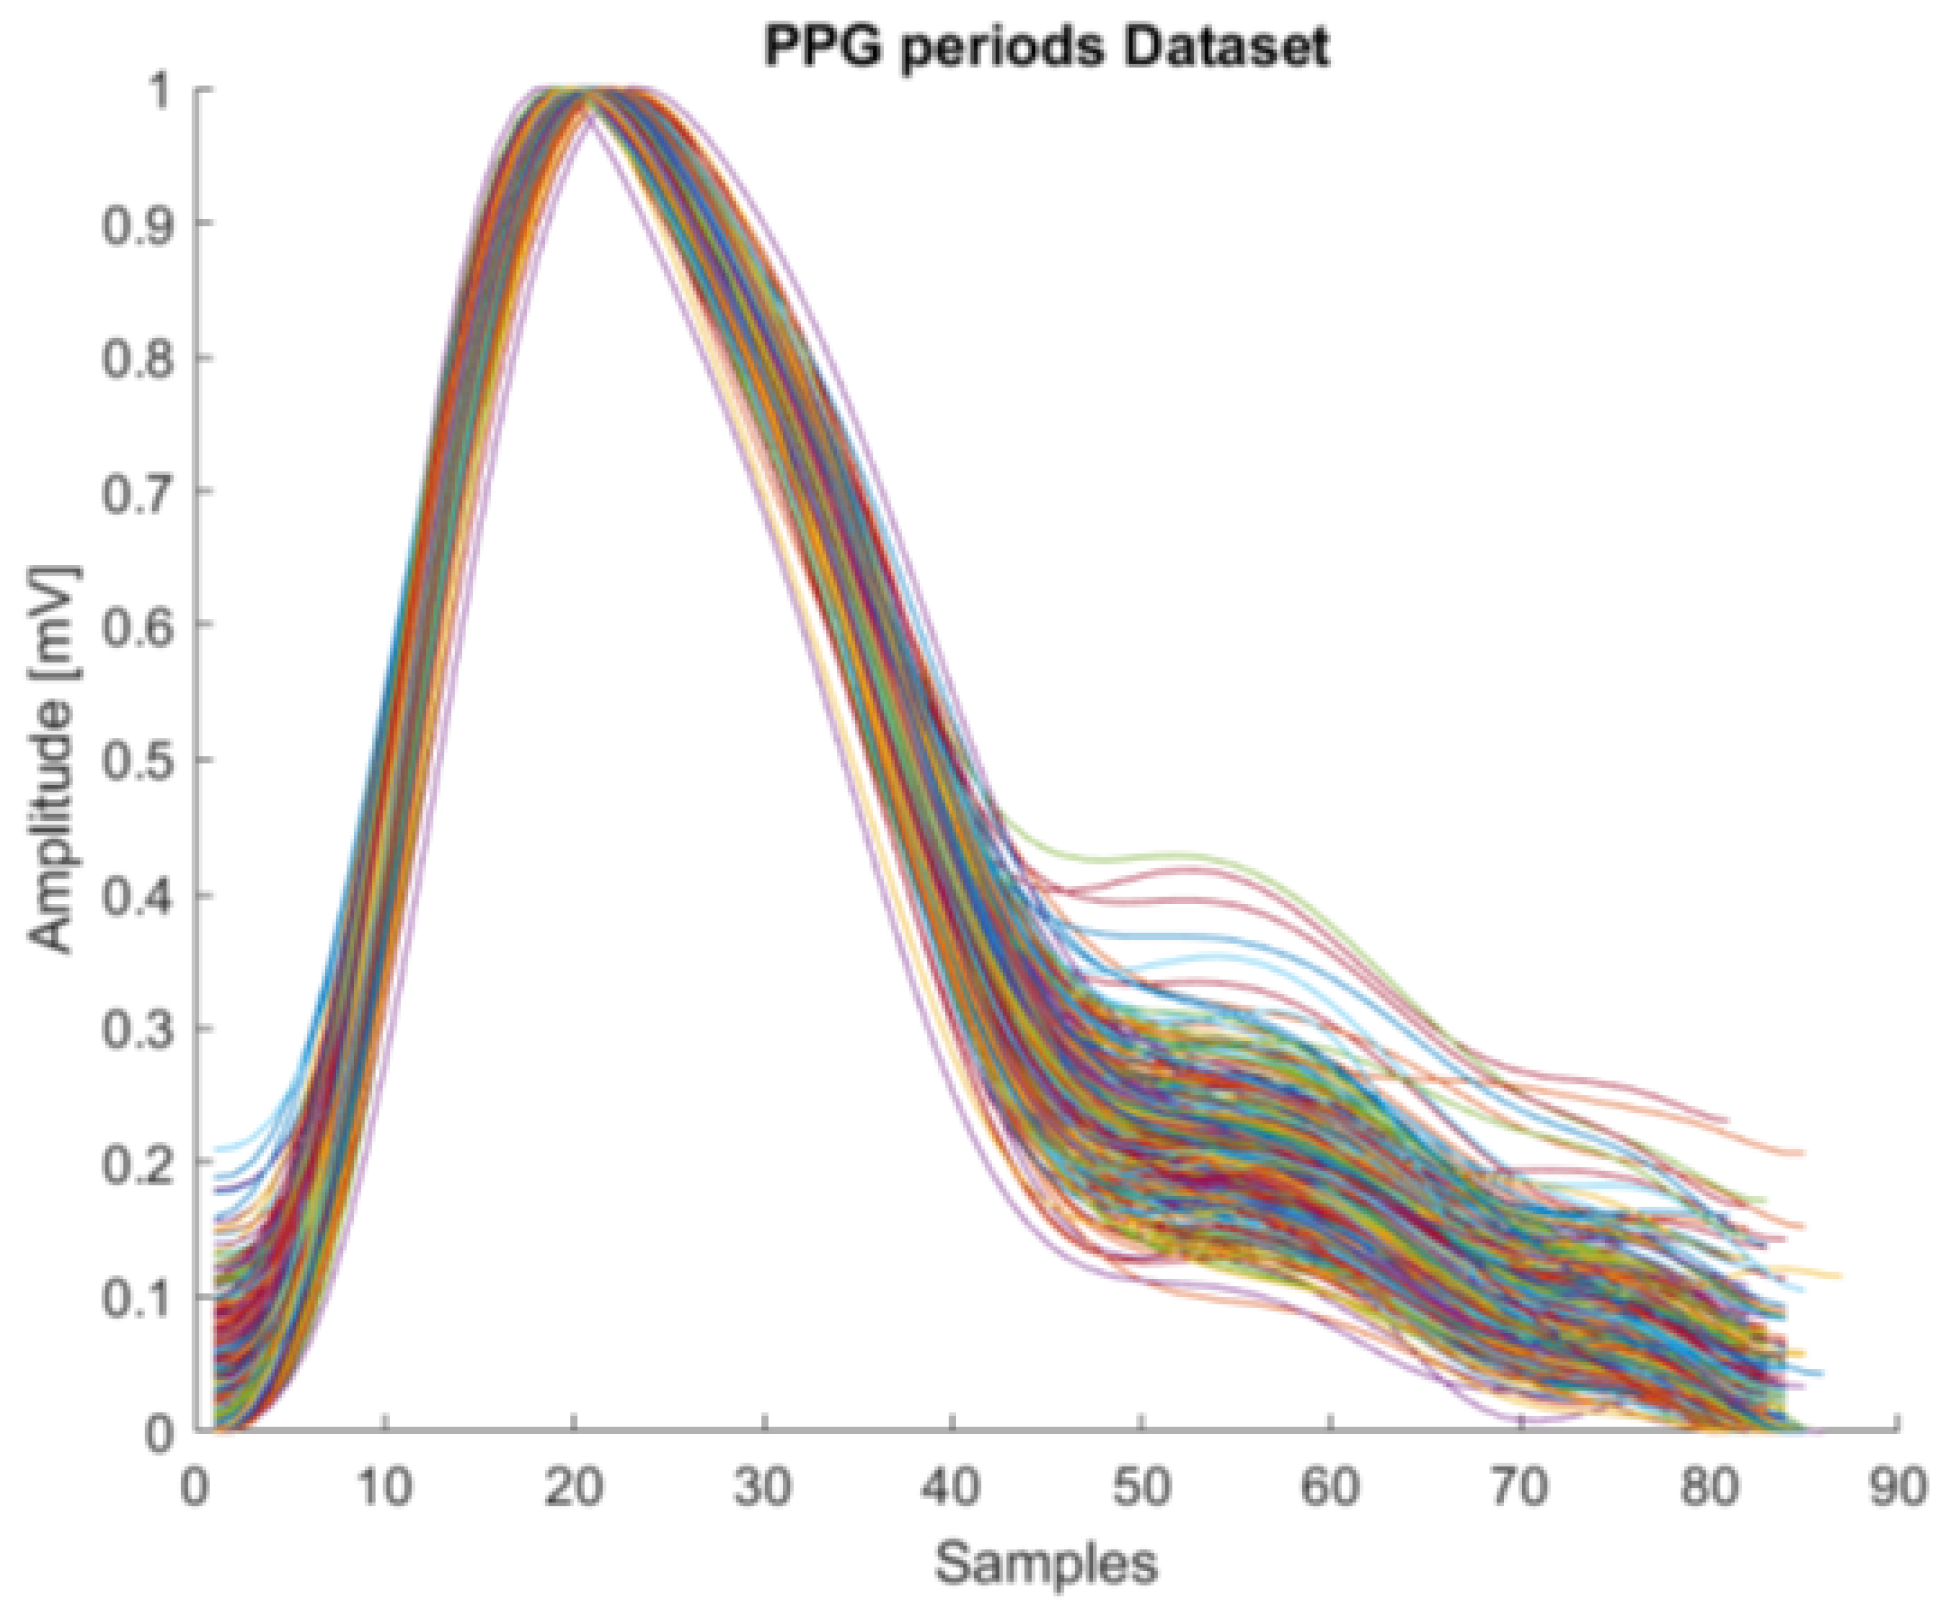
findpeaks function was used to detect SP peaks. Each SP value was associated with the corresponding PPG period. The PPG signal was pre-processed using a band-pass filter with a bandwidth of 0.5 Hz and 7 Hz (The pulse wave frequency values of the PPG signal is in the range of 0.5–4.0 Hz [
11]), and then segmented into one beat periods (
Figure 3). The final dataset is composed as follows: each row contains all the period samples (since each period is made up of a different number of samples, it has been necessary to zero-pad all the periods, so as to have one hundred samples each and to preserve all the PPG period features, for both long and short periods), and the last column elements represent the SP values.
In order to estimate the SP, we implemented an ANN regression model, layer-by-layer, with Keras. An artificial neural network, a class of machine learning algorithms, one of the application of Artificial Intelligence (AI), is a mathematical model for predicting system performance inspired by the networks of neurons in the human brain. The ANN regression model implemented in this work was intended to predict the SP numerical value. The layers are as follows:
The first layer is the input layer, composed of 100 neurons, and is equal to the number of samples of each PPG period.
Dense layers were added as hidden layers; as their name suggests, all their neurons are fully connected to those in the next layer.
The output layer consists of 1 neuron with a linear Activation Function, which directly provides the value of the weighted sum of the input.
To evaluate our NN model predictive performance, we adopted the
Mean Absolute Error (MAE), which represents the absolute value of the average error (the difference between actual and predicted value):
where
y represents the actual value,
y’ the predicted value, and
N the number of sample points (it is more intuitive, since its values are expressed in the same unit of measurement of the input, and it is less sensitive to outliers than the
Root mean squared error (RMSE)). Since the ultimate goal of this project is to embed the final regression model in a Micro-Controller Unit (MCU), in particular belonging to the
STM32L4+ family, it is necessary to evaluate its computational cost in terms of memory capacity required (
Figure 4). To do this, the
STM32CubeMX graphical tool was used.
The first dataset used in our study, the
MIMIC III one, contains periods with 80 mmHg < SP < 180 mmHg, corresponding to all the classes in the American Heart Association classification (reported in
Table 1), except hypotension.
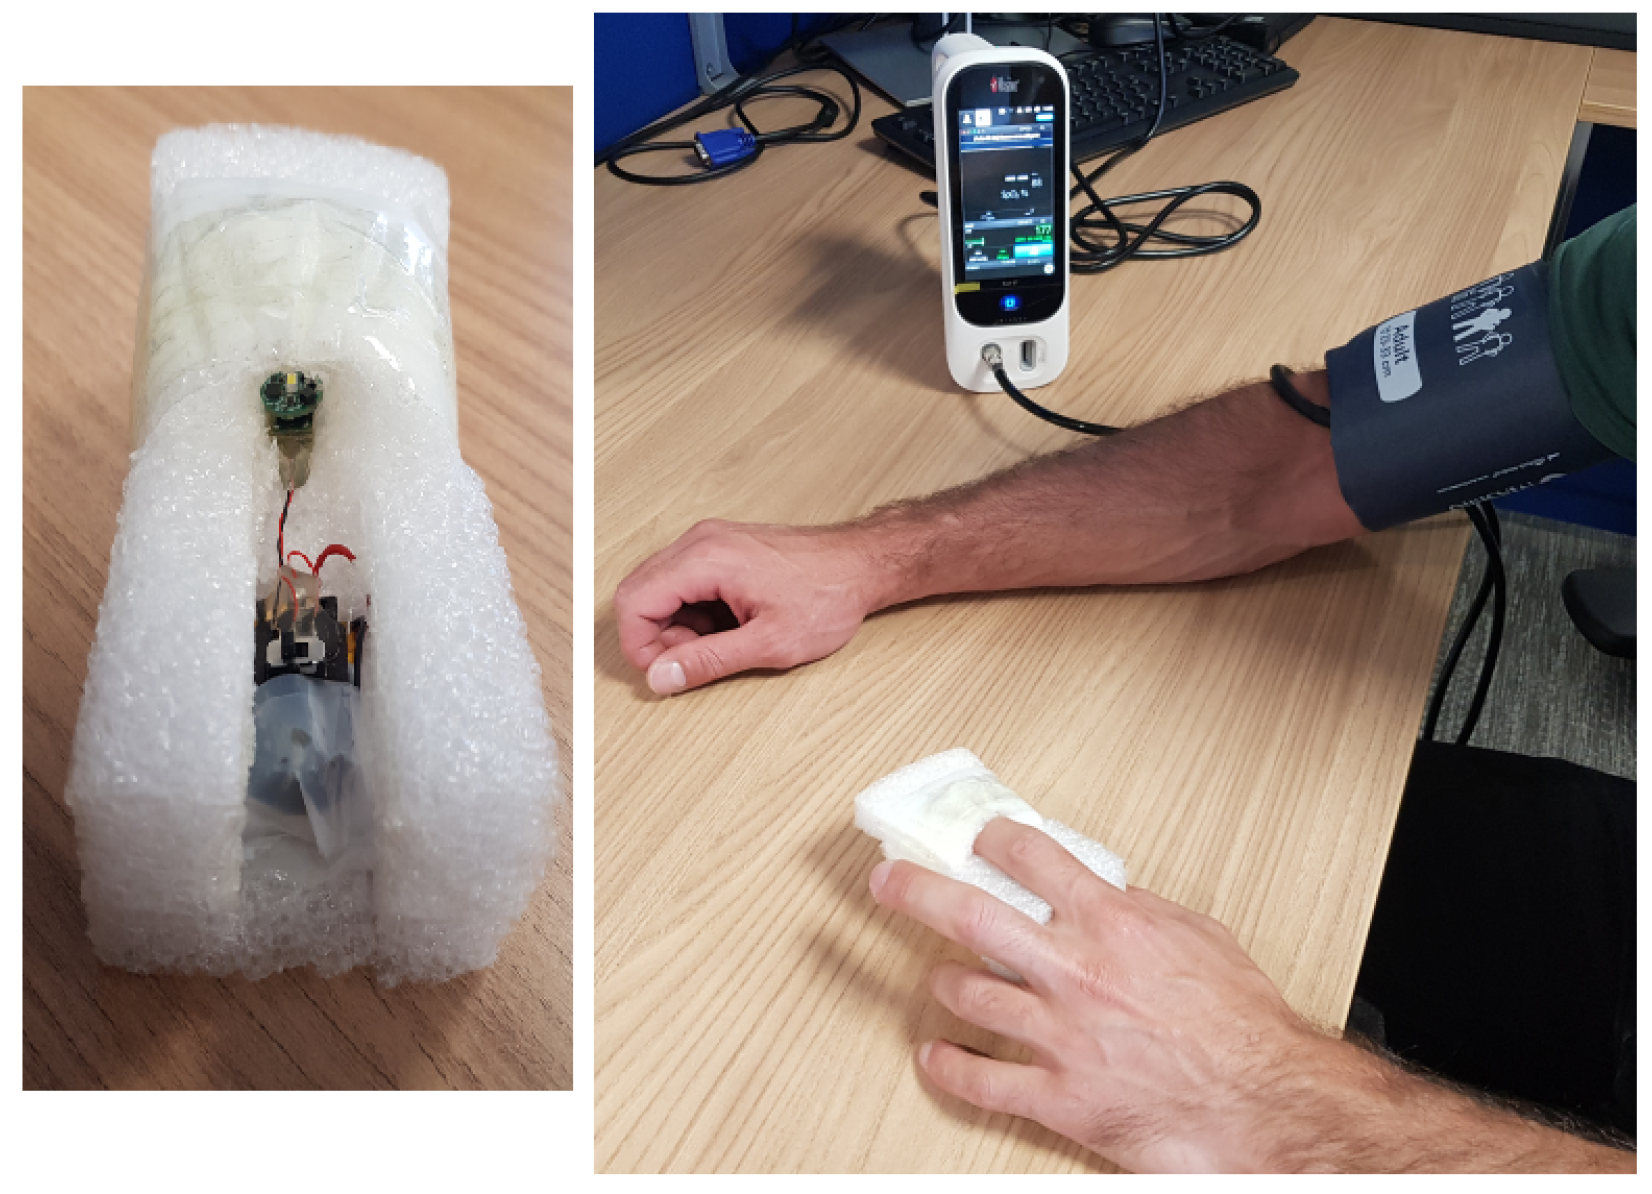
After the ANN regression model training phase using the MIMIC III dataset, PPG signal and NIBP were acquired at STMicroelectronics s.r.l. on 8 healthy subjects (5 males and 3 females), whose age ranges from 25 to 50 years old, during resting position, and the acquired data used for testing purposes (
Figure 5).
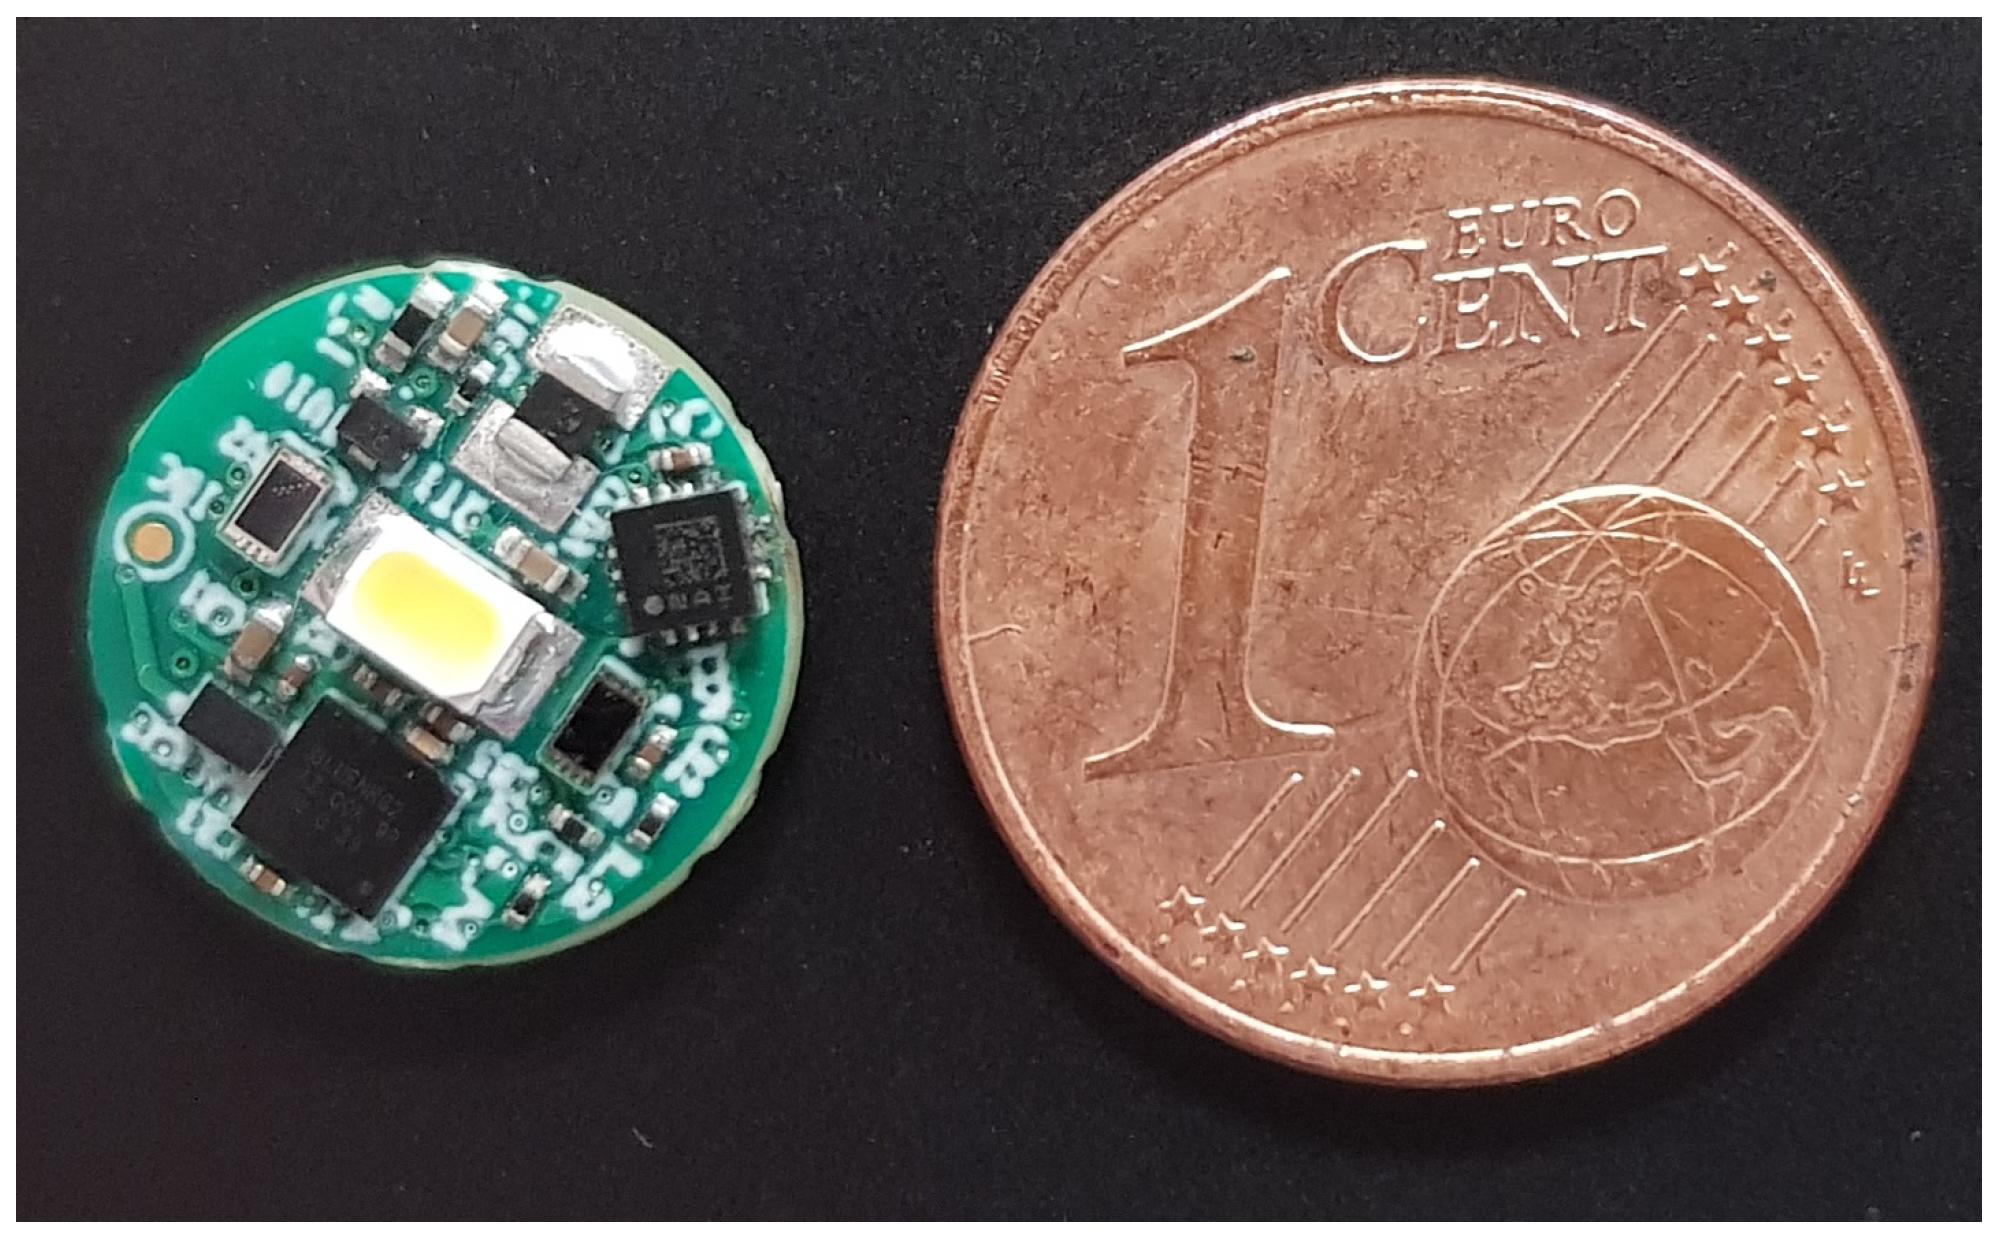
BP was measured simultaneously using a sphygmomanometer wrapped around the left arm, and noted down on an Excel file, along with the acquisition time. The PPG signal was acquired from right hand finger using MORFEA3 at a sampling frequency of 62.5 Hz. MORFEA3 uses a white LED as a white source and a spectrometer to separate the beam of white light into its components, in order to measure the green wavelength contribution. This wearable device, built with a printed circuit board (PCB), embeds a certain number of STMicroelectronics’s sensors, such as a 3-axis accelerometer, two spectrometers VD6283, and a NTC thermistor managed by a MCU.
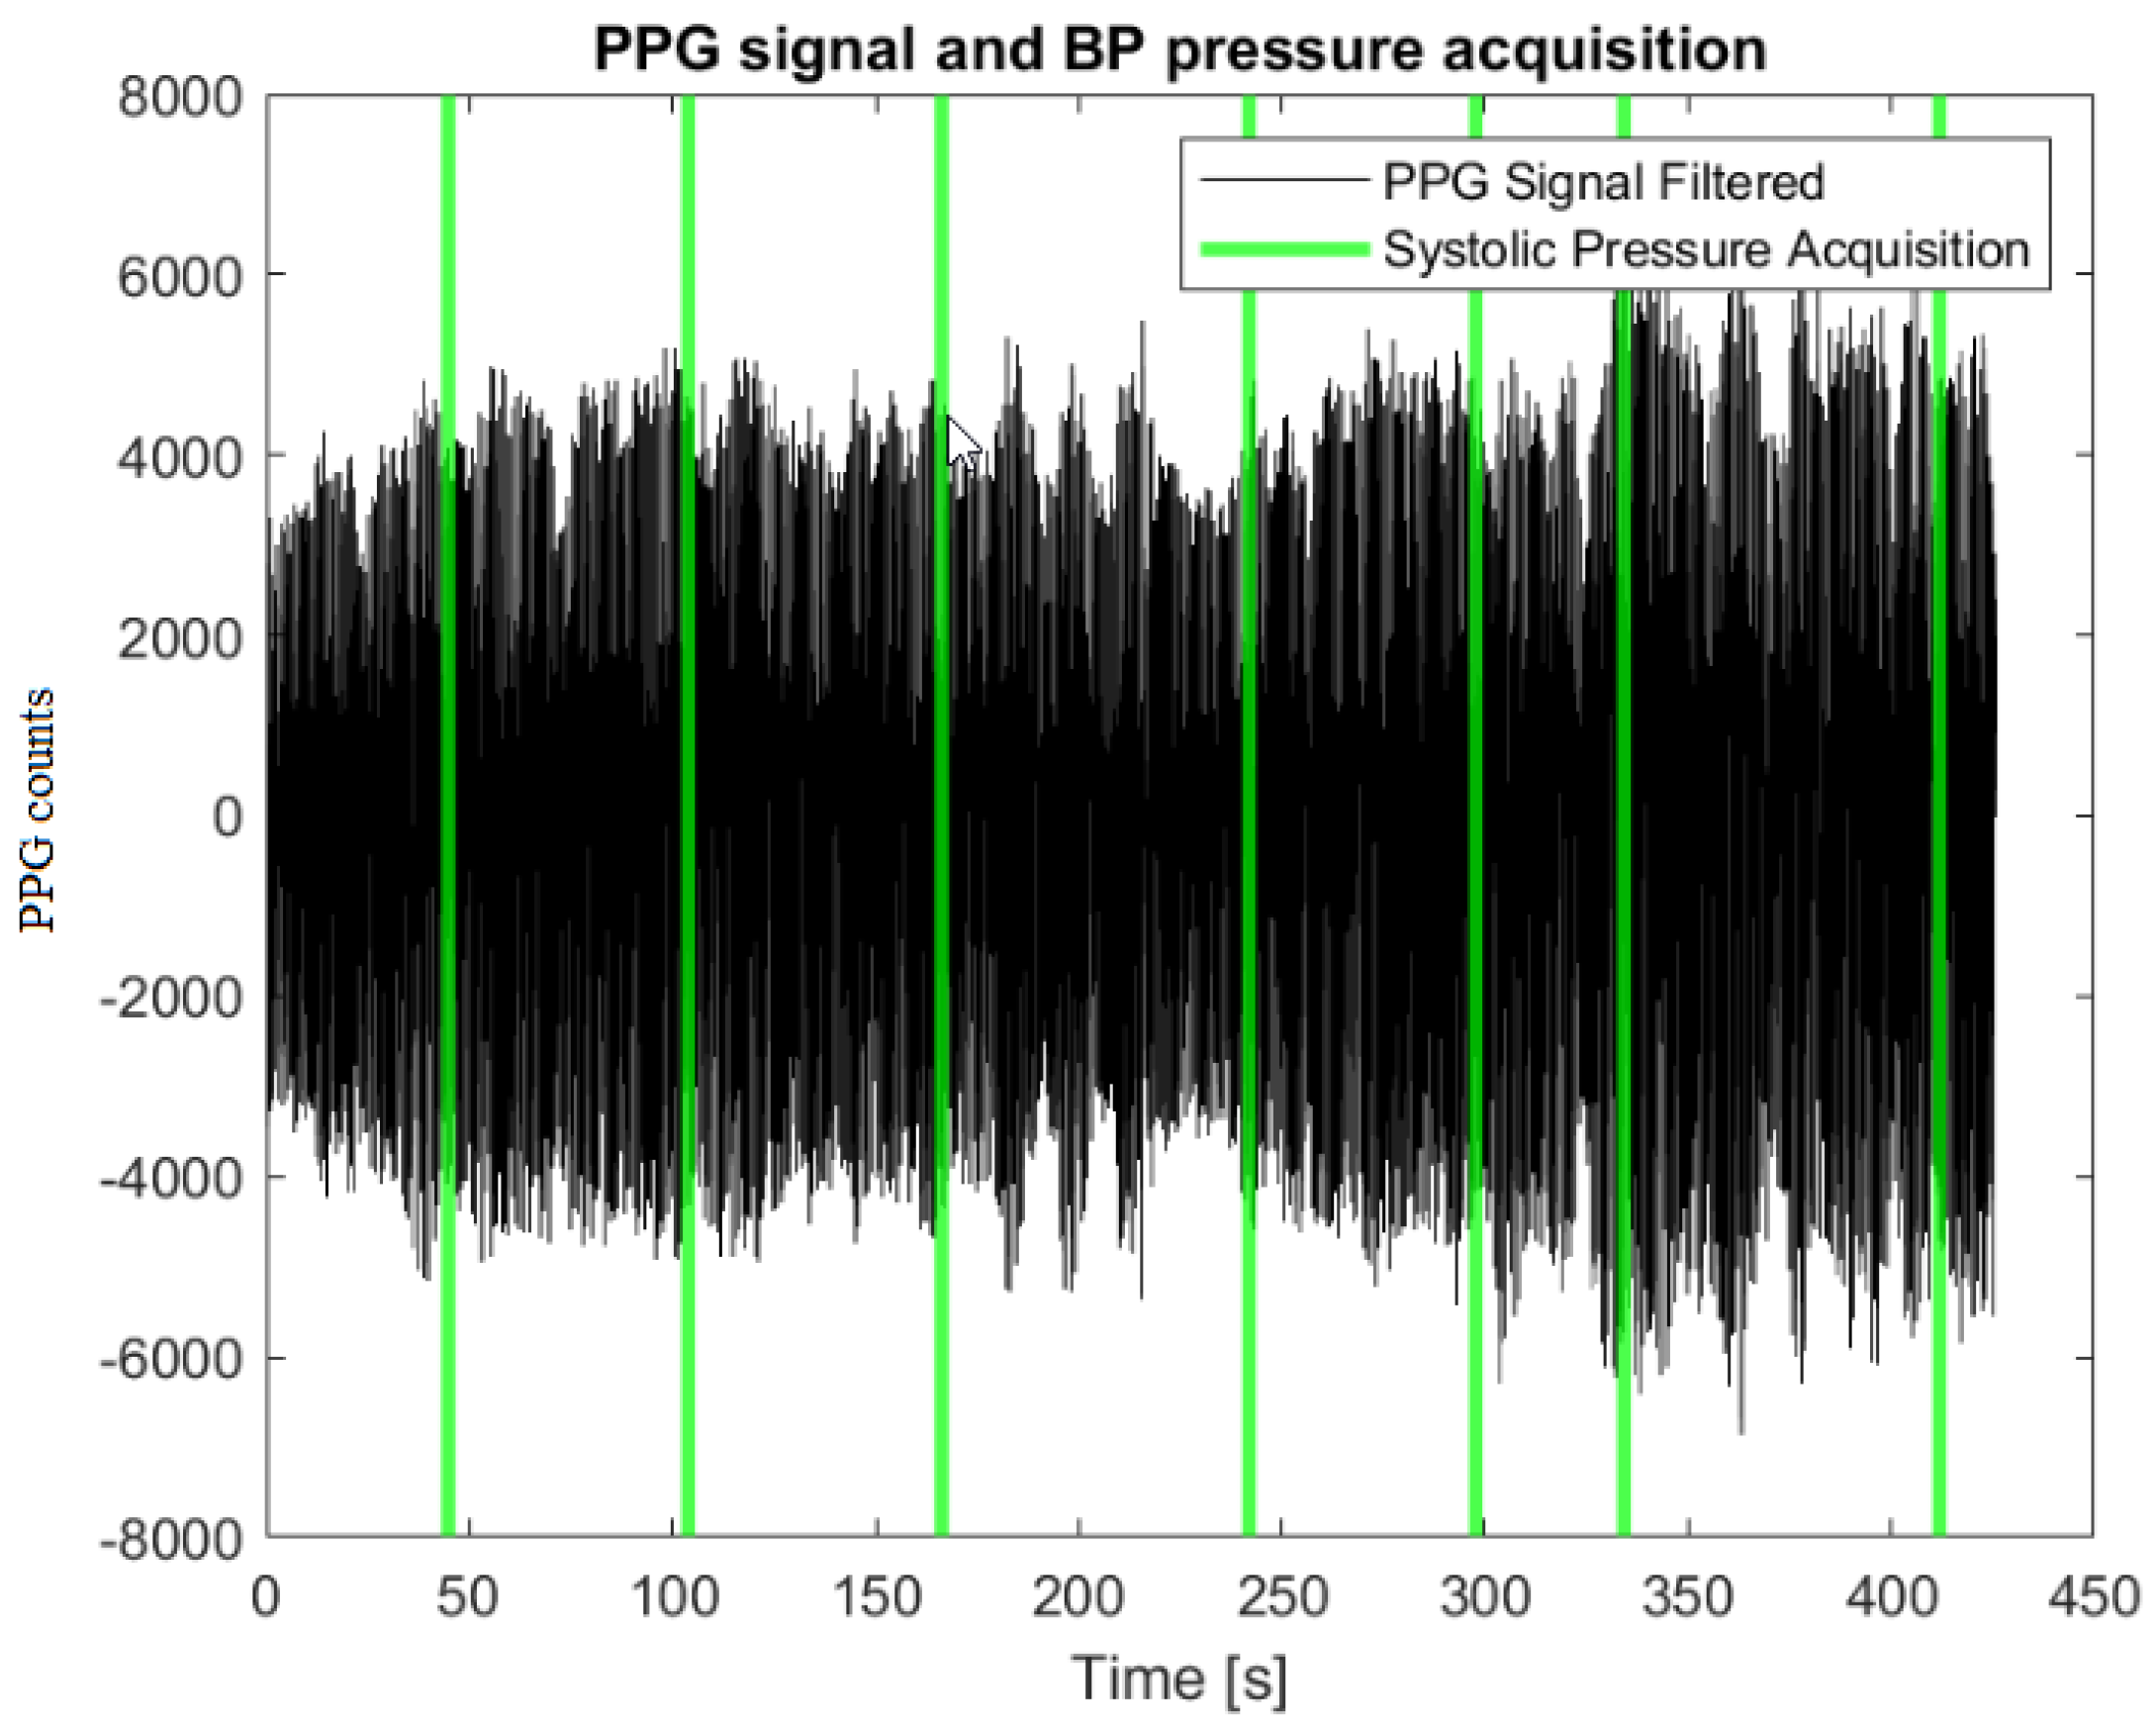
The MORFEA3 prototype interfaces with the outside world using a Bluetooth connection. To acquire the signals, it is placed within a suitable case, where it is possible to insert the right hand index fingertip, so as to keep the finger-device contact stable. After wearing the sphygmomanometer cuff, turning on the device and positioning the right hand finger inside the case, PPG signal and SP values are acquired. An example of filtered PPG signal acquired with the
MORFEA3 is represented in
Figure 6.
The signal has been filtered with the same 4th order Butterworth filter used in the MIMIC III PPG signal pre-processing. Then, in order to make the MORFEA3 PPG signal suitable for the chosen ANN model (this is because the number of input neurons of a model cannot be varied, and if we had segmented our signal without resampling, we would have obtained a shorter average length of the periods), it was resampled at 125 Hz. Once resampled, the PPG signal was segmented into periods, each associated to an SP value. This second dataset was composed of 6460 periods, with one hundred samples each, and, in the last column, the corresponding SP target. Starting from the discretization of the targets, the SP values, we realized that pathological values, such as Hypotension and Stage 1 and Stage 2 Hypertension, are not represented in our dataset. Moreover, our reference is not a continuous signal, as it was in the case of arterial pressure signal. Therefore, in order to obtain an SP value for each PPG periods, two consecutive SP records have been averaged between two acquisition instants.
In order to find the most suitable network architecture, we have made assumptions on the appropriate number of hidden layers and nodes. Our aim was to reach a good trade off between complexity and performance. First, we tried to use a basic NN model, so as to increase the number of hidden nodes in every step, until the best performance was reached. The first model used was inspired by [
12] and is represented in
Figure 7. The other hyperparameters are: learning rate equal to 0.007, sigmoid as Activation Function, Adam as optimization algorithm, glorot uniform as initialization mode, Dropout rate equal to 0.2, batch size equal to 512, and number of epochs equal to 500.
To improve the model performance we started increasing the number of hidden layers. Starting from the simplest model, up to the analysis of more complex models, the performance over the MIMIC III test set improves, and then decreases, probably due to the overfitting phenomenon. Once the network architecture with the best generalization properties was identified, the model hyperparameters were tuned using the Grid-Search method (Grid-Search is a method used to find the optimal hyperparameters of a model which results in the most ‘accurate’ predictions) and the model performance over the test set was evaluated, with the purpose of finding the optimal combination of hyperparameters.
4. Results
For the purpose of this study, several NN architectures have been tested and various hyperparameters have been manipulated to compare the model outcome. The best hyperparameters combination, to obtain the best performance in terms of MAE, on the MIMIC III test set, is reported below:
Architecture: [100 80 100 60];
Activation Function: Softsign;
Optimization Algorithm: Stochastic gradient descent (SGD);
Initialization Mode: glorot uniform;
Learning Rate: 0.007;
Dropout: 0.2;
Batch Size: 1024.
Once the most suitable network architecture and hyperparameters are selected, the regression model performance is evaluated over the MIMIC III test set and over our everyday-life MORFEA3 data set. The regression model performance obtained on the
MIMIC III test set is presented in
Table 2, and compared with the results obtained in [
4], using an ANN with 21 input parameters, and with the results in [
9], achieved using the hyperparameter tuned Ensemble of regression trees algorithm with RReliefF selected subset of features.
As mentioned before, in our everyday-life dataset, SP values in the range of Hypotension, Stage 1 Hypertension, and Stage 2 Hypertension have been not represented so it has been difficult to evaluate the regression model performance on the pathological classes. However, the performance obtained over the
MORFEA3 dataset was satisfactory and is reported in
Table 3, and compared to the results obtained on the everyday life dataset collected at JSI in [
9].
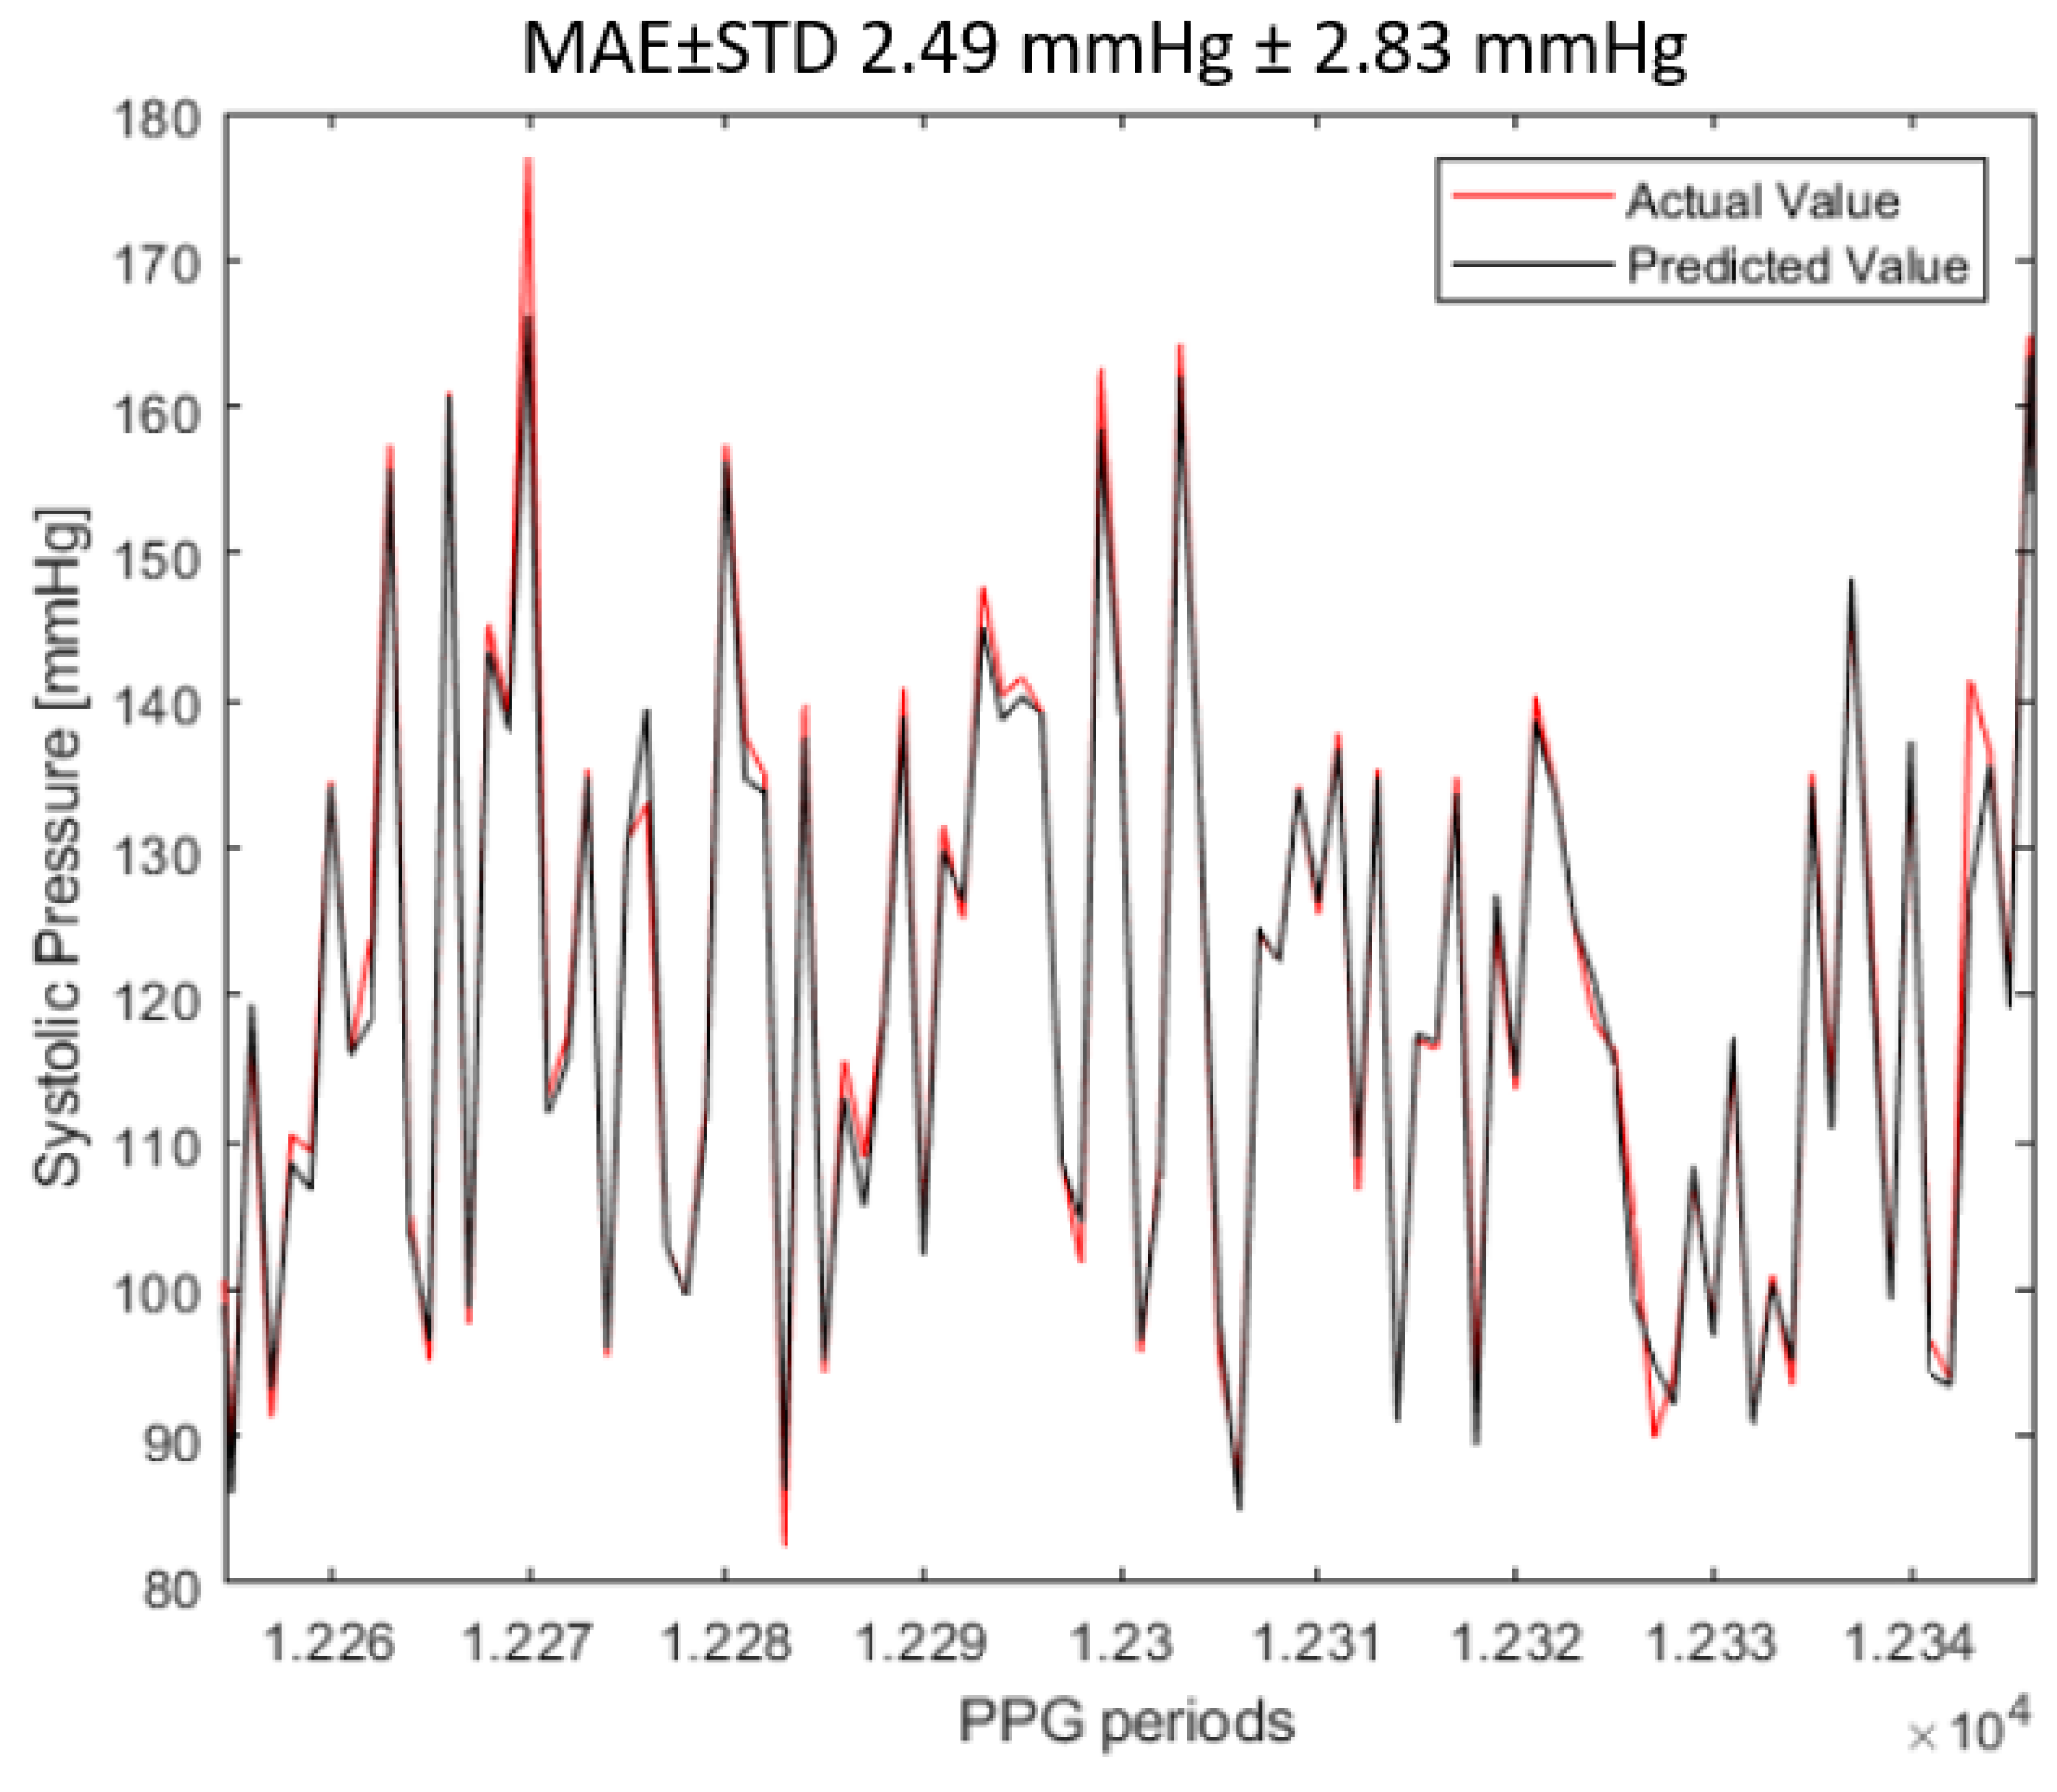
Figure 8 and
Figure 9 show, respectively, the real SP values and the regression model predicted SP values on the
MIMIC III test set and on the
MORFEA3 dataset. The predicted values referred to the values coming from the sphygmomanometer, which are, obviously, not continuous; however, we represented the values in a continuous manner (
Figure 8 and
Figure 9), connecting the different estimation, because of simplicity.
The results obtained with the regression model presented in
Table 2, are shown more in detail below (
Table 4):
- -
MIMIC III Test set consisting of 74,902 PPG periods.
83.48% of SP values were predicted with an absolute error lower than 5 mmHg;
96.34% were predicted with an absolute error lower than 10 mmHg;
98.88% were predicted with an absolute error lower than 15 mmHg.
- -
MORFEA3 dataset consisting of 6460 instances.
74.58% of SP values were predicted with an absolute error lower than 5 mmHg;
90.55% were predicted with an absolute error lower than 10 mmHg;
97.27% were predicted with an absolute error lower than 15 mmHg.
Table 4.
Percentage of absolute difference between actual and predicted SP values (mmHg).
Table 4.
Percentage of absolute difference between actual and predicted SP values (mmHg).
| | Error < 5 mmHg | Error < 10 mmHg | Error < 15 mmHg |
|---|
| MIMIC III Test set | 83.48% | 96.34% | 98.88% |
| MORFEA3 Dataset | 74.58% | 90.55% | 97.27% |
These are very promising results because the obtained prediction errors are compatible with most clinical applications.
5. Conclusions
In recent decades, there has been a strong development in Telemedicine and in wearable systems. These allow continuous patients remote monitoring, without impairing the patient’s freedom of movement, and communication at distance between patient and medical staff. In particular, our study aims the continuous monitoring of blood pressure, which is highly desirable in hypertension patients, since high blood pressure is considered as the main cause of CVDs, as well as in the prevention of the risk of dementia and in autonomic nervous system monitoring in most neurodegenerative diseases [
13]. In the literature, photoplethysmography is considered a promising candidate for non-invasive and continuous BP monitoring [
14].
In this project, the
MORFEA3 device was used to acquire, among others (accelerometric and temperature signals), the PPG signal in order to provide a real-time SP estimation, using an Artificial Neural Network. The regression model, with one hundred input neurons and one output neuron, has yielded stable results; it allows to evaluate the difference between actual SP values and predicted SP values. The results obtained on the
MORFEA3 dataset, in terms of MAE (3.85 mmHg ≤ 4.29 mmHg), satisfy the Association for the Advancement of Medical Instrumentation (MAE ≤5 mmHg with SD ≤ 8 mmHg for SP and DP) (AAMI) and the British Hypertension Society (BHS) standards (absolute difference between standard and test device ≤5 mmHg in the 60% of the readings, ≤10 mmHg in the 85% of the readings and ≤15 mmHg in the 95% of the readings) [
15], as evidenced in Section IV, in
Table 2 and in
Table 4.
Although very promising, this work must be considered preliminary as it is affected by some limitations; in the AAMI and BHS protocols for General Population studies (they should include 85 subjects over 12 years; ≥30% males and ≥30% females and shall have ≥5% of SP values ≤100 mmHg, ≥5% with ≥160 mmHg, and ≥20% with ≥140 mmHg), 85 subjects are required, whereas in our work only 8 subjects have been tested. Additionally, we can state that our model turns out to be valid only for finger acquisition, since trying to estimate SP from wrist PPG signal, the model performance impairs. For this reason, it may be necessary to build another training set composed only of wrist PPG periods.


