Article

Towards Low-Cost Classification for Novel Fine-Grained Datasets

1
Department of Computer Science, Abdul Wali Khan University Mardan (AWKUM), Rashid Hussain Shaheed Campus Pabbi, Pabbi 24210, Pakistan
2
Department of Electrical and Computer Engineering, COMSATS University Islamabad, Attock Campus, Attock 43260, Pakistan
3
College of Engineering and Computer Science (CECS), The Australian National University (ANU), Canberra, ACT 2601, Australia
4
Data61, The Commonwealth Scientific and Industrial Research Organisation (CSIRO), Canberra, ACT 2601, Australia
5
Faculty of Science and Technology (FCT), University of Canberra (UC), 11 Kirinari St., Canberra, ACT 2617, Australia
6
School of Computer Science (SCS), University of Technology Sydney (UTS), 15 Broadway, Sydney, NSW 2007, Australia
*
Author to whom correspondence should be addressed.
These authors contributed equally to this work.
Electronics 2022, 11(17), 2701; https://doi.org/10.3390/electronics11172701
Submission received: 8 July 2022 / Revised: 18 August 2022 / Accepted: 19 August 2022 / Published: 29 August 2022
(This article belongs to the Special Issue Convolutional Neural Networks and Vision Applications, Volume II)

Abstract

:
Fine-grained categorization is an essential field in classification, a subfield of object recognition that aims to differentiate subordinate classes. Fine-grained image classification concentrates on distinguishing between similar, hard-to-differentiate types or species, for example, flowers, birds, or specific animals such as dogs or cats, and identifying airplane makes or models. An important step towards fine-grained classification is the acquisition of datasets and baselines; hence, we propose a holistic system and two novel datasets, including reef fish and butterflies, for fine-grained classification. The butterflies and fish can be imaged at various locations in the image plane; thus, causing image variations due to translation, rotation, and deformation in multiple directions can induce variations, and depending on the image acquisition device’s position, scales can be different. We evaluate the traditional algorithms based on quantized rotation and scale-invariant local image features and the convolutional neural networks (CNN) using their pre-trained models to extract features. The comprehensive evaluation shows that the CNN features calculated using the pre-trained models outperform the rest of the image representations. The proposed system can prove instrumental for various purposes, such as education, conservation, and scientific research. The codes, models, and dataset are publicly available.

1. Introduction

The remarkable progress of computer vision techniques has solved many challenging problems in computer science and other domains. Biodiversity is one such domain that can benefit from computer vision methods to solve complicated and time-consuming problems. One such complex issue is the classification of animal and plant species, done mainly by DNA matching [1]. However, in this process, precious specimens of animals and plants collected and preserved by spending an enormous amount of human labor and wealth have to be consumed. In order to avoid manual labor, the visual cues on the mentioned animals’ bodies, such as colors and patterns, can be utilized to support species classification. The bodies of butterflies and reef fish are the canvases of nature that depict extraordinary combinations of colorful blobs and patterns, serving as visual cues to distinguish these animal species from one another. This paper utilizes these visual cues to develop image representations or embeddings to support the image-based classification of butterflies and reef fish species.
The wings of butterflies depict symmetry developed by color patterns and blobs, as shown in Figure 1. The symmetrical patterns are instrumental in distinguishing the butterfly species from one another. However, thousands of butterfly species are categorized under 126 different families [2]. Due to such a massive number, classifying a given specimen into one of the existing species becomes complicated and requires expert-level knowledge. Consequently, such a tedious task becomes time-consuming because it linearly increases with the number of animal species. Such a labor-intensive job can be supported and expedited by an image-based species classification framework that uses the visual information of the colors and patterns on the butterfly wings.
Likewise, hundreds of reef fish species [3] are found worldwide in the oceans. The reefs have a significant impact on their behavior and living style. These reefs are also the sources of their food and shelter. However, water pollution caused by the extensive use of pesticides, industrial wastes, and pharmaceuticals constantly threatens these reefs’ ecosystems. Such contaminants cause behavioral changes in the reef fish [4] which, if detected, will provide critical information for their timely protection. To this end, an image-based classification framework can provide a strong base for the reef fish’s image-based behavior monitoring system. Such expert systems can also be used in numerous application disciplines such as entertainment (e.g., aquariums) and education (e.g., in schools). Figure 2 shows the most common and challenging image variations found in butterflies and reef fish images. For instance, in-plane orientation differences between the butterflies and reef fish cause variations among the same species’ pictures. Such variations are negligible among images of other animals such as horses [5] and cows [6] as compared to the butterflies and reef fish images. Similarly, both the species are imaged with a cluttered background caused by objects and other animals in their respective habitats. Changes in object scale and translation also cause variations in images due to their relative position concerning the imaging device. Therefore, we aim to select an image representation that performs well in the face of such variations and supports the image-based species classification system for butterflies and reef fish.

2. Related Work

The fine-grained classification techniques related to this work are discussed in this section. Lazebnik et al. [7] were the first to explicitly evaluate their proposed method on butterfly images employing a parts-based object model based on local region descriptions invariant to scale changes and affine transformations. Rotation-invariant local descriptors detect and represent the local affine regions. Afterward, region matching is performed on several image pairs to generate the candidate parts, followed by a validation step based on the candidates’ geometric consistency to reject the invalid matches. However, such a weakly supervised method suffers from the computational complexity of deriving similar image regions’ spatial relations, especially in butterfly images where the object of interest is imaged amid severe background clutter. Another well-known work introduced the Leeds butterflies dataset [8], where the primary motivation is to avoid the usage of large training sets in the conventional approach with machine learning algorithms. Consequently, the authors suggest employing a generative model to learn object categories from the textual descriptions, which are then connected with the butterflies’ visual attributes, such as blobs and color features; however, their method involves Natural Language Processing (NLP), which can be avoided using feature matching methods specifically proposed for fine-grained classification that face a lack of training data [9]. Nonetheless, these two datasets have been used in the literature for the evaluation of various problems, such as fine-grained classification [10], co-classification [11], and invariant image classification [12].
More recently, state-of-the art CNN architectures have been utilized for the image-based classification of butterfly species. For instance, Faster R-CNN [13] is used to classify images of 111 species [14]. Similarly, VGGNet [15] and ResNet [16] are evaluated for the recognition of 10 butterfly species [17]. A skip connection-based CNN architecture is used for the fine-grained classification of butterfly images that belong to 56 subspecies [18], while ResNet is used for the fine-grained classification of 86 butterflies species [19]. Other CNN-based methods include the use of VGGNet and Alexnet [20]; ResNet, Inception-v3, and VGG [21]; and Squeeze-and-excitation networks [22].
Fish4Knowledge is the largest repository of reef video clips. It consists of 700,000 clips, each spanning 10 min. The repository establishment is motivated by the conservation, protection, and scientific study of the marine life found in coral reefs. These video clips are from the Taiwanese reef, as it is one of the most diverse reefs in the world, accommodating 3000 fish species (Available online: http://fishdb.sinica.edu.tw/ (accessed on 18 August 2022)). The FishCLEF [23] dataset is derived from this repository and has been publicly available as a part of the ImageCLEF competition since 2014. It consists of 4000 video clips, with several thousand detected reef fish from 10 species. Huang et al. [24] perform fish classification on 24,150 images, 15 species extracted from the Fish4Knowledge repositorywith a hierarchical tree, where the reject function is integrated with the Balance-Guaranteed Optimized Tree (BGOT) to avoid increasing depth errors. However, the pre-processing of the fish images aligns the fish orientations to improve the recognition rate, which requires time and effort for such a large number of images. The CNN-based methods are also proposed for image-based fish classification, such as using AlexNet and VGGNet [25], GoogleNet [26], and modified Alexnet [27]. The image is sampled more densely on image regions with more fine-grained details and where there are differences between species [28]. Consequently, the CNN/classifier achieves better recognition performance on those parts of the image that are important for the species and thus the classification process. Fine-grained image classification can be performed via approaches such as that of Beuth et al. [29], which zooms into an image to find details that are relevant for distinguishing the divergent classes. The approach utilizes visual attention, and by this processing, it zooms in and extracts a region of interest. A subsequent CNN can then process this region of interest with much higher resolution. Thus, more qualitative image content is fed into the CNN. The authors show a decrease in error rate via their system by a factor of 2.3. This work deploys the model proposed by Beuth [30].
As mentioned earlier, the butterfly and reef fish images face the same variations. The tasks of their image-based classification become identical. While most of the previous works aim at either butterfly classification or reef fish classification, there exists only a single publication [31] that jointly performs both tasks. They use images of 30 species [31] of butterflies and reef fish. As mentioned earlier, the main focus is developing an image representation invariant to the image, with variations locally and globally. The scale and rotation-invariant features (SIFT) are used to achieve local invariance. The positions of identical local features are then triangulated. The angles produced by such triangulation are aggregated in an angles histogram to build a global image representation. As the angles of a triangle are invariant to triangle position changes, scale, and orientation, their proposed image representation is scale, translation, and rotation-invariant. Therefore, such image representation becomes a natural choice for the image-based species classification of butterflies and reef fish. Nonetheless, we extend their work in the following directions.
  • In addition to the four traditional-based image representations, we evaluate 21 CNN-based image representations that use the pre-trained models and are the most comprehensive evaluation of CNN-based image representations on the datasets of butterflies and reef fish on two different data settings in a single publication to the best of our knowledge.
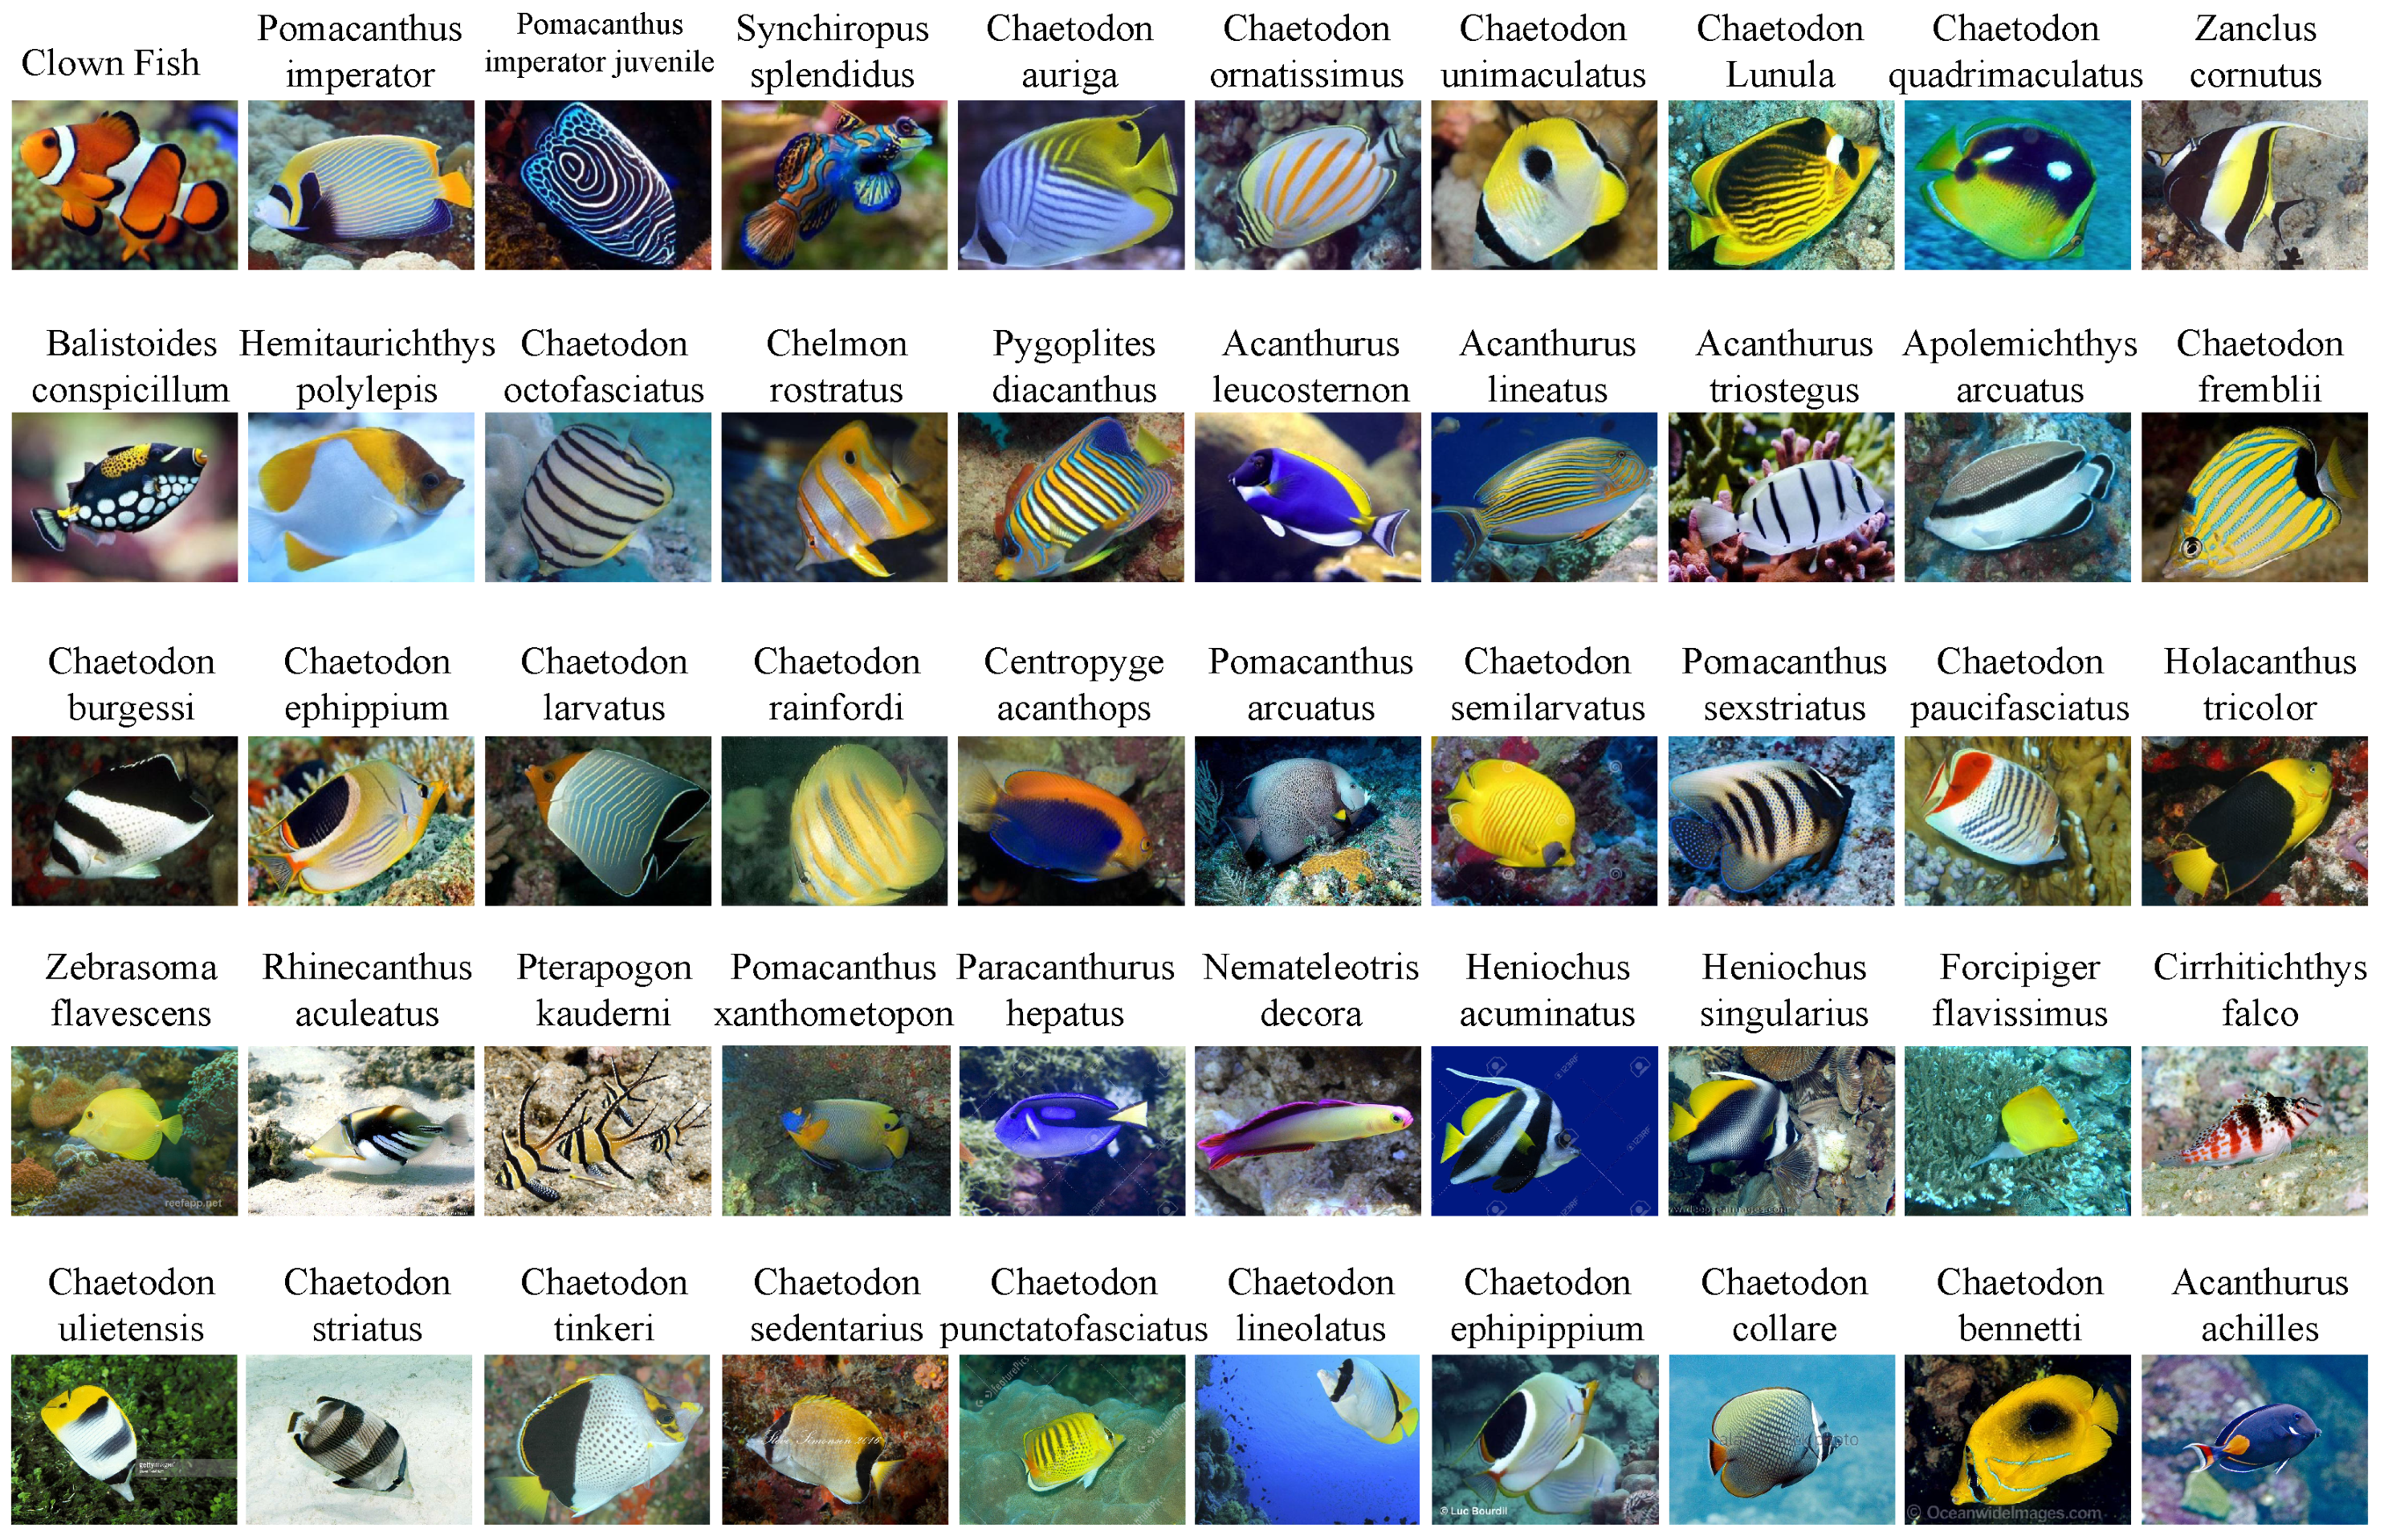
  • Similarly, the reef fish image dataset collected from the internet and used in this work is also the most diverse dataset to date, containing images of 50 species, most of which are obtained in their natural habitat.
It should be noted here that the FishCLEF [23] dataset has 10 species while Huang et al. [24] use the images of 15 species. Moreover, Fish4Knowledge is doubtlessly the most diverse image repository of reef fish. However, the cameras mounted in the reef taking images and videos suffer from imaging problems such as uneven illumination and occlusions.
The rest of the article is arranged as follows. Section 3 provides an overview of the datasets. Section 4 details the image representation used for the specie-based image classification. Results are reported in Section 5, and the conclusions and future directions of the current research are outlined in Section 6.

3. Datasets

This section explains the process of collecting images for both datasets with their statistics.

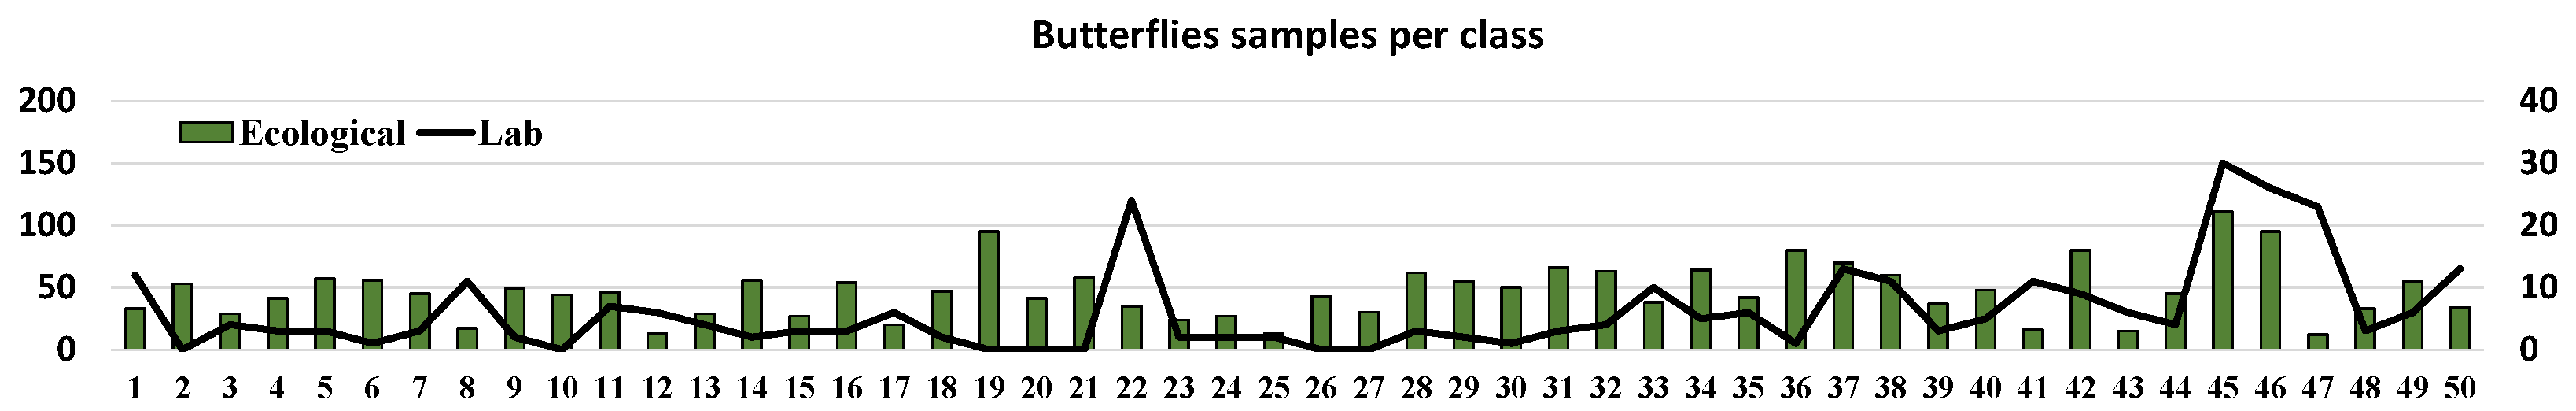
3.1. Butterflies Dataset

We selected 50 butterfly species, among which 30 are from Anwar et al. [31]. The Google image search was used to obtain images of butterfly species. For this purpose, the commonly used names, as well as biological names, were utilized. For instance, the biological name of “Painted Lady” is “Vanessa cardui”. These names were used in the Google image search to obtain the images. An inspection was then carried out on the retrieved images to ensure that the butterfly of interest was depicted. The butterfly dataset consists of 2613 images, most of which are ecological. Figure 3 shows the exemplar images of the butterfly species cropped to show the butterfly of interest. In contrast, Figure 4 shows the number of images per class, both ecological and lab specimens.

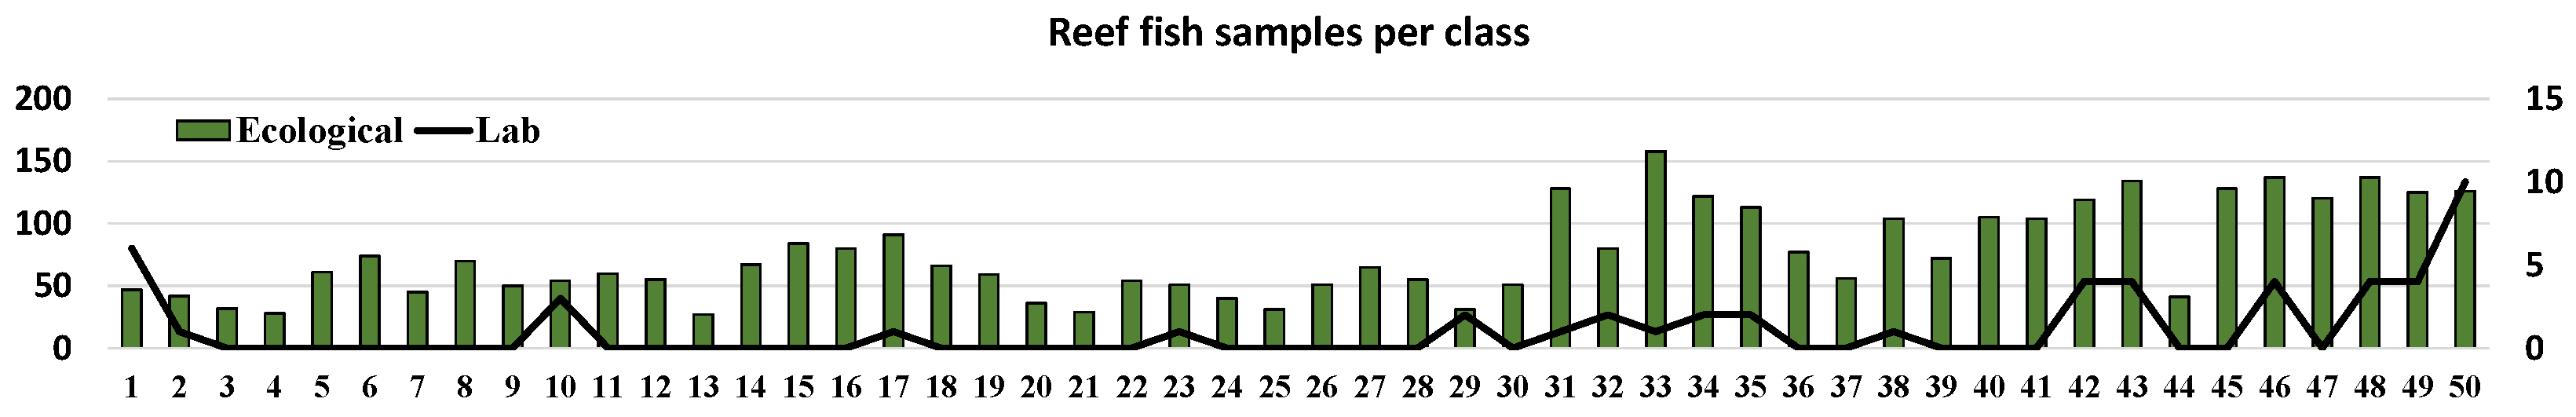
3.2. ReefFish Dataset

For our current work, we use 50 reef fish species, among which 30 are those used in the experiments of Anwar et al. [31]. We named our dataset ReefFish. Here, we also used a Google image search to obtain the reef fish images, which were then inspected to select those depicting the fish of interest. Similarly, biological and commonly used names were employed in the searching process. For instance, the biological name of the “Teardrop butterfly fish” is “Chaetodon unimaculatus”. Of the total of 3825 images in the reef fish dataset, most are ecological. Figure 5 shows the exemplar images of the reef fish species.
In contrast, Figure 6 shows the count of images per class, both ecological and lab specimens. Our primary goal is to deal with image variations frequently found in butterflies and reef fish images. These include image variation caused by object scale changes, position and in-plane orientation, and background clutter.
Thus, we gathered only those images from internet image searches that suffer from these variations. Photos of other repositories, such as Fish4Knowledge, are taken from image acquisition devices mounted on the reef. Due to this reason, they suffer from additional problems such as uneven illumination and occlusions.

4. Methodology

We proposed using two types of image representations for image-based butterflies’ tasks and reef fish species classification. First is the BoVWs image representation built on top of the handcrafted local invariant features. In contrast, the second is calculated using various pre-trained models. The details of both the image representations are given in the following.

4.1. Traditional Algorithms

In case of traditional algorithms, the image representation is conducted with the famous bag-of-visual words (BoVWs) model, which consists of the following two main steps.
  • Visual Vocabulary Construction: In the BoVWs model, features are collected from a set of images and quantized using a clustering strategy such as the k-means to form the visual vocabulary. Since the value of k defined the number of the clusters, the visual vocabulary voc = v 1 , v 2 , v 3 , , v M consists of k or M visual words.
  • Image representation: An image consists of image patches, and these patches are represented by local descriptors such SIFT; the given image is first represented as a set of descriptors
    I = d 1 , d 2 , d 3 , , d N
    where N is the total number of descriptors. A visual word v i from the vocabulary is then assigned to any given descriptor d k using a similarity measure such as the Euclidean distance as follows:
    v d k = arg min v voc   Dist v , d k
    where d k is the kth descriptor in the image and v d k is the visual word assigned to this descriptor based on the distance Dist v , d k . In the given image, all the descriptors are mapped to the visual words. The frequency of these visual words is then aggregated in a histogram where the number of bins in this histogram is equal to the size of the visual vocabulary, that is, M. Such a histogram-based representation of the image is called the bag-of-visual-words (BoVWs).
However, this image representation must be least affected by the variations found in their images for butterflies and reef fish species classification. This is achieved in the following manner.

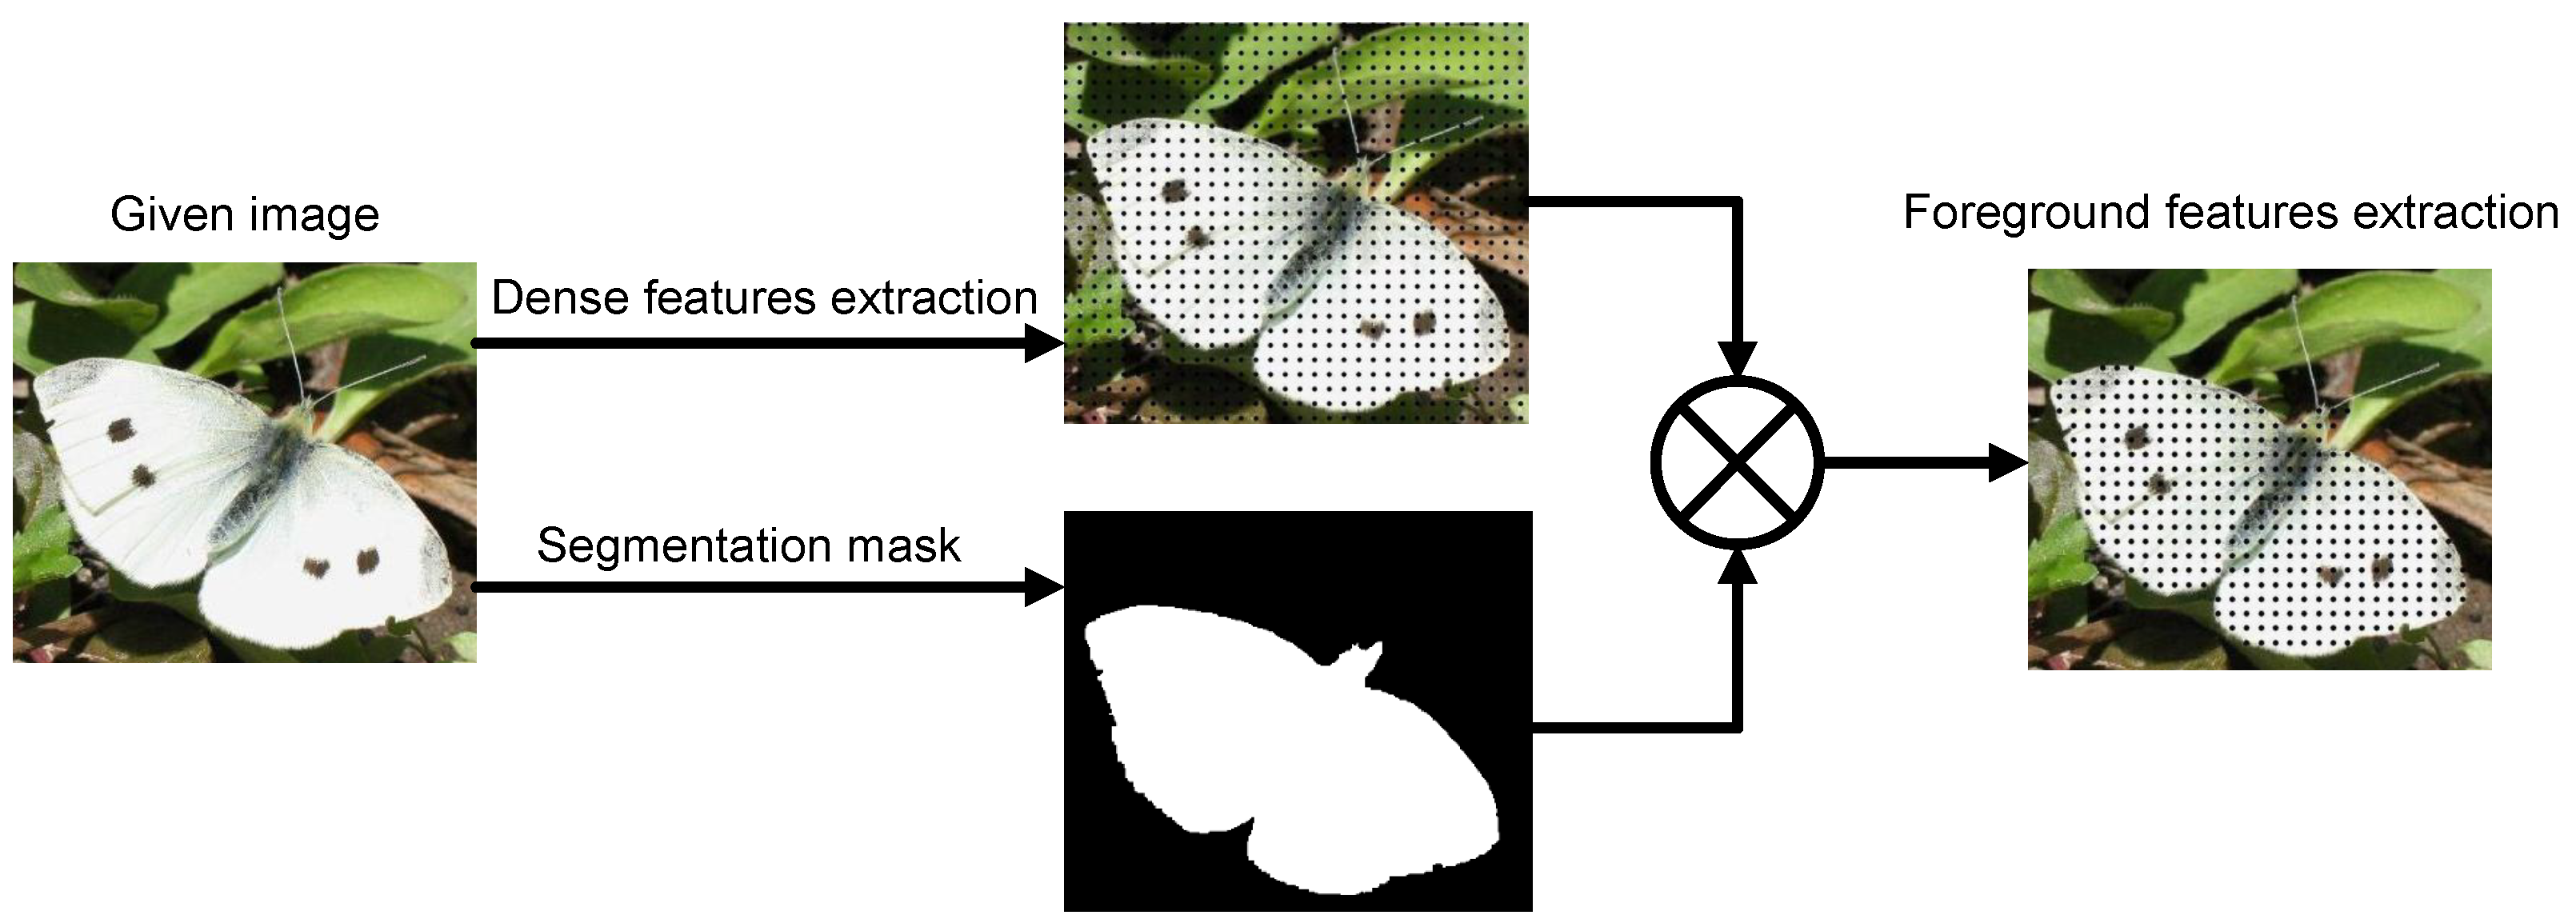
4.1.1. The Background Clutter Minimization

The visual vocabulary is constructed from the local features that are densely extracted from the images. These densely extracted features consist of features from the background and the object area or the foreground. Visual vocabulary is prone to contamination due to the presence of the features from the background [12]. For instance, the butterflies are imaged under severe background clutter. It is more likely that the features from the background negatively affect the discriminating nature of visual vocabulary. There exist specialized methods [32,33] to learn a discriminating vocabulary; however, these methods are computationally expensive. For the sake of simplicity, in the case of butterflies, segmentation masks are manually generated for the process of vocabulary construction. These segmentation masks extract the features from the foreground to construct visual vocabulary. Figure 7 shows the extraction of dense features from the foreground with the help of a segmentation mask.

4.1.2. Scale and Rotation Invariance

To make the global BoVWs image representation scale and rotation-invariant, the local features on top of it should have both properties. To this end, the local rotation-invariance is achieved by using SIFT [34]; however, the following SIFT extraction methods are evaluated to achieve local scale-invariance, which are also shown in Figure 8.
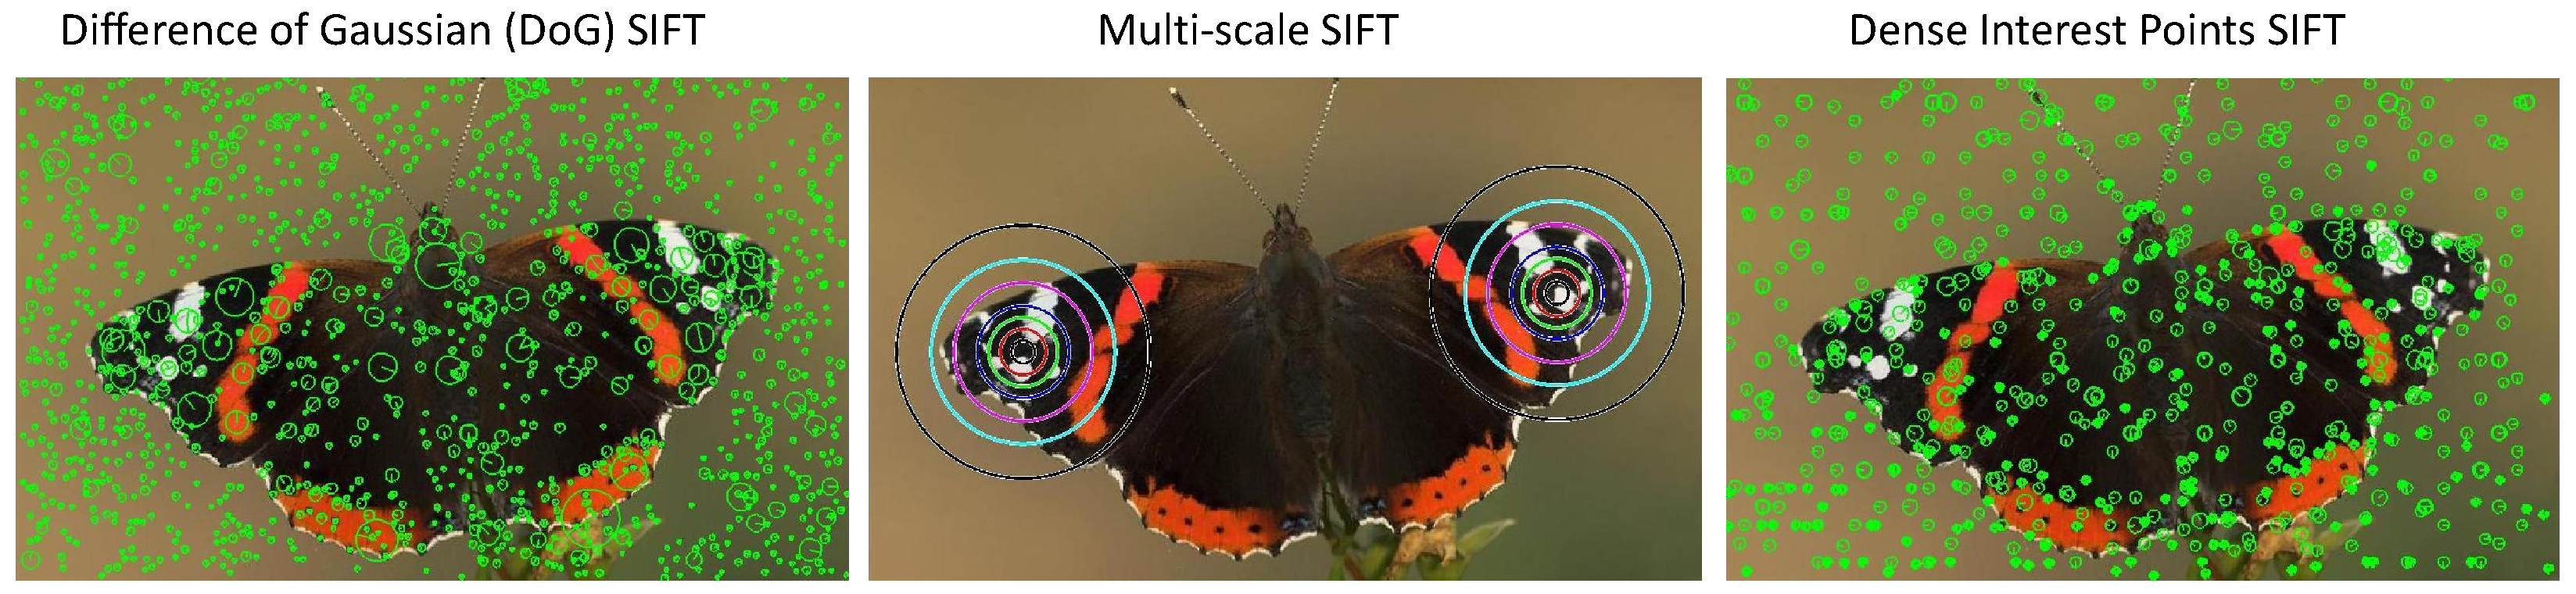
  • Multi-Scale SIFT: In this setting, we densely extract the rotation-invariant SIFT features from multiple predefined scales. The descriptors extracted from all the scales are concatenated for a given feature. Several empirically defined scales are evaluated on the dataset for multi-scale SIFT. The one with the best performance is selected.
  • Scale-Less SIFT (SL-SIFT): Hassner et al. [35] propose to extract SIFT descriptors from multiple scales and then combine them into a single descriptor called the Scale-Less SIFT (SLS). They represent each pixel as a set of descriptors extracted at several predefined scales. The subspace to point mapping technique is then used to combine all those descriptors into a single SLS descriptor.
  • Difference of Gaussian (DoG-SIFT): Regions of images with high information content that can be localized are called interesting regions [36]. These regions are detected in images using the interest point detectors [37]. The difference-of-Gaussian (DoG) is one of the interest point detectors used by Lowe [34] to extract interesting regions for SIFT features. Among these regions, the low contrast regions on edges are then neglected by performing a non-maximal suppression. The rest of the interest points are then assigned orientation, followed by calculating a 128-dimensional SIFT descriptor for each interest point.
  • Dense Interest Points (DIP-SIFT): This hybrid approach proposed aims at combining the best of both worlds, i.e., interest points and dense sampling [36]. Image patches are densely sampled on a regular grid and at multiple scales. The amount of the pixel stride on the dense grid is adjusted according to the patch’s scale to minimize the adjacent patches’ overlap. An “interestingness” measure such as the Laplacian is used to refine the patch for scale and position. If an actual maximum is found within the patch limits, it is considered the patch center. Otherwise, the center point of the patch is considered its center. The SIFT descriptor for this patch is then calculated centered on the center.

4.2. CNN Algorithms

The images are also represented using the pre-trained models of several Convolutional Neural Network (CNN) architectures. By pre-trained, we mean that the respective models are trained on image datasets with thousands of images and several hundred classes, such as the famous ImageNet [38]. A typical CNN architecture consists of two main parts: the first part is called the features extraction module or convolutional base. It usually contains layers such as convolutional and pooling layers. The images are encoded into feature vectors after passing through the convolutional base. The second part of the CNN architecture is a classifier. The encoded image is applied as input to this part, which is then classified into several classes. Most CNN architectures use a fully connected neural network where a given layer’s neurons have full connections to all its preceding layer’s activation units. However, we only use the pre-trained features extraction module to represent our images, a process called transfer learning using CNN. For this purpose, we use several pre-trained CNN architectures whose feature vector sizes are given in Table 1. We would like to mention here that the pre-trained models are only used for image encoding or image representation in a vector form. For this purpose, the features extractor part (the lower part of the CNN) is used, while the higher part of the CNN (classifier) is removed. Instead, for low cost and to demonstrate a convenient comparison between the CNN models, a linear SVM is used for image-based classification. This also allows us to align both the SIFT-based and the CNN-based evaluations as both of them use a linear SVM as a classifier. The details are given in Section 5.1.

5. Experiments and Results

This section of the article discusses the experimental protocols and results.

5.1. Experimental Protocols

Traditional: The best parameters of traditional algorithms are based on the findings of Anwar et al. [31], for instance, the size of the visual vocabulary is 1000. For multi-scale SIFT, 8 scales performed best on both the datasets (the scales are { 2 4 6 8 12 16 22 32 } ). The SL-SIFT employs a dense regular grid with a pixel stride of 10. SIFT extracts linearly distributed features from 20 scales in the range of {2, 32} at each pixel position. The DoG-SIFT also obtains features with the default settings of the function vl_sift provided by the VLFEAT library [45]. The default settings of DIP-SIFT are employed where the pixel stride of the dense grid is 10, and the number of octaves is 4, with 2 scales per octave.
CNN: All the pre-trained models are from the official PyTorch [46] implementation with their default settings to compute the image representations. The dataset is split randomly into disjointed train and test sets for each experiment with the split ratios of 90–10% and 80–20%, where the experiments are performed five times. Consequently, the mean classification accuracy achieved by each image representation is reported along with the respective standard deviation. For classification, a linear Support Vector Machine (SVM) is utilized, where the best value of the regularization parameter “C” is found using k-fold cross-validation on the training set. We use a linear SVM for classification as our sole purpose is to carry out a performance evaluation of all the CNN-based image representations. In addition to that, an SVM comes with much lower cost in terms of computation as compared to other neural networks-based classifiers.

5.2. Results and Discussion

The performances achieved by each variant of the traditional algorithms for image representation for each dataset on both the settings of the data split are shown in Table 2. Multi-scale SIFT outperforms the rest of the extraction methods on both datasets on the data split setting of 90–10%. DoG-SIFT performs better on the butterflies dataset because the DoG blob detector accurately detects the blobs found on butterflies’ wings. However, its performance is not satisfactory for the ReefFish dataset because most of the reef fish species have stripes that are not easily detected by the DoG blob detector. DIP-SIFT uses Laplacian of Gaussian (LoG), a blob detector, but its dense nature prevents it from behaving like DoG-SIFT. Even then, DIP-SIFT’s performance is inferior to multi-scale SIFT and SLS on both datasets. Lastly, SLS performs on par with multi-scale SIFT, but the complex computations that involve extracting SIFT from 20 scales and subspace to point mapping make it unfavorable for further experiments.
Table 3 shows the performances achieved by CNN-based image representations for each dataset on both the data split settings. The variants of DenseNet outperform all other CNN architectures on both datasets. Interestingly, the data split of 80–20% achieves better performance than its counterpart. Unlike the handcrafted methods, almost all the CNN models achieve recognition rates of more than 90% and hence are least affected by the image variations found in the both the datasets. It is worth mentioning that we did not perform data augmentations such as rotations and scaling in our experiments. This clearly shows that the CNN-based image representations are more favorable than handcrafted features for the classification of images that are affected by changes in orientations and scales with heavy to moderate background clutter.

6. Conclusions

An image-based holistic system for the species classification of butterflies and reef fish is proposed and evaluated on the most diverse datasets collected from the internet containing images of 50 species of both animals. The images are represented using the traditional algorithms, such as the BoVWs model as well as pre-trained CNN architectures for image-based classification. The BoVWs-based image representation is invariant to scale and rotation changes by evaluating four rotation-invariant SIFT feature extraction methods. On the other hand, 20 of the most recently proposed pre-trained CNN architectures are also assessed for image representation. The experimental results showed that, among all the image representations, the variants of DenseNet achieved the best classification rates on both datasets. Nonetheless, a large part of our dataset is collected from the internet and thus lacks challenging and extreme image variations. Consequently, the future directions include dataset extension by including images of more species under challenging environments such as those of coral reefs. With this baseline evaluation, we also plan to develop a task-specific deep learning-based recognition pipeline.

Author Contributions

Conceptualization, A.A., H.A. and S.A.; methodology, A.A., H.A. and S.A.; validation, A.A., H.A. and S.A.; formal analysis, A.A. and S.A.; investigation, A.A. and H.A.; resources, H.A. and S.A.; data curation, A.A.; writing—original draft preparation, A.A. and H.A.; writing—review and editing, S.A.; visualization, A.A. and H.A.; supervision, H.A. and S.A.; project administration, S.A. All authors have read and agreed to the published version of the manuscript.

Funding

This research received no external funding.

Data Availability Statement

github: https://github.com/hafeez-anwar/FGBR, accessed on 18 August 2022.

Conflicts of Interest

The authors declare no conflict of interest.

References

  1. Wiemers, M.; Fiedler, K. Does the DNA barcoding gap exist?—A case study in blue butterflies (Lepidoptera: Lycaenidae). Front. Zool. 2007, 4, 8. [Google Scholar] [CrossRef] [PubMed]
  2. Scoble, M.J. Geometrid Moths of the World: A Catalogue; Apollo Books; CSIRO Publishing: Collingwood, VIC, Australia, 1999; ISBN 8788757293. [Google Scholar]
  3. Lieske, E.; Robert, M. Coral Reef Fishes: Indo-Pacific and Caribbean; Princeton University Press: Princeton, NJ, USA, 2001; ISBN 9780691089959. [Google Scholar]
  4. Melvin, S.D.; Wilson, S.P. The effects of environmental pollutants on complex fish behaviour: Integrating behavioural and physiological indicators of toxicity. Aquat. Toxicol. 2004, 68, 369–392. [Google Scholar]
  5. Borenstein, E.; Ullman, S. Learning to Segment. In Proceedings of the European Conference on Computer Vision, Prague, Czech Republic, 11–14 May 2004; pp. 315–328. [Google Scholar]
  6. Magee, D.; Boyle, R. Detecting Lameness in Livestock using Re-sampling Condensation and Multi-stream Cyclic Hidden Markov Models. Image Vis. Comput. 2002, 20, 581–594. [Google Scholar] [CrossRef]
  7. Lazebnik, S.; Schmid, C.; Ponce, J. Semi-local Affine Parts for Object Recognition. In British Machine Vision Conference (BMVC’04); The British Machine Vision Association: Durham, UK, 2004; pp. 779–788. [Google Scholar]
  8. Wang, J.; Markert, K.; Everingham, M. Learning Models for Object Recognition from Natural Language Descriptions. In British Machine Vision Conference (BMVC’04); The British Machine Vision Association: Durham, UK, 2009; pp. 2.1–2.11. [Google Scholar]
  9. Zambanini, S.; Kavelar, A.; Kampel, M. Classifying Ancient Coins by Local Feature Matching and Pairwise Geometric Consistency Evaluation. In Proceedings of the 2014 22nd International Conference on Pattern Recognition, Stockholm, Sweden, 24–28 August 2014; pp. 3032–3037. [Google Scholar]
  10. Parikh, D. Discovering Localized Attributes for Fine-grained Recognition. In Proceedings of the 2012 IEEE Conference on Computer Vision and Pattern Recognition, Providence, RI, USA, 16–21 June 2012; pp. 3474–3481. [Google Scholar]
  11. Khamis, S.; Lampert, C. CoConut: Co-Classification with Output Space Regularization. In Proceedings of the British Machine Vision Conference 2014, Nottingham, UK, 1 September 2014. [Google Scholar]
  12. Anwar, H.; Zambanini, S.; Kampel, M. Encoding Spatial Arrangements of Visual Words for Rotation-invariant Image Classification. In Proceedings of the German Conference on Pattern Recognition, Munich, Germany, 12–14 September 2014; pp. 407–416. [Google Scholar]
  13. Ren, S.; He, K.; Girshick, R.; Sun, J. Faster r-cnn: Towards real-time object detection with region proposal networks. In Proceedings of the Advances in Neural Information Processing Systems, Montreal, QC, Canada, 7–12 December 2015; pp. 91–99. [Google Scholar]
  14. Zhao, R.; Li, C.; Ye, S.; Fang, X. Butterfly recognition based on faster R-CNN. J. Phys. Conf. Ser. 2019, 1176, 032048. [Google Scholar] [CrossRef]
  15. Simonyan, K.; Zisserman, A. Very deep convolutional networks for large-scale image recognition. arXiv 2014, arXiv:1409.1556. [Google Scholar]
  16. He, K.; Zhang, X.; Ren, S.; Sun, J. Identity mappings in deep residual networks. In Proceedings of the European Conference on Computer Vision, Amsterdam, The Netherlands, 11–14 October 2016; Springer: Berlin/Heidelberg, Germany, 2016; pp. 630–645. [Google Scholar]
  17. Almryad, A.S.; Kutucu, H. Automatic identification for field butterflies by convolutional neural networks. Eng. Sci. Technol. Int. J. 2020, 23, 189–195. [Google Scholar] [CrossRef]
  18. Lin, Z.; Jia, J.; Gao, W.; Huang, F. Fine-grained visual categorization of butterfly specimens at sub-species level via a convolutional neural network with skip-connections. Neurocomputing 2020, 384, 295–313. [Google Scholar] [CrossRef]
  19. Nie, L.; Wang, K.; Fan, X.; Gao, Y. Fine-grained butterfly recognition with deep residual networks: A new baseline and benchmark. In Proceedings of the 2017 International Conference on Digital Image Computing: Techniques and Applications (DICTA), Sydney, NSW, Australia, 29 November–1 December 2017; pp. 1–7. [Google Scholar]
  20. Carvajal, J.A.; Romero, D.G.; Sappa, A.D. Fine-tuning based deep convolutional networks for lepidopterous genus recognition. In Proceedings of the Iberoamerican Congress on Pattern Recognition; Springer: Berlin/Heidelberg, Germany, 2016; pp. 467–475. [Google Scholar]
  21. Chang, Q.; Qu, H.; Wu, P.; Yi, J. Fine-Grained Butterfly and Moth Classification Using Deep Convolutional Neural Networks; Rutgers University: New Brunswick, NJ, USA, 2017. [Google Scholar]
  22. Xin, D.; Chen, Y.W.; Li, J. Fine-Grained Butterfly Classification in Ecological Images Using Squeeze-And-Excitation and Spatial Attention Modules. Appl. Sci. 2020, 10, 1681. [Google Scholar] [CrossRef]
  23. Joly, A.; Goëau, H.; Glotin, H.; Spampinato, C.; Bonnet, P.; Vellinga, W.; Planque, R.; Rauber, A.; Fisher, R.; Müller, H. LifeCLEF 2014: Multimedia life species identification challenges. In Proceedings of the International Conference of the Cross-Language Evaluation Forum for European Languages 2014, Sheffield, UK, 15–18 September 2014; Springer: Cham, Switzerland, 2014. [Google Scholar]
  24. Huang, P.X.; Boom, B.J.; Fisher, R.B. GMM improves the reject option in hierarchical classification for fish recognition. In Proceedings of the IEEE Winter Conference on Applications of Computer Vision, Steamboat Springs, CO, USA, 24–26 March 2014; pp. 371–376. [Google Scholar]
  25. Siddiqui, S.A.; Salman, A.; Malik, M.I.; Shafait, F.; Mian, A.; Shortis, M.R.; Harvey, E.S. Automatic fish species classification in underwater videos: Exploiting pre-trained deep neural network models to compensate for limited labelled data. ICES J. Mar. Sci. 2018, 75, 374–389. [Google Scholar] [CrossRef]
  26. Villon, S.; Mouillot, D.; Chaumont, M.; Darling, E.S.; Subsol, G.; Claverie, T.; Villéger, S. A deep learning method for accurate and fast identification of coral reef fishes in underwater images. Ecol. Inform. 2018, 48, 238–244. [Google Scholar] [CrossRef]
  27. Iqbal, M.A.; Wang, Z.; Ali, Z.A.; Riaz, S. Automatic Fish Species Classification Using Deep Convolutional Neural Networks. Wirel. Pers. Commun. 2019, 116, 1043–1053. [Google Scholar] [CrossRef]
  28. Zheng, H.; Fu, J.; Zha, Z.J.; Luo, J. Looking for the devil in the details: Learning trilinear attention sampling network for fine-grained image recognition. In Proceedings of the IEEE/CVF Conference on Computer Vision and Pattern Recognition, Long Beach, CA, USA, 15–20 June 2019; pp. 5012–5021. [Google Scholar]
  29. Beuth, F.; Schlosser, T.; Friedrich, M.; Kowerko, D. Improving automated visual fault detection by combining a biologically plausible model of visual attention with deep learning. In Proceedings of the IECON 2020 The 46th Annual Conference of the IEEE Industrial Electronics Society, Singapore, 18–21 October 2020; pp. 5323–5330. [Google Scholar]
  30. Beuth, F. Visual Attention in Primates and for Machines-Neuronal Mechanisms. Ph.D. Thesis, Technische Universität Chemnitz, Chemnitz, Germany, 2019. [Google Scholar]
  31. Anwar, H.; Zambanini, S.; Kampel, M. Invariant image-based species classification of butterflies and reef fish. In Proceedings of the Machine Vision of Animals and their Behaviour (MVAB), Swansea, UK, 7–10 September 2015; pp. 5.1–5.8. [Google Scholar]
  32. Mikulík, A.; Perdoch, M.; Chum, O.; Matas, J. Learning a Fine Vocabulary. In Proceedings of the 11th European Conference on Computer Vision (ECCV), Part III, Heraklion, Greece, 5–11 September 2010; pp. 1–14. [Google Scholar]
  33. Mikulík, A.; Perdoch, M.; Chum, O.; Matas, J. Learning Vocabularies over a Fine Quantization. Int. J. Comput. Vision 2013, 103, 163–175. [Google Scholar] [CrossRef]
  34. Lowe, D.G. Distinctive Image Features from Scale-Invariant Keypoints. Int. J. Comput. Vision 2004, 60, 91–110. [Google Scholar] [CrossRef]
  35. Hassner, T.; Mayzels, V.; Zelnik-Manor, L. On SIFTs and their Scales. In Proceedings of the 2012 IEEE Conference on Computer Vision and Pattern Recognition, Providence, RI, USA, 16–21 June 2012. [Google Scholar]
  36. Tuytelaars, T. Dense Interest Points. In Proceedings of the 2010 IEEE Computer Society Conference on Computer Vision and Pattern Recognition, San Francisco, CA, USA, 13–18 June 2010; pp. 2281–2288. [Google Scholar]
  37. Mikolajczyk, K.; Tuytelaars, T.; Schmid, C.; Zisserman, A.; Matas, J.; Schaffalitzky, F.; Kadir, T.; Gool, L.V. A Comparison of Affine Region Detectors. Int. J. Comput. Vision 2005, 65, 43–72. [Google Scholar] [CrossRef]
  38. Deng, J.; Dong, W.; Socher, R.; Li, L.J.; Li, K.; Fei-Fei, L. Imagenet: A large-scale hierarchical image database. In Proceedings of the 2009 IEEE Conference on Computer Vision and Pattern Recognition, Miami, FL, USA, 20–25 June 2009; pp. 248–255. [Google Scholar]
  39. Krizhevsky, A.; Sutskever, I.; Hinton, G.E. Imagenet classification with deep convolutional neural networks. Commun. ACM 2017, 60, 84–90. [Google Scholar] [CrossRef]
  40. He, K.; Zhang, X.; Ren, S.; Sun, J. Deep residual learning for image recognition. In Proceedings of the IEEE Conference on Computer Vision and Pattern Recognition, Las Vegas, NV, USA, 27–30 June 2016; pp. 770–778. [Google Scholar]
  41. Huang, G.; Liu, Z.; Van Der Maaten, L.; Weinberger, K.Q. Densely connected convolutional networks. In Proceedings of the IEEE Conference on Computer Vision and Pattern Recognition, Honolulu, HI, USA, 21–26 July 2017; pp. 4700–4708. [Google Scholar]
  42. Chen, Y.; Li, J.; Xiao, H.; Jin, X.; Yan, S.; Feng, J. Dual path networks. In Proceedings of the Advances in Neural Information Processing Systems, Long Beach, CA, USA, 4–9 December 2017; pp. 4467–4475. [Google Scholar]
  43. Szegedy, C.; Vanhoucke, V.; Ioffe, S.; Shlens, J.; Wojna, Z. Rethinking the inception architecture for computer vision. In Proceedings of the IEEE Conference on Computer Vision and Pattern Recognition, Las Vegas, NV, USA, 27–30 June 2016; pp. 2818–2826. [Google Scholar]
  44. Iandola, F.N.; Han, S.; Moskewicz, M.W.; Ashraf, K.; Dally, W.J.; Keutzer, K. SqueezeNet: AlexNet-level accuracy with 50x fewer parameters and <0.5 MB model size. arXiv 2016, arXiv:1602.07360. [Google Scholar]
  45. Vedaldi, A.; Fulkerson, B. VLFeat: An Open and Portable Library of Computer Vision Algorithms. In Proceedings of the 18th ACM International Conference on Multimedia, Firenze, Italy, 25–29 October 2010; pp. 1469–1472. [Google Scholar]
  46. Paszke, A.; Gross, S.; Massa, F.; Lerer, A.; Bradbury, J.; Chanan, G.; Killeen, T.; Lin, Z.; Gimelshein, N.; Antiga, L.; et al. PyTorch: An Imperative Style, High-Performance Deep Learning Library. In Advances in Neural Information Processing Systems 32; Wallach, H., Larochelle, H., Beygelzimer, A., d’Alché-Buc, F., Fox, E., Garnett, R., Eds.; Curran Associates, Inc.: Red Hook, NY, USA, 2019; pp. 8024–8035. [Google Scholar]
Figure 1. Some examples of symmetry on the wings of butterflies are clearly visible in the form of color patterns and blobs.
Electronics 11 02701 g001
Figure 2. Common image variations found in butterflies and reef fish images showing different background clutters, scales, and orientations.
Electronics 11 02701 g002
Figure 3. Representative images of butterfly species. The text above the images shows the species. The images can be better seen on a monitor when zoomed in.
Electronics 11 02701 g003
Figure 4. The number of images per class in the butterflies dataset. Ecological images are those that are taken in the natural habitat of butterflies. Such images contain background clutter and the butterfly being imaged with non-uniform orientations and illumination conditions. The lab images are those of the butterfly specimen preserved in the lab. Hence, these images do not contain the background clutter, and the images are taken with minimal differences in orientation and illumination. The left y-axis (min = 0, max = 300) represents the count of ecological images where the right y-axis (min = 0, max = 40) represents the count of lab images.
Electronics 11 02701 g004
Figure 5. All the representative images of reef fish species from our novel ReefFish dataset.
Electronics 11 02701 g005
Figure 6. The images per class in the reef fish dataset. Similar to the butterfly images, ecological images are those taken in the natural habitat of the fish while the lab images are taken in a controlled environment such as in the lab. The left y-axis (min = 0, max = 200) represents the count of ecological images where the right y-axis (min = 0, max = 15) represents the count of lab images.
Electronics 11 02701 g006
Figure 7. The process in which the segmentation masks are utilized to extract foreground features for vocabulary construction.
Electronics 11 02701 g007
Figure 8. Comparisons of the different strategies employed for SIFT features extraction for traditional classification algorithms.
Electronics 11 02701 g008
Table 1. Various feature vectors for the state-of-the-art CNN methods employed for benchmarking our novel datasets.
CNN MethodsVersionsNo. of FeaturesCNN MethodsVersionsNo. of Features
AlexNet [39]-4096ResNet [40]1522048
DenseNet [41]20119201012048
1691664502048
161220834512
121102418512
DPN [42]1312688VGG [15]194096
982688164096
68832134096
Inception [43]v41536SqueezeNet [44]1_1512
v320481_0512
Table 2. Classification accuracies achieved by various traditional schemes with a train–test split of 90–10% and 80–20% on butterflies and ReefFish datasets. The results are also provided with standard deviation, and the best results are highlighted in bold.
Datasets
ButterfliesReefFish
AlgorithmsAccuracy
(90–10)
Accuracy
(80–20)
Accuracy
(90–10)
Accuracy
(80–20)
DoG82.12 ± 0.8380.64 ± 1.4360.04 ± 2.0458.74 ± 1.75
DIP81.75 ± 1.8780.15 ± 1.2881.40 ± 1.1079.43 ± 0.70
Mutiscale86.25 ± 1.2584.72 ± 1.5288.75 ± 1.8086.72 ± 1.37
SLS84.02 ± 1.3782.75 ± 1.8287.80 ± 1.6084.81 ± 1.25
Table 3. Comparison of the CNN architectures, benchmarking the proposed datasets. Each experiment is performed five times. The standard deviation is provided with each model’s result, and the best ones are given in bold.
Butterflies DatasetReefFish Dataset
ArchitecturesAccuracy
(90–10)
Accuracy
(80–20)
Accuracy
(90–10)
Accuracy
(80–20)
AlexNet90.54 ± 1.1189.94 ± 1.7489.99 ± 0.9591.44 ± 0.75
DenseNet20195.27 ± 0.9095.80 ± 0.6696.08 ± 0.5596.34 ± 0.40
DenseNet16995.81 ± 1.2495.22 ± 0.3695.14 ± 1.6695.46 ± 1.07
DenseNet16195.66 ± 0.8696.27 ± 0.9094.93 ± 0.9395.98 ± 0.55
DenseNet12195.89 ± 1.0996.08 ± 0.9994.36 ± 0.8895.33 ± 0.56
DPN13189.53 ± 1.3289.59 ± 0.8388.98 ± 1.0690.37 ± 0.15
DPN9890.08 ± 1.0689.94 ± 1.0089.77 ± 1.0490.65 ± 0.45
DPN6891.86 ± 2.5191.73 ± 0.8291.85 ± 1.1193.29 ± 0.67
Inceptionv492.25 ± 1.5792.04 ± 0.7390.81 ± 1.6592.17 ± 0.83
Inceptionv393.02 ± 1.1093.05 ± 0.9194.24 ± 0.4794.33 ± 0.67
ResNet15294.96 ± 1.3094.91 ± 0.2395.56 ± 1.4895.43 ± 0.32
ResNet10194.88 ± 0.6294.95 ± 0.9494.36 ± 1.7594.73 ± 0.66
ResNet5093.95 ± 1.4094.64 ± 0.3894.36 ± 1.0394.62 ± 0.32
ResNet3493.57 ± 1.0393.71 ± 0.9992.79 ± 2.1293.73 ± 0.38
ResNet1893.88 ± 0.6294.45 ± 1.0093.16 ± 1.3193.55 ± 0.83
SqueezeNet1_194.34 ± 1.1793.98 ± 0.7994.10 ± 1.0194.02 ± 0.71
SqueezeNet1_094.26 ± 0.6293.83 ± 1.1794.26 ± 0.7294.57 ± 1.02
VGG1989.46 ± 1.8290.21 ± 1.0088.67 ± 1.5489.61 ± 0.91
VGG1692.09 ± 1.6493.20 ± 0.8689.30 ± 1.2990.16 ± 0.73
VGG1392.17 ± 2.2193.13 ± 0.7891.07 ± 0.1091.33 ± 0.44
VGG1192.95 ± 0.9092.86 ± 1.1992.48 ± 0.5392.04 ± 0.66
Publisher’s Note: MDPI stays neutral with regard to jurisdictional claims in published maps and institutional affiliations.

