Article

Res-CDD-Net: A Network with Multi-Scale Attention and Optimized Decoding Path for Skin Lesion Segmentation

1
School of Cybersecurity and Computer, Hebei University, Baoding 071002, China
2
Laboratory of Intelligence Image and Text, Hebei University, Baoding 071002, China
*
Author to whom correspondence should be addressed.
Electronics 2022, 11(17), 2672; https://doi.org/10.3390/electronics11172672
Submission received: 26 July 2022 / Revised: 20 August 2022 / Accepted: 23 August 2022 / Published: 26 August 2022
(This article belongs to the Special Issue Machine Learning for Medical Imaging Processing)

Abstract

:
Melanoma is a lethal skin cancer. In its diagnosis, skin lesion segmentation plays a critical role. However, skin lesions exhibit a wide range of sizes, shapes, colors, and edges. This makes skin lesion segmentation a challenging task. In this paper, we propose an encoding–decoding network called Res-CDD-Net to address the aforementioned aspects related to skin lesion segmentation. First, we adopt ResNeXt50 pre-trained on the ImageNet dataset as the encoding path. This pre-trained ResNeXt50 can provide rich image features to the whole network to achieve higher segmentation accuracy. Second, a channel and spatial attention block (CSAB), which integrates both channel and spatial attention, and a multi-scale capture block (MSCB) are introduced between the encoding and decoding paths. The CSAB can highlight the lesion area and inhibit irrelevant objects. MSCB can extract multi-scale information to learn lesion areas of different sizes. Third, we upgrade the decoding path. Every 3 × 3 square convolution kernel in the decoding path is replaced by a diverse branch block (DBB), which not only promotes the feature restoration capability, but also improves the performance and robustness of the network. We evaluate the proposed network on three public skin lesion datasets, namely ISIC-2017, ISIC-2016, and PH2. The dice coefficient is 6.90% higher than that of U-Net, whereas the Jaccard index is 10.84% higher than that of U-Net (assessed on the ISIC-2017 dataset). The results show that Res-CDD-Net achieves outstanding performance, higher than the performance of most state-of-the-art networks. Last but not least, the training of the network is fast, and good results can be achieved in early stages of training.

1. Introduction

Skin cancer is a widespread disease, and a particularly lethal instance of this disease is melanoma. According to statistics, if melanoma patients are not diagnosed at an early stage, the survival rate is only 24% [1]. However, if they are diagnosed soon enough, the survival rate can exceed 95% [2]. Although melanoma usually occurs on the skin surface, the accuracy of its clinical diagnosis with unaided eyes is only approximately 60% [3], which means that many potentially curable melanomas are not detected until a terminal stage is reached. Fortunately, the invention of dermoscopy effectively alleviates the above problems. Dermoscopy is a non-invasive imaging technique that eliminates surface reflection from the skin, allowing for deeper visual enhancement. Still, without the guidance of professional doctors, dermoscopic images provide little help to the diagnosis [4]. In addition, artificially analyzing whether a skin lesion belongs to melanoma is costly in terms of time and energy, further leading to misdiagnoses and missed diagnoses.
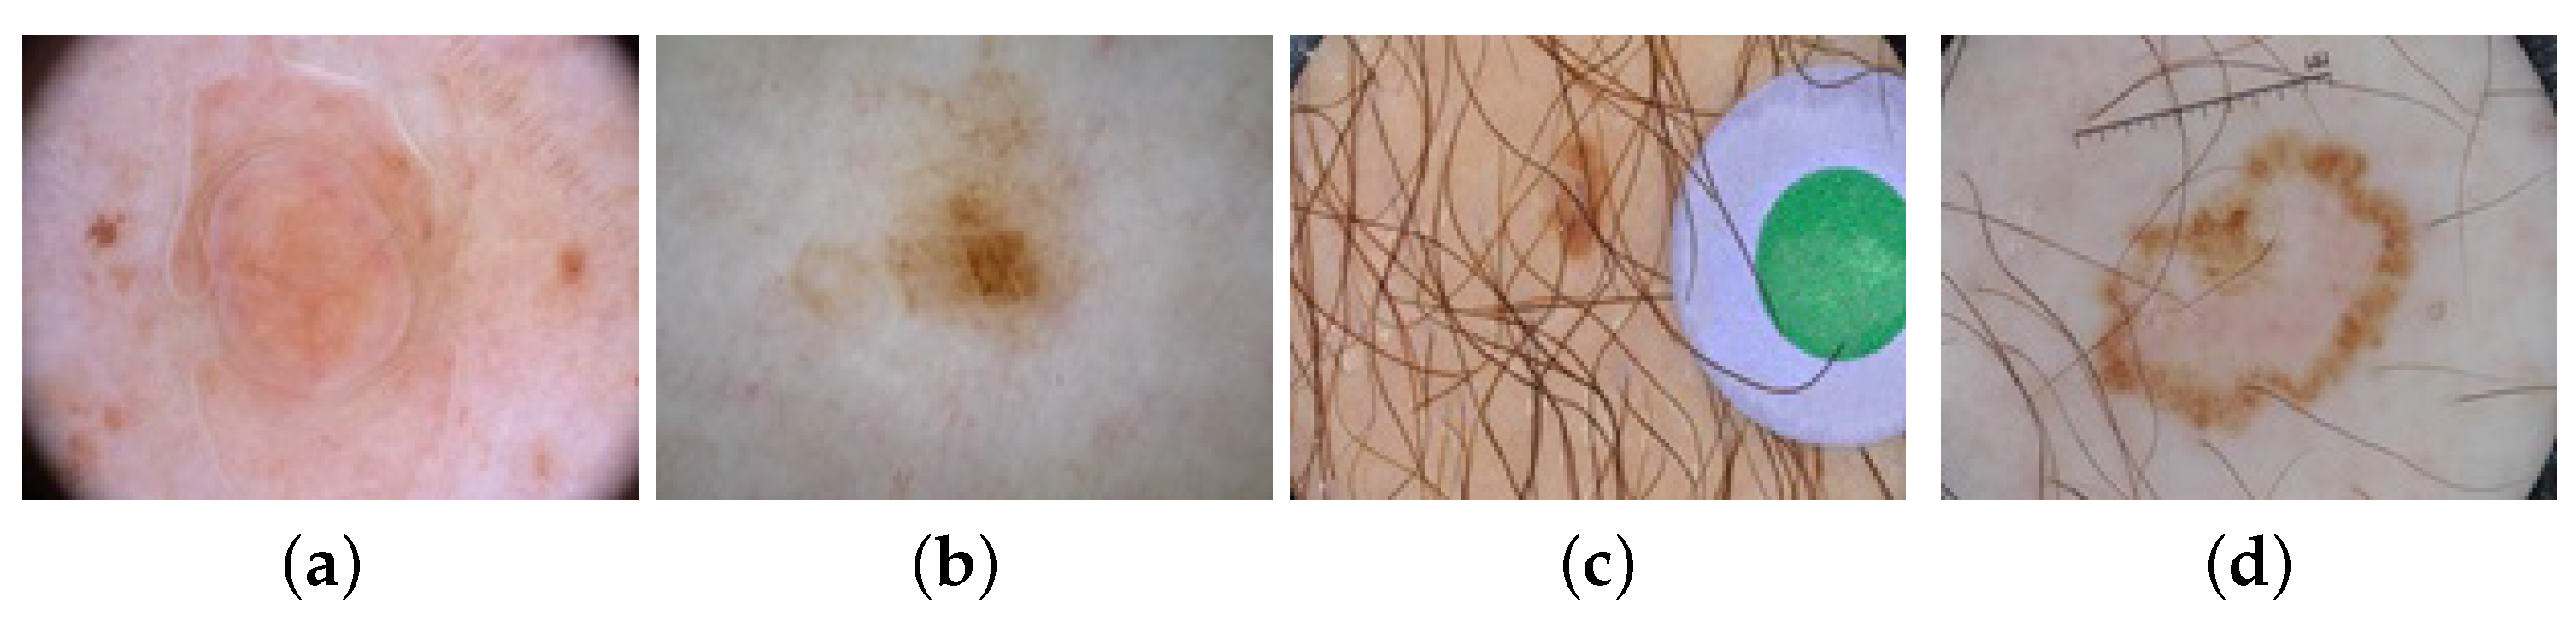
In the past few years, computer-aided diagnosis (CAD) has brought vitality into the diagnosis of melanoma. CAD in dermatology involves five fundamental steps: image acquisition, data processing, lesion segmentation, feature extraction, and lesion recognition. Each step is essential inside a CAD system. Among them, lesion segmentation is a crucial step concerning subsequent treatments because the segmentation results can provide rich morphological information of the lesion area to reduce the probability of misdiagnosis. Owing to the variety of sizes and shapes, fuzzy boundaries, unclear textures, hairs, bubbles occlusion, etc. [5], segmentation results based on traditional methods such as histogram threshold processing and support vector machine have not been satisfactory. 
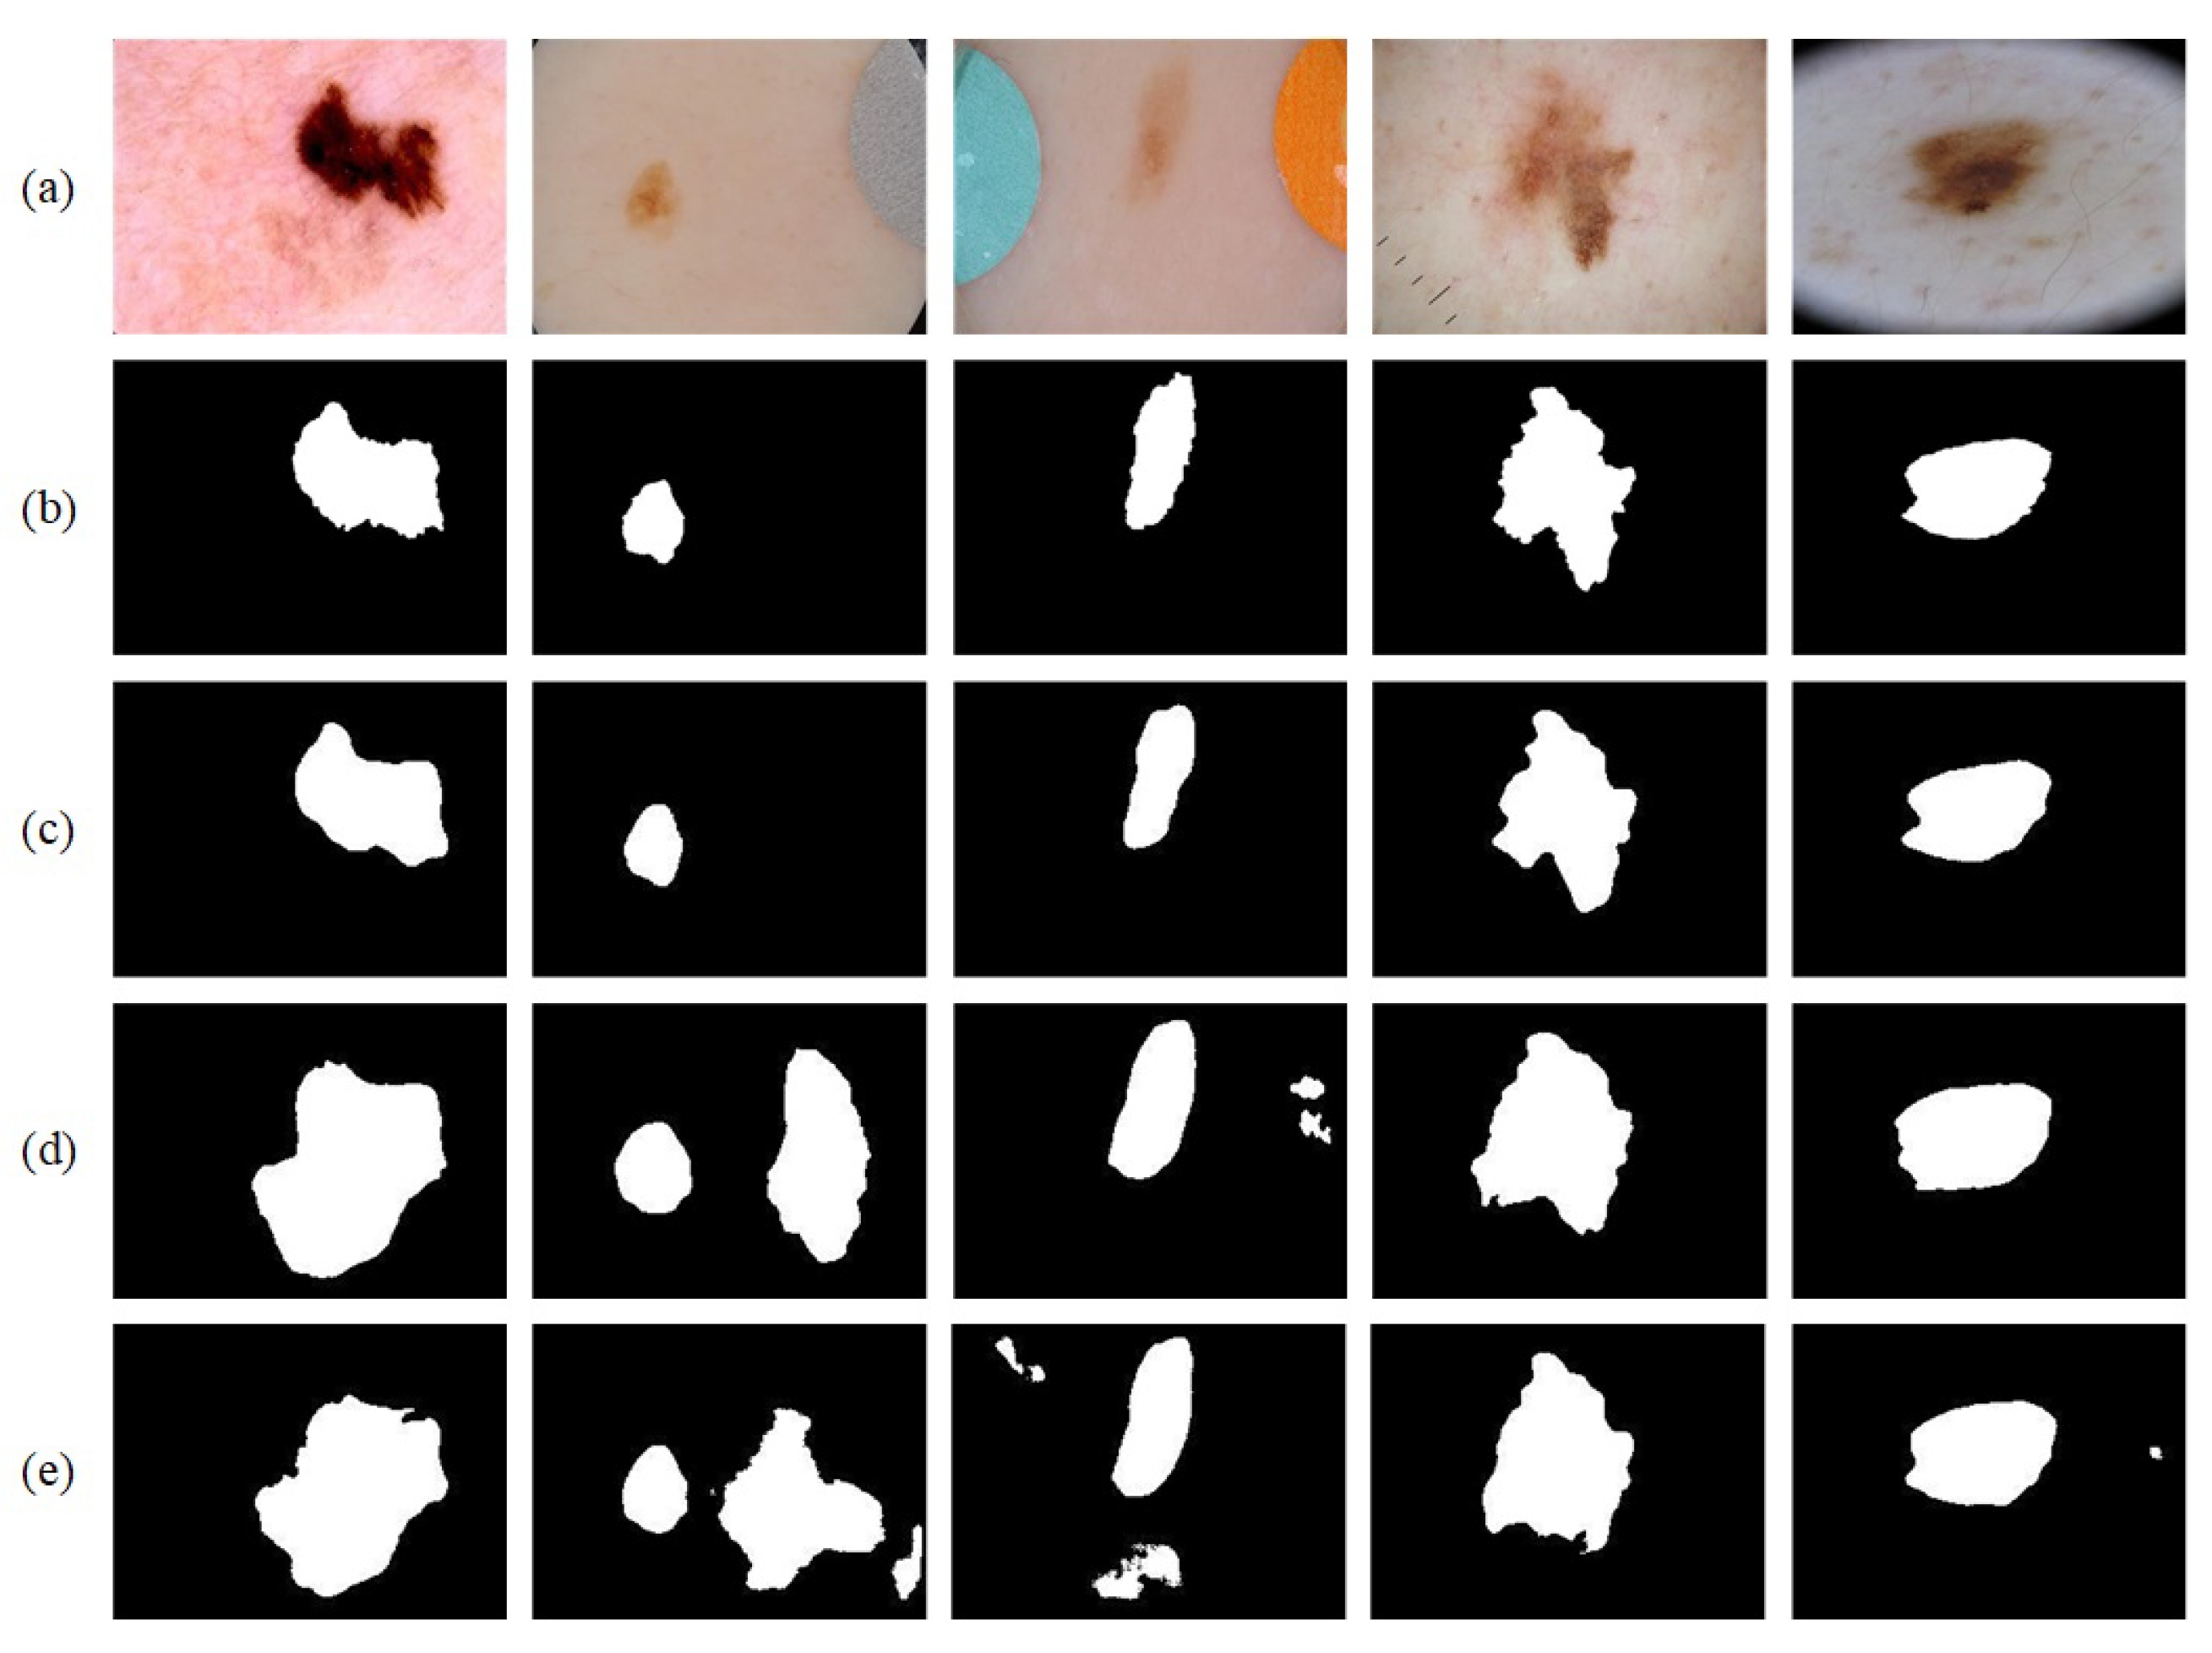
Figure 1 shows several difficult-segment dermoscopic images with external interferences.
In previous years, non-iterative artificial neural networks were popular in the field of image processing, including medical image processing. Izonin et al. [6] designed a new learning-based image super-resolution method. In their study, the process of increasing the resolution of video frames or images from a set according is based on the weight coefficients of synaptic connections. These coefficients are obtained by the learning neural-like structure on a pair of images of low and high resolution. Tkachenko et al. [7] proposed the solutions of a problem of changing image resolution based on the use of computational intelligence means, which were constructed using the new neuro-paradigm—Geometric Transformations Model.
Nowadays, convolutional neural networks (CNNs) have become the dominant trend for skin lesion segmentation. The commonly used CNN has a U-shaped encoder–decoder structure. In this structure, an encoder is used to extract image features, while a decoder is often applied to restore extracted features to the original image size and output the final segmentation results. To achieve more satisfactory skin lesion segmentation, the researchers have introduced a considerable amount of effective mechanisms that can enhance the feature learning into the encoder–decoder structure. In 2016, Yu et al. [8] first segmented skin lesion images with a deep residual network. Inspired by PSPNet [9], Sarker et al. [10] proposed SLSDeep. They adopted ResNet50 as the encoding path, and a pyramid pooling module was placed at the bottom to extract multi-scale semantic information. Tong et al. [11] developed ASCU-Net, a network integrating a triple attention mechanism, including a new attention gate, a spatial attention module, and a channel attention module. They were put into the decoding path of U-shaped network. Qu et al. [12] designed ResDense U-Net by integrating ResNet [13] and DenseNet [14]. Inspired by ACNet [15], traditional 3 × 3 convolution kernels were all replaced by asymmetric convolution kernels. Simultaneously, residual modules were introduced at the skip connection to alleviate the semantic gap between the two feature maps from the encoding and decoding paths. Dai et al. [16] proposed a novel multi-scale residual encoding–decoding network called Ms RED. In Ms RED, a multi-scale residual encoding fusion module was employed as the encoder, and a multi-scale residual decoding fusion module was applied as the decoder to adaptively fuse multi-scale features.
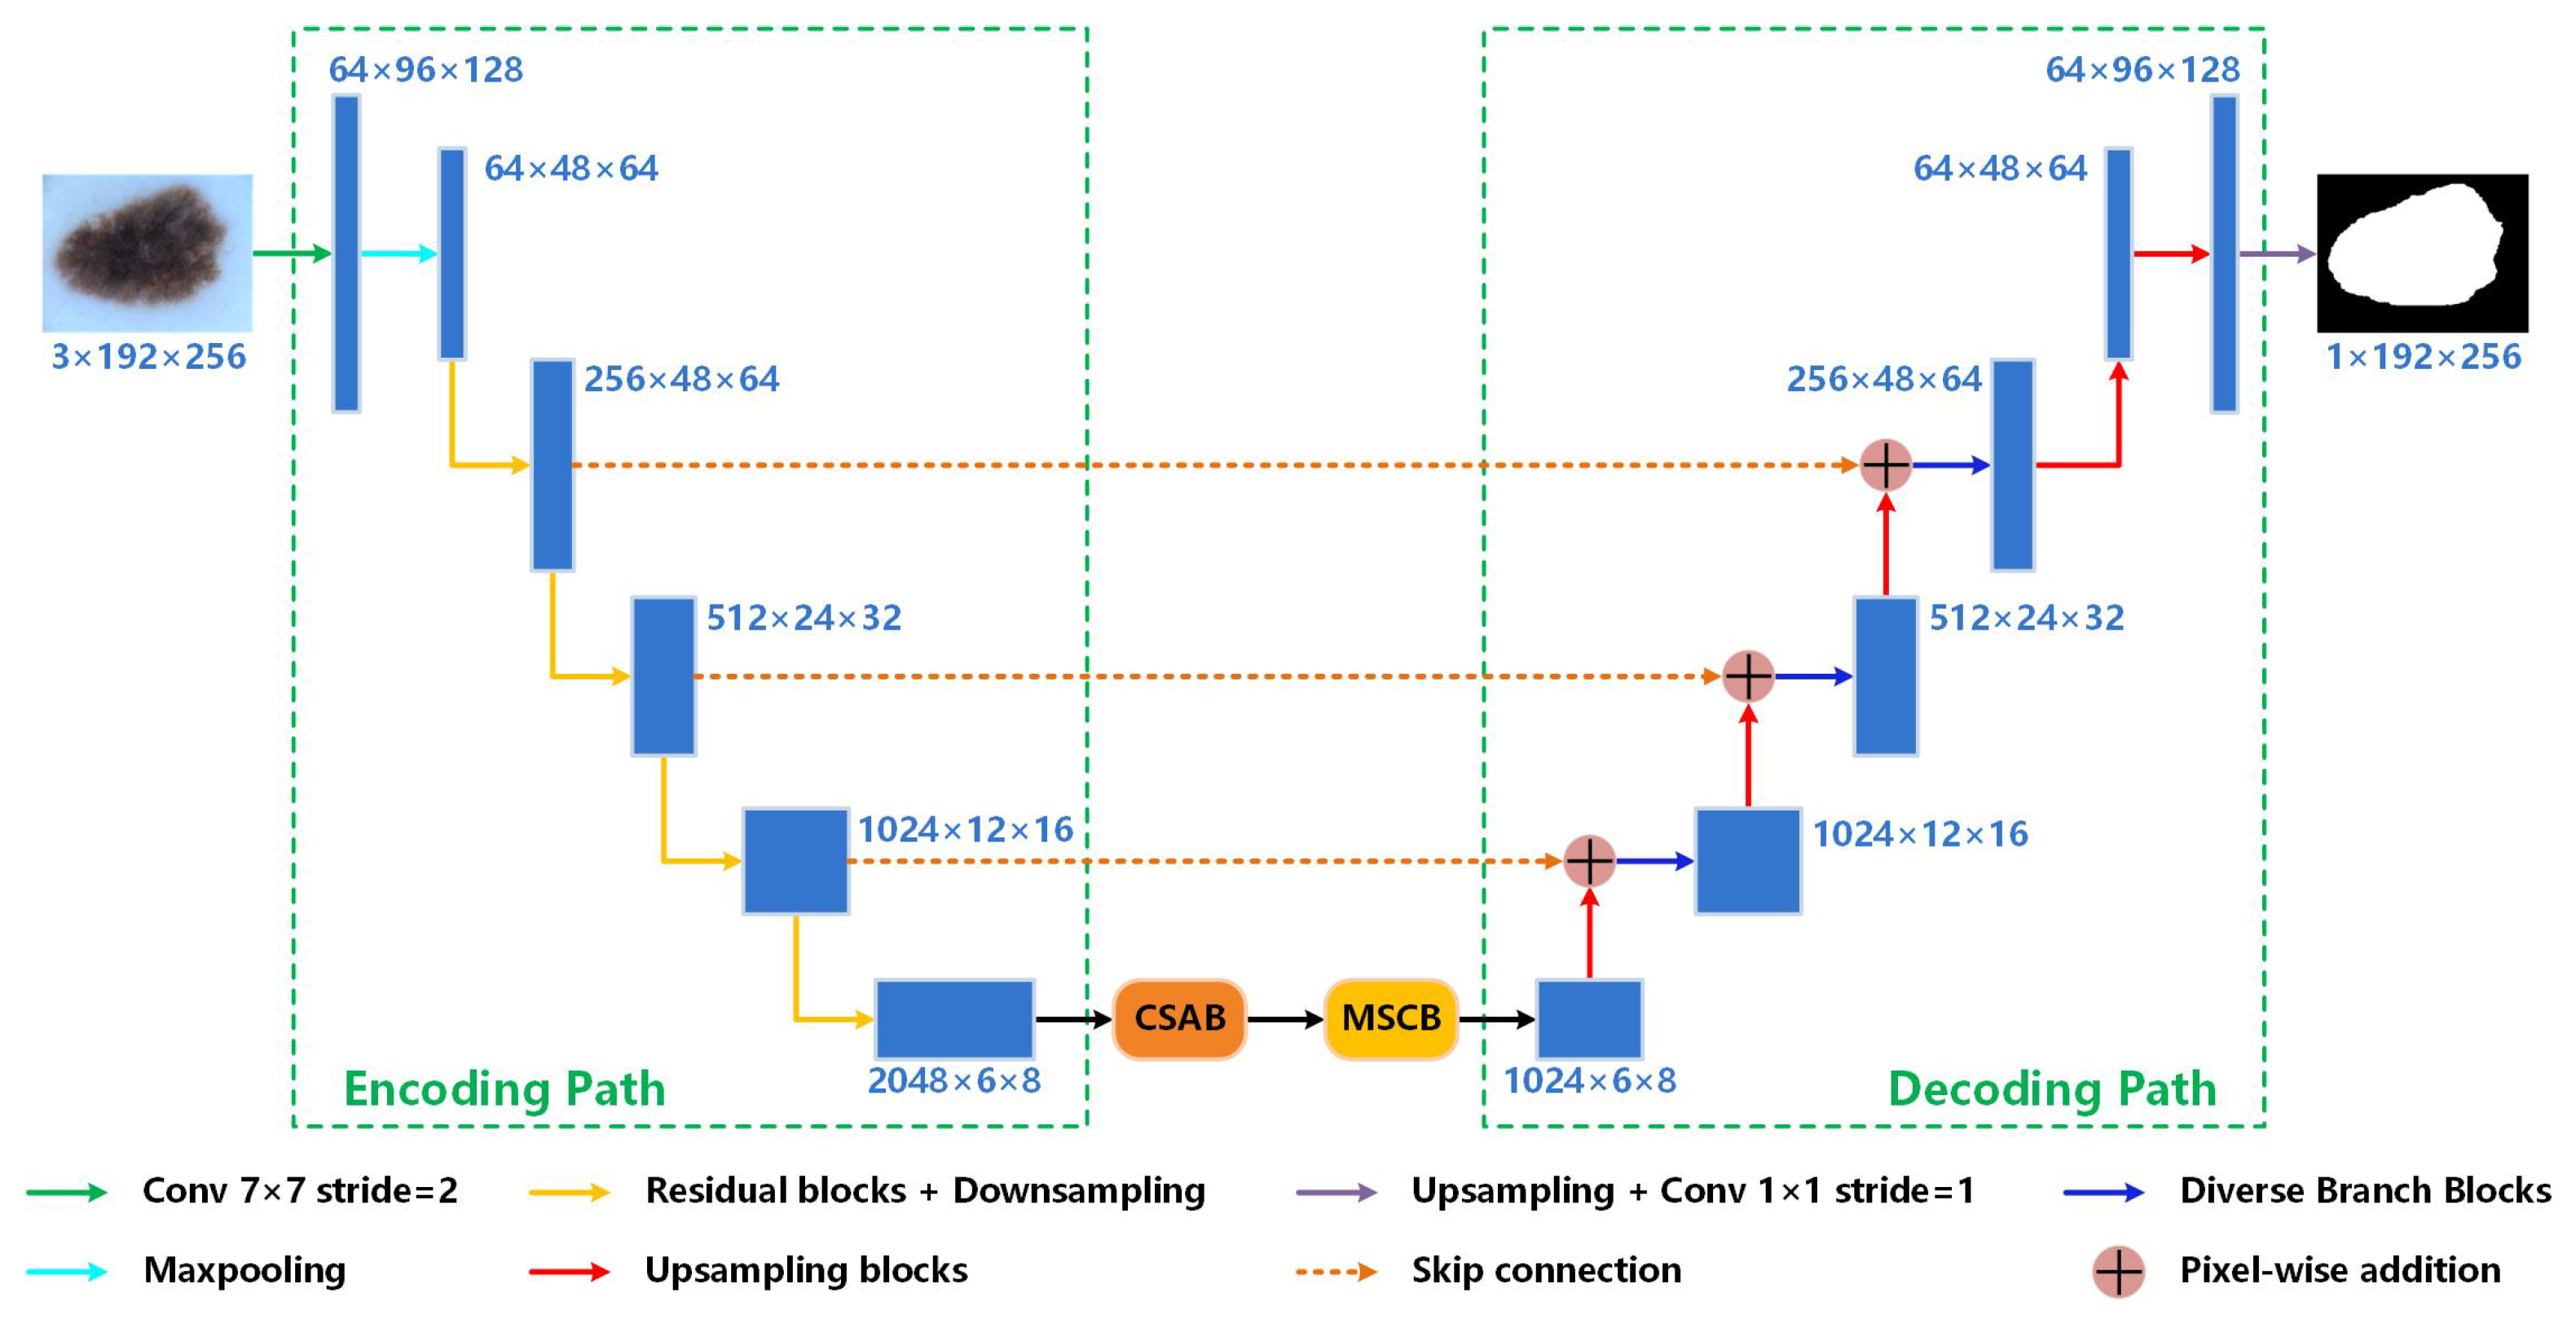
Previous methods have greatly contributed to skin lesion segmentation. However, challenges such as irregular shapes, hair covering, and low contrast in the surrounding can be better tackled. To efficiently acquire more accurate segmentation results, we propose Res-CDD-Net for skin lesion segmentation. The network is designed based on U-shaped encoder–decoder structure and we introduce some novel mechanisms to further enhance the performance and save training time.
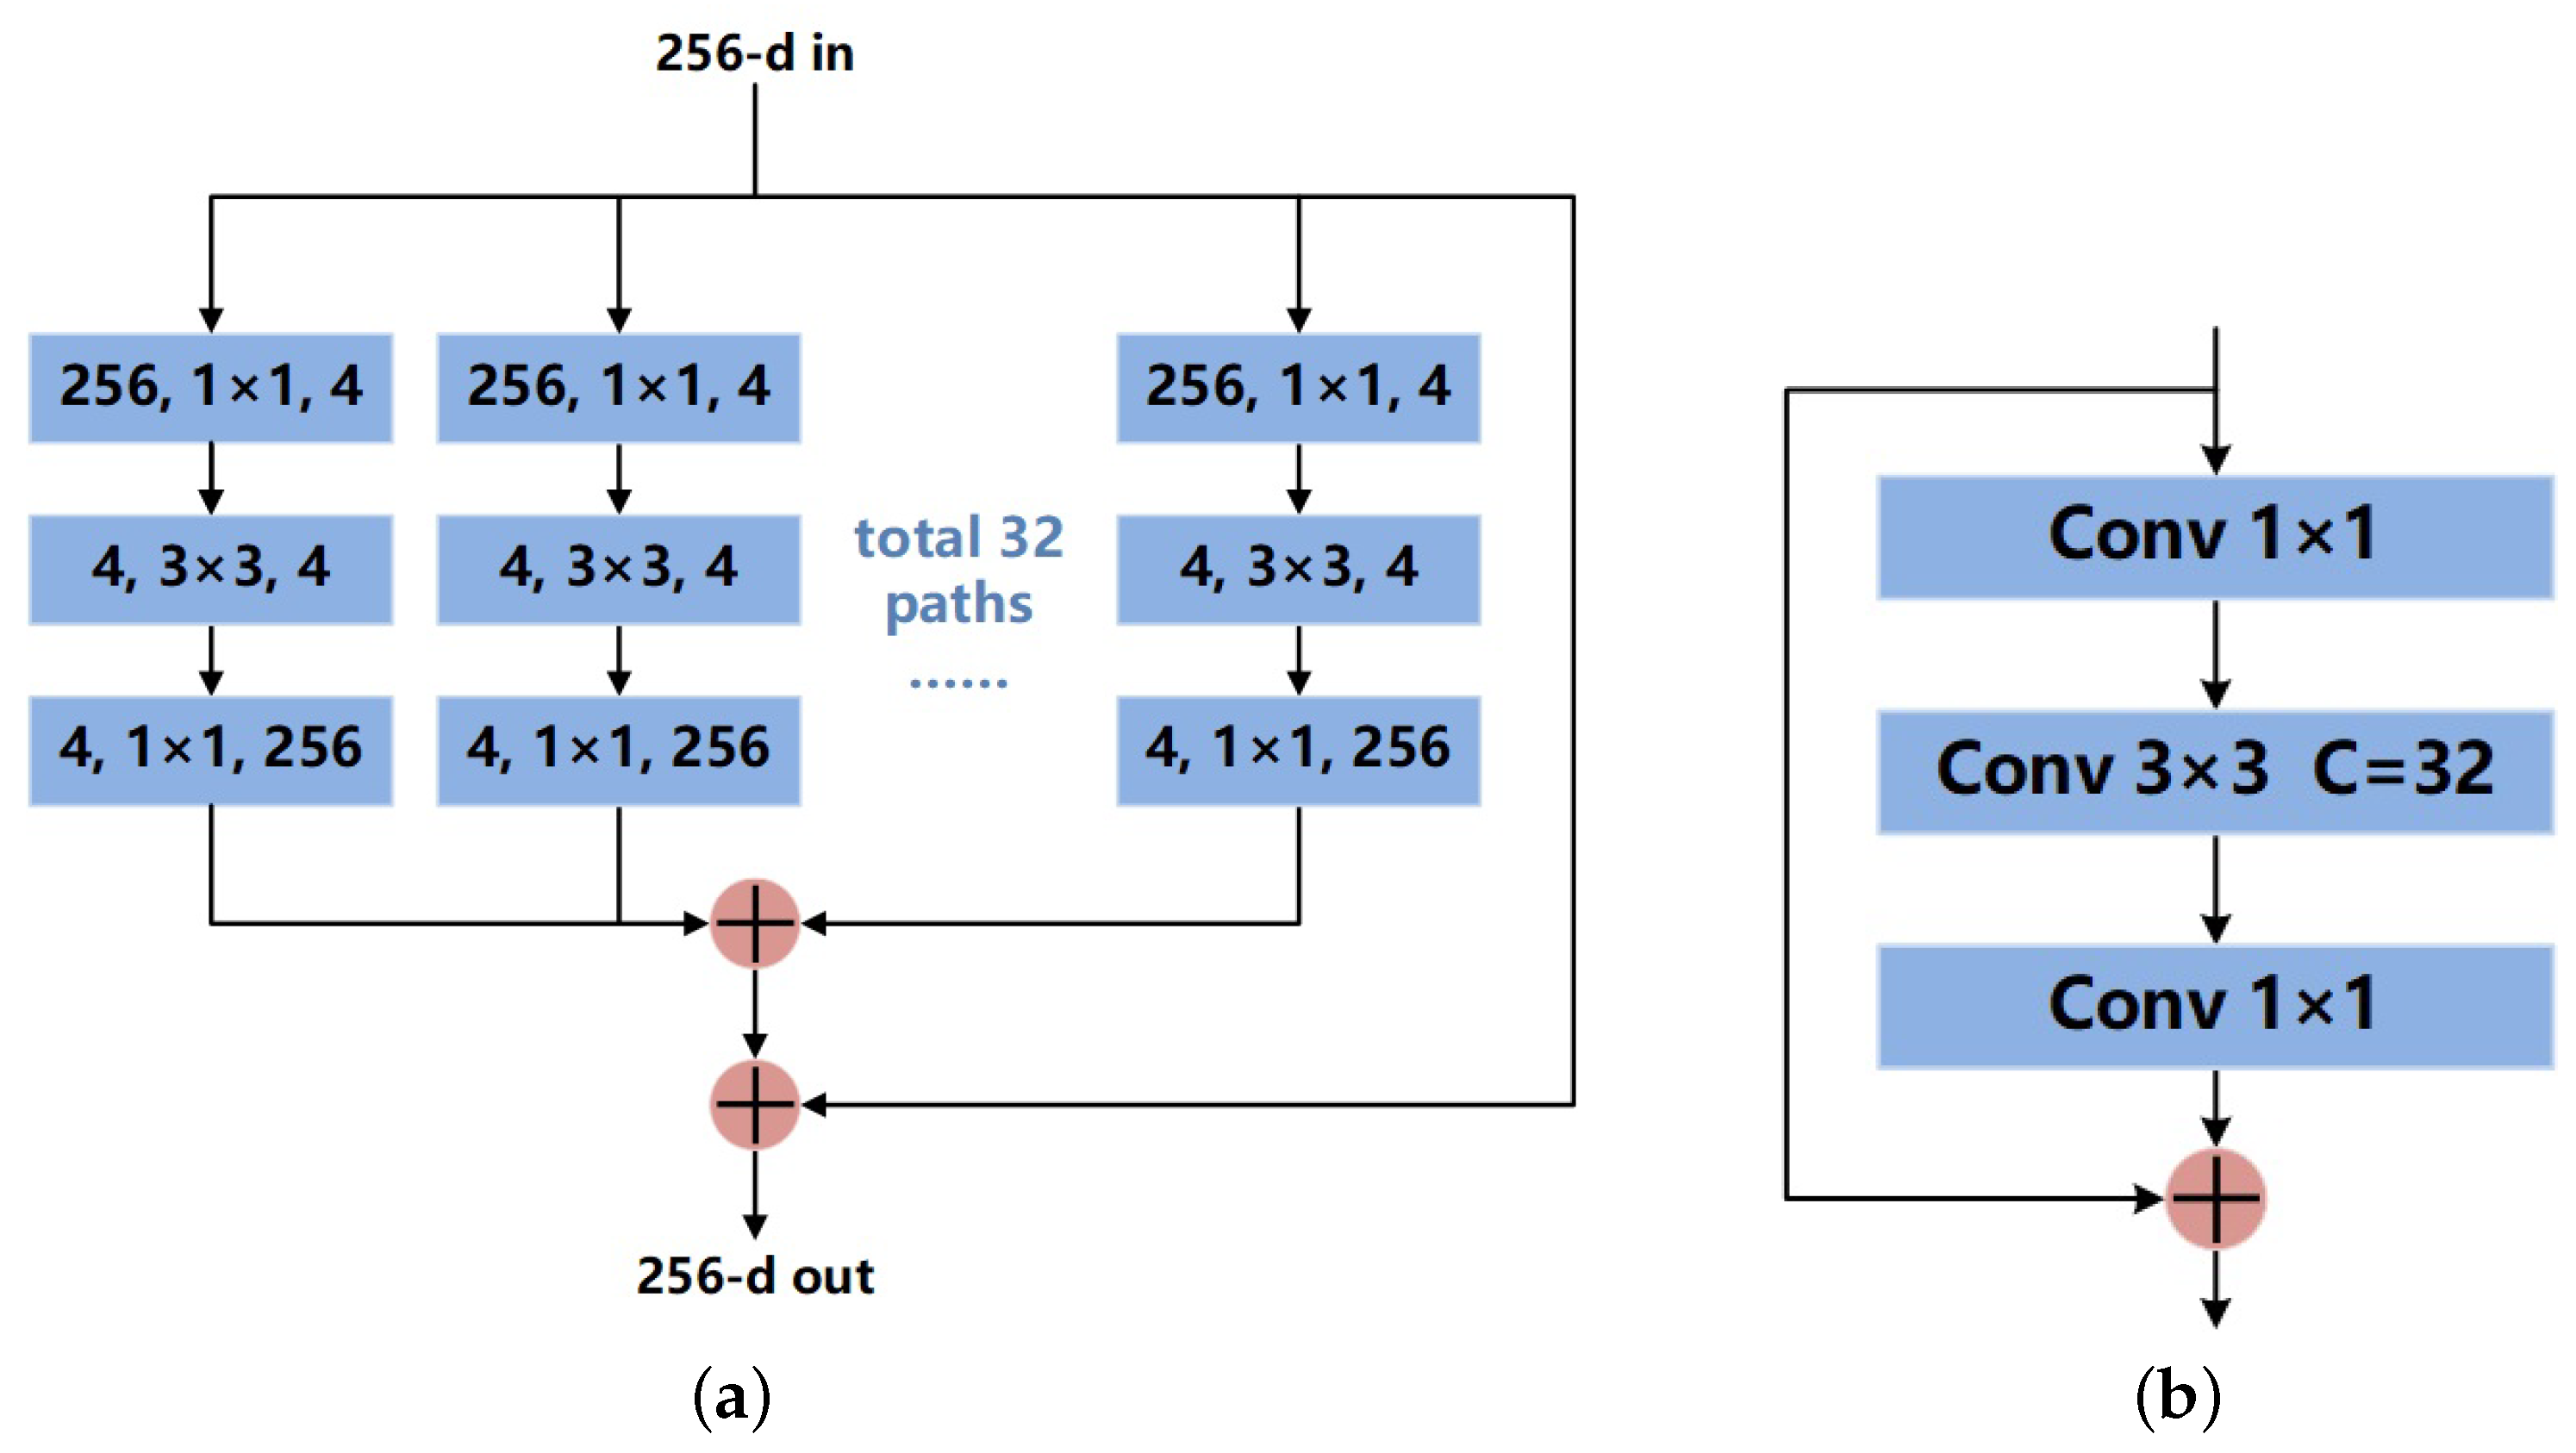
For the encoding path, we adopt ResNeXt50 [17] pre-trained on the ImageNet dataset to capture more feature information and make the whole network more efficient. For skin lesion datasets containing a small number of images, pre-loading weights trained on a general dataset is helpful to improve the segmentation accuracy. The feature extraction capacity of ResNeXt50 is enhanced compared to ResNet50 [13] (the error rates are reduced by 2–3% in ImageNet1-K and ImageNet5-K classification tasks). In addition, the topology of ResNeXt is more consistent with GPU-hardware design principles. This can accelerate the reasoning speed during training.
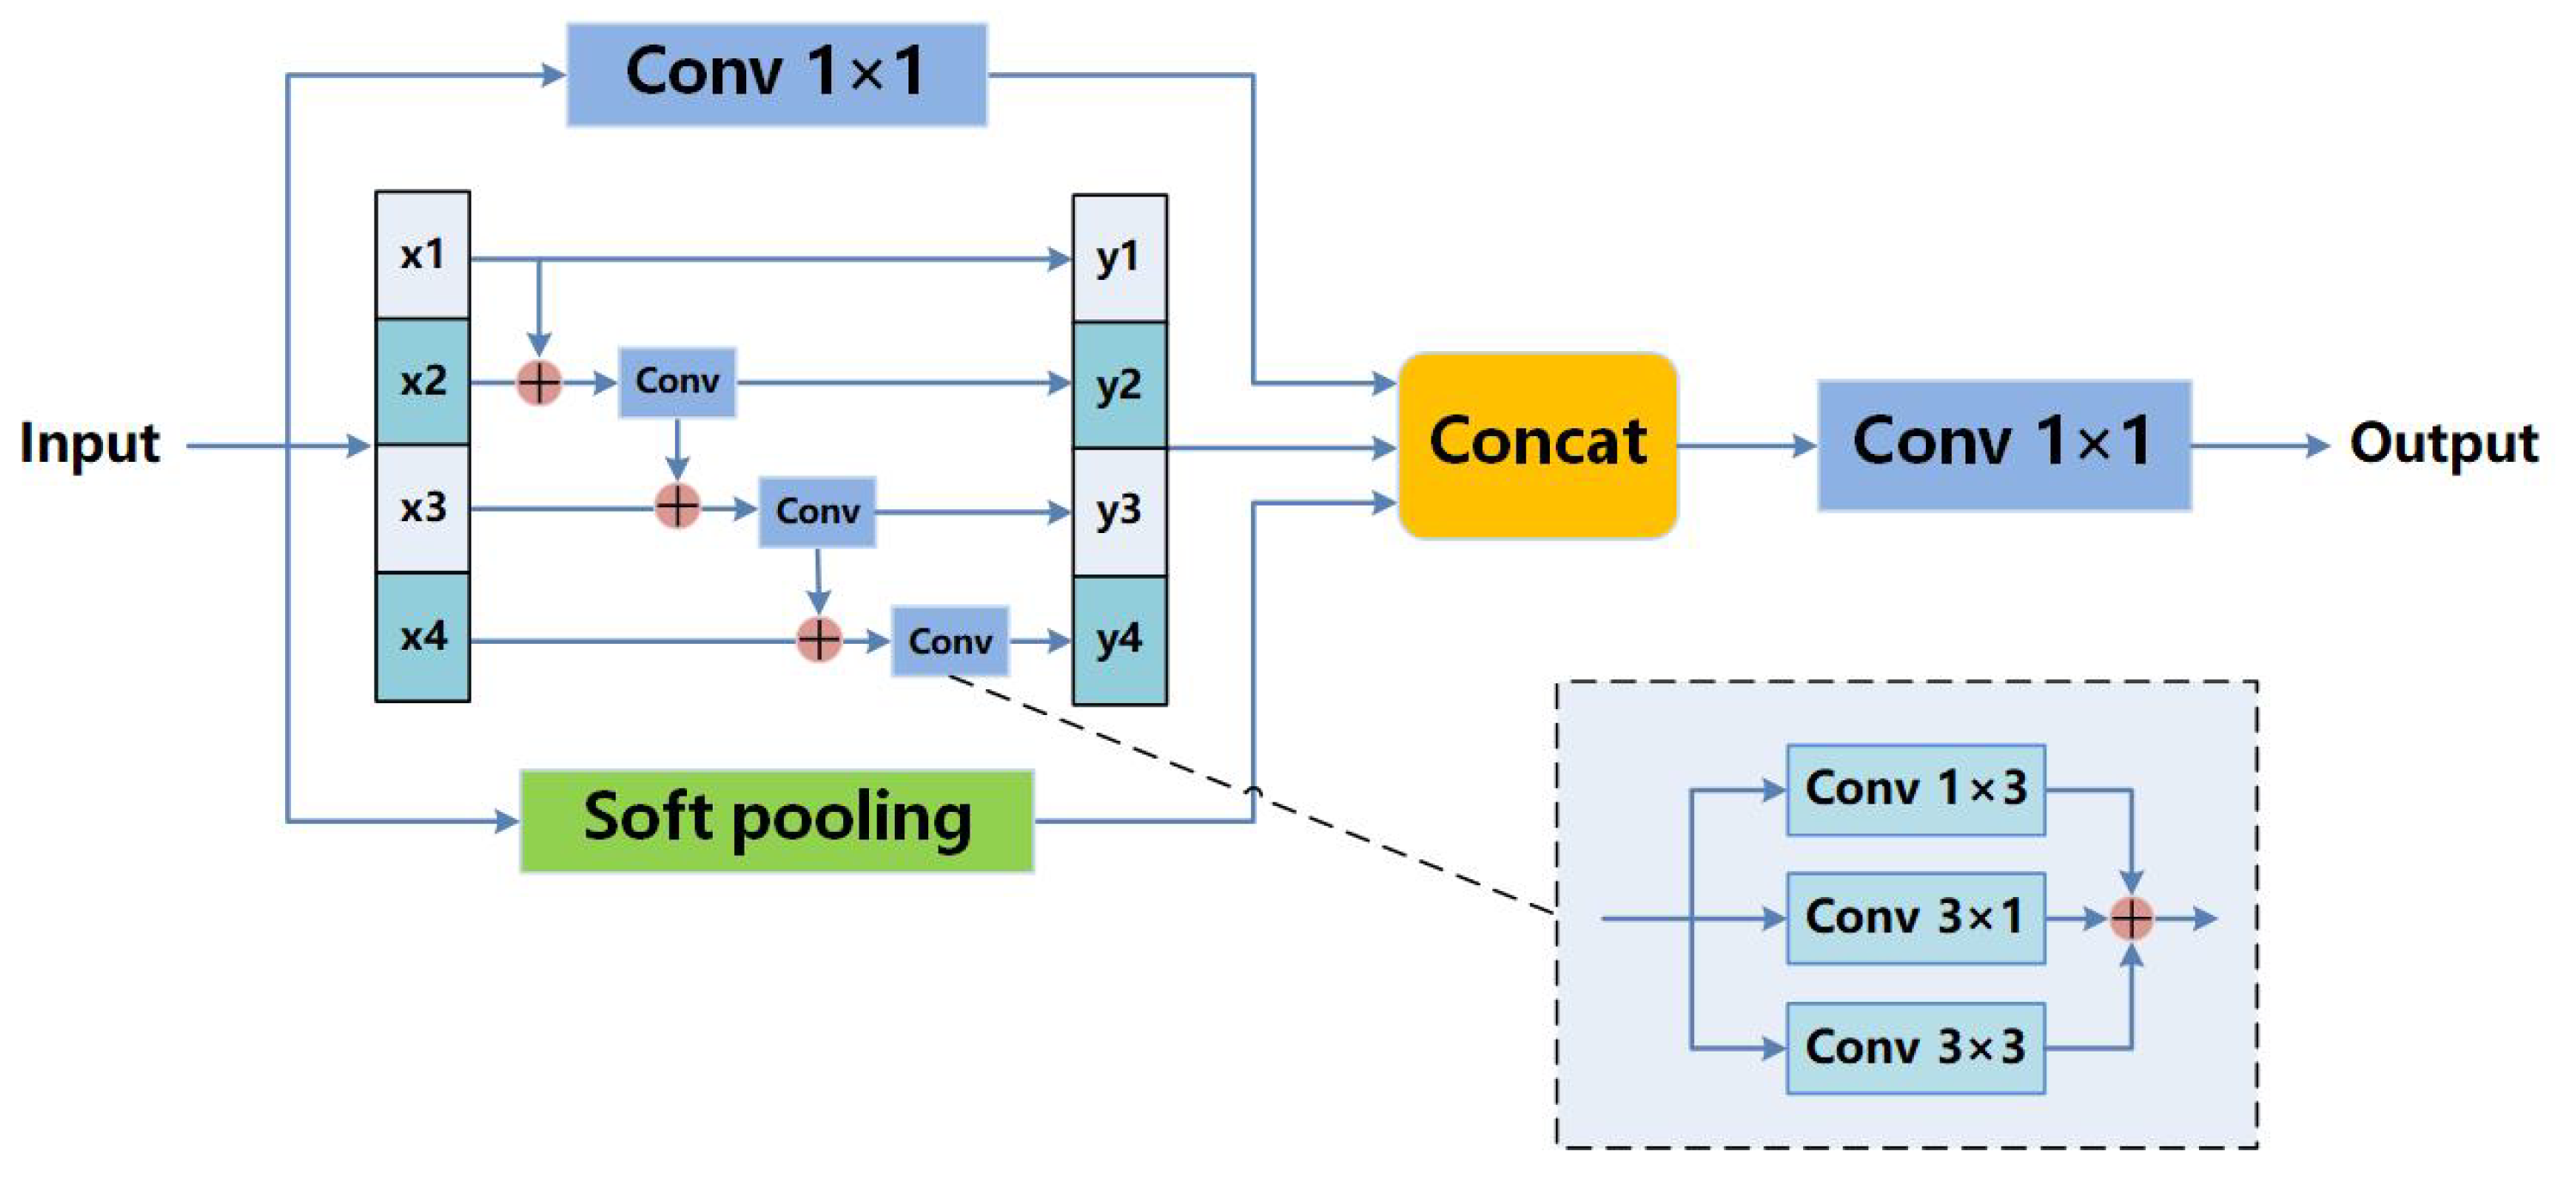
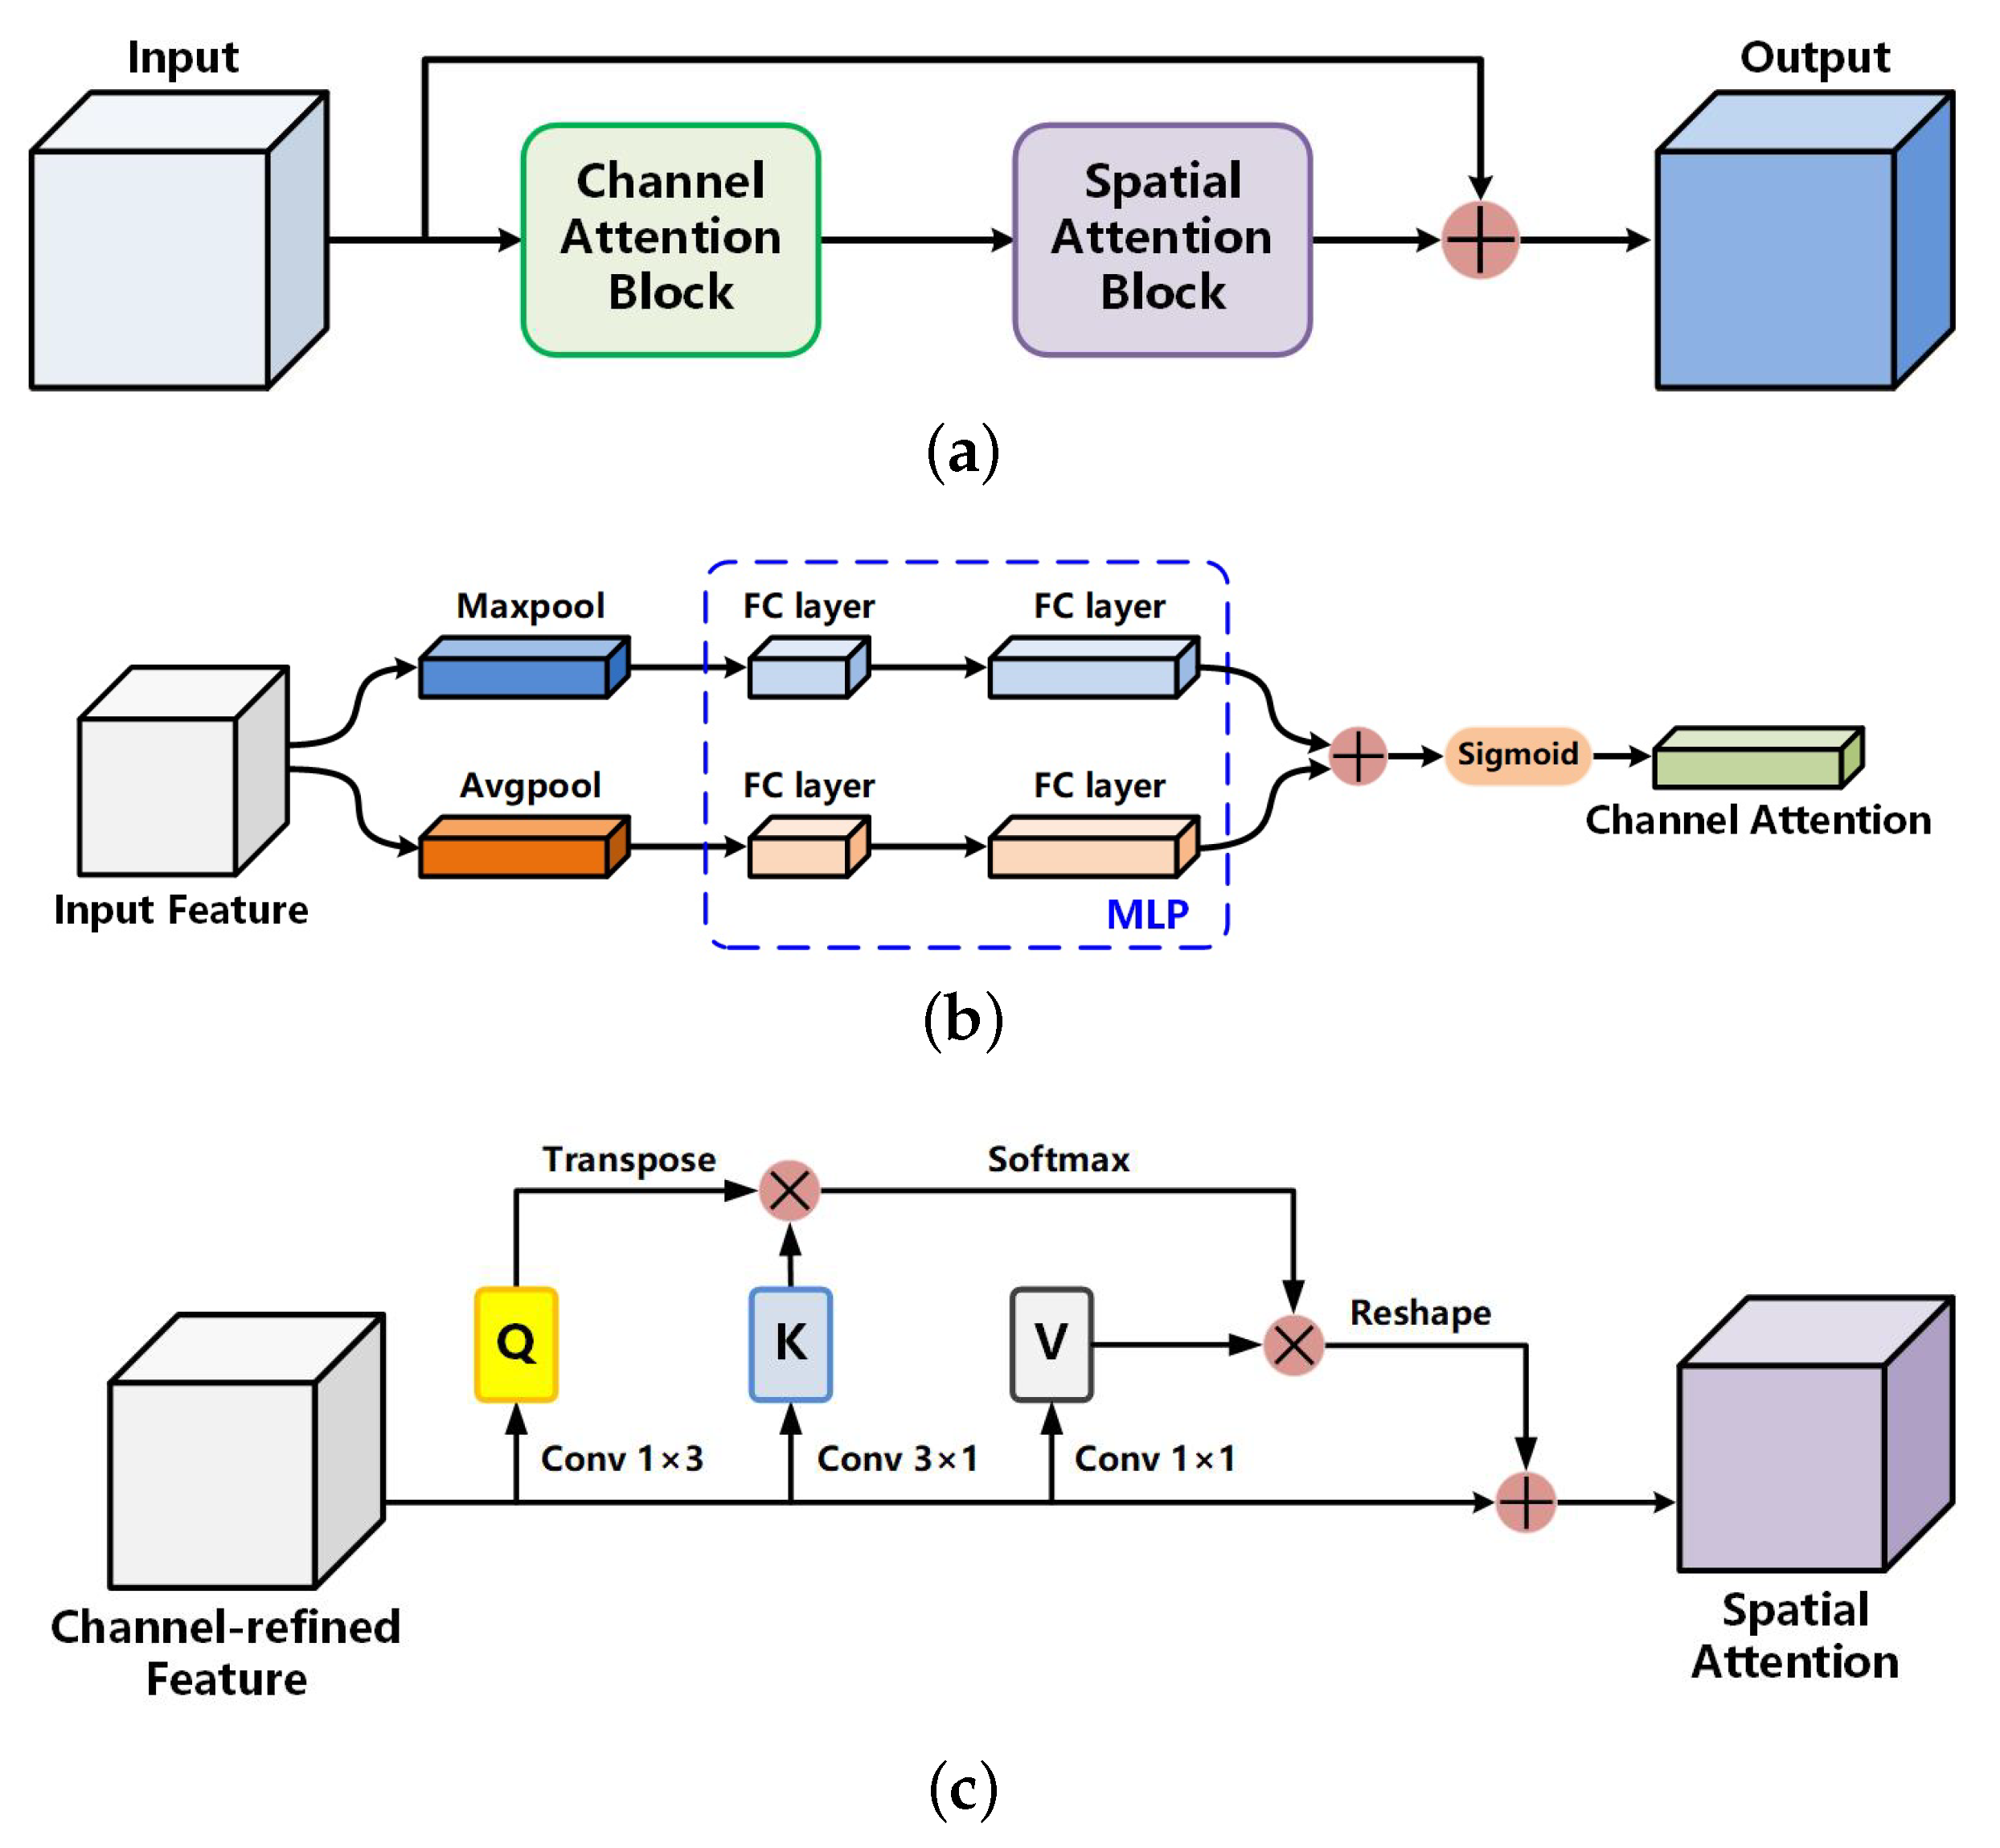
Between the encoding and decoding paths, we use a channel and spatial attention block (CSAB) and a multi-scale capture block (MSCB). The CSAB combines channel and spatial attention to enhance the lesion area and compress irrelevant features from hairs and bubbles while maintaining a small overhead. In addition, the CSAB makes the network more sensitive to the edge of the lesion. The boundary with weak contrast can be recognized more accurately. The MSCB captures the image features in a multi-scale way to extract the global and local information of skin lesions. Instead of using atrous convolution to increase the receptive field, we adopt hierarchical residual-like connections within a single residual block. Multi-scale features flows at a granular level and the range of receptive fields will be increased through the residual block. In this way, the MSCB solves the problem of information loss in the atrous convolution. We also introduce soft pooling as a branch of MSCB. Soft pooling combines the advantages of max pooling and average pooling. Compared with traditional average pooling branch in widely used ASPP, the softpooling branch can retain more semantic information. The serial placement of the two modules can effectively extract features of skin lesions with different sizes, shapes, edges, and colors.
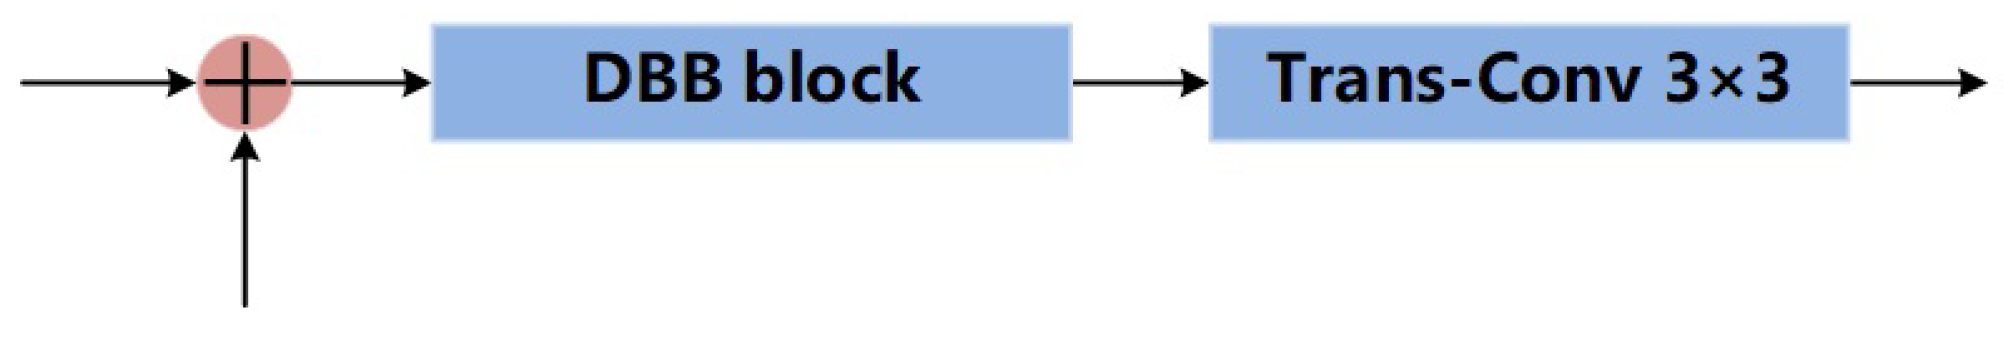
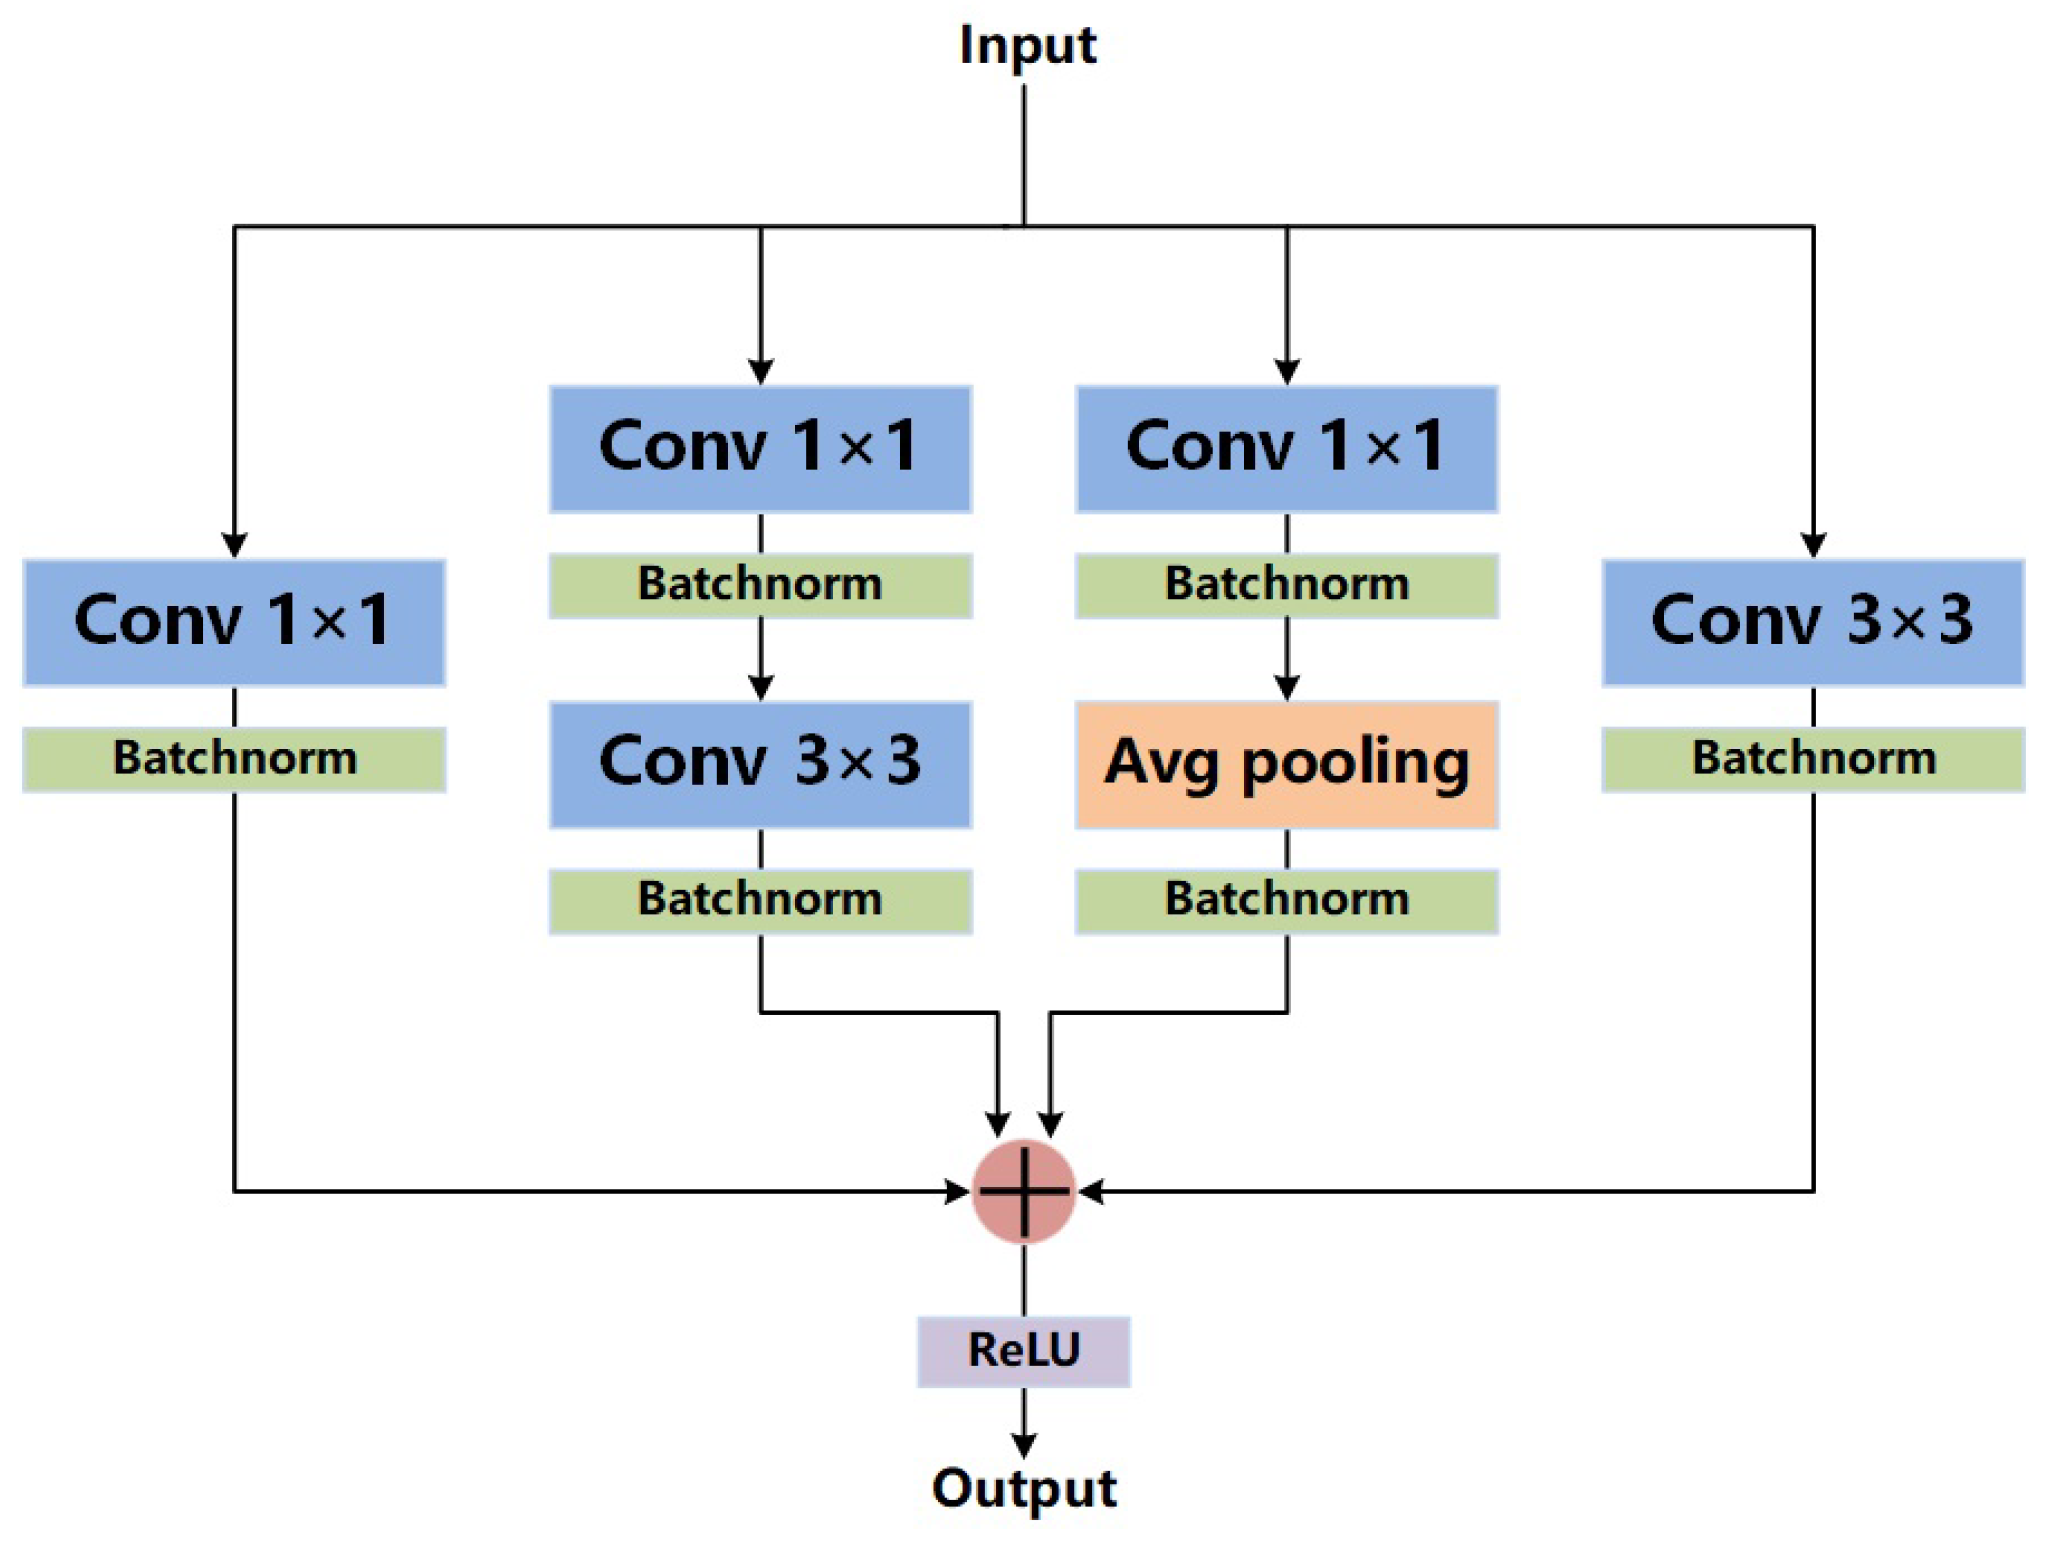
We optimize the decoding path with diverse branch blocks (DBBs) [18] to enhance the feature restoration capacity. Many previous studies focused on improving the encoding path, skip connections, and the bottom of the network. Only a few improvements were made to the decoding path. In our study, we replace every traditional 3 × 3 convolution by a DBB. Inspired by the Inception [19] module, a DBB contains four branches, including average pooling and multi-scale convolution. Each branch contains different receptive fields and computational complexity, which can greatly enrich the feature space of the whole decoding path.
Compared with state-of-the-art medical image segmentation networks and skin lesion segmentation methods, Res-CDD-Net achieves superior performance on ISIC-2016 [20], ISIC-2017 [21], and PH2 [22] skin lesion datasets. Moreover, its training is much faster than other approaches. Only 2 h are approximately required on ISIC-2017. Overall, the main contributions of this study can be summarized as follows:
(1) We propose a U-shaped network combined attention and multi-scale mechanisms to enhance the skin lesion segmentation accuracy. These two modules overcome the challenges in dermoscopic imaging.
(2) The decoding path of the network is optimized by DBBs to make the network robust and effective.
(3) A new loss function is adopted to alleviate the affect of the uneven proportion between positive and negative samples.
(4) Comprehensive experiments show that our network achieves outstanding performance and fast training process compared with state-of-art methods.
The remainder of the paper is structured as follows:
Section 2 reviews previous studies related to the methods we adopted. Section 3 provides detailed information about the proposed Res-CDD-Net. Section 4 focuses on the experiments with Res-CDD-Net by comparing this network with other state-of-the-art methods. Section 5 is devoted to discussion, and Section 6 concludes the paper.

2. Related Works

2.1. Medical Image Segmentation Using Convolutional Neural Networks

With the development of artificial intelligence, convolutional neural networks have been gradually applied for medical image segmentation. In 2015, Ronneberger et al. [23] proposed U-Net, a novel end-to-end semantic segmentation network. U-Net is a U-shaped symmetric encoding–decoding network. It employs skip connections to fuse high-level and low-level semantic features. Gu et al. [24] proposed CE-Net. In this network, a dense atrous convolution block and a residual multi-kernel pooling block were inserted between the encoding and decoding paths to effectively utilize spatial information. CE-Net achieves 95.5% accuracy in retinal vessel segmentation and 99.0% accuracy in lung segmentation. Xiang et al. [25] proposed BiO-Net. They creatively added a reverse connection from the decoding path to the encoding path at each layer of U-Net, so that the data flows in a circular way to improve the performance without introducing additional parameters. Compared with U-Net, BiO-Net achieves 2% and 19.2% IoU improvements using MoNuSeg and TNBC dataset, respectively. Aiming at fusing semantically dissimilar features between the encoder and decoder feature maps, Zunair et al. [26] proposed Sharp U-Net, which includes a sharpening filter layer at the skip connection. A sharpening kernel filter is a depth-wise convolution that produces a sharpened intermediate feature map of the same size as the encoder map. Experiments on six medical image datasets, including Lung Segmentation, Data Science Bowl 2018, ISIC-2018 [27], COVID-19 CT Segmentation, ISBI-2012, and CVC-ClinicDB, show that Sharp U-Net performs better than U-Net without additional learnable parameters. Zhou et al. [28] proposed UNet++. They used a series of nested and dense skip paths to connect the encoder and decoder sub-networks based on the U-Net framework, which further reduced the semantic relationship between the encoder and decoder and achieves better performance in liver segmentation tasks.

2.2. Attention Mechanism

In deep learning, an attention mechanism implies that high weights are allocated to integral pieces of information whereas low weights are allocated to irrelevant pieces of information. The weights can be adjusted in different situations. As a result, attention mechanisms exhibit high scalability and robustness [29].
In the field of medical image segmentation, Oktay et al. [30] proposed Attention U-Net. A new attentional gate (AG) network for medical image processing that can automatically learn structures of different shapes and sizes, suppress irrelevant features, and highlight useful features. In multi-class CT abdominal segmentation, Attention U-Net achieves at most 4% improvement in Dice coefficient compared with U-Net. Li et al. [31] designed attention gate units (AGUs). An AGU with bottleneck structure can fuse high-level semantic features to low-level and mid-level features to achieve accurate pixel-wise predictions. However, the AGU is designed based on FCN rather than U-Net. This limits its application and results in modest performance improvement. Woo et al. [32] proposed the convolutional block attention module (CBAM). Given an intermediate feature map, the CBAM deduces two independent dimensions of channel and space sequentially. Then, the attention map is multiplied pixel-wise with the input feature map for adaptive feature refinement. Nevertheless, the CBAM does not necessarily improve the performance. It should make a comprehensive consideration according to the dataset, the network structure and other factors.
It is worth noting that Transformer has been widely used in medical image segmentation since 2021. The self-attention module in Tranformer captures long-range dependency, while convolution only gathers information from neighborhood pixels. TransUNet [33], Swin-Unet [34], and UTNet [35] are all state-of-the-art medical image segmentation networks based on Transformer. However, Transformer requires many hours of training on large datasets to accomplish satisfactory results. The small scale of medical image datasets brings difficulties for the application of Transformer in medical imaging.
In conclusion, embedding the appropriate attention module in the appropriate position of the network for skin lesion segmentation can reduce the impact of irrelevant pieces of information, such as hairs and bubbles, to obtain more accurate segmentation results.

2.3. Multi-Scale Feature Fusion

In the process of feature extraction, shallow layers contain small receptive fields to represent geometric details, and deep layers contain large receptive fields to represent semantic information. To make full use of image features extracted from both deep and shallow networks, a common solution is multi-scale feature fusion.
In semantic segmentation, parallel multi-branch structures are usually adopted to fuse receptive fields of different scales. Zhao et al. [9] proposed the spatial pyramid pooling module. For feature maps generated from the encoding path, four different-size pooling kernels are adopted for average pooling. Then, their channels are all reduced to 1. Finally, they are upsampled to the same size as that before average pooling and concatenated with the initial feature map in the channel dimension. Chen et al. [36] introduced ASPP in DeepLab v2. This module was adopted to expand the receptive field through dilation convolution to adapt the kernel size by adjusting the dilation rate. The four feature maps convoluted with different dilation rates are summed to realize multi-scale feature fusion. Chen et al. conducted further research on the basis of their previous studies. They successively proposed two networks, named DeepLab v3 [37] and DeepLab v3+ [38]. In DeepLab v3, a newly designed ASPP module with multi-scale atrous convolution was adopted to capture multi-scale features [37]. In DeepLab v3+, the pre-trained Xception network was adopted as the feature extraction module to increase the network speed and improve performance [14]. DeepLab v3+ achieves an mIoU of 89.0% on the Pascal VOC dataset.
For skin lesion images, some images contain larger lesion areas, while others contain smaller lesion areas. Multi-scale feature fusion can assist the network in extracting the features from lesions of different sizes. Unlike ASPP, the proposed multi-scale feature fusion module in our network uses a different mechanism to adjust the kernel size. We discuss this in detail in Section 3.4.

2.4. Branch Fusion in Convolution

Given that convolution is a linear transformation, it satisfies associativity and distributivity, meaning that multiple convolution operations can be combined into a single convolution operation. Multi-branch convolution merging belongs to associativity. Serial convolution merging belongs to distributivity.
Based on the above theories, Ding et al. [15] proposed a novel convolutional structure named asymmetric convolution kernel. In this structure, results from three parallel branches including convolutions with kernel sizes 3 × 3, 1 × 3, and 3 × 1 are summed as the output. The trained parameters can be fused into the form of the original 3 × 3 convolution kernel without extra inference time.
Ding et al. [18] conducted further studies on the basis of asymmetric convolution blocks. Given that convolution, batch normalization, and average pooling are linear transformations, they can be combined. Based on the above properties, Ding et al. [18] designed the DBB, which is similar to Inception [19,39,40], to expand the feature space of convolutional blocks. A DBB includes a 1 × 1 branch, a 1 × 1-K × K branch, a 1 × 1-average pooling branch, and a K × K branch. The results from the four branches are summed as the output. This module can be equivalently converted to a K × K convolution. For accuracy, DBB improves VGG-16 on CIFAR-10 and CIFAR-100 by 0.67% and 1.67%, AlexNet on ImageNet by 1.96%, MobileNet by 0.99%, and ResNet-18/50 by 1.45%/0.57%, respectively. The results from ablation experiments show that each branch can improve the performance of the network.
Note that if we embed DBBs in our network, we will undoubtedly attain more accurate segmentation results. Given that our network performs pixel-wise classification tasks, we can adopt DBBs in the decoding path to improve the feature restoration capability of the network.

3. Proposed Methods

In this section, we first introduce the overall structure of the proposed Res-CDD-Net, and then go through the details of each module.

3.1. Overall Structure of the Network

Figure 2 shows the overall structure of Res-CDD-Net. It can be clearly seen that the network consists of an encoding path, an intermediate path, and a decoding path. We adopt ResNeXt50 [17] pre-trained on the ImageNet dataset as the encoding path. The intermediate path is composed of two parts, namely the CSAB, which integrates channel and spatial attention, and the MSCB, which extracts multi-scale information. Different from the decoding path of U-Net, all traditional 3 × 3 convolution kernels are replaced by DBBs [18]. Transpose convolution follows DBB for upsampling. Between the encoding and decoding paths, skip connections are inserted to transmit data.

3.2. Encoding Path

ResNet [13] effectively solves the problem of gradient disappearance or gradient explosion in a deep neural network by introducing a residual structure. Inspired by GoogLenet [19], Xie et al. [15] introduced the Inception block into ResNet to generate ResNeXt. Different from Inception v4 [38], there are no manual-design intricate details such as the Inception architecture in ResNeXt. Each of its branches presents an identical topological structure. The rationale of ResNeXt is exploiting group convolution, which can control the number of groups. Group convolution is a compromise scheme between ordinary and deeply separable convolutions that leads to a number of channels n ( n > 1 ) in the feature map generated by each branch.
As shown in Figure 3, each module in ResNet50 is divided into 32 groups of convolutional paths. Assuming that the input number of channels is 256, the number of channels in each group of paths is first reduced to 4 through 1 × 1 convolution. After a 3 × 3 convolution, it is set back to 256 through a 1 × 1 convolution. Finally, the results obtained from 32 groups are summed. The whole process is equivalent to the convolution shown in Figure 3b. Interestingly, Pytorch provides ResNeXt weights trained on the ImageNet dataset. ImageNet is currently the largest database for image recognition in the world. It contains far more images than the skin lesion datasets. Pre-loading the weight data can make the Dice coefficient and Jaccard index on the validation set 3–4% higher at the beginning of training.

3.3. Channel and Spatial Attention Block

As shown in Figure 4a, we introduce the CSAB inspired by Woo et al. [32] and Mou et al. [41]. Note that placing this block at each level of the encoding path increases the computation cost and provides a limited performance. CSAB is placed between the encoding and decoding paths rather than in the encoding path. It can be clearly seen that CSAB has a residual structure. First, the input feature map is sent into the channel attention block. The size of output is restored to the same as the input. Then, the result is sent into the spatial attention block. The output conducts pixel-wise addition with the original input feature map to obtain the final result. The above process can be summarized as follows:
F = O c F
F = O s F + F
where F R C × H × W is the input feature map (C is the number of channels, H is the height, and W is the width); O c is channel attention operation; O s is spatial attention operation; the operator + represents element-wise addition; F is the intermediate output; and F is the final output.
The structure of the channel attention block (CAB) is shown in Figure 4b. CAB aims to make the network pay attention to integral features and suppress unnecessary features such as hairs, measuring scales, blood vessels, and air bubbles. For each channel of the input feature map, CAB performs global maximum pooling and global average pooling, respectively, to obtain two vectors of shape R C × 1 × 1 . Then, both vectors are sent into the multi-layer perceptron (MLP) with shared weights to reduce the number of parameters. The MLP contains only one hidden layer whose weight vector shape is R C / r × 1 × 1 (where r represents the reduction ratio, which we set to 16). The MLP can be implemented through two fully connected layers, resulting in two processed channel attention vectors. Finally, pixel-wise addition between the two vectors and the sigmoid activation function processing is carried out. The feature map size is restored to the same size as that of the input feature map. The above process can be summarized as follows:
O c ( F ) = σ ( M L P ( A v g P o o l ( F ) ) + M L P ( M a x P o o l ( F ) ) ) = σ ( W 1 ( W 0 ( F a v g c ) ) + W 1 ( W 0 ( F m a x c ) ) )
where F is the input feature map; σ represents the sigmoid activation function; F a v g c and F m a x c represent the feature maps following global average pooling and global max pooling in the channel dimension, respectively; and W 0 R C / r × C and W 1 R C × C / r are the weights of the M L P .
The spatial attention block (SAB) is the supplement of the CAB. Its structure is shown in Figure 4c. Different from the CAB, the SAB can capture long range dependencies to gain a global contextual view and selectively aggregate context information according to the spatial attention map to achieve a more accurate segmentation performance for skin lesion boundaries. The SAB is more sensitive to the edges of lesions that are similar in color to the surrounding skin. Meanwhile, the curvilinear structure features of edges can be extracted effectively. For the input feature map F R C × H × W , a 3 × 1 and a 1 × 3 convolutions are performed to generate two new feature maps Q y R C × H × W , and K x R C × H × W , respectively, where C is the number of channels, H is the height, W is the width, and Q y and K x represent the features of the curvilinear structures captured in the vertical and horizontal directions. These two new feature maps are then reshaped to R C × N , where N = H × W is the number of features. In consequence, the intra-class spatial association can be obtained by applying a softmax layer on the matrix multiplication of the transpose of Q and K, as:
S ( x , y ) = e x p ( Q y T · K x ) x = 1 N e x p ( Q y T · K x )
where S ( x , y ) denotes the yth position’s impact on the xth position.
Meanwhile, another new feature V R C × H × W is obtained by applying a 1 × 1 convolution on the input features, and it is reshaped to R C × N , which is then used to perform a matrix multiplication with S ( x , y ) to obtain the attention enhanced features. Finally, it is reshaped to R C × H × W , and we perform channel-wise addition with the input over each pixel to construct the output of SAB.

3.4. Multi-Scale Capture Block

In dermoscopic images, the proportion of the skin lesion area in each image is different. Some lesions are large while others are small. Owing to the complexity and variability of skin lesions, using only 3 × 3 convolution kernels cannot capture multi-scale features, but does capture local and invalid features, which are detrimental for accurate skin lesion prediction. Moreover, it must be emphasized that large dilation rates in ASPP are far from suitable for dermoscopy images because using large dilation rates will extract excessive useless information as well as discard useful information. A number of unclear edges and missing segmentation areas will appear. So, we propose the MSCB illuminated by DeepLab v3 [37] and Res2Net [42]. The MSCB allows for more detailed multi-scale features extraction without introducing a large number of parameters. The structure of the MSCB is shown in Figure 5. A 1 × 1 convolution, a bottleneck block, and a global soft pooling are carried out in parallel to capture multi-scale information.
The bottleneck block has a hierarchical residual-like style structure. The input feature map is evenly split into 4 feature map subsets denoted by x i , where i { 1 , 2 , 3 , 4 } . Each feature subset x i has the same spatial size, but 1/4 number of channels compared with the input feature map. Except for x 1 , each x i has a corresponding convolution, denoted by K i ( ) , and y i is the output of K i ( ) . K i ( ) is the sum of three convolution operations with 1 × 3, 3 × 1, and 3 × 3 kernels, respectively. Compared with a single 3 × 3 kernel, the new operation extracts richer details. Besides, image flipping is a necessary step when we perform data enhancement. Horizontal kernels like 1 × 3 are more robust to up–down flipping, and vertical kernels of 3 × 1 are more robust to left–right flipping. The feature subset x i is added with the output of K i 1 ( ) , and then fed into K i ( ) . At last, y 1 to y 4 are concatenated together. Every y i can be written as follows:
y 1 = x 1 y 2 = K 2 ( x 2 + y 1 ) y 3 = K 3 ( x 3 + y 2 ) y 4 = K 4 ( x 4 + y 3 )
Traditional average pooling in ASPP decreases the effect of all activations in the pooling kernel. Meanwhile, max pooling selects the single highest activation in the pooling kernel. The above two pooling operations lead to mass information loss. As a different pooling method, soft pooling can retain more information in the reduced activation maps. Soft pooling is a more balanced approach than simply selecting the average or maximum. In soft pooling, all activations contribute to the final output while higher activations are more dominant compared to lower ones. In kernel region R ( | R | = 2 × 2 ) , each activation a i with index i is applied a weight that is calculated as the ratio of the natural exponent of that activation with respect to the sum of the natural exponents of all activations within neighborhood R. The output value of a ˜ is produced through a standard summation of all weighted activations within the kernel neighborhood R. The above can be summarized as follows:
a ˜ = i R e a i j R e a j × a i
Subsequently, the results obtained by three groups of operations are concatenated together, followed by a 1 × 1 convolution to reduce the dimensions. After global soft pooling, the size of the feature map is compressed to 1 × 1. Before concatenation, the feature map after global soft pooling will be restored to the original size through upsampling.

3.5. Decoding Module

In the study by Ding et al. [18], all the traditional K × K convolution kernels in the backbone network are equivalently replaced by DBBs in the training stage. After training, branch fusion is carried out to fuse the trained parameters into the parameters of traditional K × K convolution kernels equivalently. Therefore, the calculation time is the same as that resulting from using the K × K convolution kernel during the test phase. We set the value of K to 3 in this study. Different from Ding et al. [18], we do not carry out branch fusion of parameters in the test phase. The first reason is that the size of the skin lesion dataset is small. The second reason is that the DBB is only employed in the decoding path.
Finally, we redesign the decoding path. Its structure is shown in Figure 6. First, the upsampled feature map and the feature map transmitted from skip connection are obtained by pixel-wise addition. Then, the feature map is fed into the DBB. The result is upsampled by transposed convolution. As shown in Figure 7, there are 4 branches in a DBB. The first branch is a 1 × 1 convolution, the second branch is a 1 × 1 convolution followed by a 3 × 3 convolution, the third branch is a 1 × 1 convolution followed by a 3 × 3 average pooling, and the fourth branch is a 3 × 3 convolution. Note that each convolution or pooling operation is followed by batch normalization. Finally, the results of the four branches are summed. The output is obtained through the ReLU activation function.

3.6. Loss Function

The cross-entropy loss function is commonly used in semantic segmentation. However, in skin lesion segmentation, the lesion area is much smaller than the normal area, resulting in an extremely uneven proportion of positive and negative samples. If we only adopt the cross-entropy loss function during training, the segmentation results will be unsatisfactory. In this study, we design a new loss function combining dice loss and binary cross-entropy loss to solve the above problems. The new loss function can effectively alleviate the unbalance between positive and negative samples as follows:
L o s s = B C E L o s s + α D i c e L o s s
where B C E L o s s represents the binary cross-entropy loss function; D i c e L o s s represents the dice loss function; and α is an adjustable weight coefficient, set to 0.5 in this study.
The binary cross-entropy loss function is expressed as follows:
B C E L o s s = [ y l o g y ^ + ( 1 y ) l o g ( 1 y ^ ) ]
where y represents the actual proportion of positive samples (the proportion of lesion area in the ground-truth image), 1 y represents the actual proportion of negative samples (the proportion of non-lesion area in the ground-truth image), and y ^ and 1 y ^ represent the proportion of positive and negative samples in the segmentation result.
The dice loss function is described as follows:
D i c e L o s s = 1 D i c e C o e f f i c i e n t = 1 2 X Y X + Y
where X represents a positive sample region (lesion area in ground truth) and Y represents a negative sample region (lesion area in the segmentation result).

3.7. Evaluation Indexes

For fully measuring the network performance, we adopt five evaluation indexes officially provided by ISIC, namely accuracy (AC), sensitivity (SE), specificity (SP), Dice coefficient (DC), and Jaccard index (JC). Their calculation formulas are as follows:
A C = T P + T N T P + T N + F P + F N
S E = T P T P + F N
S P = T N T N + F P
D C = 2 × T P 2 × T P + F N + F P
J C = T P T P + F P + F N
where T P represents true positive pixels (lesion area), T N represents true negative pixels (background area), F P represents false positive pixels (misjudged areas of lesion), and F N represents false negative pixels (misjudged background areas). Accuracy is the evaluation of the overall pixel-wise segmentation performance [43]. Sensitivity indicates the proportion of skin lesion pixels that are correctly segmented [43]. Specificity is defined as the proportion of correctly segmented non-lesion pixels [28]. The Dice coefficient is defined as the double overlapping area of the segmentation result and ground truth divided by the sum of the segmentation result and ground truth. The Jaccard index is the ratio of intersection and union between the segmentation result and ground truth.

4. Experiments and Results

4.1. Dataset and Dataset Preprocessing

In this study, we made use of three skin lesion datasets, namely ISIC-2016 [20], ISIC-2017 [21], and PH2 [22].
International Skin Imaging Collaboration (ISIC) is currently the world’s largest skin lesion image dataset, providing professionally annotated digital skin lesion images to facilitate the development of CAD for melanoma and other skin diseases [21]. The PH2 [22] dataset was jointly collected by Hospital Pedro Hispano in Matosinhos, Portugal, and the Dermatological Services department of the University of Porto [22].
The ISIC-2016 [20] dataset is officially divided into 900 images for training and 379 images for testing, with a resolution ranging from 576 × 768 to 2848 × 4288 pixels. The ISIC-2017 [21] dataset is divided into 2000 images for training, 150 images for validation, and 600 images for testing, with a resolution ranging from 540 × 722 to 4499 × 6748 pixels. The PH2 [22] dataset consists of 200 images with a resolution of 576 × 768 pixels. It includes 80 common nevi, 80 atypical nevi, and 40 melanomas. The raw images of the three datasets are all 8-bit RGB dermoscopic images. The corresponding ground-truth images are single-channel grayscale images. Table 1 lists our partition of experimental datasets. Note that the relatively new ISIC-2018 [27] dataset was not adopted. Because this dataset incorporates only a few extra images with respect to the ISIC-2017 [21] dataset and the ground truth of its testing set has not been released yet.
Owing to the different image sizes, sending them directly into the network for training would demand a lot of computing resources, resulting in low training efficiency. Therefore, the size of all pictures was uniformly adjusted to 192 × 256 in this study. In addition, to strengthen the robustness of the network, data enhancement with a probability of 0.5 was conducted on the training set, including horizontal and vertical flips, rotation degree from −45 to 45, brightness set to 0.2, contrast set to 0.2, and hue set to 0.02.

4.2. Experimental Environment

The experiments were implemented in Pytorch 1.8.1. The Python version was 3.7.5. The operating system was Ubuntu 20.04. All experiments were run on a computer featuring an AMD Ryzen 3600 CPU, 16 GB RAM, and an NVIDIA GeForce RTX 3070 with 8 GB memory. The number of training epochs was set to 150. The initial learning rate was set to 0.0002. The learning rate fell by half every 20 epochs. We adopted the Adam optimizer with momentum β 1 = 0.5 , β 2 = 0.999 , and the batch size was set to 8.

4.3. Experiment Results

We ran the proposed Res-CDD-Net as well as several mainstream medical image segmentation networks on the three datasets mentioned above. Then, we displayed the segmentation results. Most of the experimental configurations of the networks used for comparison were the same as that used for Res-CDD-Net. Some configurations were finely tuned according to the network structures. Table 2 shows the details of the configurations for different networks.

4.3.1. Comparison on the ISIC-2017 Dataset

We first adopted the ISIC-2017 [21] dataset for training and testing. The ISIC-2017 [21] dataset contains a relatively large number of images, including many hard-to-segment ones. Hence, the associated results are the most convincing among the three datasets considered. Table 3 provides a quantitative comparison of the segmentation performance between the proposed network and other mainstream networks. Table 4 lists the testing results of our method and other advanced methods on the ISIC-2017 [21] dataset. Table 5 shows configurations of methods listed in Table 4. Figure 8 shows the visual output of partial segmentation results. In addition, to intuitively present the convergence process of both our network and U-Net during training, Figure 9 shows the dice coefficient curves and Jaccard index curves on the training and validation sets for each epoch. Note that the proposed network achieves satisfactory results, especially in the two core evaluation indexes, i.e., the Dice coefficient and the Jaccard index. They are significantly higher than those of mainstream networks. In particular, the Dice coefficient is 6.90% higher than that of U-Net and the Jaccard index is 10.84% higher than that of U-Net.
In particular, we used the recent Transformer-based medical image segmentation network, including TransUNet [33], Swin-Unet [34], and UTNet [35] to the comparison. The backbones of TransUNet and Swin-Unet were loaded with pre-trained weights on the ImageNet dataset. Note that the proposed method performs better when it comes to skin lesion segmentation.

4.3.2. Comparison on the ISIC-2016 Dataset

Next, we conducted an experiment on the ISIC-2016 [20] dataset. This dataset contains a small number of images, therefore the training time is shorter and the network converges faster. There is no validation set in the original ISIC-2016 [20] dataset. Regarding the convergence process, we randomly selected 200 images from the training set as the validation set, and the remaining 700 images constituted the training set. Table 6 provides a quantitative comparison of the segmentation performance between the proposed network and other mainstream networks. Figure 10 shows the visual output of partial segmentation results. Figure 11 depicts the Dice coefficient curves and Jaccard index curves on the training and validation sets for each epoch. Note that the evaluation indexes of the networks are relatively similar because the amount of data images is small. Hence, the network is likely to overfit. The sensitivity of the proposed network is slightly lower than others, which means that it performs poorly for images with large lesion areas. However, considering the five evaluation indexes as a whole, the proposed network still performs better than others.

4.3.3. Comparison on the PH2 Dataset

For the sake of testing the segmentation performance of the trained network on a new dataset, that is, for verifying the generalization and robustness of the proposed network, we conducted experiments on the PH2 [22] dataset. This dataset only contains 200 images. As a result, the training set of ISIC-2017 [21] was adopted for training, and all images in PH2 [22] were used for testing. Table 7 provides a quantitative comparison of the segmentation performance between the proposed network and other mainstream networks. Figure 12 shows the visual output of partial segmentation results. Compared with other networks, our network takes the lead in four out of five evaluation indexes, meaning that it exhibits higher pixel-wise segmentation performance. Note from the segmentation results in Figure 12 that Res-CDD-Net achieves a better segmentation result for large lesions. U-Net is often unable to segment the entire lesion area. The shape is notably different from that of the ground-truth image. The above results prove that the modules we successfully joined improve the performance as well as possess good generalization.

4.3.4. Ablation Experiments

To verify whether each module improves the performance of the network, we conducted ablation experiments on the ISIC-2017 [21] dataset. Table 8 shows the results in detail; in this table, baseline represents the network without the three modules mentioned above. The decoding path is a pre-trained ResNeXt50 [13] network. Aiming at the difficulties arising from different shapes, colors, blurred edges, and hair shades, all the newly added modules improve the performance. When the three modules are introduced into the network, the Dice coefficient and Jaccard index increase by 2.41% and 2.80%, respectively, with respect to the baseline, indicating that a reasonable combination of the modules improves the performance to a certain extent.
Subsequently, to verify whether the new loss function improves the segmentation performance, we conducted comparative experiments. The ISIC-2017 [21] dataset and the proposed Res-CDD-Net were used for experiments with four different loss functions. In addition to the new loss function, we also adopted the cross-entropy loss function, Dice loss function, and the 1:1 sum of the binary cross-entropy loss function and Dice loss function. Table 9 shows the experimental results. Note that the proposed network performs the best when the binary cross-entropy loss function is summed with the Dice loss function at a proportion 1:0.5. This means that the new loss function can effectively alleviate the uneven proportion of positive and negative samples.
Finally, Table 10 and Table 11 show the network complexity comparisons, where FLOPs represent floating-point operations and Params represent parameter numbers. The training time was calculated on the ISIC-2017 [21] dataset. Note that the three modules make the parameter numbers slightly increase while the training time presents no significant increase. Although the values of FLOPs and Params for Res-CDD-Net are relatively high with respect to other networks, the training time is the shortest.

5. Discussion

Rapid and accurate skin lesion segmentation greatly contributes to subsequent treatments of melanoma. Traditional methods cost time and energy. They are heavily reliant on tuning a large number of parameters. Based on this fact, we designed a U-shaped encoder–decoder network named Res-CDD-Net. First, the pre-trained ResNeXt50 network was adopted as the encoding path to provide abundant image features for the network. Thus, higher evaluation indexes can be achieved at the beginning of training and the inference of the network can be accelerated. Second, the CSAB was adopted to provide attention information in both channel and space dimensions to make the features cover the lesion itself, instead of focusing on irrelevant information such as hairs, bubbles, blood vessels, and measurement scales. In addition, the SAB in the module is more sensitive to the blurry edges. It can capture long range dependencies to gain a global contextual view to help the network achieve accurate segmentation for skin lesion boundaries. Third, the MSCB was inserted between the encoding and decoding paths to provide multi-scale semantic information for the network, which is of great help to identify lesions of different sizes. Unlike using large dilation rates in ASPP, the MSCB has a hierarchical residual-like structure to finely extract multi-scale information and avoid extracting excessive useless information. The soft pooling in MSCB can retain more information in the reduced activation maps. Finally, we optimized the decoding path. Traditional 3 × 3 convolutions in the decoding path were equivalently substituted by DBBs, which utilize the associative and distributive laws of convolution. Multi-branch and serial convolutions are thus fused together to greatly advance the feature space of the decoding path. It also enhances the robustness of the network.
In terms of the loss function, we introduced a weighted sum between the commonly adopted binary cross-entropy loss function and the Dice loss function to generate a new loss function so as to solve the problems resulting from an extremely uneven number of positive and negative samples. The performance resulting from using the new loss function is greater than that resulting from using the binary cross-entropy loss function when other configurations remain unaltered.
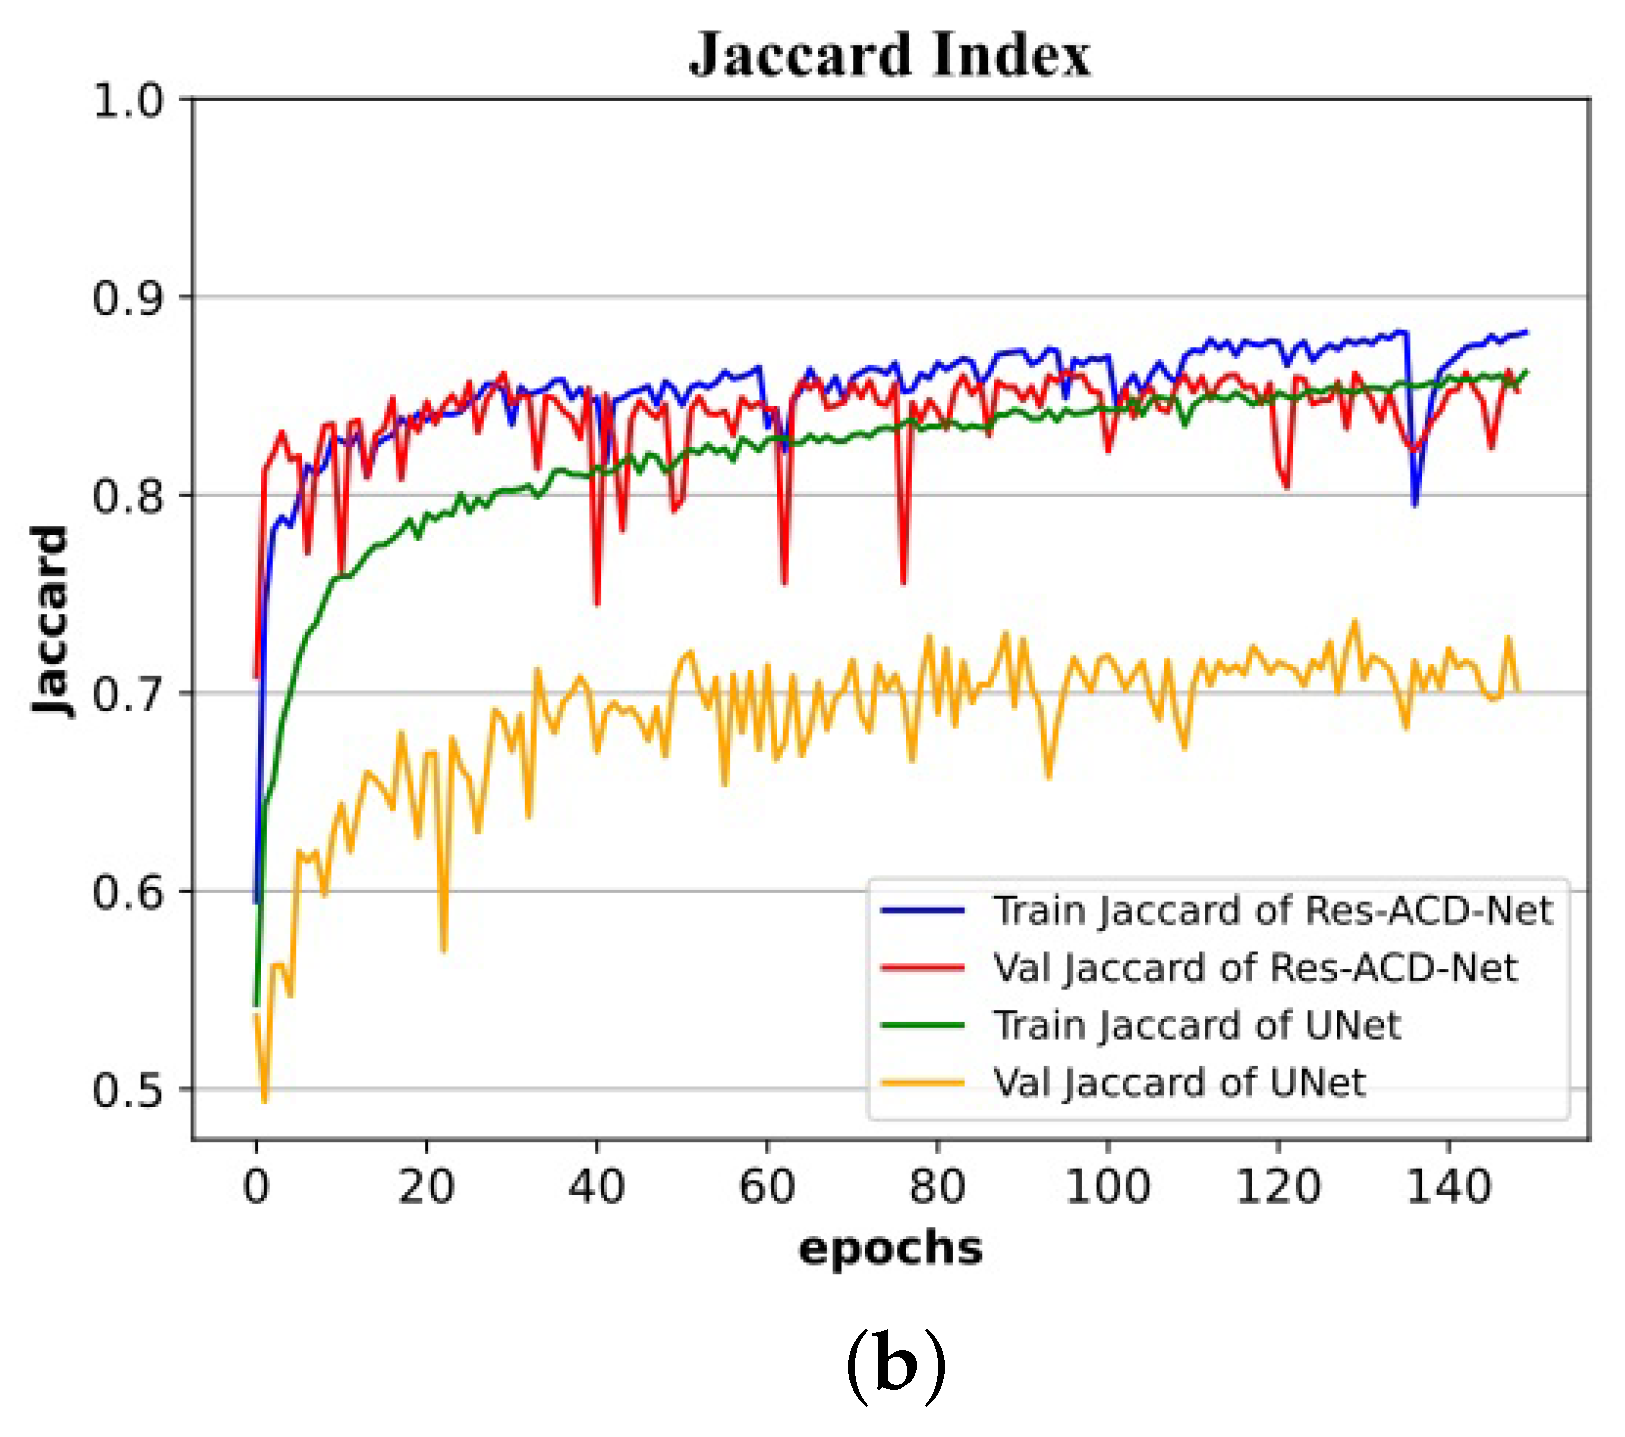
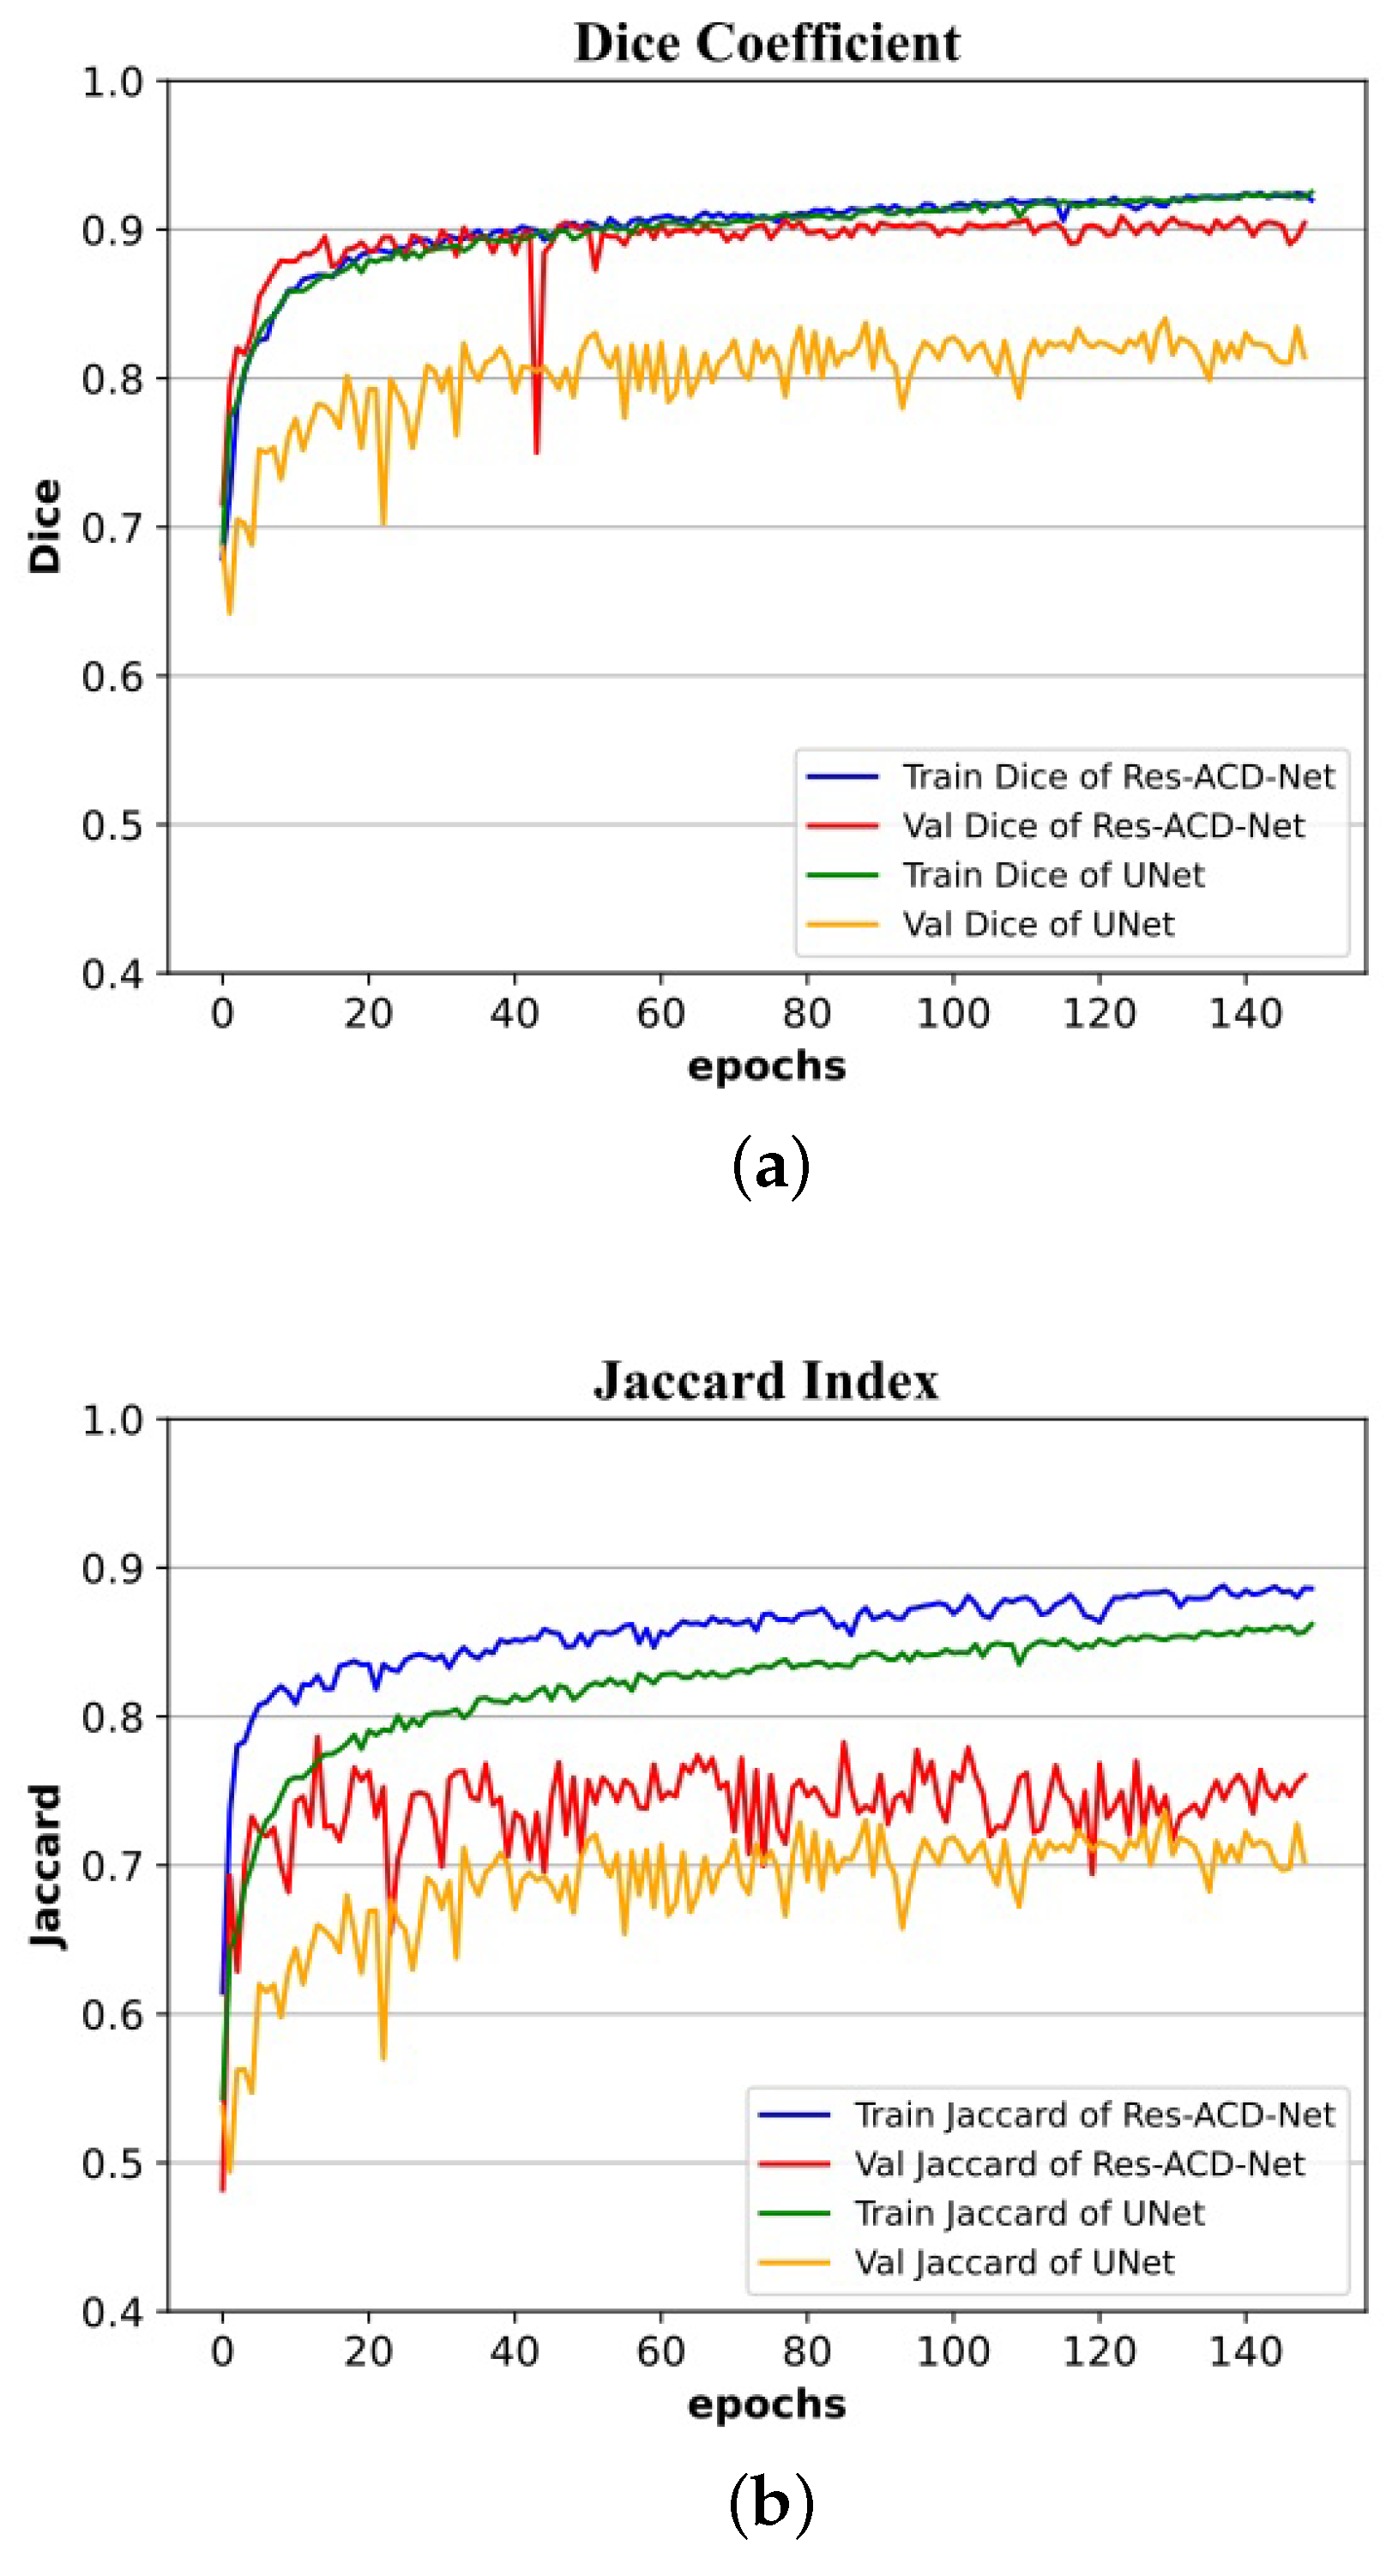
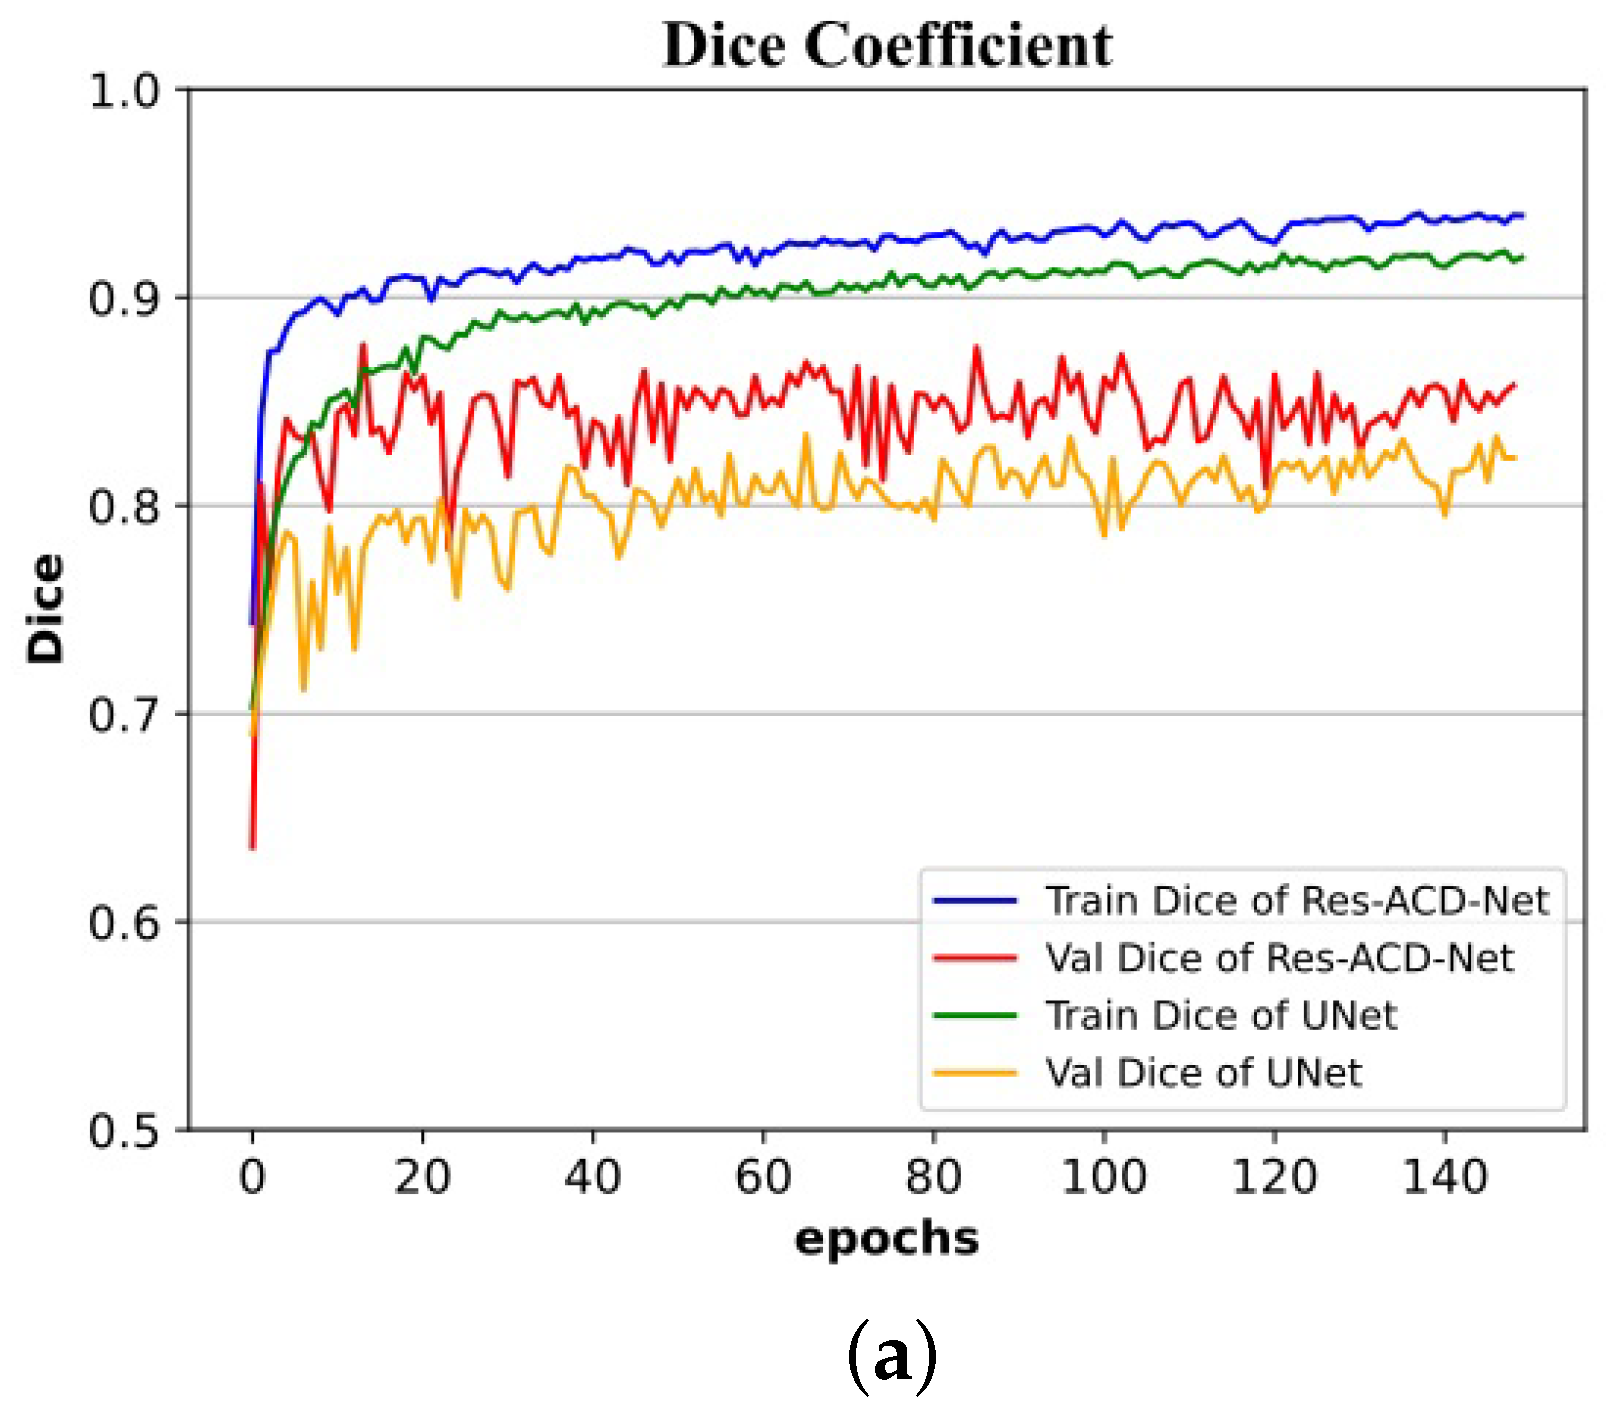
Experiments on the ISIC-2016, ISIC-2017, and PH2 authoritative datasets of skin lesion images present convincing results. Res-CDD-Net exhibits high reliability, high robustness, and strong adaptability to images with more interference. Its performance exceeds most of the mainstream open-source networks, such as CE-Net, BiO-Net, and UTNet. Compared with U-Net, the Dice coefficient is improved by 6.90%, 3.90%, and 4.01% in ISIC-2017, ISIC-2016, and PH2, respectively. The Jaccard index is improved by 10.84%, 5.16%, and 5.54% in ISIC-2017, ISIC-2016, and PH2, respectively. Compared with state-of-the-art skin lesion segmentation approaches reported in recent years, the proposed method is competitive. Above all, Res-CDD-Net has an easy-to-understand structure and the shortest training time while achieving remarkable performance. This jointly constitutes its most remarkable advantage in practical applications.
In future research, we will conduct the following improvement schemes. First, we will fine-tune hyperparameters, such as dropout rate, to further improve the segmentation accuracy through experiments. Second, additional pre-processing techniques such as hair removal and calibration color normalization will be adopted. Third, simple post-processing methods will be explored. These methods will also help to improve the network performance.

6. Conclusions

We propose an advanced end-to-end skin lesion segmentation network called Res-CDD-Net. It combines the pre-trained ResNeXt50 network, CSAB, MSCB, and a decoding path with DBBs. Experimental results on three authoritative skin lesion datasets (ISIC 2017, ISIC 2016, and PH2) show that, compared with most open-source state-of-the-art networks, the proposed network requires less training time to achieve more accurate segmentation results. The Dice coefficient has reached 86.55%, 92.89%, and 92.62% on ISIC 2017, ISIC 2016, and PH2, respectively. The Jaccard index has reached 78.63%, 86.54%, and 85.76% on ISIC 2017, ISIC 2016, and PH2, respectively. The training time on the ISIC2017 dataset is about 2 h, which is significantly lower than the other methods. However, some limitations of the proposed approach should not be neglected. The network is relatively large and computationally expensive. In addition, we only focused on the segmentation task of skin lesion datasets in this study. We can try to apply the proposed approach to other tasks related to medical imaging, such as lung segmentation, brain tumor segmentation, retinal blood vessel segmentation, and nerve optic disc segmentation. We believe that the use of the proposed network for these medical image segmentation tasks, combined with appropriate pre-processing and post-processing operations, can give rise to more advanced segmentation methods.

Author Contributions

Funding acquisition, W.L.; resources, W.L.; supervision, W.L. and Q.S.; writing—original draft, Z.S.; writing—review and editing, Z.S. All authors have read and agreed to the published version of the manuscript.

Funding

This research was funded by the Natural Science Foundation of Hebei Province (F2019201451).

Data Availability Statement

The datasets used in this paper are public datasets. The ISIC 2017 could be found from https://challenge.isic-archive.com/data/#2017 (accessed on 1 July 2022). The ISIC 2016 could be found from https://challenge.isic-archive.com/data/#2016 (accessed on 1 July 2022).

Conflicts of Interest

The authors declare no conflict of interest.

References

  1. Cancer Facts and Figures 2018. American Cancer Society. Available online: https://www.cancer.org/content/dam/cancer-org/research/cancer-facts-and-statistics/annual-cancer-facts-and-figures/2018/cancer-facts-and-figures-2018.pdf (accessed on 3 May 2018).
  2. Mahbod, A.; Schaefer, G.; Wang, C.; Ecker, R.; Ellinge, I. Skin lesion classification using hybrid deep neural networks. In Proceedings of the ICASSP 2019—2019 IEEE International Conference on Acoustics, Speech and Signal Processing (ICASSP), Brighton, UK, 12–17 May 2019; pp. 1229–1233. [Google Scholar]
  3. Kittler, H.; Pehamberger, H.; Wolff, K.; Binder, M.J.T.I.O. Diagnostic accuracy of dermoscopy. Lancet Oncol. 2002, 3, 159–165. [Google Scholar] [CrossRef]
  4. Ganster, H.; Pinz, P.; Rohrer, R.; Wildling, E.; Binder, M.; Kittler, H. Automated melanoma recognition. IEEE Trans. Med. Imaging 2001, 20, 233–239. [Google Scholar] [CrossRef] [PubMed]
  5. Li, H.; He, X.; Zhou, F.; Yu, Z.; Ni, D.; Chen, S. Dense deconvolutional network for skin lesion segmentation. IEEE J. Biomed. Health Inform. 2018, 23, 527–537. [Google Scholar] [CrossRef] [PubMed]
  6. Izonin, I.; Tkachenko, R.; Peleshko, D.; Rak, T.; Batyuk, D. Learning-based image super-resolution using weight coefficients of synaptic connections. In Proceedings of the 2015 Xth International Scientific and Technical Conference “Computer Sciences and Information Technologies” (CSIT), Lviv, Ukraine, 14–17 September 2015; pp. 25–29. [Google Scholar]
  7. Tkachenko, R.; Tkachenko, P.; Izonin, I.; Tsymbal, Y. Learning-based image scaling using neural-like structure of geometric transformation paradigm. In Advances in Soft Computing and Machine Learning in Image Processing; Springer: Berlin/Heidelberg, Germany, 2018; pp. 537–565. [Google Scholar]
  8. Yu, L.; Chen, H.; Dou, Q.; Qin, J.; Heng, P. Automated melanoma recognition in dermoscopy images via very deep residual networks. IEEE Trans. Med. Imaging 2016, 36, 994–1004. [Google Scholar] [CrossRef] [PubMed]
  9. Zhao, H.; Shi, J.; Qi, X.; Wang, X.; Jia, J. Pyramid scene parsing network. In Proceedings of the IEEE Conference on Computer Vision and Pattern Recognition, Honolulu, HI, USA, 21–26 July 2017; pp. 2881–2890. [Google Scholar]
  10. Sarker, M.; Kamal, M.; Rashwan, H.A.; Akram, F.; Banu, S.F.; Saleh, A. Slsdeep: Skin lesion segmentation based on dilated residual and pyramid pooling networks. In Proceedings of the International Conference on Medical Image Computing and Computer-Assisted Intervention, Granada, Spain, 16–20 September 2018; pp. 21–29. [Google Scholar]
  11. Tong, X.; Wei, J.; Sun, B.; Su, S.; Zuo, Z.; Wu, P. Ascu-net: Attention gate, spatial and channel attention u-net for skin lesion segmentation. Diagnostics 2021, 11, 501. [Google Scholar] [CrossRef]
  12. Qu, P. Medical Image Segmentation Based on Res Dense u-Net. Master’s Thesis, Jilin University, Changchun, China, 2020. [Google Scholar]
  13. He, K.; Zhang, X.; Ren, S.; Sun, J. Deep residual learning for image recognition. In Proceedings of the IEEE Conference on Computer Vision and Pattern Recognition, Las Vegas, NV, USA, 27–30 June 2016; pp. 770–778. [Google Scholar]
  14. Huang, G.; Liu, Z.; Maaten, L.V.D.; Weinberger, K.Q. Densely connected convolutional networks. In Proceedings of the IEEE Conference on Computer Vision and Pattern Recognition, Honolulu, HI, USA, 21–26 July 2017; pp. 4700–4708. [Google Scholar]
  15. Ding, X.; Guo, Y.; Ding, G.; Han, J. Acnet: Strengthening the kernel skeletons for powerful cnn via asymmetric convolution blocks. In Proceedings of the IEEE/CVF International Conference on Computer Vision, Seoul, Korea, 27 October–2 November 2019; pp. 1911–1920. [Google Scholar]
  16. Dai, D.; Dong, C.; Xu, S.; Yan, Q.; Li, Z.; Zhang, C. Ms red: A novel multi-scale residual encoding and decoding network for skin lesion segmentation. Med. Image Anal. 2022, 75, 102293. [Google Scholar] [CrossRef]
  17. Xie, S.; Girshick, R.; Dollár, P.; Tu, Z.; He, K. Aggregated residual transformations for deep neural networks. In Proceedings of the IEEE Conference on Computer Vision and Pattern Recognition, Honolulu, HI, USA, 21–26 July 2017; pp. 1492–1500. [Google Scholar]
  18. Ding, X.; Zhang, X.; Han, J.; Ding, G. Diverse branch block: Building a convolution as an inception-like unit. In Proceedings of the IEEE/CVF Conference on Computer Vision and Pattern Recognition, Nashville, TN, USA, 19–25 June 2021; pp. 10886–10895. [Google Scholar]
  19. Szegedy, C.; Liu, W.; Jia, Y.; Sermanet, P.; Reed, S.; Anguelov, D. Going deeper with convolutions. In Proceedings of the IEEE Conference on Computer Vision and Pattern Recognition, Boston, MA, USA, 7–12 June 2015; pp. 1–9. [Google Scholar]
  20. Gutman, D.; Codella, N.C.F.; Celebi, E.; Helba, B.; Marchetti, M.; Mishra, N. Skin lesion analysis toward melanoma detection: A challenge at the international symposium on biomedical imaging (isbi) 2016, hosted by the international skin imaging collaboration (isic). arXiv 2016, arXiv:1605.01397. [Google Scholar]
  21. Codella, N.C.F.; Gutman, D.; Celebi, M.E.; Helba, B.; Marchetti, M.A.; Dusza, S.W. Skin lesion analysis toward melanoma detection: A challenge at the 2017 international symposium on biomedical imaging (isbi), hosted by the international skin imaging collaboration (isic). In Proceedings of the 2018 IEEE 15th International Symposium on Biomedical Imaging (ISBI 2018), Washington, DC, USA, 4–7 April 2018; pp. 168–172. [Google Scholar]
  22. Mendonça, T.; Ferreira, P.M.; Marques, J.S.; Marcal, A.R.; Rozeira, J. PH2—A dermoscopic image database for research and benchmarking. In Proceedings of the 2013 35th Annual International Conference of the IEEE Engineering in Medicine and Biology Society (EMBC), Osaka, Japan, 3–7 July 2013; pp. 5437–5440. [Google Scholar]
  23. Ronneberger, O.; Fischer, P.; Brox, T. U-net: Convolutional networks for biomedical image segmentation. In Proceedings of the International Conference on Medical Image Computing and Computer-Assisted Intervention, Munich, Germany, 5–9 October 2015; pp. 234–241. [Google Scholar]
  24. Gu, Z.; Cheng, J.; Fu, H.; Zhou, K.; Hao, H.; Zhao, Y. Ce-net: Context encoder network for 2d medical image segmentation. IEEE Trans. Med. Imaging 2019, 38, 2281–2292. [Google Scholar] [CrossRef]
  25. Xiang, T.; Zhang, C.; Liu, D.; Song, Y.; Huang, H.; Cai, W. Bio-net: Learning recurrent bi-directional connections for encoder-decoder architecture. In Proceedings of the International Conference on Medical Image Computing and Computer-Assisted Intervention, Lima, Peru, 4–8 October 2020; pp. 74–84. [Google Scholar]
  26. Zunair, H.; Hamza, A.B. Sharp u-net: Depthwise convolutional network for biomedical image segmentation. Comput. Biol. Med. 2021, 136, 104699. [Google Scholar] [CrossRef]
  27. Codella, N.; Rotemberg, V.; Tschandl, P.; Celebi, M.E.; Dusza, S.; Gutman, D. Skin lesion analysis toward melanoma detection 2018: A challenge hosted by the international skin imaging collaboration (isic). arXiv 2019, arXiv:1902.03368. [Google Scholar]
  28. Zhou, Z.; Siddiquee, M.M.R.; Tajbakhsh, N.; Liang, J. Unet++: A nested u-net architecture for medical image segmentation. In Deep Learning in Medical Image Analysis and Multimodal Learning for Clinical Decision Support; Springer: Berlin/Heidelberg, Germany, 2018; pp. 3–11. [Google Scholar]
  29. Hao, S.; Lee, D.; Zhao, D. Sequence to sequence learning with attention mechanism for short-term passenger flow prediction in large-scale metro system. Transp. Res. Part C Emerg. Technol. 2019, 107, 287–300. [Google Scholar] [CrossRef]
  30. Oktay, O.; Schlemper, J.; Folgoc, L.L.; Lee, M.; Heinrich, M.; Misawa, K. Attention u-net: Learning where to look for the pancreas. arXiv 2018, arXiv:1804.03999. [Google Scholar]
  31. Li, H.; Yin, Z. Attention, suggestion and annotation: A deep active learning framework for biomedical image segmentation. In Proceedings of the International Conference on Medical Image Computing and Computer-Assisted Intervention, Lima, Peru, 4–8 October 2020; pp. 3–13. [Google Scholar]
  32. Woo, S.; Park, J.; Lee, J.-Y.; Kweon, I.S. Cbam: Convolutional block attention module. In Proceedings of the European Conference on Computer Vision (ECCV), Munich, Germany, 8–14 September 2018; pp. 3–19. [Google Scholar]
  33. Chen, J.; Lu, Y.; Yu, Q.; Luo, X.; Adeli, E.; Wang, Y. Transunet: Transformers make strong encoders for medical image segmentation. arXiv 2021, arXiv:2102.04306. [Google Scholar]
  34. Cao, H.; Wang, Y.; Chen, J.; Jiang, D.; Zhang, X.; Tian, Q. Swin-unet: Unet-like pure transformer for medical image segmentation. arXiv 2021, arXiv:2105.05537. [Google Scholar]
  35. Gao, Y.; Zhou, M.; Metaxas, D.N. Utnet: A hybrid transformer architecture for medical image segmentation. In Proceedings of the International Conference on Medical Image Computing and Computer-Assisted Intervention, Strasbourg, France, 27 September–1 October 2021; pp. 61–71. [Google Scholar]
  36. Chen, L.; Papandreou, G.; Kokkinos, I.; Murphy, K.; Yuille, A.L. Deeplab: Semantic image segmentation with deep convolutional nets, atrous convolution, and fully connected crfs. IEEE Trans. Pattern Anal. Mach. Intell. 2017, 40, 834–848. [Google Scholar] [CrossRef] [Green Version]
  37. Chen, L.; Papandreou, G.; Schroff, F.; Adam, H. Rethinking atrous convolution for semantic image segmentation. arXiv 2017, arXiv:1706.05587. [Google Scholar]
  38. Chen, L.-C.; Zhu, Y.; Papandreou, G.; Schroff, F.; Adam, H. Encoder-decoder with atrous separable convolution for semantic image segmentation. In Proceedings of the European conference on computer vision (ECCV), Munich, Germany, 8–14 September 2018; pp. 801–818. [Google Scholar]
  39. Szegedy, C.; Ioffe, S.; Vanhoucke, V.; Alemi, A.A. Inception-v4, inception-resnet and the impact of residual connections on learning. In Proceedings of the Thirty-First AAAI Conference on Artificial Intelligence, San Francisco, CA, USA, 4–9 February 2017. [Google Scholar]
  40. Szegedy, C.; Vanhoucke, V.; Ioffe, S.; Shlens, J.; Wojna, Z. Rethinking the inception architecture for computer vision. In Proceedings of the IEEE Conference on Computer Vision and Pattern Recognition, Las Vegas, NV, USA, 27–30 June 2016; pp. 2818–2826. [Google Scholar]
  41. Mou, L.; Zhao, Y.; Fu, H.; Liu, Y.; Cheng, J.; Zheng, Y. Cs2-net: Deep learning segmentation of curvilinear structures in medical imaging. Med. Image Anal. 2021, 67, 101874. [Google Scholar] [CrossRef]
  42. Gao, S.; Cheng, M.-M.; Zhao, K.; Zhang, X.-Y.; Yang, M.; Philip, T. Res2net: A new multi-scale backbone architecture. IEEE Trans. Pattern Anal. Mach. Intell. 2019, 43, 652–662. [Google Scholar] [CrossRef]
  43. Al-Masni, M.A.; Al-Antari, M.A.; Choi, M.; Han, S.; Kim, T. Skin lesion segmentation in dermoscopy images via deep full resolution convolutional networks. Comput. Methods Programs Biomed. 2018, 162, 221–231. [Google Scholar] [CrossRef]
  44. Yuan, Y.; Lo, Y.-C. Improving dermoscopic image segmentation with enhanced convolutional-deconvolutional networks. IEEE J. Biomed. Health Inform. 2017, 23, 519–526. [Google Scholar] [CrossRef]
  45. Bi, L.; Kim, J.; Ahn, E.; Kumar, A.; Feng, D.; Fulham, M. Step-wise integration of deep class-specific learning for dermoscopic image segmentation. Pattern Recognit. 2019, 85, 78–89. [Google Scholar] [CrossRef]
  46. Abhishek, K.; Hamarneh, G.; Drew, M.S. Illumination-based transformations improve skin lesion segmentation in dermoscopic images. In Proceedings of the IEEE/CVF Conference on Computer Vision and Pattern Recognition Workshops, Seattle, WA, USA, 14–19 June 2020; pp. 728–729. [Google Scholar]
  47. Xie, F.; Yang, J.; Liu, J.; Jiang, Z.; Zheng, Y.; Wang, Y. Skin lesion segmentation using high-resolution convolutional neural network. Comput. Methods Programs Biomed. 2020, 186, 105241. [Google Scholar] [CrossRef] [PubMed]
  48. Saha, A.; Prasad, P.; Thabit, A. Leveraging adaptive color augmentation in convolutional neural networks for deep skin lesion segmentation. In Proceedings of the 2020 IEEE 17th International Symposium on Biomedical Imaging (ISBI), Iowa City, IA, USA, 3–7 April 2020; pp. 2014–2017. [Google Scholar]
Figure 1. Some dermoscopic images with external interferences: (a) bubble occlusion; (b) low contrast in the surrounding; (c) hair covering; and (d) low contrast in the center.
Electronics 11 02672 g001
Figure 2. Diagram of the proposed network structure.
Electronics 11 02672 g002
Figure 3. Residual block structure of ResNeXt50: (a) theoretical structure; (b) practical structure.
Electronics 11 02672 g003
Figure 4. Channel and spatial attention block: (a) overall structure; (b) channel attention block; and (c) spatial attention block.
Electronics 11 02672 g004
Figure 5. Multi-scale capture block.
Electronics 11 02672 g005
Figure 6. Structure of the decoding.
Electronics 11 02672 g006
Figure 7. Structure of the diverse branch block.
Electronics 11 02672 g007
Figure 8. Segmentation results on the ISIC-2017 dataset: (a) original image; (b) ground truth; (c) segmentation result; (d) segmentation result of U-Net; (e) segmentation result of BiO-Net.
Electronics 11 02672 g008
Figure 9. Training and validation processes on the ISIC-2017 dataset: (a) curves of Dice coefficient; (b) curves of Jaccard index.
Electronics 11 02672 g009
Figure 10. Segmentation results on the ISIC-2016 dataset: (a) original image; (b) ground truth; (c) segmentation result; (d) segmentation result from U-Net; and (e) segmentation result from BiO-Net.
Electronics 11 02672 g010
Figure 11. Training and validation processes on the ISIC-2016 dataset: (a) curves of Dice coefficient; (b) curves of Jaccard index.
Electronics 11 02672 g011aElectronics 11 02672 g011b
Figure 12. Segmentation results on the PH2 dataset: (a) original image; (b) ground truth; (c) segmentation result; (d) segmentation result from U-Net; and (e) segmentation result from BiO-Net.
Electronics 11 02672 g012
Table 1. Our partition of experiment datasets.
DatasetsTraining SetValidation SetTesting SetTotal
ISIC-2017 [21]20001506002750
ISIC-2016 [20]7002003791279
PH2 [22]--200200
Table 2. Details of configurations of different networks.
NetworksBatch SizeImage SizeInitial
Learning Rate
OptimizerPretrainedTraining Epochs
U-Net [23]6192 × 2560.0002AdamNo150
CE-Net [24]8192 × 2560.0002AdamIn encoder150
BiO-Net [25]8192 × 2560.0002AdamNo150
U-Net++ [28]8192 × 2560.0002AdamNo150
DeepLab v3+ [38]8192 × 2560.0002AdamIn encoder150
TransUNet [33]6224 × 2240.0002AdamIn encoder150
Swin-Unet [34]6224 × 2240.0002AdamYes150
UTNet [35]6256 × 2560.0002AdamNo150
Res-CDD-Net (ours)8192 × 2560.0002AdamIn encoder150
Table 3. Testing results of our Res-CDD-Net and other mainstream networks on the ISIC-2017 dataset.
NetworksYearACSESPDCJC
U-Net [23]20150.92160.77430.96560.79650.6779
CE-Net [24]20190.94030.86270.97030.85500.7713
BiO-Net [25]20200.93060.90020.93840.84050.7501
U-Net++ [28]20180.93440.85090.96660.84250.7563
DeepLab v3+ [38]20180.93890.86120.97310.85560.7729
TransUNet [33]20210.93950.88770.96270.85540.7716
Swin-Unet [34]20210.93830.86210.97020.85420.7706
UTNet [35]20210.93720.85870.97120.85030.7695
Res-CDD-Net (ours)20220.94290.88130.96590.86550.7863
Table 4. Testing results of our method and other advanced methods on the ISIC-2017 dataset.
NetworksYearACSESPDCJC
Yuan et al. [44]20170.9340.8200.9780.8490.765
Bi et al. [45]20190.94080.86200.96710.85660.7773
Abhishek et al. [46]20200.92200.87060.95160.83860.7570
Xie et al. [47]20200.9380.8700.9640.8620.783
Saha et al. [48]2020-0.8240.9810.8550.772
Tong et al. [11]20210.9260.8250.9650.8300.742
Dai et al. [16]20220.9410--0.86480.7855
Ours20220.94290.88130.96590.86550.7863
Table 5. Configurations of methods listed in Table 4.
NetworksBatch SizeImage SizeInitial
Learning Rate
OptimizerPretrainedTraining Epochs
Yuan et al. [44]18192 × 2560.003Adam--
Bi et al. [45]45224 × 2240.01SGDYes250
Abhishek et al. [46]40128 × 1280.001-No-
Xie et al. [47]8512 × 5120.001Adam--
Saha et al. [48]16224 × 2240.0001AdamIn encoder13
Tong et al. [11]8Original0.0002AdamW-200
Dai et al. [16]-224 × 3200.001AdamYes250
Ours8192 × 2560.0002AdamIn encoder150
“-” represents not mentioned in the paper.
Table 6. Testing results of our Res-CDD-Net and other mainstream networks on the ISIC-2016 dataset.
NetworksYearACSESPDCJC
U-Net [23]20150.95210.94360.95310.88990.8138
CE-Net [24]20190.95990.94160.95360.90340.8332
BiO-Net [25]20200.95320.93360.94840.89750.8241
U-Net++ [28]20180.95170.94780.94770.88840.8119
DeepLab v3+ [38]20180.95540.91130.97090.91170.8423
TransUNet [33]20210.95820.92510.97040.91060.8422
Swin-Unet [34]20210.95630.93230.96440.91300.8436
UTNet [35]20210.95710.93190.96530.91510.8455
Res-CDD-Net (ours)20220.96560.93390.96860.92890.8654
Table 7. Testing results of our Res-CDD-Net and other mainstream networks on the PH2 dataset.
NetworksYearACSESPDCJC
U-Net [23]20150.93110.94460.93800.88610.8022
CE-Net [24]20190.94050.97420.92660.89630.8190
BiO-Net [25]20200.93750.97070.92420.88720.8051
U-Net++ [28]20180.93160.96550.92270.88040.7930
DeepLab v3+ [38]20180.95540.91130.97090.91170.8423
TransUNet [33]20210.94630.94600.95030.91530.8449
Swin-Unet [34]20210.94280.95600.93870.90750.8311
UTNet [35]20210.94240.95460.93870.90660.8297
Res-CDD-Net (ours)20220.95930.97170.94300.92620.8576
Table 8. Ablation experiment results on the ISIC-2017 dataset.
NetworksCSABMSCBDBBACSESPDCJC
Baseline×××0.93810.83580.97670.84140.7583
Network1××0.93950.85060.97240.84960.7655
Network2××0.94000.84410.97440.85390.7709
Network3××0.93730.87520.95720.84950.7647
Network4×0.93860.83300.97400.85950.7766
Network5×0.93550.83120.97980.85560.7679
Network6×0.94260.85540.97490.85960.7793
Ours0.94290.88130.96590.86550.7863
Table 9. Comparative experiments of loss functions results on the ISIC-2017 dataset.
Loss FunctionsACSESPDCJC
BCELoss0.94070.83750.97830.85260.7718
DiceLoss0.94140.87280.96660.85540.7708
BCELoss+DiceLoss0.94000.87200.97210.86060.7797
BCELoss+0.5*DiceLoss0.94290.88130.96590.86550.7863
Table 10. Network complexity analysis of Res-CDD-Net and the baselines.
NetworksCSABMSCBDBBFLOPsParamsTraining Time
Baseline×××31.85 G90.82 M1.55 h
Network1××34.63 G98.22 M1.86 h
Network2××29.40 G90.56M1.55 h
Network3××31.85 G91.35 M1.59 h
Network4×29.40 G91.09 M1.59 h
Network5×34.63 G98.75 M1.86 h
Network6×32.17 G97.96 M1.82 h
Ours32.17 G98.49 M2.01 h
Table 11. Network complexity analysis of Res-CDD-Net and other networks.
NetworksFLOPsParamsTraining Time
U-Net [23]49.10 G34.53 M3.26 h
CE-Net [24]6.70 G29.00 M11.21 h
BiO-Net [25]8.47 G14.96 M2.08 h
U-Net++ [28]26.13 G9.16 M3.18 h
DeepLab v3+ [38]15.50 G54.51 M2.65 h
TransUNet [33]34.88 G106.10 M5.57 h
Swin-Unet [34]5.86 G27.12 M2.02 h
UTNet [35]20.40 G14.41 M3.37 h
Res-CDD-Net (ours)32.17 G98.49 M2.01 h
Publisher’s Note: MDPI stays neutral with regard to jurisdictional claims in published maps and institutional affiliations.

