1. Introduction
With the rapid development of wireless devices in recent years, the demand for spectrum resources is increasing. Today, most countries adopt the fixed spectrum assignment policy. Although it ensures the stable development of communication system, the spectrum utilization is poor [
1]. Cognitive radio (CR) was proposed to tackle this issue [
2]. Without interfering with the primary user (PU), CR can independently recognize and analyze the radio environment, and find and utilize the spectrum holes.
In a CR network (CRN), spectrum sensing is a critical front-end technology. It is utilized to observe the spectrum occupancy status and find the spectrum holes. There are three main ways for a single user to sense the spectrum, namely energy detection, matched filter detection, and cyclostationary feature detection [
3]. Energy detection has high study value in the spectrum sensing since it is a type of blind sensing technique and has the lowest complexity. However, one SU cannot sense the PU accurately due to fading, shadowing and other effects. CSS was considered as one of the solutions to these problems.
In the CSS, local sensing information of all SUs are sent to the FC. FC obtains the final decision result by using a certain fusion scheme. The selection of fusion schemes will directly affect the detection performance of the CSS. The existing fusion schemes are mainly divided into the soft combination and the hard combination [
4]. In the soft combination, each SU reports the decision statistic to FC. Comparatively, In the hard combination, each SU reports the local 0/1 decision result. The classic soft combination schemes are SC, EGC, and maximum ratio combination (MRC). The performance of the EGC is very close to the MRC, and it is simple to implement [
5]. Therefore, this paper will not focus on the MRC scheme. The traditional hard schemes are AND, OR, and K-rank. The K-rank is an extension of the AND and the OR, so it has better applicability and higher research value [
6].
In recent years, many works have been completed on the fusion schemes in the CSS. The authors mainly focused on the threshold of the fusion scheme in [
7,
8,
9]. Adaptive threshold or multi-threshold was adopted to alleviate the poor detection performance of single fixed threshold under low SNR, but the cost of these schemes is much greater bandwidth and energy consumption. In [
10,
11], the authors combined weighting or node filtration with the hard combination to weaken the bad influence of low SNR SUs. In [
5,
12], the authors summarized the performance of the traditional hard and soft combination. However, the hard combination in their study was too simple, and none of the fusion schemes derived the closed-form expressions for the average probability of detection.
However, when there are obstacles blocking, the receiving SNR of all SUs is low. At this time, any improvements of the fusion scheme are hard to obtain the ideal detection performance. Recently, IRS has been envisioned and drawn significant attention. It can significantly enhance the signal strength for the following reasons: (1) IRS is a planar surface with massive passive reflecting elements. The amplitude and/or phase of the incident signal can be adjusted by controlling different elements [
13]; (2) proper deployment of the IRS can help create virtual line-of-sight (LoS) links between the PU and SUs [
13]; (3) IRS is able to achieve passive reflection without incurring any noise amplification [
14]. Therefore, IRS-assisted can significantly improve the SU’s perception of weak signals.
Currently, the study of IRS in spectrum sensing mainly focuses on the field of single SU system [
15,
16,
17]. The authors in [
15] exploited the large aperture and passive beamforming gains of IRS to boost the PU signal strength. The authors in [
16] configured the IRS as a primary receiver to improve the detection performance. In [
17], the authors have proposed an IRS-enhanced energy detection, but it mainly focuses on the single SU case. To the best of our knowledge, the study on IRS-enhanced CSS is still relatively scarce, and the detection performance of the related systems is unknown, so it is urgent to analyze and provide necessary theoretical guidance for actual design.
Thus, this paper studies fusion schemes based on IRS-enhanced CSS. The main contributions of this paper are summarized as follows.
The fusion schemes in IRS-enhanced CSS are analyzed. The EGC and the SC schemes for the soft combination are studied. The WHC scheme and the OSC schemes for the hard combination are investigated;
An OSC scheme is proposed, which forms an optimal set based on each SU’s SNR to weaken the bad influence of low SNR SUs. The adjustable threshold makes the OSC have good applicability;
Each scheme considers both cases where there are or not direct links between the PU and all SUs. The closed-form expressions for the average probability of detection of all the schemes in both the cases are obtained;
Simulation results show that the IRS-enhanced CSS is superior to the benchmark schemes in terms of the detection performance. In addition, the detection performance of the OSC outperforms the K-rank.
The remaining parts are organized as follows. The system model of IRS-enhanced CSS is described in
Section 2.
Section 3 studies the EGC and the SC schemes for the soft combination.
Section 4 studies the WHC and the OSC schemes for the hard combination. The simulation results are provided in
Section 5. Finally, the conclusion is presented in
Section 6.
Notation 1. denotes the centrality chi-square distribution with α degree of freedom. denotes the non-centrality chi-square distribution with non-centrality parameter v and α degree of freedom. denotes the normal distribution with μ mean and variance. denotes the Rayleigh distribution with scale parameter b. denotes the Gamma distribution with shape parameter a and scale parameter b. denotes the Exponential distribution with mean waiting time c. denotes the probability density function (PDF). denotes the expectation of a random variable. denotes the variance of a random variable.
2. System Model
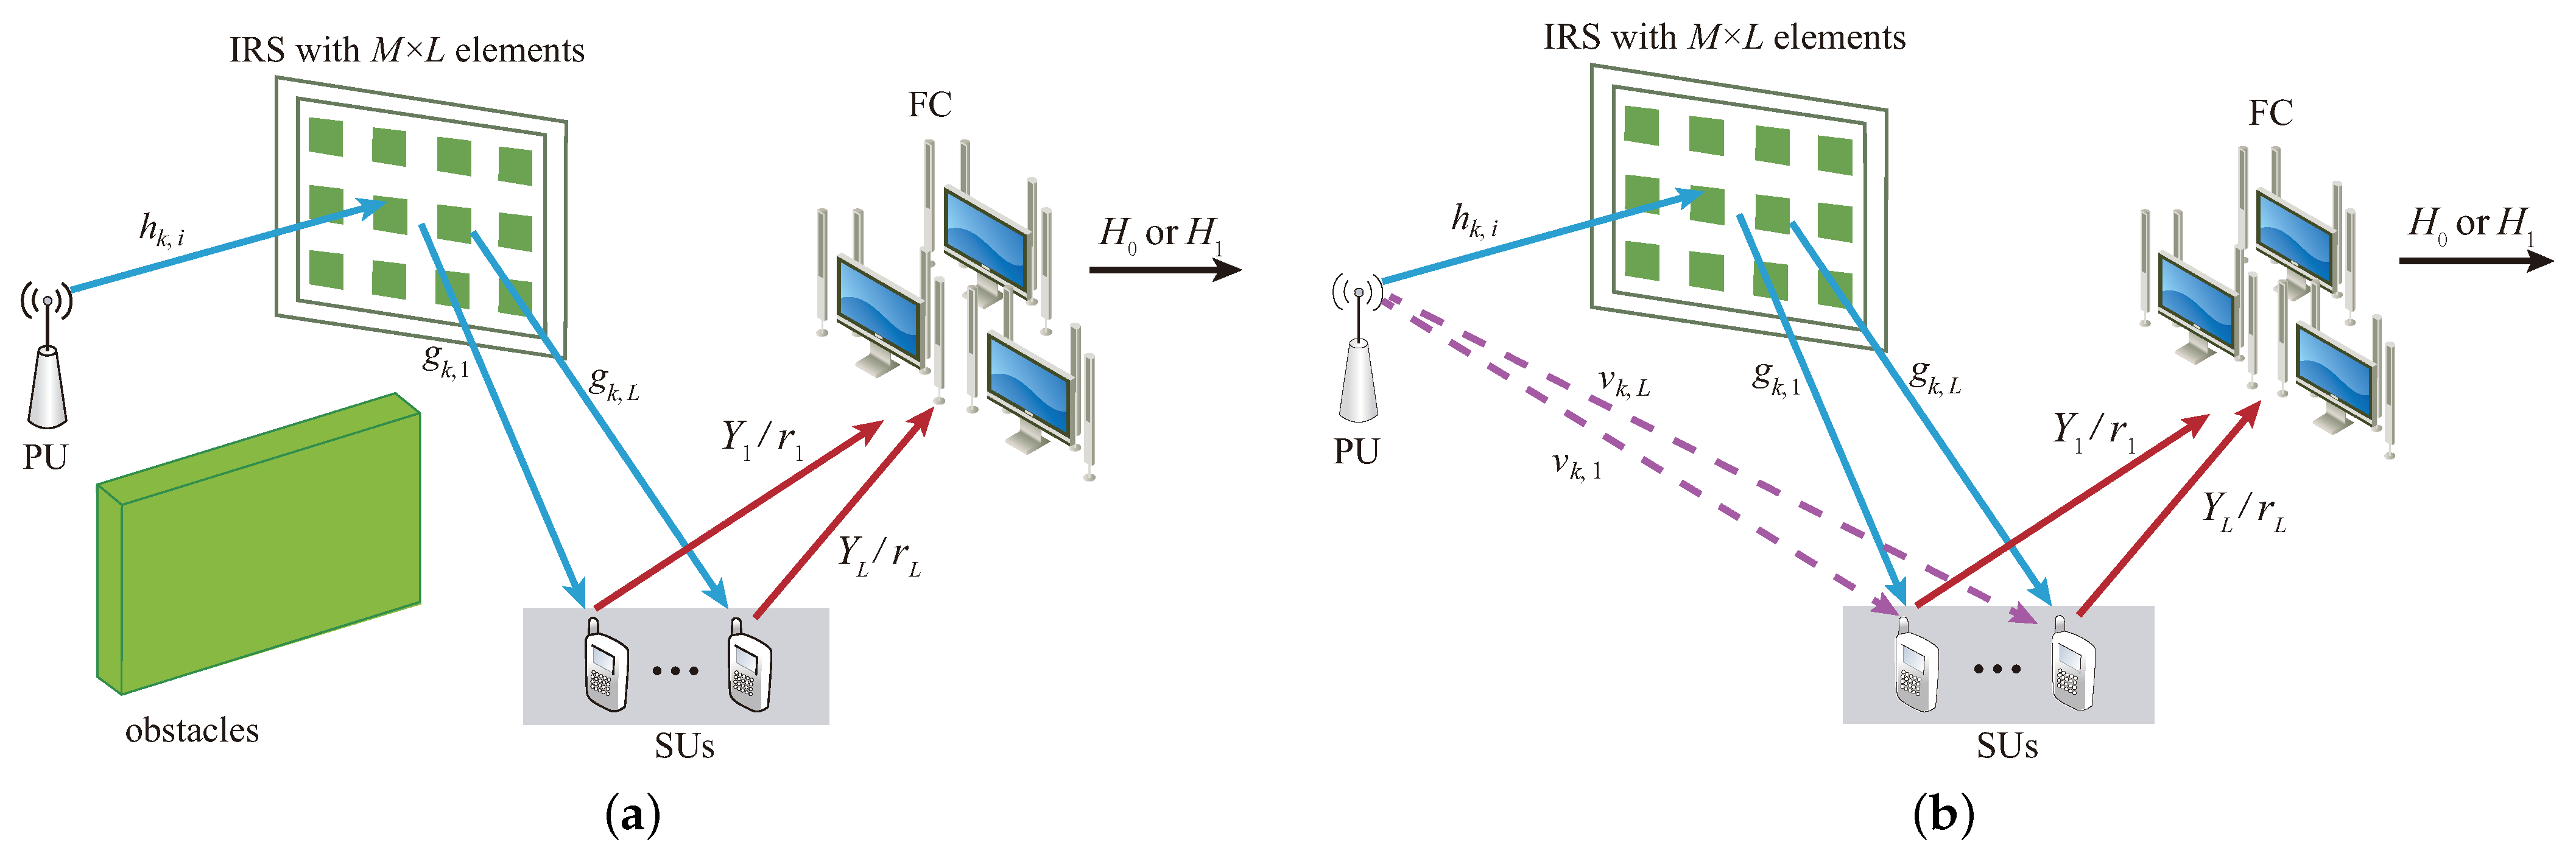
As shown in
Figure 1, an IRS-enhanced CSS is considered in a CRN. The network consists of an IRS with
passive reflective elements, a PU, a FC, and
L SUs. The elements in the IRS are divided into
L groups and each SU is served by
M elements. Two cases are considered with or without direct links between the PU and the
L SUs.
The channels from the PU to the k-th element in the i-th group, from the k-th element in the i-th group to the i-th SU (SUi) and from the PU to the SUi are denoted by , , and , respectively, where , . Since the channels between different elements and the PU are almost the same, the channel differences between different groups and the PU can be ignored, i.e., . Rayleigh fading is used to model the channels. Thus, the corresponding channel-envelope , , , where , and are the path-loss coefficients.
Energy detection is adopted for each SU. Then, the SUi reports the decision statistic or the 0/1 decision result to a FC via the control channel. Assume that all control channels are ideal, i.e., the sensing information obtained by FC for each SU is accurate. Finally, FC implements a specific fusion scheme depending on the sensing information received.
In order to study the IRS-enhanced CSS, we require the distribution information of a single SU energy detector. A binary hypothesis can be used to model the single SU system. Thus, the received signal of the SU
i can be described as below
where
x is the primary signal, and
is the received signal of the
. The
denotes the absence of the PU, and
n is the additive white Gaussian noise (AWGN) with zero mean and variance
. The
denotes the presence of the PU, and
P is its transmit power. The expression (1b) presents the case where there is not a direct link between the PU and the SU
i, and the expression (1c) presents otherwise. The
denotes the phase adjustment coefficient of the
k-th element. The
M denotes the number of elements in each group.
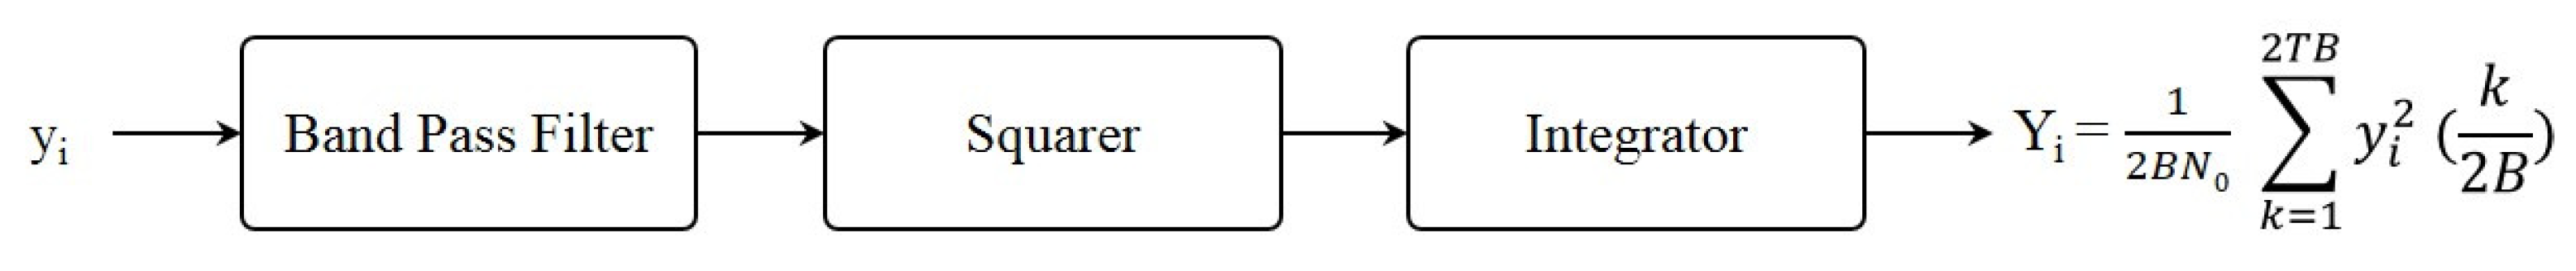
The
processes the received signal
by detecting its energy, and then obtains the decision statistic
.
Figure 2 shows the energy detection process. The decision statistic
follows
where
is the time-bandwidth product,
is the instantaneous received SNR of the
. According to [
13], the optimal phase shift of the
k-th element in IRS
is given by
, where
,
and
are the channel phases of
and
, respectively. In both the cases, the expressions of maximum received SNR
can be given as
where
is the transmit SNR,
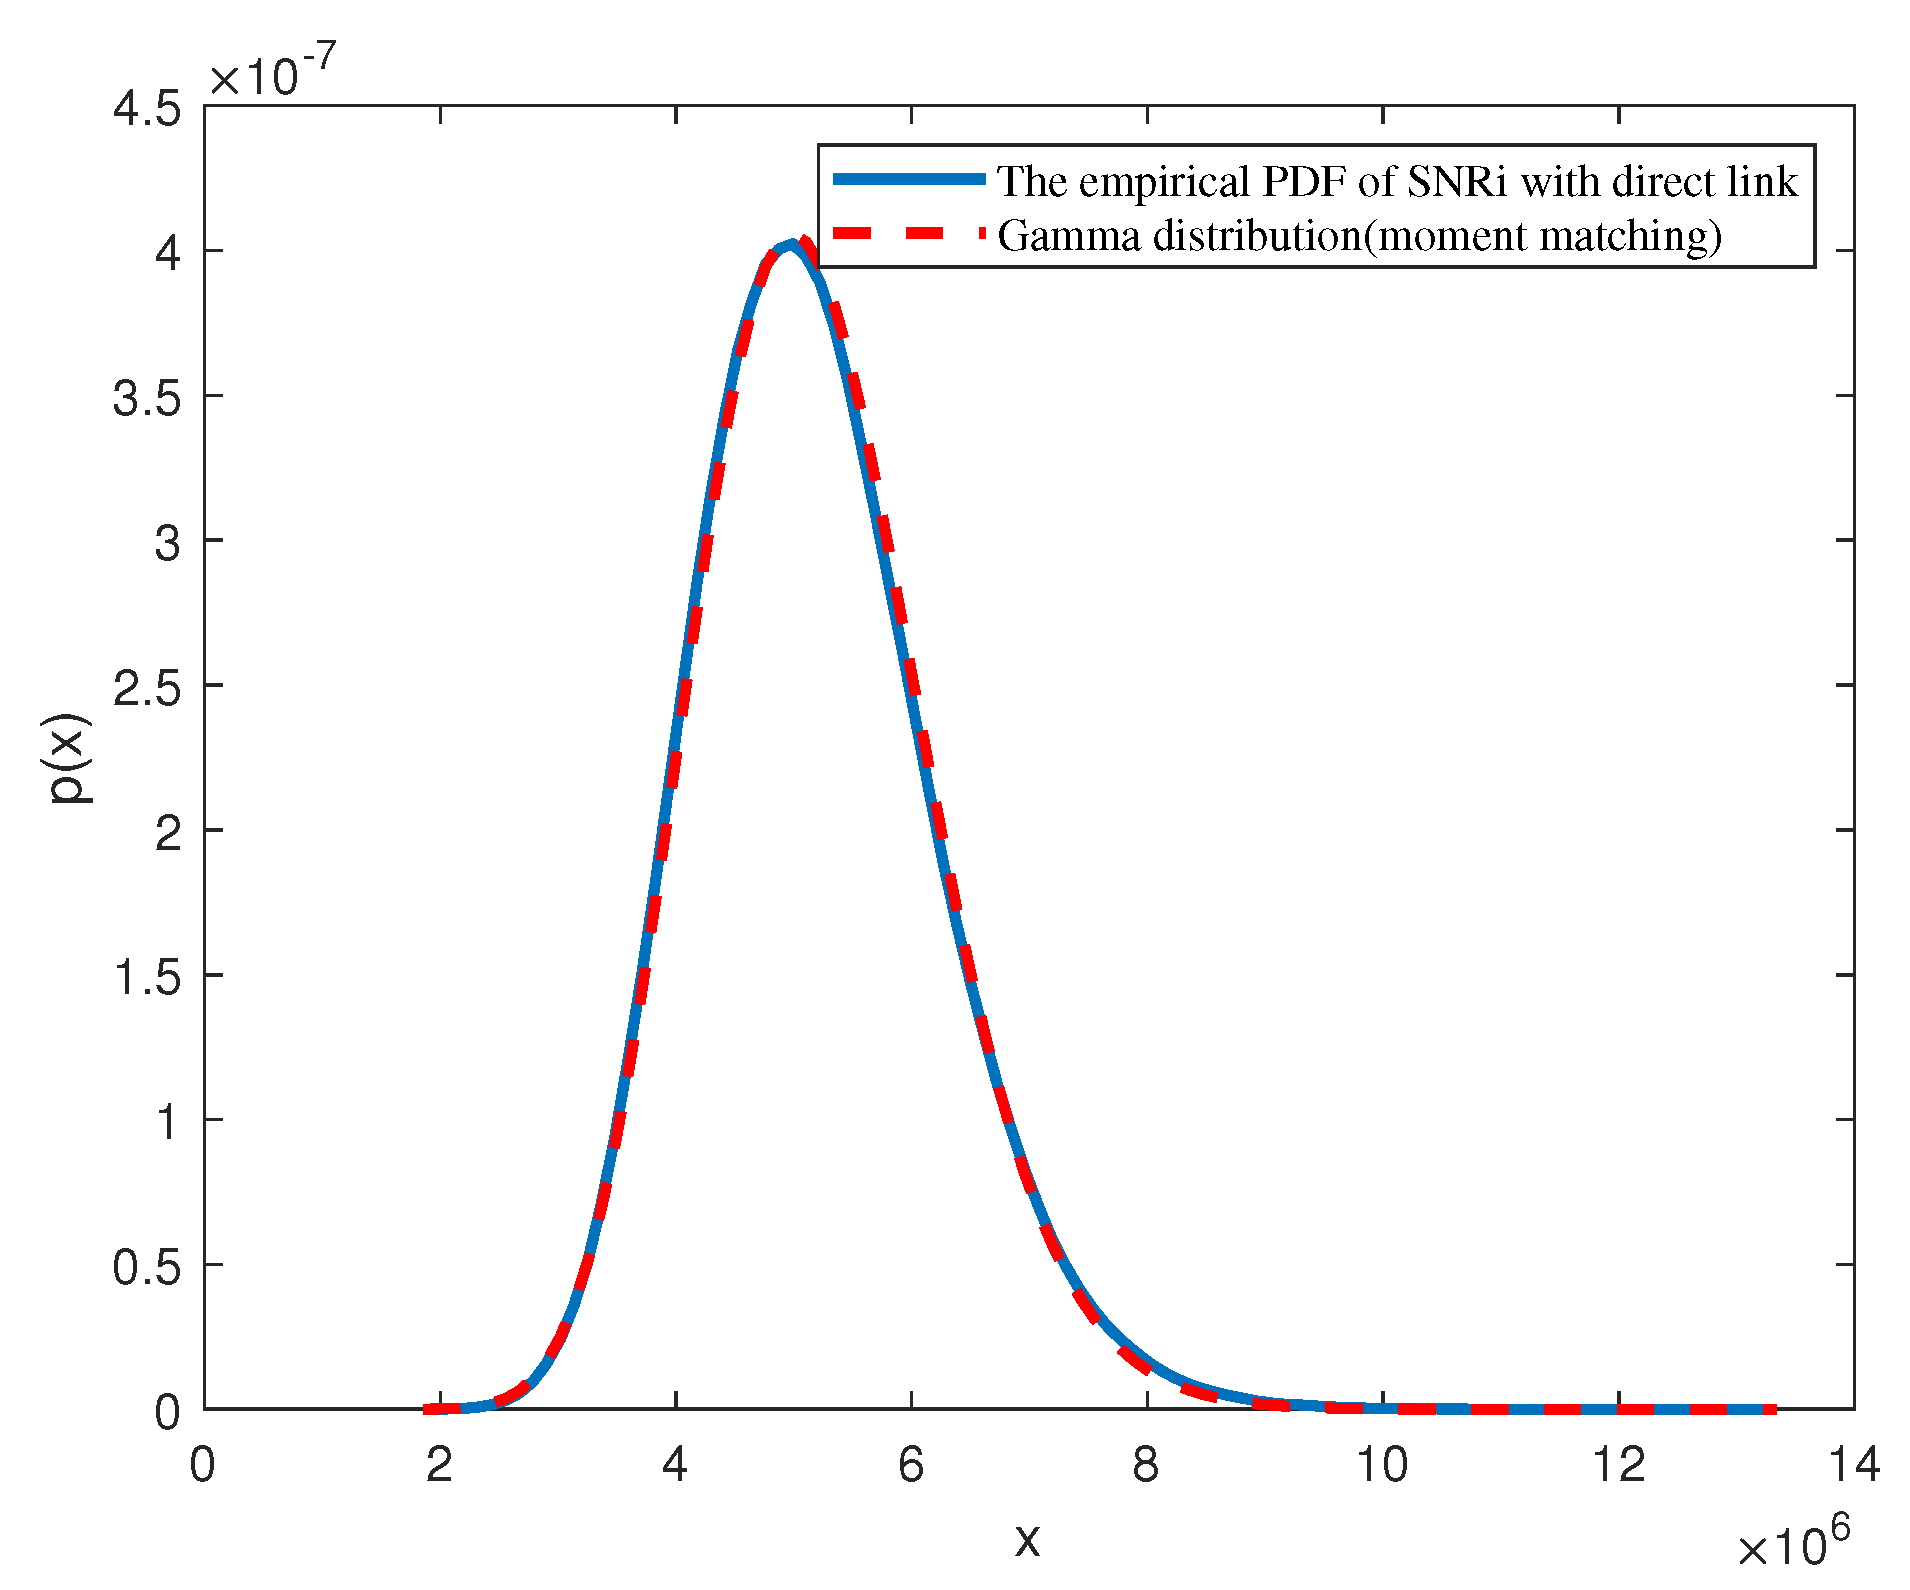
. Since there are many elements in the IRS [
13], using the central limit theorem [
18], it can be obtained that
, where
,
.
The expressions for the probability of false alarm (
), the probability of detection (
) and the average probability of detection (
) can be given by
where
is the decision threshold of the
,
is Gamma function,
is upper incomplete Gamma function,
is the
u-th order Marcum Q-function.
5. Simulation Results
In this section, simulation results are given to evaluate the detection performance of all the above schemes and compare them with the benchmark schemes. The adopted parameters during the simulation are shown in the
Table 1 below for clarity.
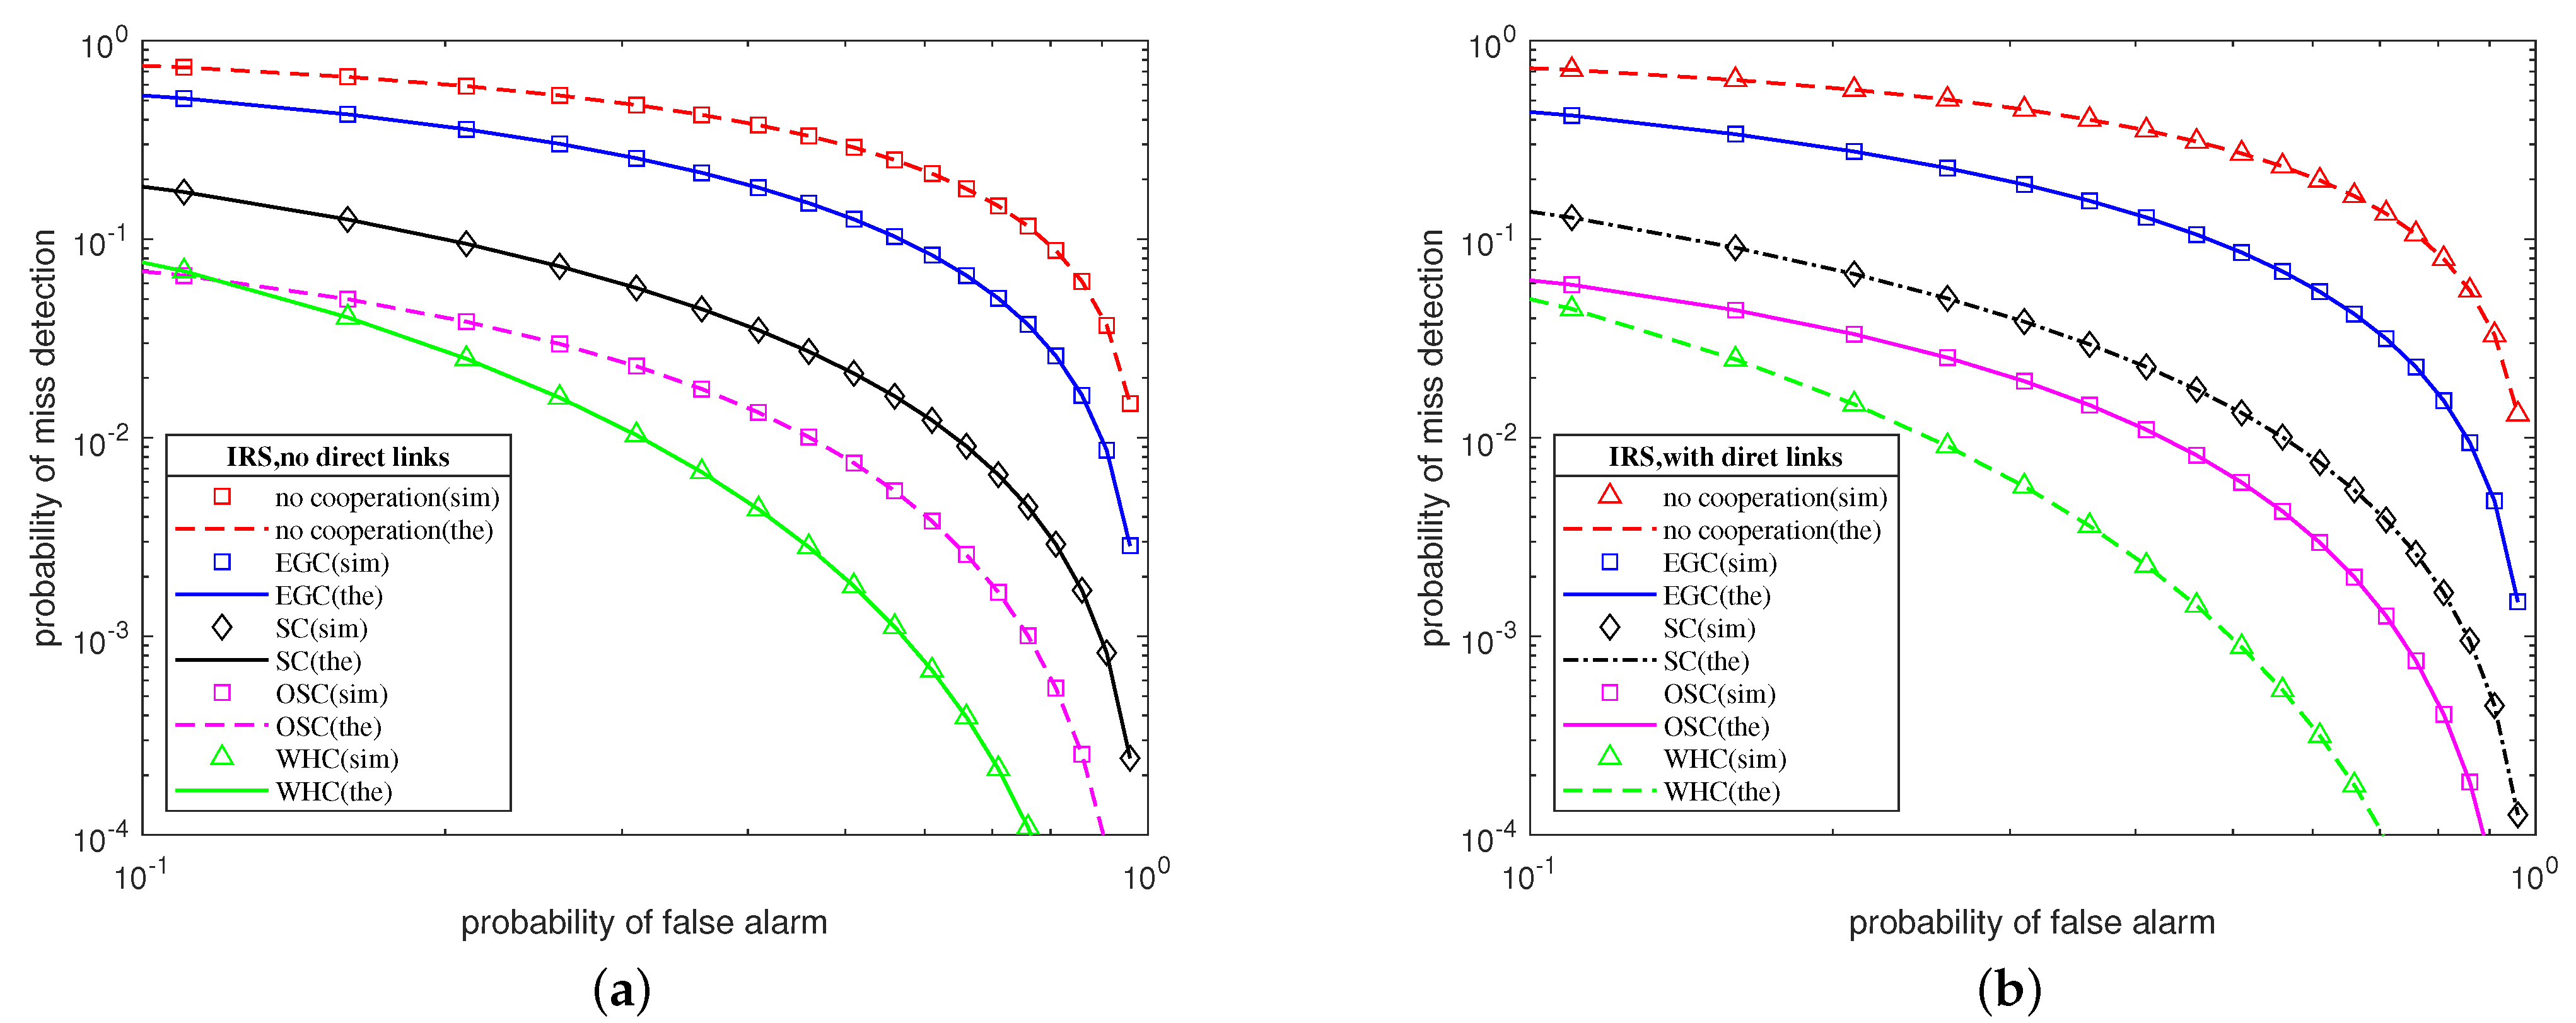
Figure 4 shows the Receiver Operating Characteristics (ROC) curves (the probability of miss detection
VS the probability of false alarm
), which involve the EGC, the SC, the WHC, and the OSC, and compare it to the detection performance of a single SU. The transmit SNR is set as
.
Figure 4a denotes the case without direct links, and
Figure 4b denotes otherwise. It shows that in both cases, with the same
, the detection performance of each scheme from good to bad is WHC, OSC, SC, EGC, and single SU. Both the OSC and the SC are unaffected by SUs with low SNR, so their detection performance is better. Because the WHC is essentially a fusion of the high SNR priority criterion and the OR-rule, it outperforms the OSC. However, its applicability is poorer than that of the OSC.
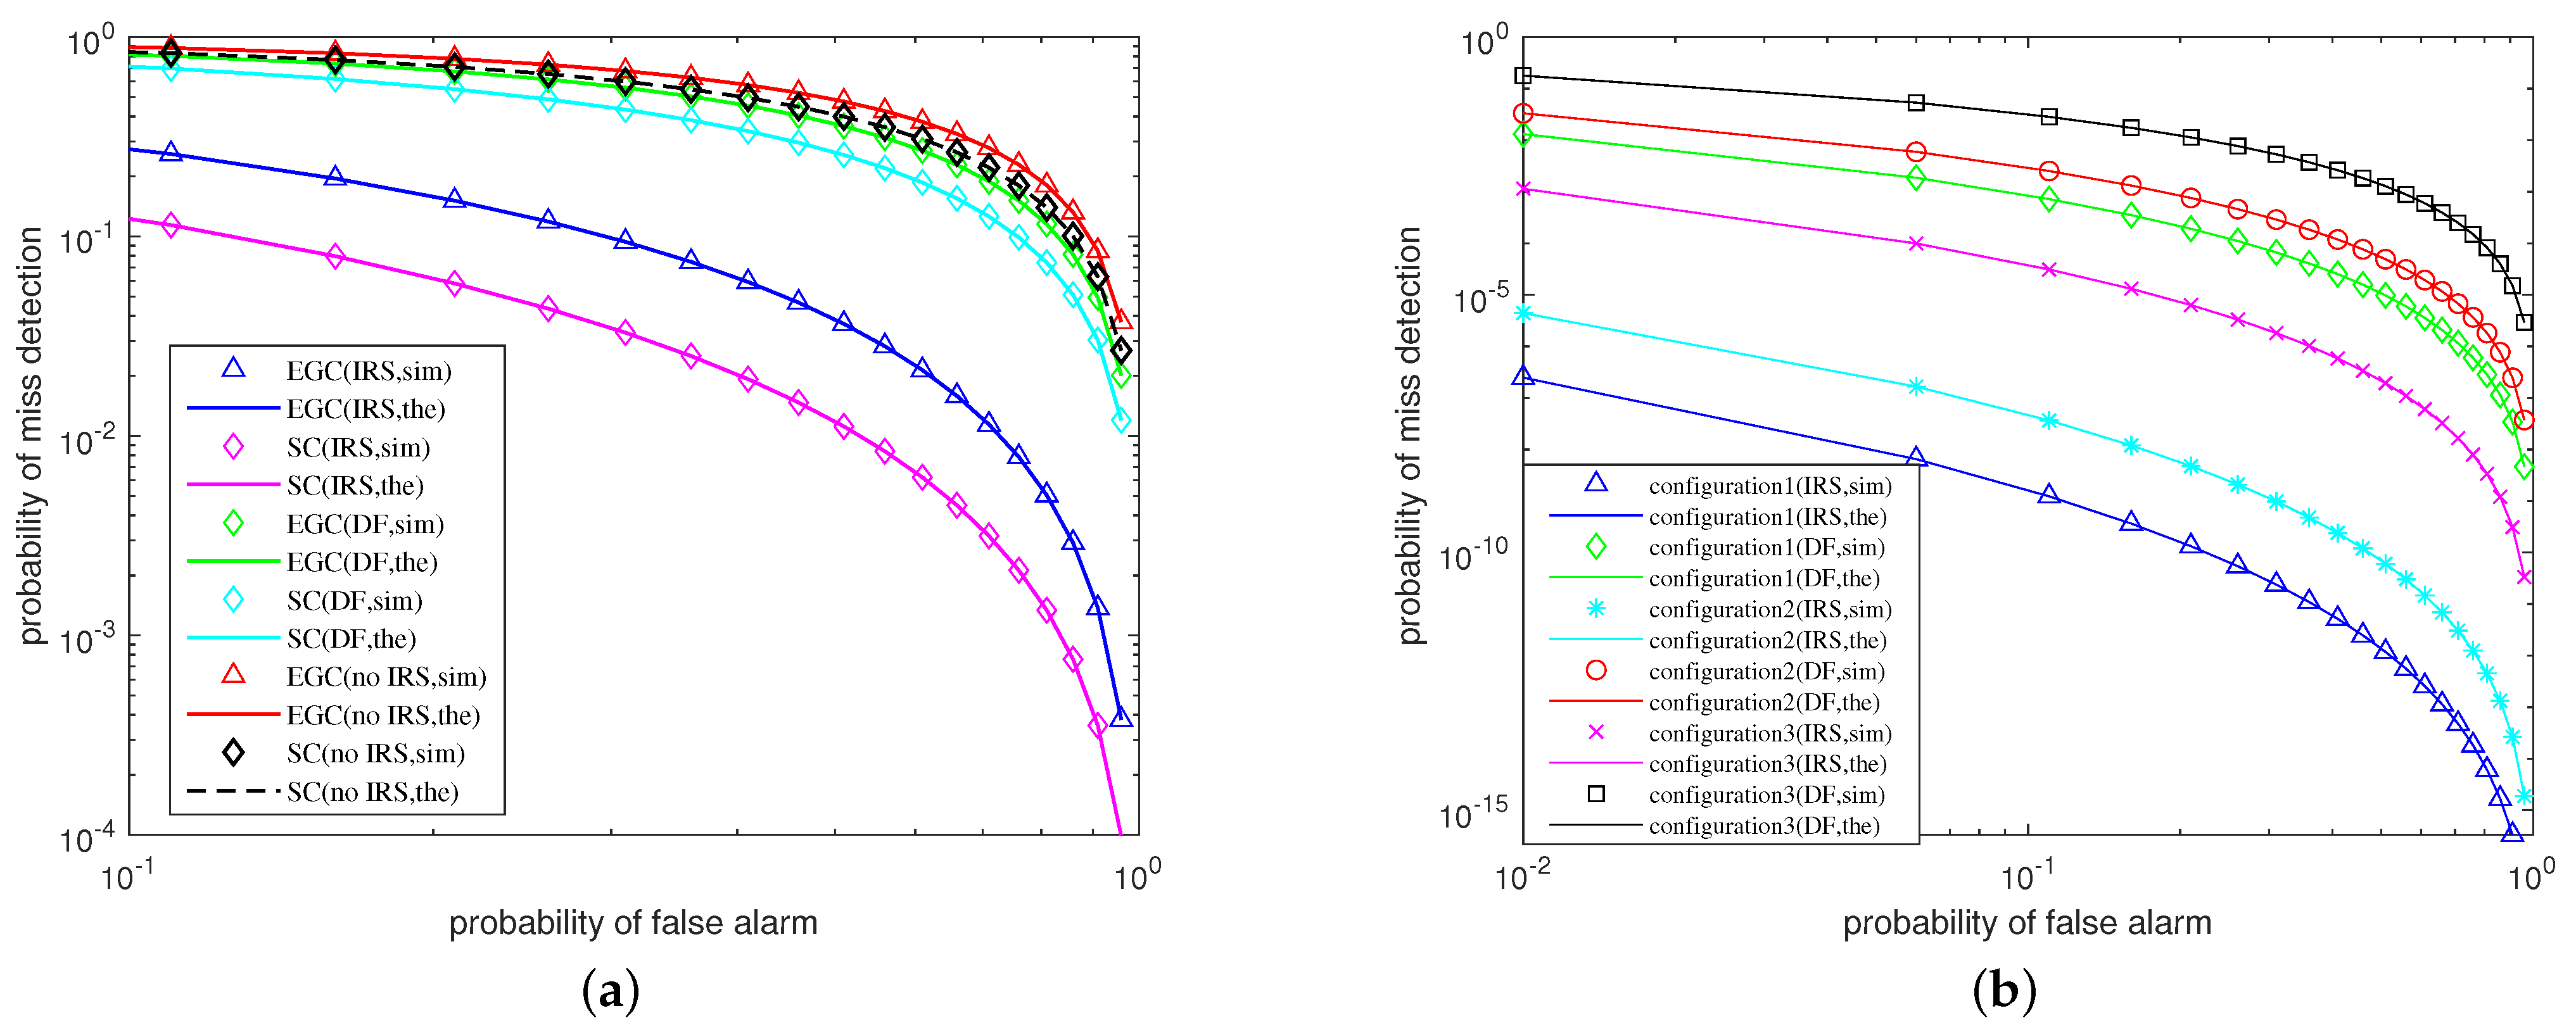
Figure 5a shows three scenarios: (i) there is an IRS between the PU and the SUs; (ii) there is a DF relay between the PU and the SUsl; (iii) there is not an IRS and a relay between the PU and the SUs. The transmit SNR is set as
. Take soft combination as an example. The detection performance is compared when there are direct links. The
and
of the scenario (ii) and the scenario (iii) are given in [
23,
24], respectively. It shows that the IRS-enhanced CSS outright outperforms the DF relay scenario and the no IRS scenario. This is because the IRS can construct multiple passive auxiliary reflection links, which can overcome signal’s randomness and do not incur any noise amplification.
Figure 5b shows three configurations: (i) the IRS is placed at closer distances, i.e.,
(configuration 1,
,
); (ii) the IRS is placed at moderate distances, i.e.,
(configuration 2,
,
); (iii) the IRS is placed at far-away distances, i.e.,
(configuration 3,
,
). The transmit SNR is set as
. Take the EGC as an example. The detection performance is compared when there are direct links. The detection performance of the IRS-enhanced CSS is hindered with increasing distance, mainly due to the large increase in distance-dependent path loss effects. It is also worth noting that the curve order for all three configurations are the same because three ROC curves are plotted by varying the distances and keeping other parameters fixed.
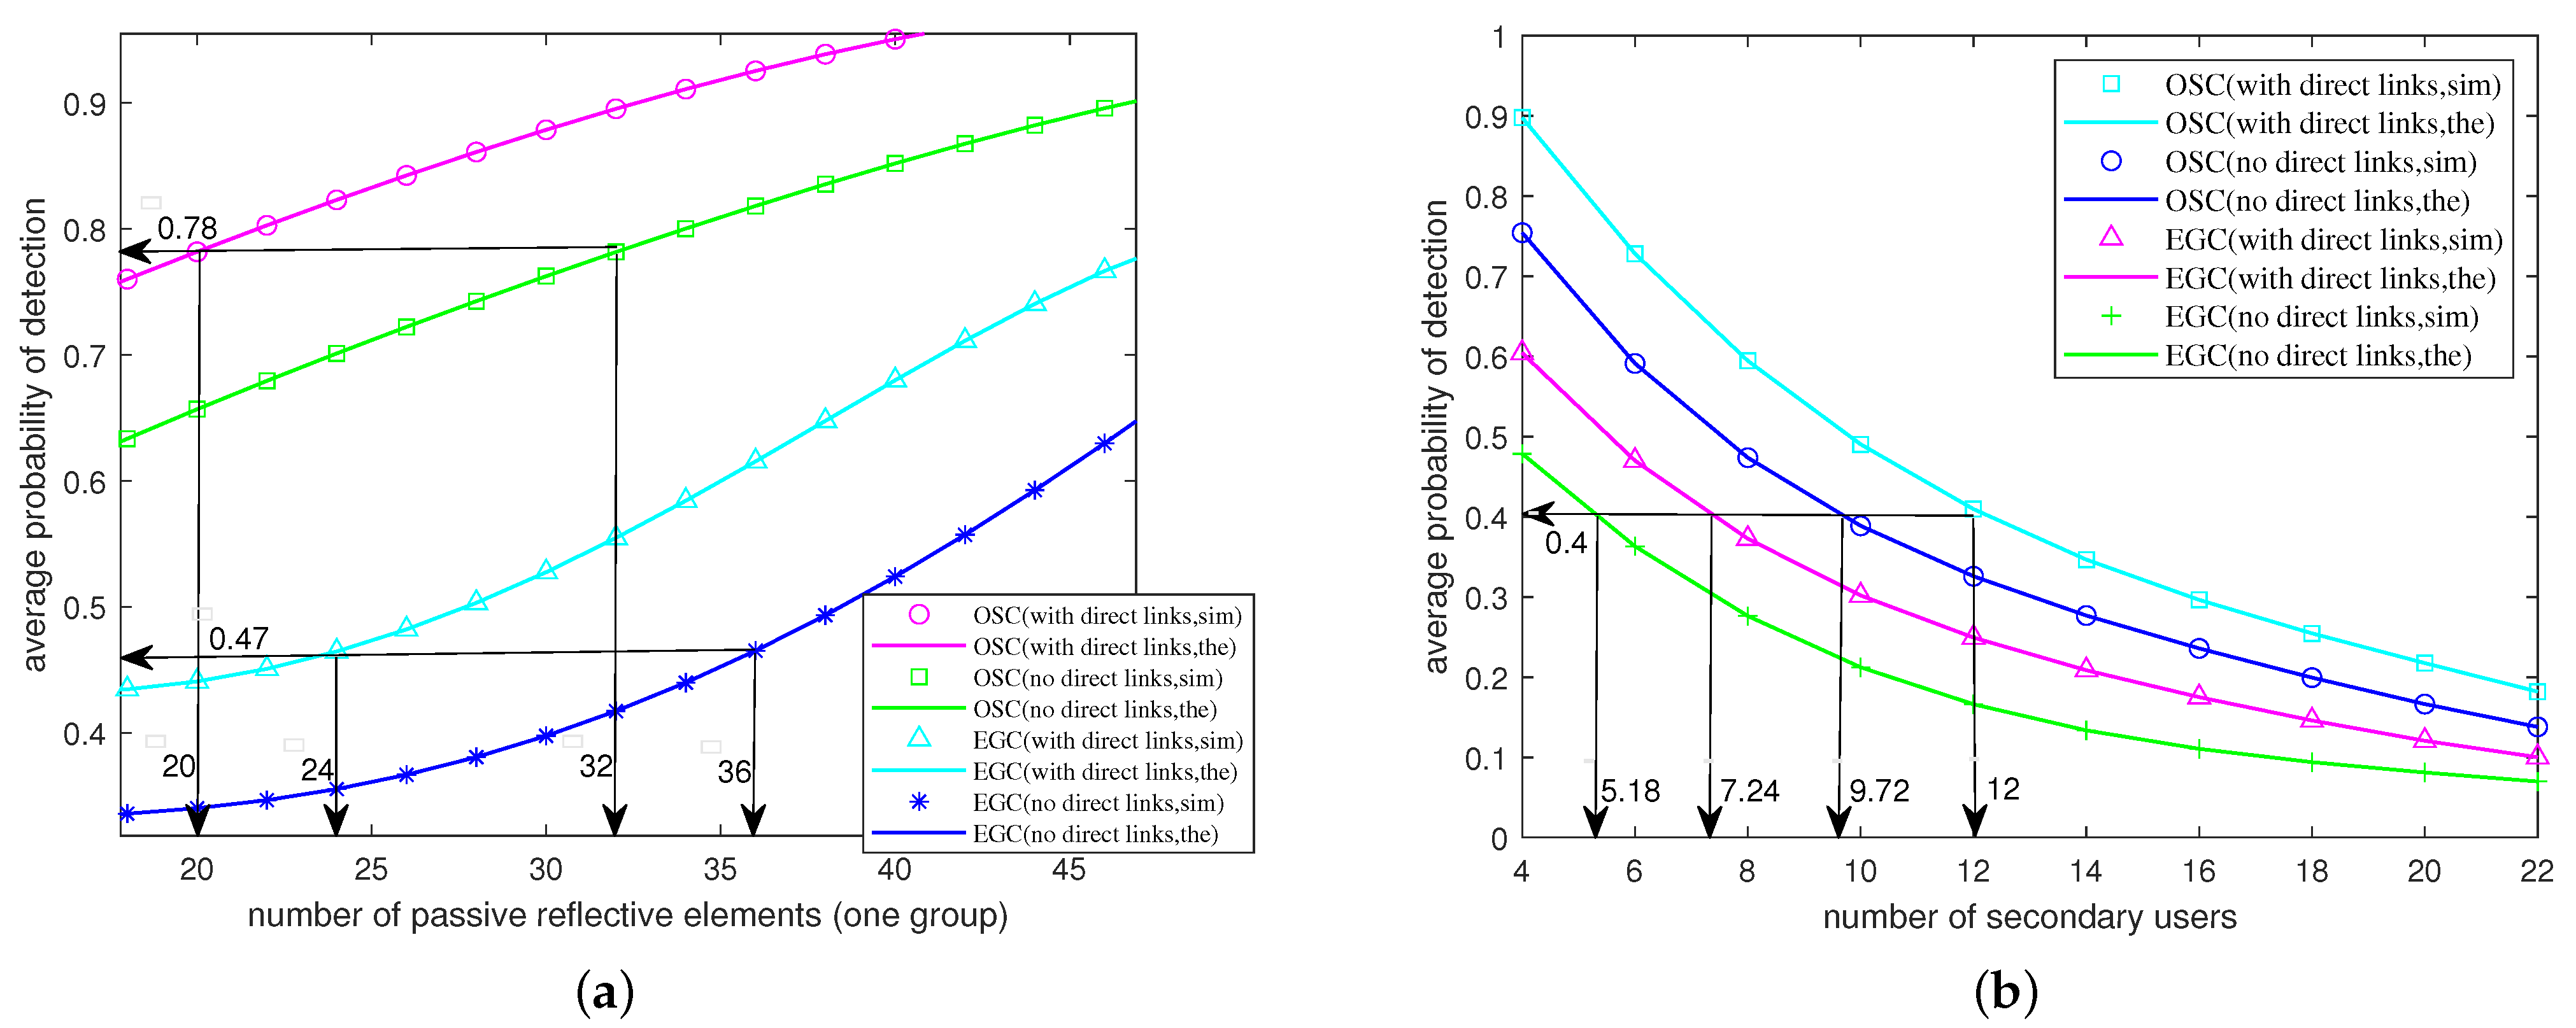
Figure 6a shows ROC curves for the average probability of detection (
) versus the number of elements in one group (
M). The probability of false alarm is set as
= 0.05. The transmit SNR of PU is set as
. Take the EGC and the OSC as an example. If the target
is given, the minimum
M can be obtained through the ROC curves in the
Figure 6a. For example, when the target
= 0.78, the minimum positive integer
(OSC, with direct links),
(OSC, with direct links). When the target
= 0.47, the minimum positive integer
(EGC, with direct links),
(EGC, no direct links) (upward rounding). It can be seen from the trend of ROC curves that the higher requirement of detection performance (
) needs the more elements in the IRS when the other parameters are the same. This is because the more elements in the IRS, the more auxiliary reflection links can be constructed, which can better overcome the randomness of the signal.
Figure 6b shows ROC curves for the average probability of detection (
) versus the number of SUs (
L) when given the limitation of the number of elements in the IRS. The probability of false alarm is set as
= 0.05. The transmit SNR of PU is set as
. The limitation of the number of elements is set as 64. Additionally, take the EGC and the OSC as an example. If the target
is given, the maximum
L can be obtained through the ROC curves in the
Figure 6b. For example, when the target
= 0.4, the maximum positive integer
(EGC, no direct links),
(EGC, with direct links),
(OSC, no direct links), and
(OSC, with direct links) (downward rounding). It can be seen from the trend of ROC curves that the lower requirement of detection performance (
) can serve the more SUs when the other parameters are the same. This is because the increase in the number of SUs means a higher detection threshold and a reduction in the number of elements at one group. In addition, it can also be seen from
Figure 6a,b that the IRS-enhanced CSS has good scalability. Because it can adapt to different detection requirements by adjusting the number of elements in the IRS and the number of SUs.
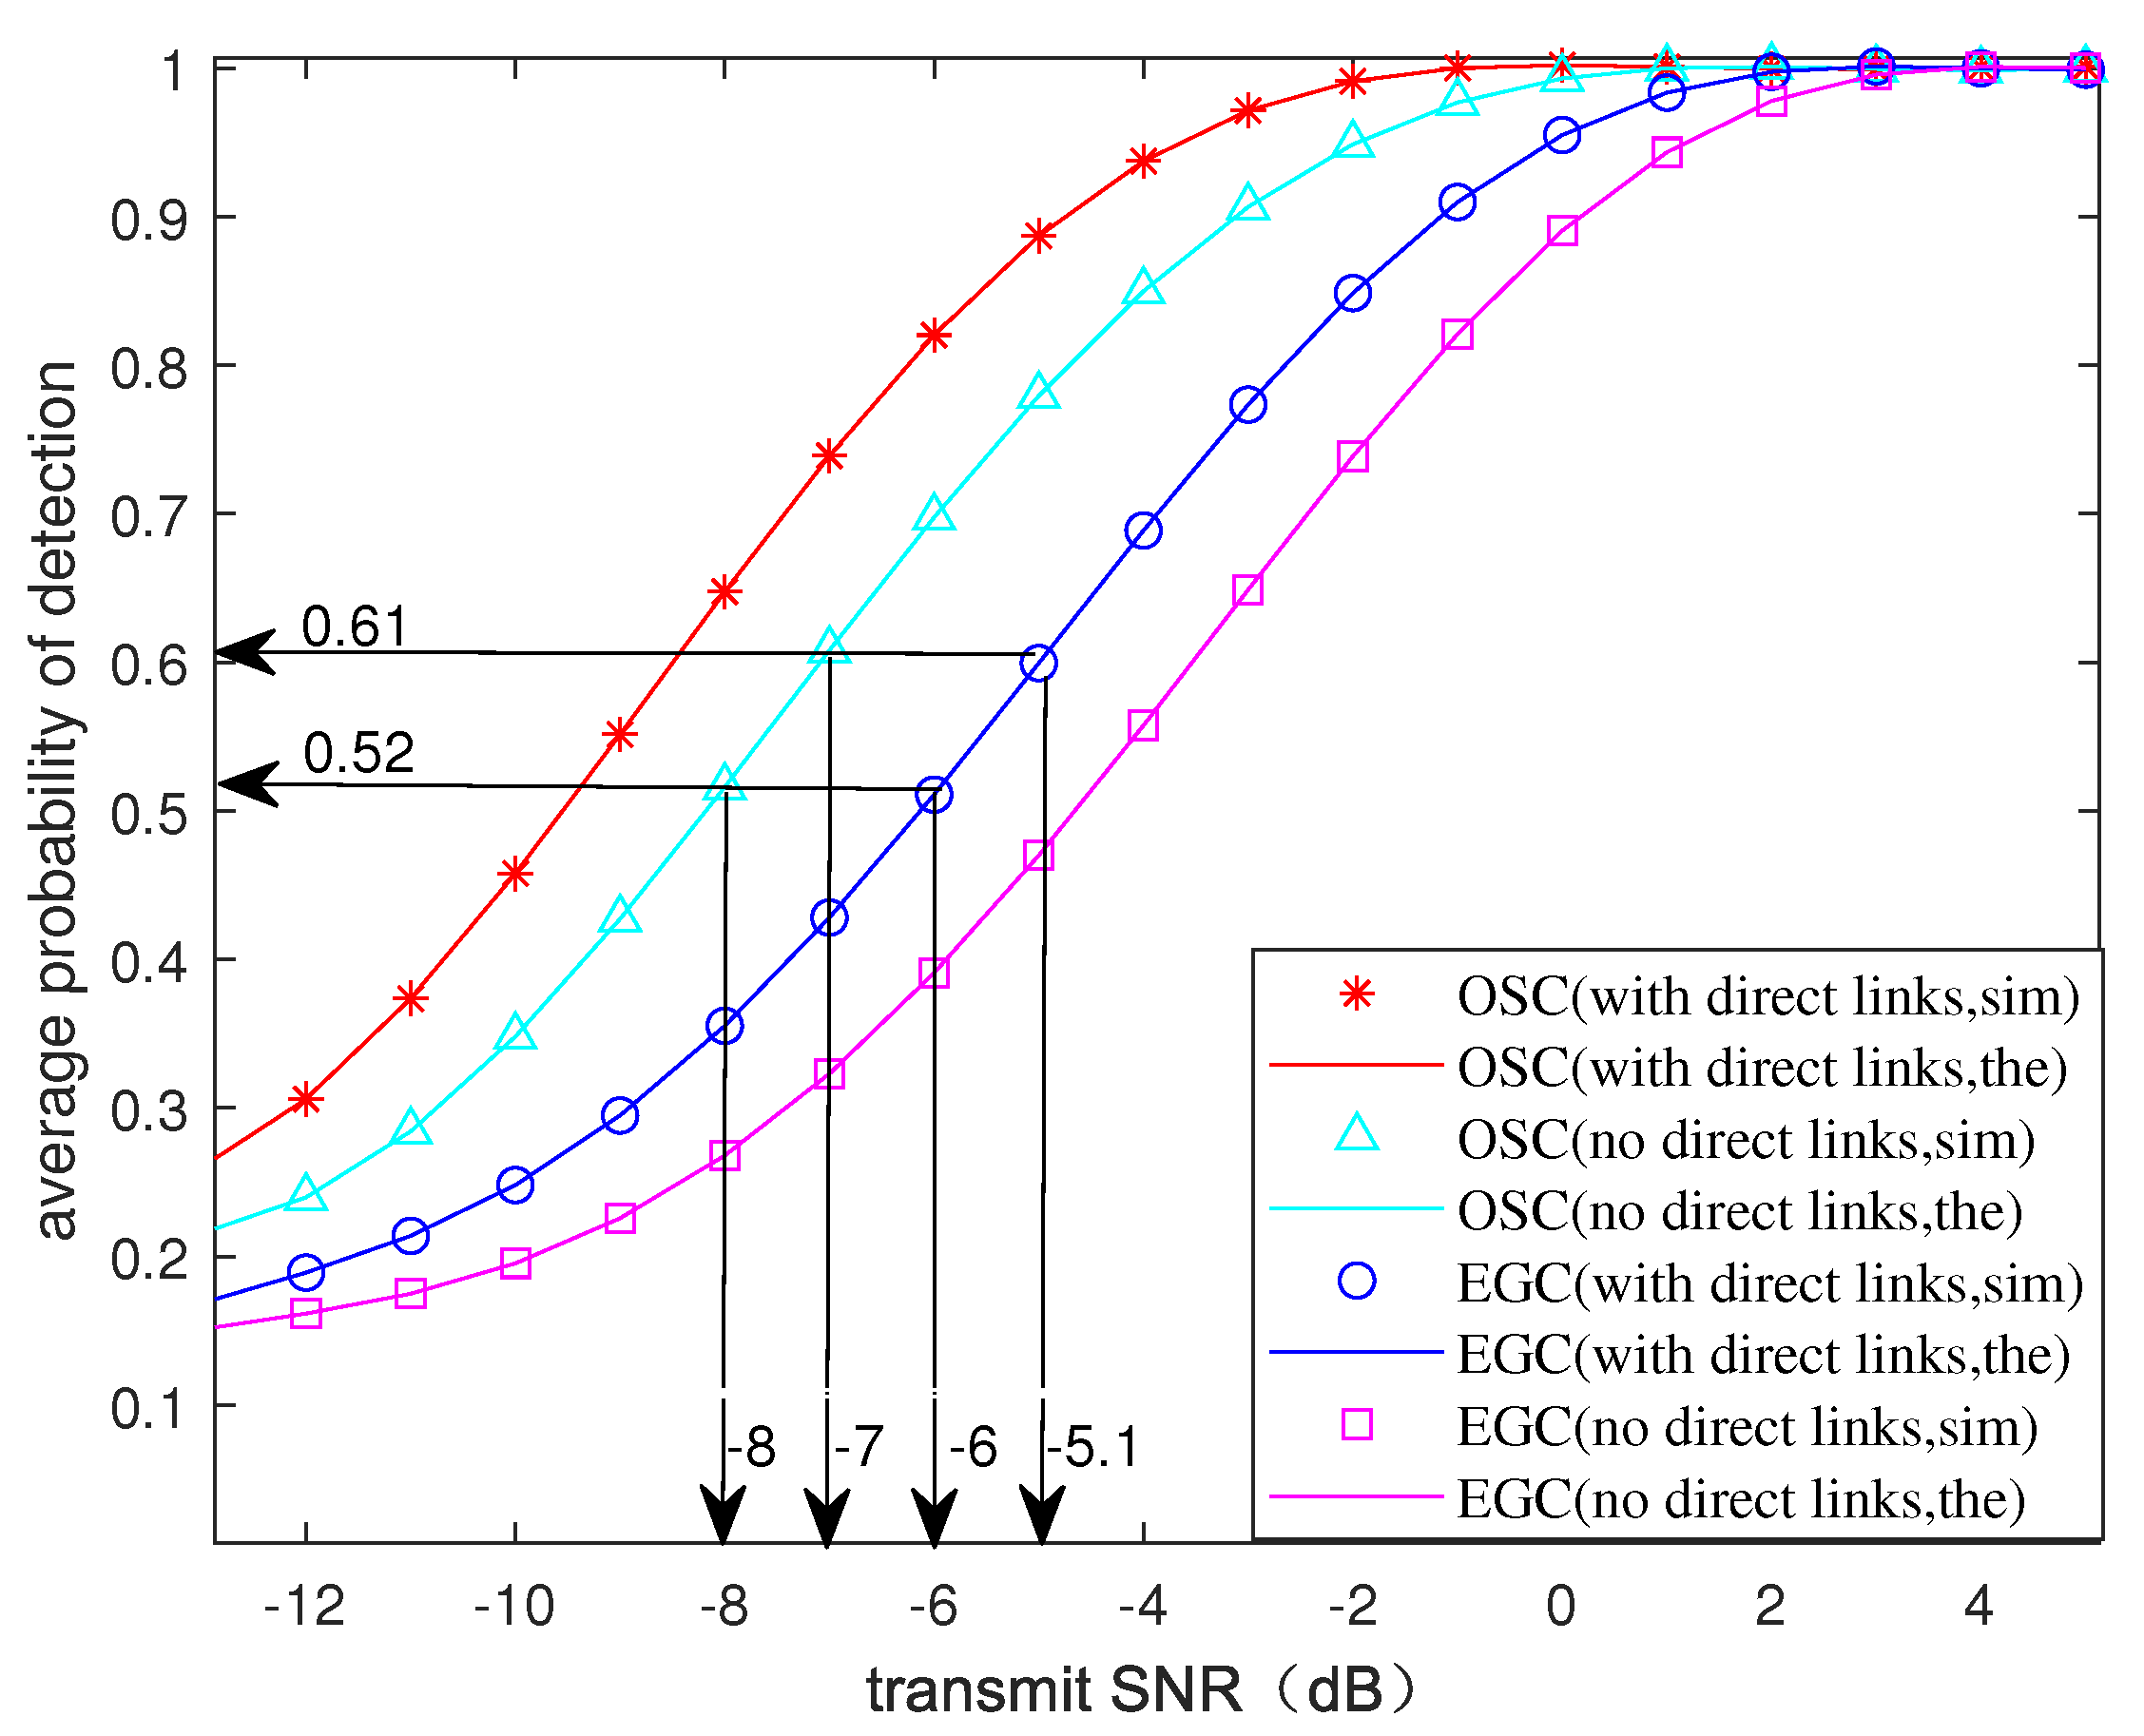
Figure 7 shows ROC curves for the average probability of detection (
) versus the transmit SNR of PU (
) in the IRS-enhanced CSS. The probability of a false alarm is set as
= 0.05. If the target
is given, the required minimum
can be obtained through the ROC curves in the
Figure 7. For example, when the target
= 0.61, the required minimum
(EGC, no direct links),
(OSC, no direct links). When the target
= 0.52, the required minimum
(EGC, with direct links), and
(OSC, with direct links). It can be seen from the trend of ROC curves that the higher detection performance (
) requires the higher
when other parameters are the same. This is because both poor transmission environment and weak transmit power (
P) can negatively affect the decision of the presence of PU.
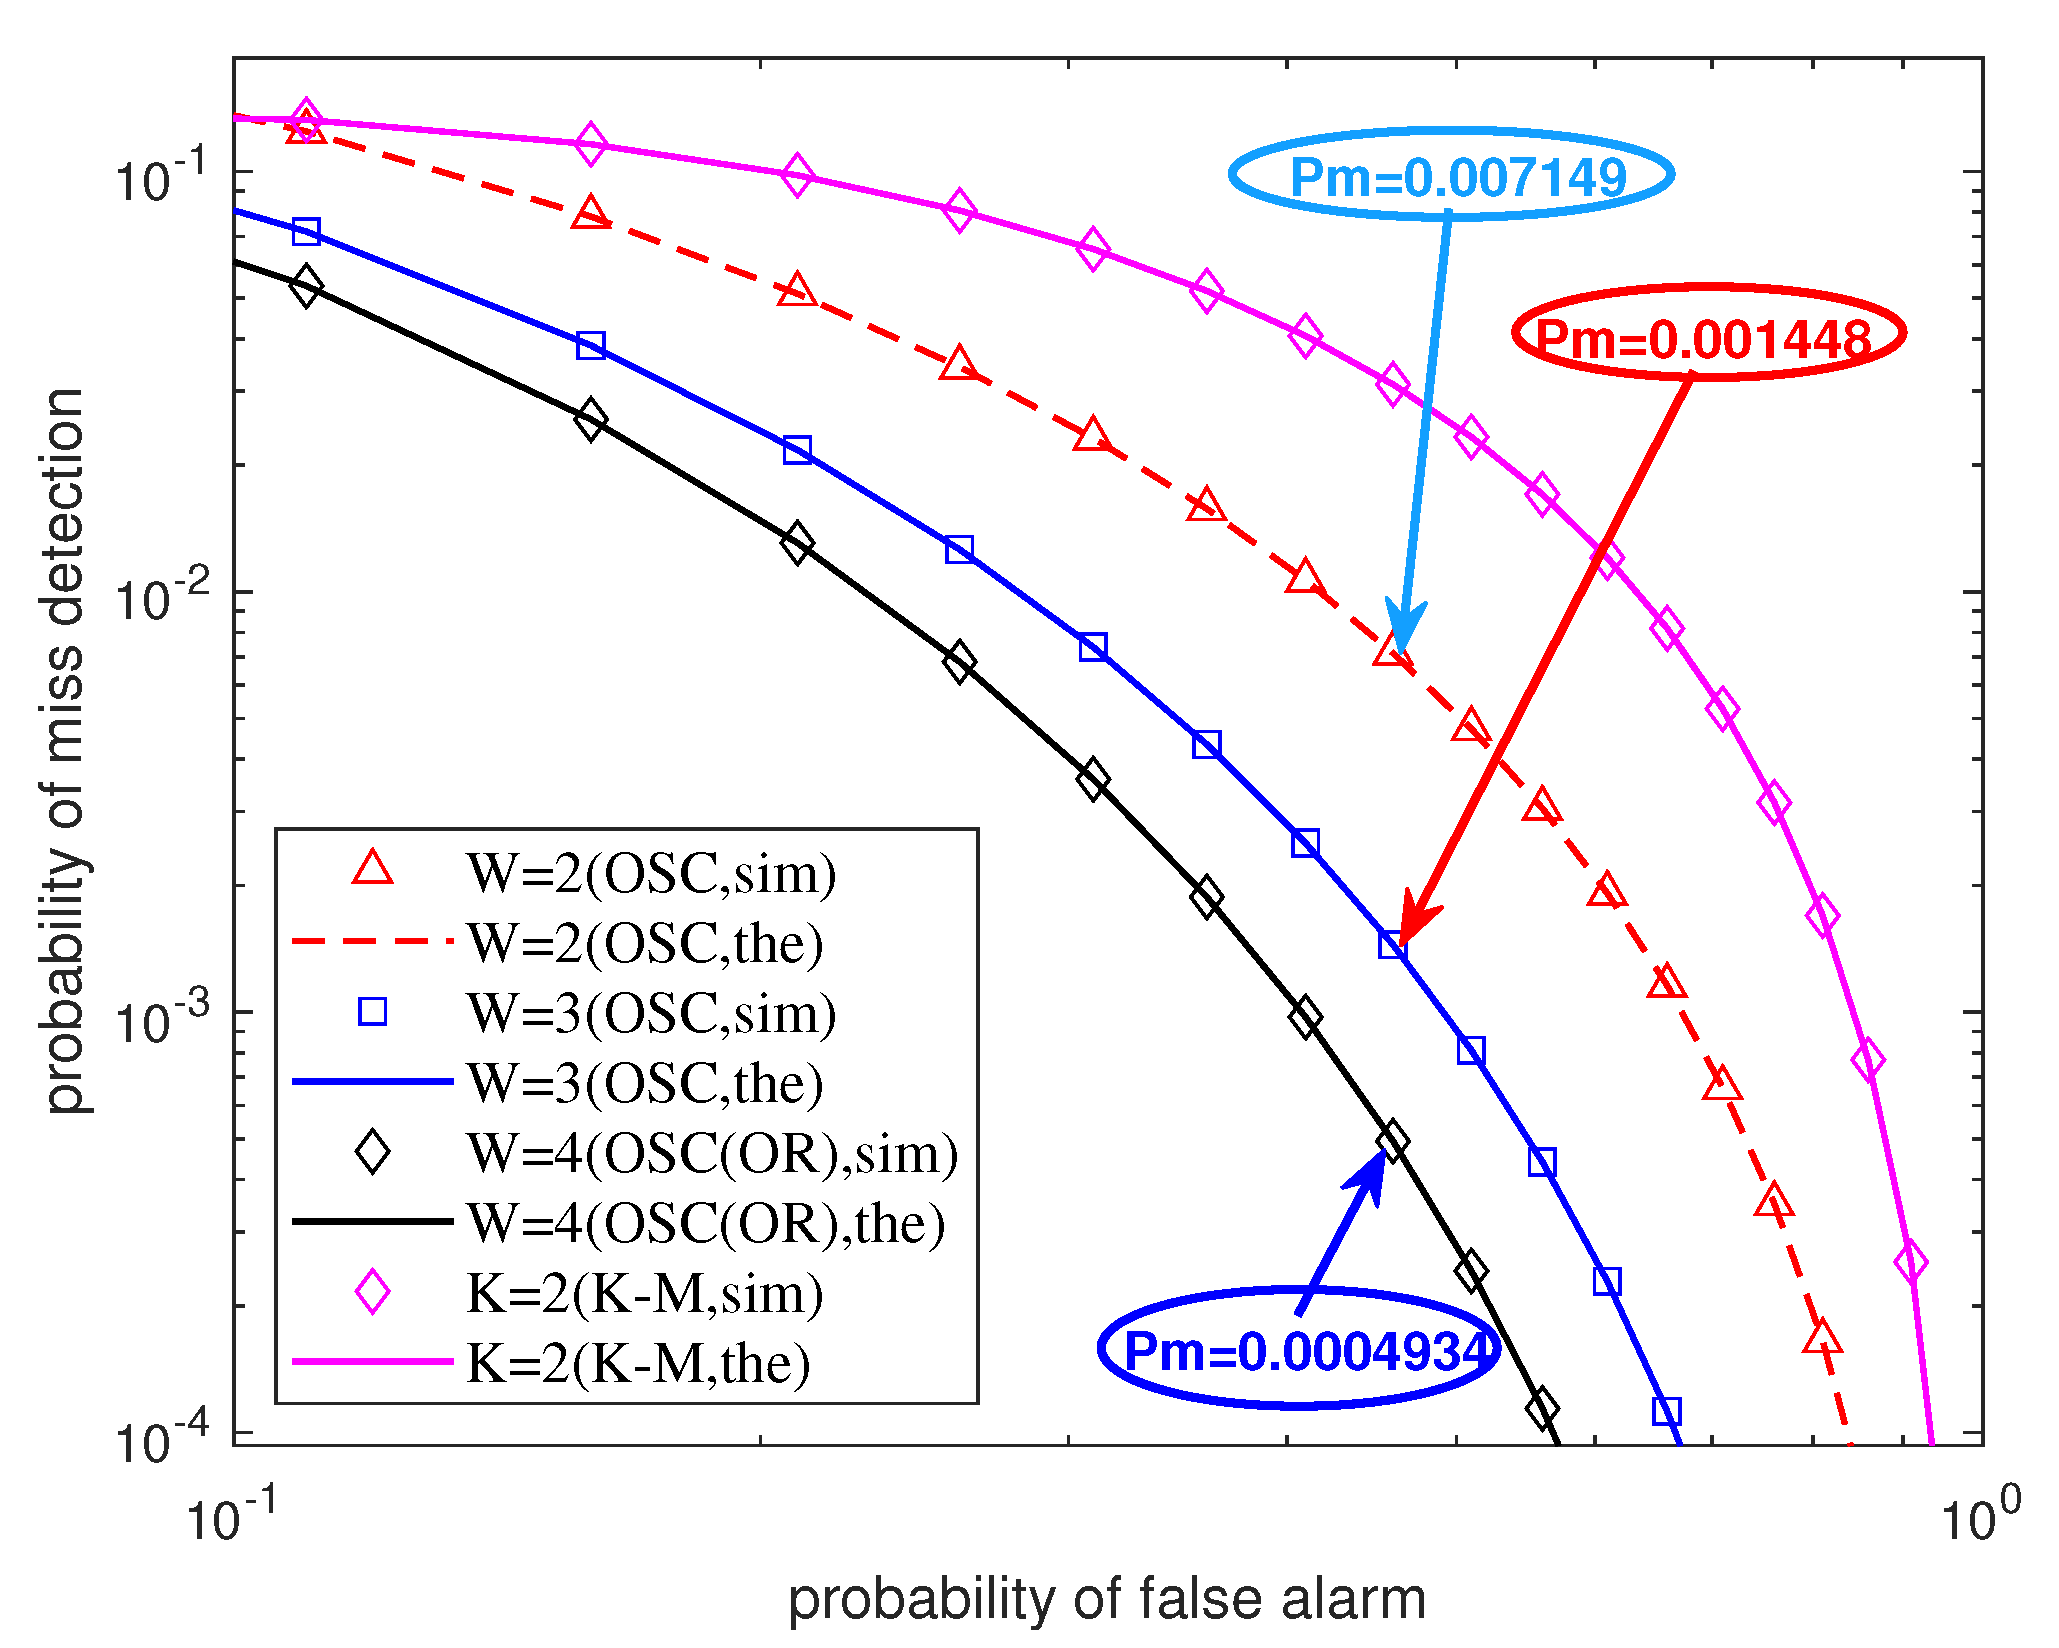
Figure 8 shows the detection performance of the OSC scheme (
W = 2, 3, 4) and the K-rank scheme (
K = 2). The transmit SNR is set as
. The result shows that the OSC scheme can further improve the detection performance comparing to the K-rank scheme. The adjustable threshold
W makes the OSC similar to the K-rank in terms of the applicability. When
, the OSC degenerates into the OR-rule. Furthermore, the detection performance of the OSC is proportionally associated with
W. The performance improvement offered by increasing
W from 3 to 4 is only 0.167 times the performance improvement achieved by increasing
W from 2 to 3, which is cost-ineffective. The reduction in
W makes the SUs with low SNR participate in cooperation, so
W should not be too large.
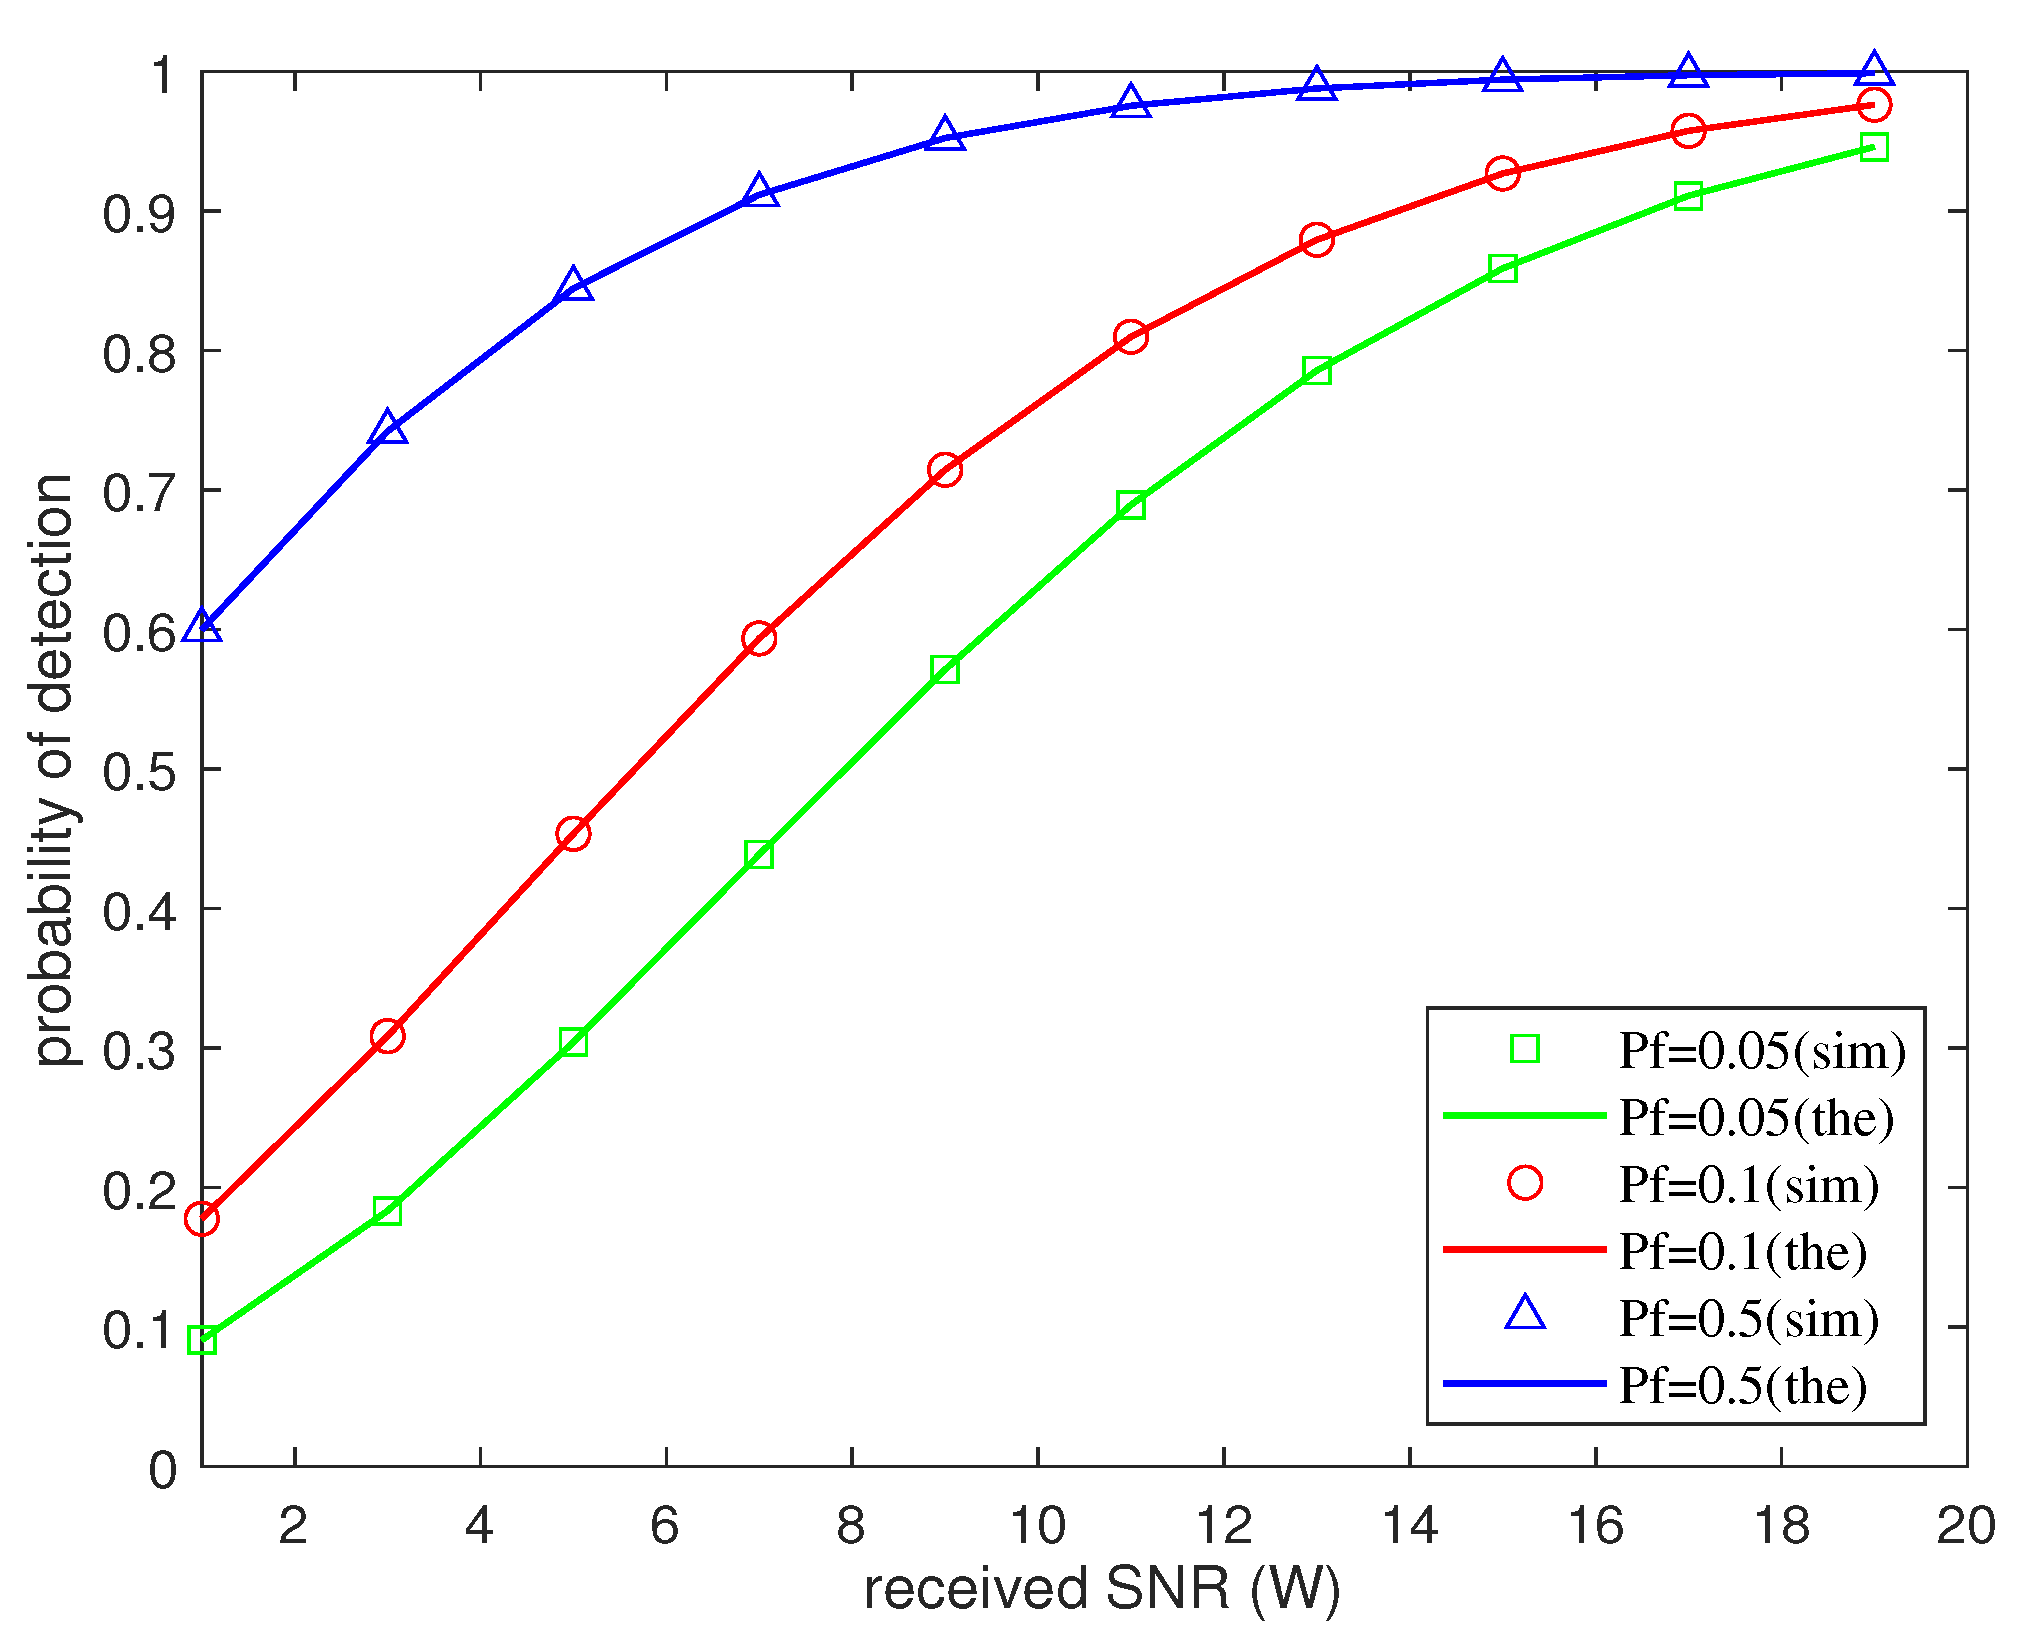
Figure 9 shows ROC curves for the probability of detection (
) versus the received SNR (
). Take the EGC as an example (other schemes have similar analysis procedures and the same result). It can be seen from the monotonicity of the ROC curves in
Figure 9 that the larger received SNR of SU means the higher probability of detection. This shows that maximizing the probability of detection is equivalent to maximizing the received SNR of SU. Therefore, the optimal phase shift corresponding to the maximum probability of detection probability can still be given as
, where
is the optimal phase shift of the
k-th element in IRS,
and
are the channel phases of
and
, respectively.


