Article

TMCS-ENN: A Temporal Feature-Correlation Cuckoo Search-Elman Neural Network for Sugar Raw Materials Demands Prediction

1
School of Computer Science and Information Engineering, Hubei University, No. 368, Youyi Road, Wuhan 430064, China
2
Engineering Research Center of Hubei Province in Intelligent Government Affairs and Application of Artificial Intelligence, Wuhan 430062, China
3
Engineering and Technical Research Center of Hubei Province in Software Engineering, No. 368, Youyi Road, Wuhan 430064, China
4
Hubei Academy of Scientific and Technical Information, Hongshan Road, Wuhan 430071, China
*
Author to whom correspondence should be addressed.
Electronics 2022, 11(15), 2370; https://doi.org/10.3390/electronics11152370
Submission received: 30 June 2022 / Revised: 13 July 2022 / Accepted: 25 July 2022 / Published: 28 July 2022
(This article belongs to the Section Computer Science & Engineering)

Abstract

:
The prediction of the demand for raw materials is of vital importance to modern industries. Most studies are based on traditional regression, linear programming, and other methods. Previous studies have often overlooked the characteristics of the sugar raw materials business and the influence of time factors on raw material demand, resulting in limited prediction accuracy. How to accurately predict the demand for sugar raw materials is one of the key issues for intelligent management. In view of the above problems, combined with the characteristics of the supply and demand cycle of sugar raw materials, this paper aims to predict the demand for raw materials based on their supply and demand in a real sugar company by optimizing the Elman neural network through the modified cuckoo search (MCS) algorithm with temporal features. This study proposes a temporal feature-correlation cuckoo search–Elman neural network (TMCS-ENN) for predicting the demand for sugar raw materials. The experimental results show that the accuracy of the TMCS-ENN model reaches 93.89%, a better performance than that achieved by existing models. Therefore, the study model effectively improves the accuracy of the demand forecast of sugar raw materials for companies. This output will be helpful for improving the production efficiency and automation level, as well as reducing costs.

1. Introduction

The sugar industry is a fundamental component of China’s food industry and also occupies an indispensable position in the country’s national economy. Under the recent circumstances of global economic integration, the accurate and efficient prediction of raw materials has become more important than ever, due to the rising cost of sugar raw materials and growing industrial development concerns [1]. In addition, manufacturing companies desiring to enhance their core competitiveness and obtain an invincible position should consider the entire supply chain of procurement, planning, production, and sales, especially the production process. This allows for maintaining the balance of production and reducing the overall cost of the company, in addition to increasing company profits [2].
The determination of the demand for raw materials is the core of procurement management of sugar companies. It is also the first step of the production planning process, and the basis for safe, smooth and continuous production. However, for most sugar companies, raw material procurement mainly relies on manual decisions, and requires a lot of labor and material resources. Due to subjective factors, it is relatively easy to generate an unreasonable purchase plan, resulting in a mismatch between supply and demand. Subsequently, this leads to increases in the various costs of a company. To ensure timely supply and production balance, and that the company’s economic benefits are maximized, an accurate prediction and strict control of the demand for raw materials is needed in order to determine when to purchase these materials as the market fluctuates. Measuring the market demand, purchasing materials, and inventory costs represent common challenges for many enterprises when making production decisions [3].
This paper aims to explore deep learning architectures for combining time series and temporal feature-correlation data for predicting the demand for sugar raw materials. Specifically, we focus on the problem of predicting the demand for raw materials, which has not yet received much attention. Over the last decade, major advances in deep learning have enabled the solving of artificial intelligence problems in different domains such as speech recognition, visual object recognition, object detection, machine translation, and combining time series [4]. It has been already shown that deep learning can outperform manual approaches for demand prediction [5]. However, few people have applied the concept to the demand for sugar raw materials. Moreover, the critical influence of the time factor has been neglected in developing more accurate demand prediction models. This paper attempts to bridge this gap and offer sugar companies an artificial intelligence solution to predicting the demand for sugar raw materials, rather than relying on manpower. In order to better apply the cuckoo search (CS) algorithm in solving the problem of function extremum optimization, and further improve the phenomenon of low precision and slow convergence in the optimization process of the algorithm, Jingsen Liu and Xiaozhen Liu proposed two subpopulations of the CS algorithm based on mean value evaluation [6]. By comparing and analyzing various kinds of time series forecasting algorithms, we propose a model based on the Elman neural network, optimizing the weights and thresholds of the Cuckoo Search algorithm with the addition of temporal feature correlation.
The remaining parts of this paper are as follows. In the next section, we review the relevant literature. Section 3 provides the background of the basic approaches of our model. Section 4 presents the proposed neural network architectures, and the experimental results are presented in Section 5. This paper ends with the conclusion, given in Section 6.

2. Related Work

Forecasting is closely related to all walks of life (e.g., web traffic forecasting, inventory trend forecasting, futures stock forecasting [7], daily passenger flow forecasting and time series [8]). The mathematician Yule proposed time series analysis to predict future market changes. Statistically speaking, a time series is a sequence of values of the same statistical indicators arranged in order of their occurrence. The main purpose of time series analysis is to make predictions about the future based on existing historical data [9]. Time series data essentially reflect the trend of some random variables with time, and the core of the time series prediction method is to mine this law from the data and use it to estimate future data [10]. By methods of observing, recording, analyzing, and so on, time series data reflect an object’s structural characteristics and its changes over a certain period. To date, many scholars nationally and abroad have proposed various methods to predict the demand for raw materials. In 1927, the British statistician G.U. Yue proposed an autoregression model (i.e., AR model) to analyze the time series behavior of sunspots, which was the earliest method of dealing with time series prediction [11]. Then, in 1931, Sir G.T. Walker of the United Kingdom used the MA (moving average) model and the ARMA (autoregressive moving average) model when analyzing the atmospheric laws in India [12]. Therefore, in the research of time series, we can obtain a project’s changing characteristics and development trends, and then effectively learn its future behavioral activities by analyzing its process and structural characteristics. In addition, during the process of analysis and prediction, it can be modified and designed to make the process and results run in the expected direction. Time series can be roughly divided into four groups: long-term or trend change, cyclic variation, seasonal fluctuation, and arbitrary fluctuation. The proposal of these methods paved the way for time series research. Ni Dongmei and Zhao Qiuhong put forward a comprehensive demand forecasting model combining time series analysis and multiple regression, and introduced the forecasting model into inventory decision-making to construct a comprehensive demand forecasting and inventory decision model based on minimum inventory cost [13]. To solve the non-linear problem with better performance, scholars have proposed many non-linear time series modeling methods. In 1943, American neurophysiologist and cybernetician of the University of Illinois at Chicago, Warren McCulloch, and self-taught logician and cognitive psychologist Walter Pitts published “A Logical Calculus of the ideas Imminent in Nervous Activity”, describing the “MP neuron”, the first mathematical model of a neural network [14]. McCulloch and Pitts coproposed the MP model, which aroused the interest of many scientists, using an artificial neural network to deal with forecasting problems. For relevant enterprises, the BP neural network method was used to forecast a large number of spare parts according to the non-linear and time series characteristics of spare parts demand forecasting. The back-propagation (BP) neural network algorithm is one of the most widely used neural network models. It is a type of multi-layer feed-forward network trained by an error back-propagation algorithm [15]. Xia Yuanqiang and Yang Jianming proposed a BP neural network method, which is a high-precision algorithm for predicting spare parts demand [16]. BP neural network technology is used to help process-type companies to forecast product sales when researching their supply chain, and then a forecast-based process supply chain model is proposed by multi-agent technology. In a supply chain based on BP, the neural unilateral prediction agent has the function of self-organization and self-learning, and according to the influencing factors of data variables regarding customer sales, such as season, customers, and product quality, the input vector through the forward calculation and error back propagation of the signal can automatically adjust the network weights, after data training and the study of the forecasting agent with the signal. The test response function enables the predictive flow of input factor variables for customer distribution and supplier procurement. Manufacturers can obtain product prediction information [17]. Huang Yaobin and Cai Qiuming proposed a demand forecasting method based on support vector regression. Support vector regression (SVR) is an important application aspect of SVM. The biggest difference between SVR and previous regression methods is that it is based on the principle of structural risk minimization and theoretically ensures that SVR has good accuracy and extensibility. The problem of neural network algorithm overlearning, underlearning and local minima is solved effectively [18]. In order to solve the problems of fast convergence and low accuracy of the BP neural network, Zong Chensheng and Zheng Huanxia proposed an improved particle swarm optimization algorithm to optimize the BP neural network prediction model, resulting in higher prediction accuracy and stronger adaptability [19]. To solve the problems of high nonlinearity and uncertainty of hydrological time series, under the background of continuous development of in-depth learning, a combined hydrological time series forecast model based on a convolutional neural network and the Markov chain was proposed [20]. In software engineering, the main task is to predict the defect tendency of modules. This helps developers to effectively find bugs and to prioritize their testing efforts. Kun Song, ShengKai Lv et al. proposed an improved Elman neural network model to enhance the adaptability of the defect prediction model to time-varying characteristics. In particular, the initial weight and threshold of the Elman neural network were optimized by adding an adaptive step to the cuckoo search (CS) algorithm [21]. The neural network has shown great advantages in solving non-linear complex prediction problems, but has seldom been applied to research in the sugar industry.

3. Background Knowledge
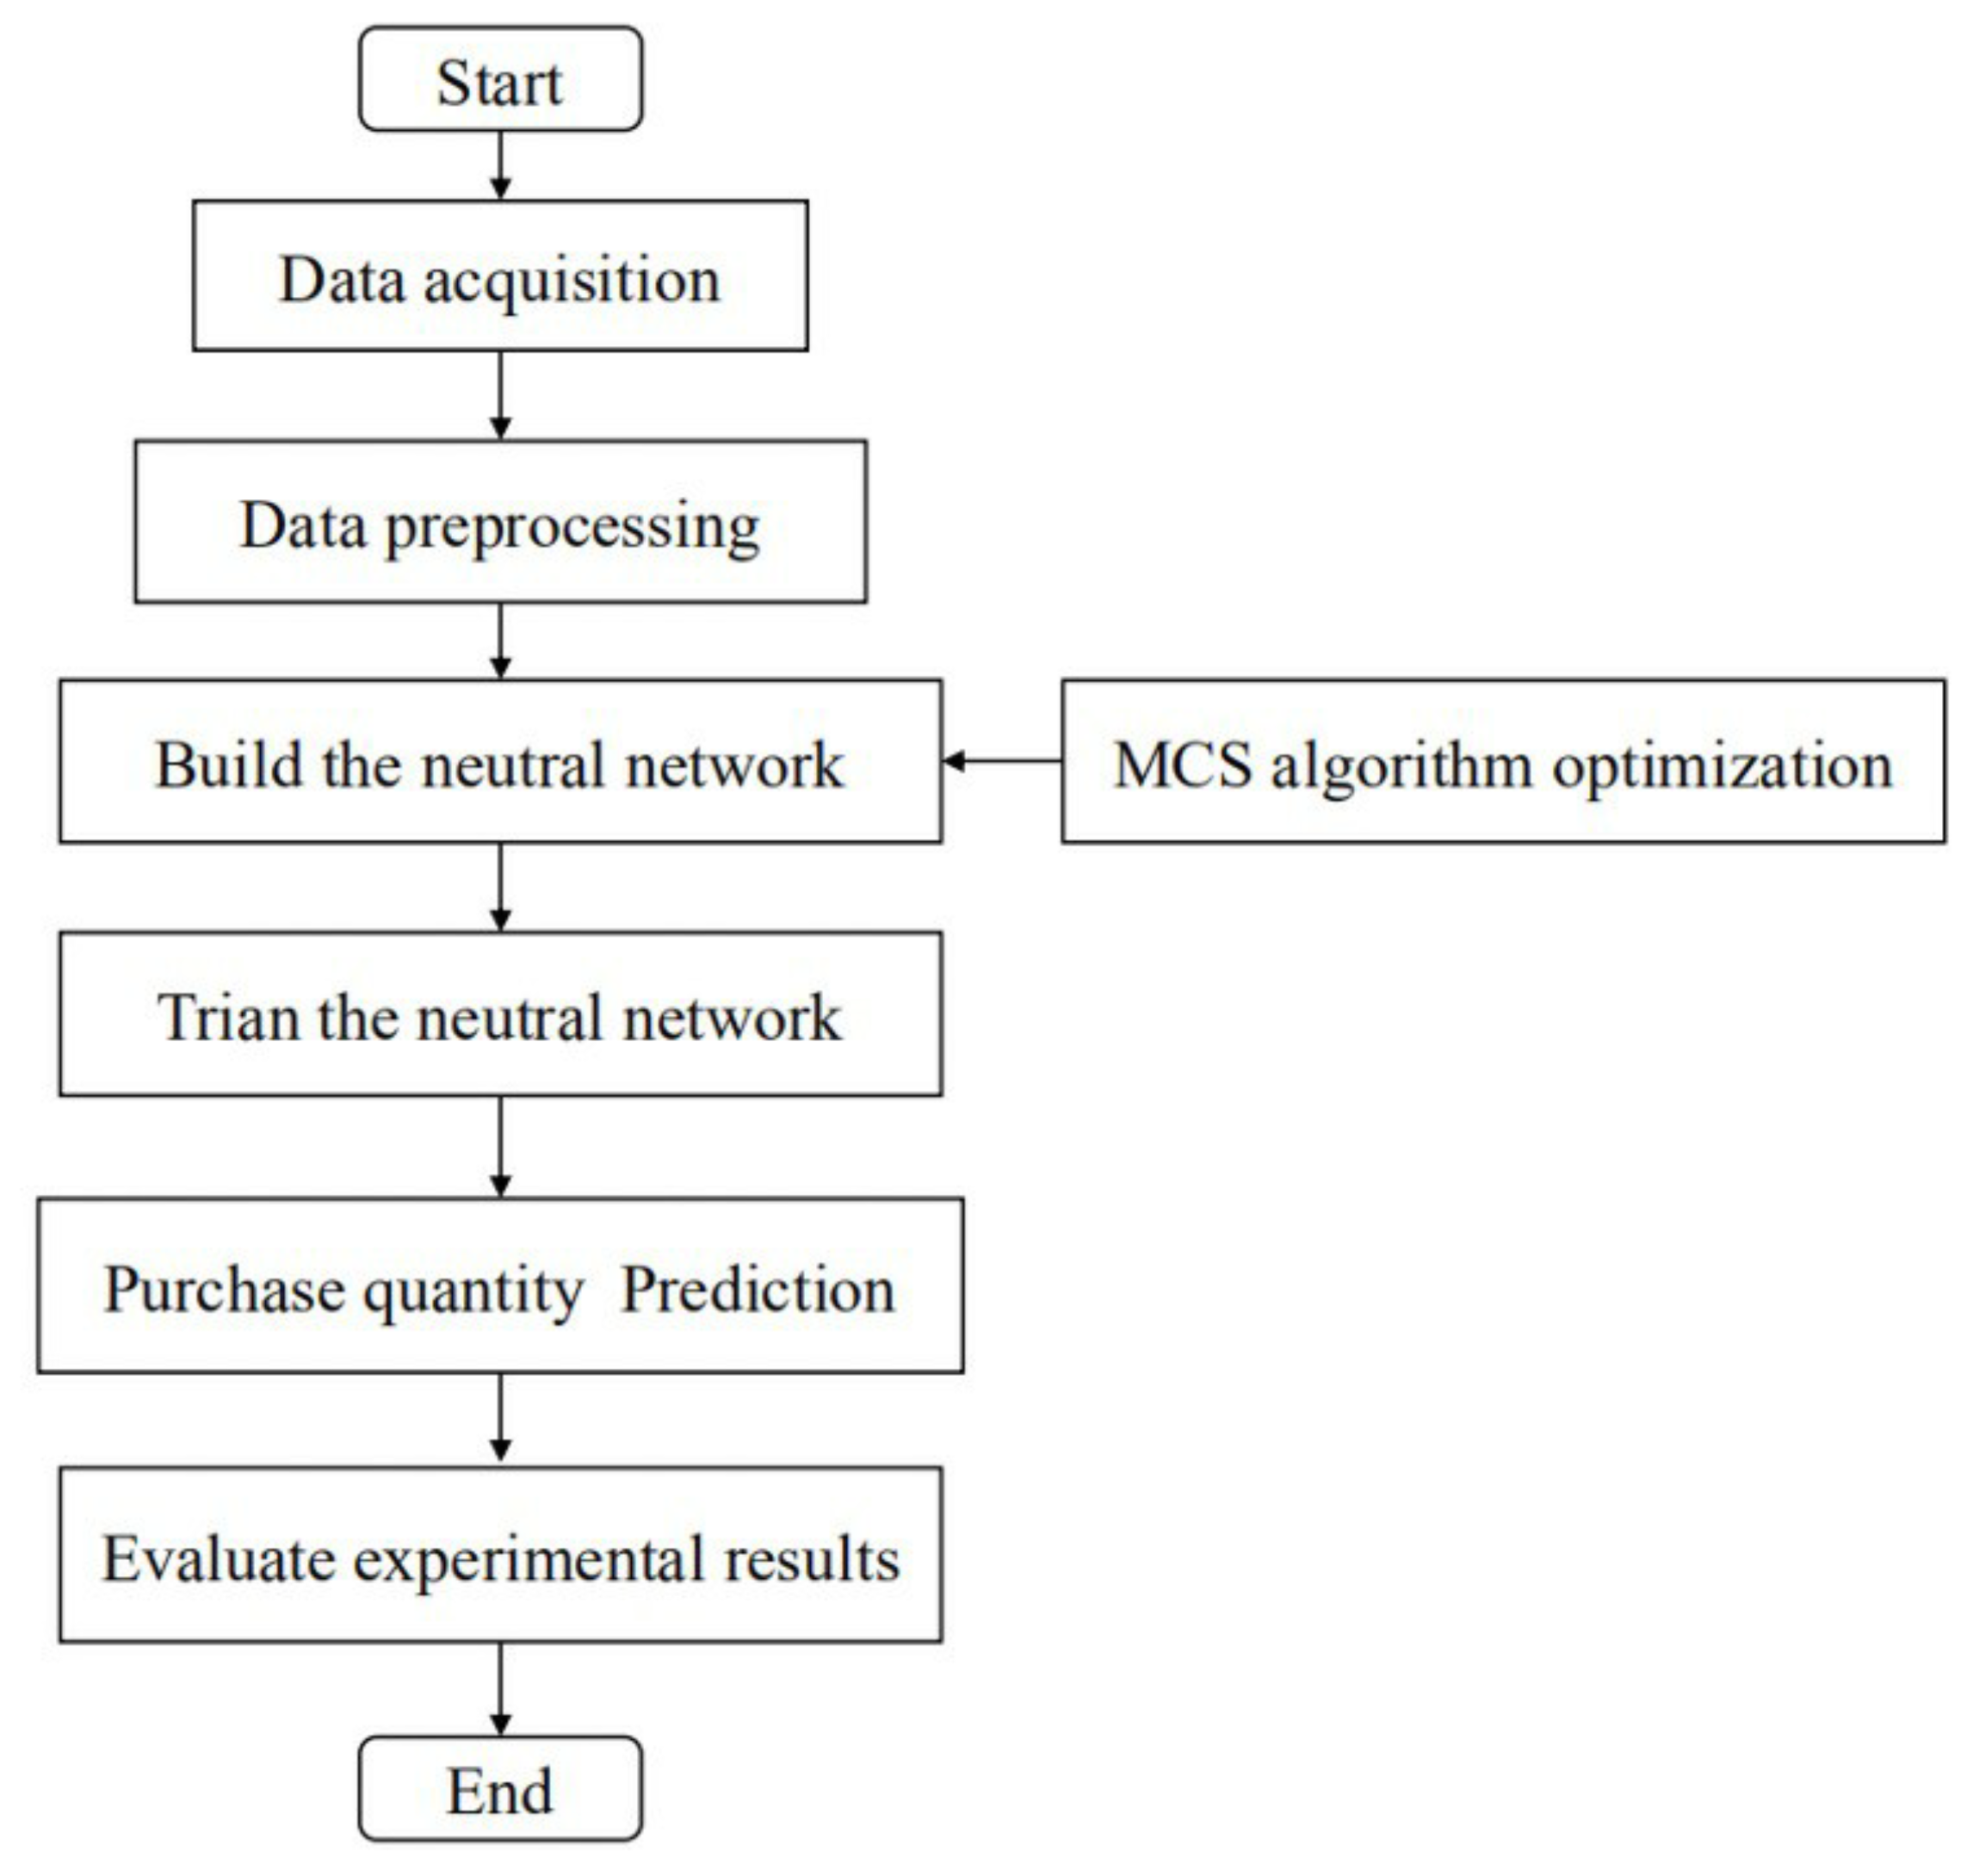
3.1. Research Ideas

Demand forecasting for sugar raw material represents a typical time series forecasting problem. For sugar enterprises, the demand for sugar raw materials in daily production activities is usually limited by multiple conditions, such as purchase price, product sales volume and purchase time, which causes it to have distinct non-linear characteristics. For non-linear problems, traditional time series prediction models bear some limitations, resulting in poor final results. The use of a neural network compensates for the deficiency of the traditional time series prediction model. Therefore, this paper chooses a neural network as the basic model of raw sugar demand prediction.
The output of the static neural network depends only on the current input and has no memory, rendering it ineffective for solving time series prediction problems with time series dependence. In order to implement memory into the system, so that it can adapt to time variation, the Elman neural network (ENN) model is used. This model has the structural characteristics of internal feedback and a feed-forward connection, resulting in memory characteristics. ENN solves the problem of the neural network lacking a dynamic memory function by collecting and storing the output value of the hidden layer. This is achieved by taking the continuation layer as a demonstration operator added to the hidden layer.

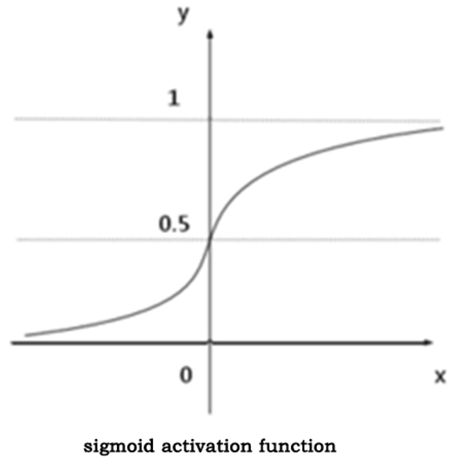
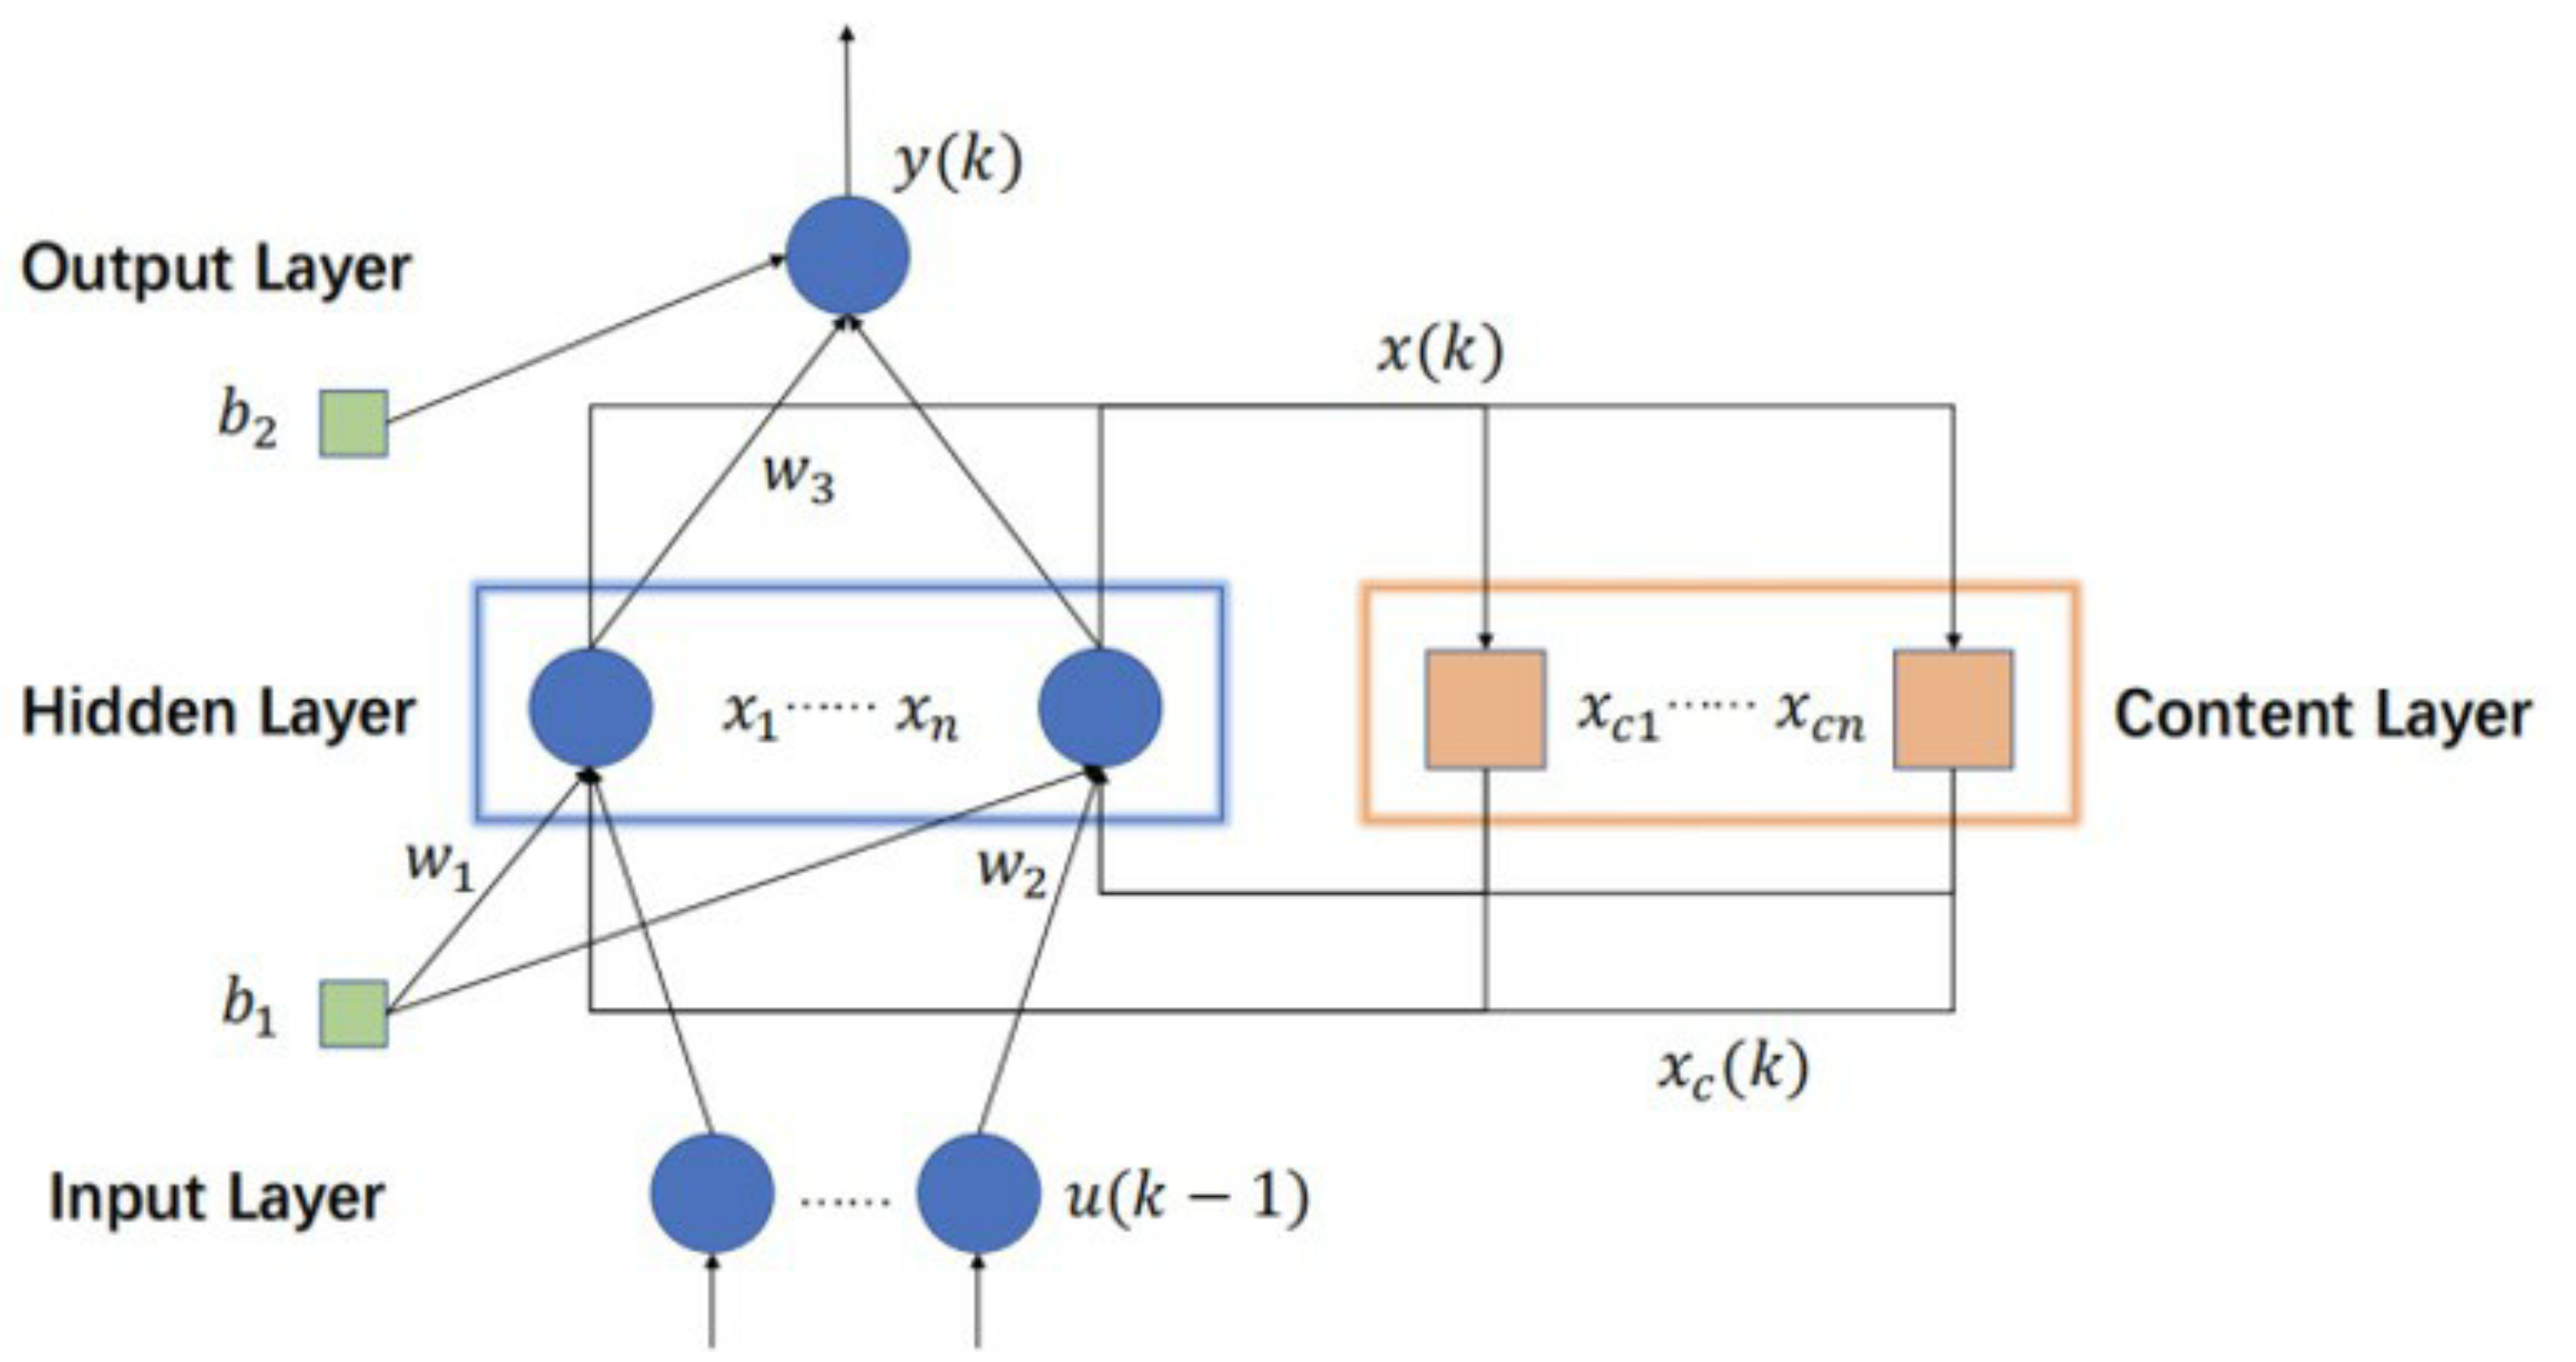
3.2. Elman Neural Network

Based on the BP network, J.L. Elman proposed the Elman neural network in 1990 [22] to enable system memory and thus adaptation to time changes. The Elman neural network is a dynamic recurrent neural network [23]. Because of its dynamic memory function, the Elman neural network has been widely used as an effective system identification tool in many fields. However, its online learning speed is too slow, which restricts its development. In order to solve this problem and accelerate the convergence process, Wang Yan and Qin Yuping et al. proposed a method to improve the Elman neural network with the RPROP algorithm, and applied this method to the Bouguer sequence prediction problem [24]. The structure of the Elman neural network is shown in Figure 1 below.
Typically, the topology of the Elman neural network is divided into four layers: the input layer, hidden layer, content layer, and output layer. The content layer is used to store the preceding outputs of the hidden layer by using a positive-feedback mechanism [25]. It is a two-layer back-propagation network, and the adjustable associations among the input layer, hidden layer, and content layer allow it to be considered as a special kind of feed-forward network, which grants it the ability to remember this internal state, thus resulting in a better performance with time-varying characteristics [26].
According to Figure 1, we can obtain the following equations defining the ENN with n inputs and one output:
y ( x ) = g ( w 3 x ( k ) )
x ( k ) = f ( w 1 x c ( k ) + w 2 u ( k 1 ) )
x c ( x ) = x ( k 1 )
Here, y ( k ) defines the output of the Elman neural network, x ( k ) defines the output of the hidden layer, x ( k ) defines the output of the context layer, u ( k 1 ) is the input of the neural network, and w 1 , w 2 and w 3 represent the weight of the input layer to hidden layer, context layer to hidden layer, and hidden layer to output layer, respectively. Function g() is the activation function of the output layer, and function f() is the activation function of the hidden layer with sigmoid function as follows:
f ( x ) = 1 1 x α x
The sigmoid activation function is a non-linear processing of the linear aggregate of each neuron. Neural networks can perform non-linear mapping. In view of the function saturation phenomenon caused by large data fluctuation, the excitation function of feed-forward network usually adopts the sigmoid function to normalize the input quantity. The figure below shows the sigmoid activation function.
Electronics 11 02370 i001

3.3. Cuckoo Search Algorithm

Based on the study of cuckoo hatching behavior and Levy flight, Yang and Deb et al. described this process through mathematical language and proposed an emerging metaheuristic cuckoo search algorithm [27]. An opposition-based learning (OBL) strategy and local enhanced search are introduced to improve the basic CS, which can solve the problem of the search step potentially not being appropriate [28]. The cuckoo search algorithm was obtained by simulating cuckoo brooding behavior and Levy flight. Parasitic brooding refers to the no-nesting, no-hatching, and no-brooding behavior of cuckoos, relying on other birds to complete reproduction. In this process, each time a cuckoo looks for a usable nest, the flight path is in line with Levy flight. Its flight path is a stochastic process in which high-frequency short steps and low-frequency long steps alternate, and the smaller jumps are separated by large jumps [29].
The cuckoo search algorithm is based on the study of parasitic brooding behavior and the Levy flight mechanism [30]. This algorithm uses Levy flight to upgrade the optimal solution to further enhance its global searching ability, and easily obtain the global optimal solution. According to the parasitic nature of nesting and the Levy flight mechanism, some solutions need to be discarded and updated. Figure 2 shows the flowchart of the cuckoo search algorithm.
In the Cuckoo Search Algorithm, each cuckoo updates its position according to the following equation:
x t ( t + 1 ) = x t t + α L ( λ ) , i = 1 , 2 , , n
where x i t + 1 is the updated position of nest i in the t generation, α denotes the step size that is drawn from normal distribution. The product ⨁ represents entry wise multiplications. L ( λ ) is the path of random walk via Levy flight, and the random step length s obeys Levy distribution:
L ( s , λ ) s λ

3.4. Variables and Acronyms Definition

For the Acronyms and variables that are widely used in this paper, we include the following table:
TypeAbbreviationFull Name
AcronymsCS algorithmCuckoo search algorithm
AcronymsMCS algorithmImproved cuckoo search algorithm
AcronymsENNElman neural network
AcronymsTMCS-ENNMCS-Elman neural network
AcronymsRMSERoot-mean-square error
AcronymsMAPEMean Absolute Percentage Error
Variables x i ( i + 1 ) The updated position of nest in CS algorithm
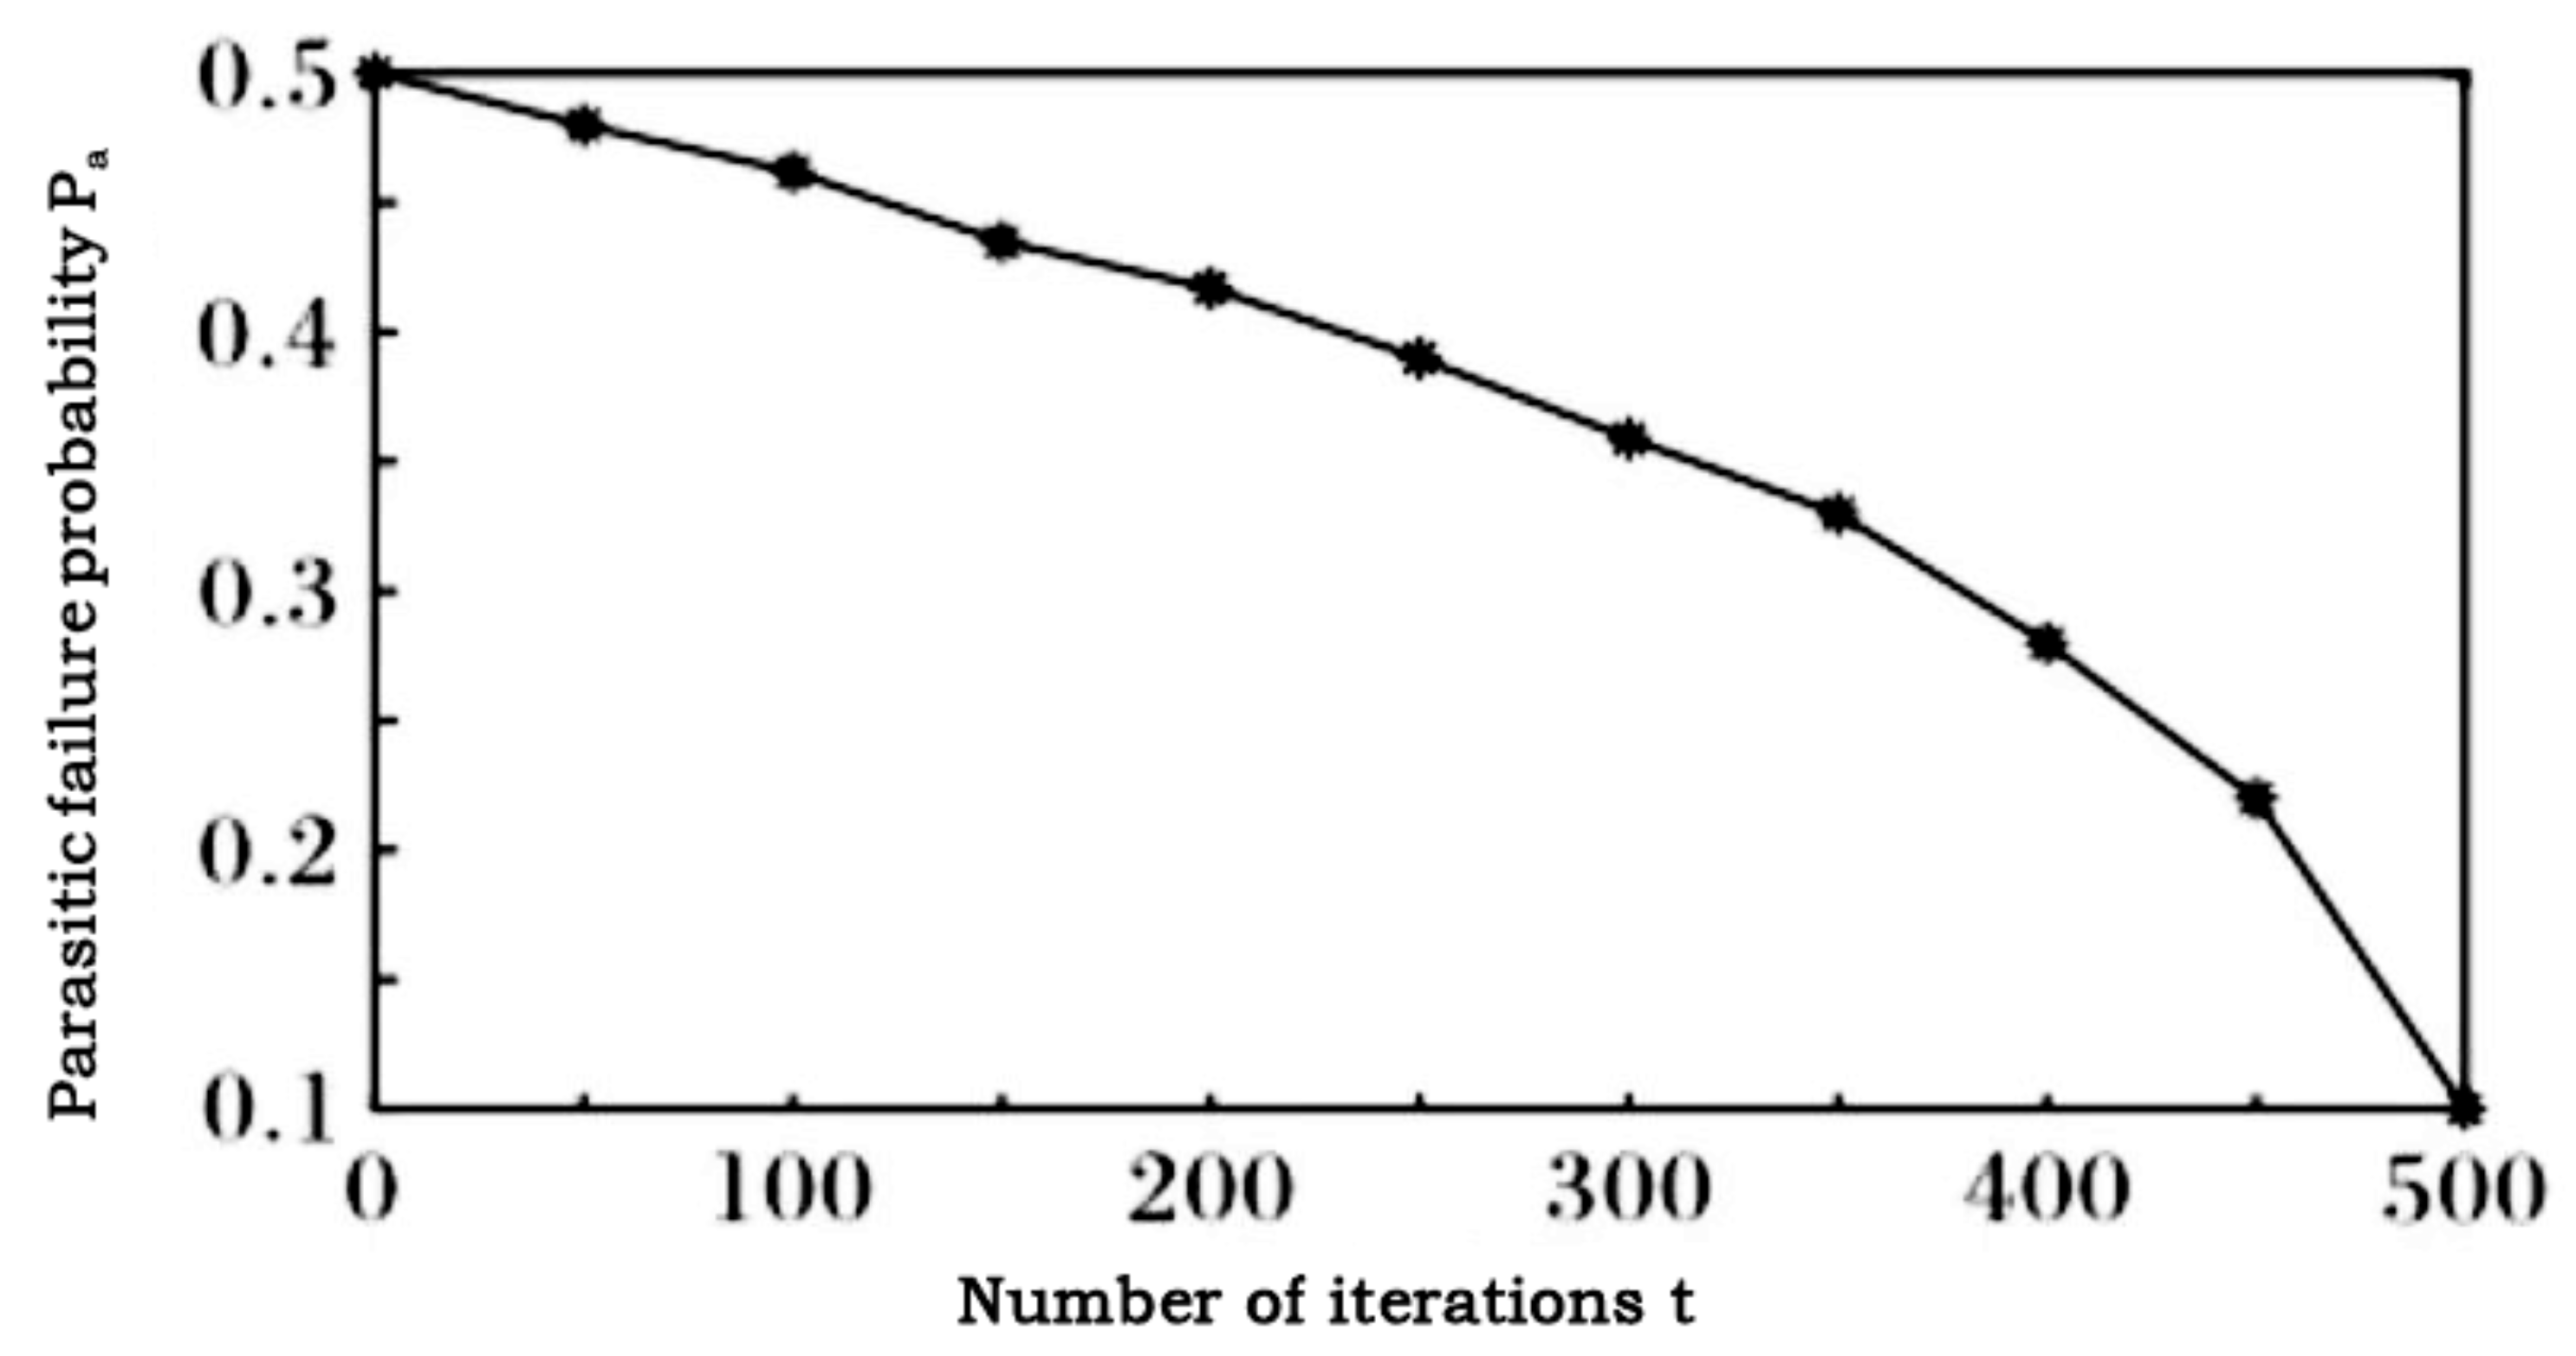
VariablesPaParasitic failure probability
VariablestNumber of iterations

4. The Temporal Feature-Correlation Cuckoo Search-Elman Neural Model

In this section, we illustrate our proposed TMSC-ENN general-purpose methodology for predicting the demand for raw materials based on deep learning techniques. We begin by representing our analysis and research approach on the forecasting model, and then we present the architecture of the TMCS-optimized Elman neural network.

4.1. Research and Analysis

A scientific and rational procurement of sugar raw materials is not only the key to both normal production and normative procession, but is also a starting point for sugar companies. In addition, ensuring this first step provides a guarantee that companies can maintain production continuity [31]. There are many kinds of sugar raw materials purchased by enterprises. The most common is generally raw sugar, including Brazilian sugar, Australian sugar, Thai sugar, etc. Sugar across the world is mainly extracted from sugarcane and beet, which account for 80% and 20% of the total supply, respectively. As the first producer and exporter of raw sugar, Brazil has a mild climate, abundant rainfall, and a large amount of sunlight and fertile land, which is highly suited to the growth of sugarcane. It is the only country in the world that has two periods of sugarcane harvest and processing per year. Brazil’s sugar processing technology and equipment are in the leading position globally, so the length of their raw sugar processing cycle is shorter. Moreover, the method of planting sugarcane in Brazil is divided into early, medium and late maturing varieties in sugarcane areas, ensuring the stability of sugar production throughout the year. According to a survey, Brazilian raw sugar accounts for a large proportion of sugar raw materials purchased by sugar enterprises, with sugar raw materials from other countries making up the rest. However, the traditional method of procurement is excessively dependent on human resources, which may cause some unnecessary costs. To ensure that the demand and supply of various sugar raw materials are met at any time during production, a balance between the supply and demand of raw materials should be achieved to minimize losses such as production cost, inventory cost, and raw material impairment, thereby improving the economic benefits of the company. To these ends, we attempt to automatically predict the demands using historical data [32].
Based on the Elman neural network (which we proposed in the last section), we optimized our approach in terms of three aspects: We first make the parasitic-failure probability and step-size control of the CS algorithm adaptive. Then, we use the MCS algorithm to upgrade the weight and threshold of the Elman neural network. This is to solve the problems of slow convergence and the high likelihood of falling into a local minimum, thereby improving prediction accuracy. Finally, by analyzing the historical data of the year 2017, we found that due to the influence of traditional Chinese customs, holidays cause fluctuations in the procurement of sugar raw materials. Figure 3a,b show Brazilian raw sugar purchase orders from different factories of the same company. Figure 3a shows the monthly purchase order and Figure 3b shows the semi-monthly purchase order. Certain traditional festivals, such as the Lantern Festival and Mid-Autumn Festival, result in a large consumption of sugar, and the coefficient of daily unevenness is greatly affected. According to the processes of sugar manufacturing enterprises and the analysis of data, the procurement frequency of sugar manufacturing enterprises has a regular pattern, generally including weekly procurement, semi-monthly procurement and monthly procurement. The data of raw material procurement are shown in Figure 3. There is a giant increase in the amount of data in January on account of the Spring Festival and Lantern Festival, as shown in Figure 3a; Figure 3b also shows the same tendency, and Figure 3c shows the purchase of raw sugar from week 31 to week 44. Around the National Day holiday, the purchase of raw sugar in week 40 far exceeded that of neighboring weeks. In China, these time nodes usually show accumulation around holidays and festivals, due to the increased consumption of sugar to celebrate. Thus, we finally add temporal features, including holidays and festivals, to our model for further optimization.

4.2. TMCS-Elman Neural Network (TMCS-ENN) Structure

The sugar industry’s demand for raw materials represents a complex non-linear problem affected by many factors. Therefore, we appropriately consider some of the main factors (e.g., time) that significantly affect the demand for raw materials, to make the forecast model more suitable for use by sugar companies. Thus, we propose a temporal feature-correlated MCS-Elman neural network (i.e., TMCS-ENN). Figure 4 shows the forecasting process of the TMCS-ENN model.
The gray background in Figure 4 represents our main optimization of the TMCS-ENN model, which includes a modified CS algorithm, initial weight and threshold, and the upgraded temporal feature of the Elman neural network.
The input of the model is the sequence of the demand for sugar raw materials over a continuous time period. The input layer node number of the Elman neural network is determined by the dimension of the data source, while the output layer node number is confirmed by the research object [33]. According to historical data and analyses of the sugar industry, we classified input layers into four parts: raw materials procurement, raw materials consumption, sugar products sales, and temporal features. The output layer is the prediction of raw material demand. Thus, based on the specific situation of the sugar industry, our Elman neural network has four nodes in the input layers and one node in the output layer.
Neural network performance is directly related to the number of hidden layer nodes [34]. When there are a few nodes in the hidden layer, the learning performance of the neural network is weak, and the model itself cannot achieve sufficient training. This may lead to large-scale deviation and poor fault tolerance. Too many nodes will cost time in learning, which may lead to overfitting. Reference [35] shows that an optimal number of hidden layer nodes must exist, and identifying an approach to find the optimal number of nodes is a problem worth consideration. To solve this problem, many scholars have given various solutions [36,37], and have also put forward many empirical formulas, such as the following:
m = n + l + α
m = n l
m = log 2 n
where m denotes the number of hidden layer nodes, n denotes the number of input layer nodes, denotes the number of output layer nodes, and α is an integer between 1 and 10. The number of hidden layer neurons calculated by Formulas (3) and (4) is relatively fewer, which can affect the performance of the neural network. We use Formula (7) to confirm the number of hidden layer nodes, which, as a result, is 5.
As with any other neural network, the Elman neural network also has a low-speed convergence problem [38]. The traditional method of optimization is to add momentum items in the neural network’s iteration process, by using the iteration function listed below:
Δ w ( k + 1 ) = η δ E δ w ( k ) + α Δ w ( k )
where α denotes the momentum item and η denotes the learning rate. Many experiments have proved that the convergence rate is increased by adding momentum items, but because of the influence of the learning rate, the convergence does not perform as we expected. Choosing a high learning rate will cause oscillation through the convergence rate being increased, while a low learning rate will allow the neural network to become stuck at a local optimal solution for a low convergence rate. Furthermore, if we keep the learning rate constant, the convergence speed will be slower, where the curvature of the error surface is small, and oscillation will occur where the curvature of the error surface is large. To solve this problem, we propose a method to improve convergence performance by adaptively changing the learning rate. Namely, to compare the current deviation with the last deviation during the iteration process of neural network, if they are close enough, we should then accelerate the learning rate to enhance the convergence rate. However, if they have little in common, this means the current solution has already deviated from the optimal solution, and we should therefore decrease the learning rate and terminate the current operation. The formula for adaptively changing the learning rate is as follows:
η ( t + 1 ) = ( 1 + α ) η ( t ) , E t + 1 < E t ( 1 α ) η ( t ) , E t + 1 > ( 1 + b ) E t η ( t ) , E t < E t + 1 ( 1 + b ) E t
where η ( t + 1 ) and η ( t ) denote the next and current learning rate of iteration, respectively, E t + 1 and E t denote the next and current deviation of the iteration, and α and b both represent a positive decimal. In this paper, we take both α and b to bear a value of 0.05.

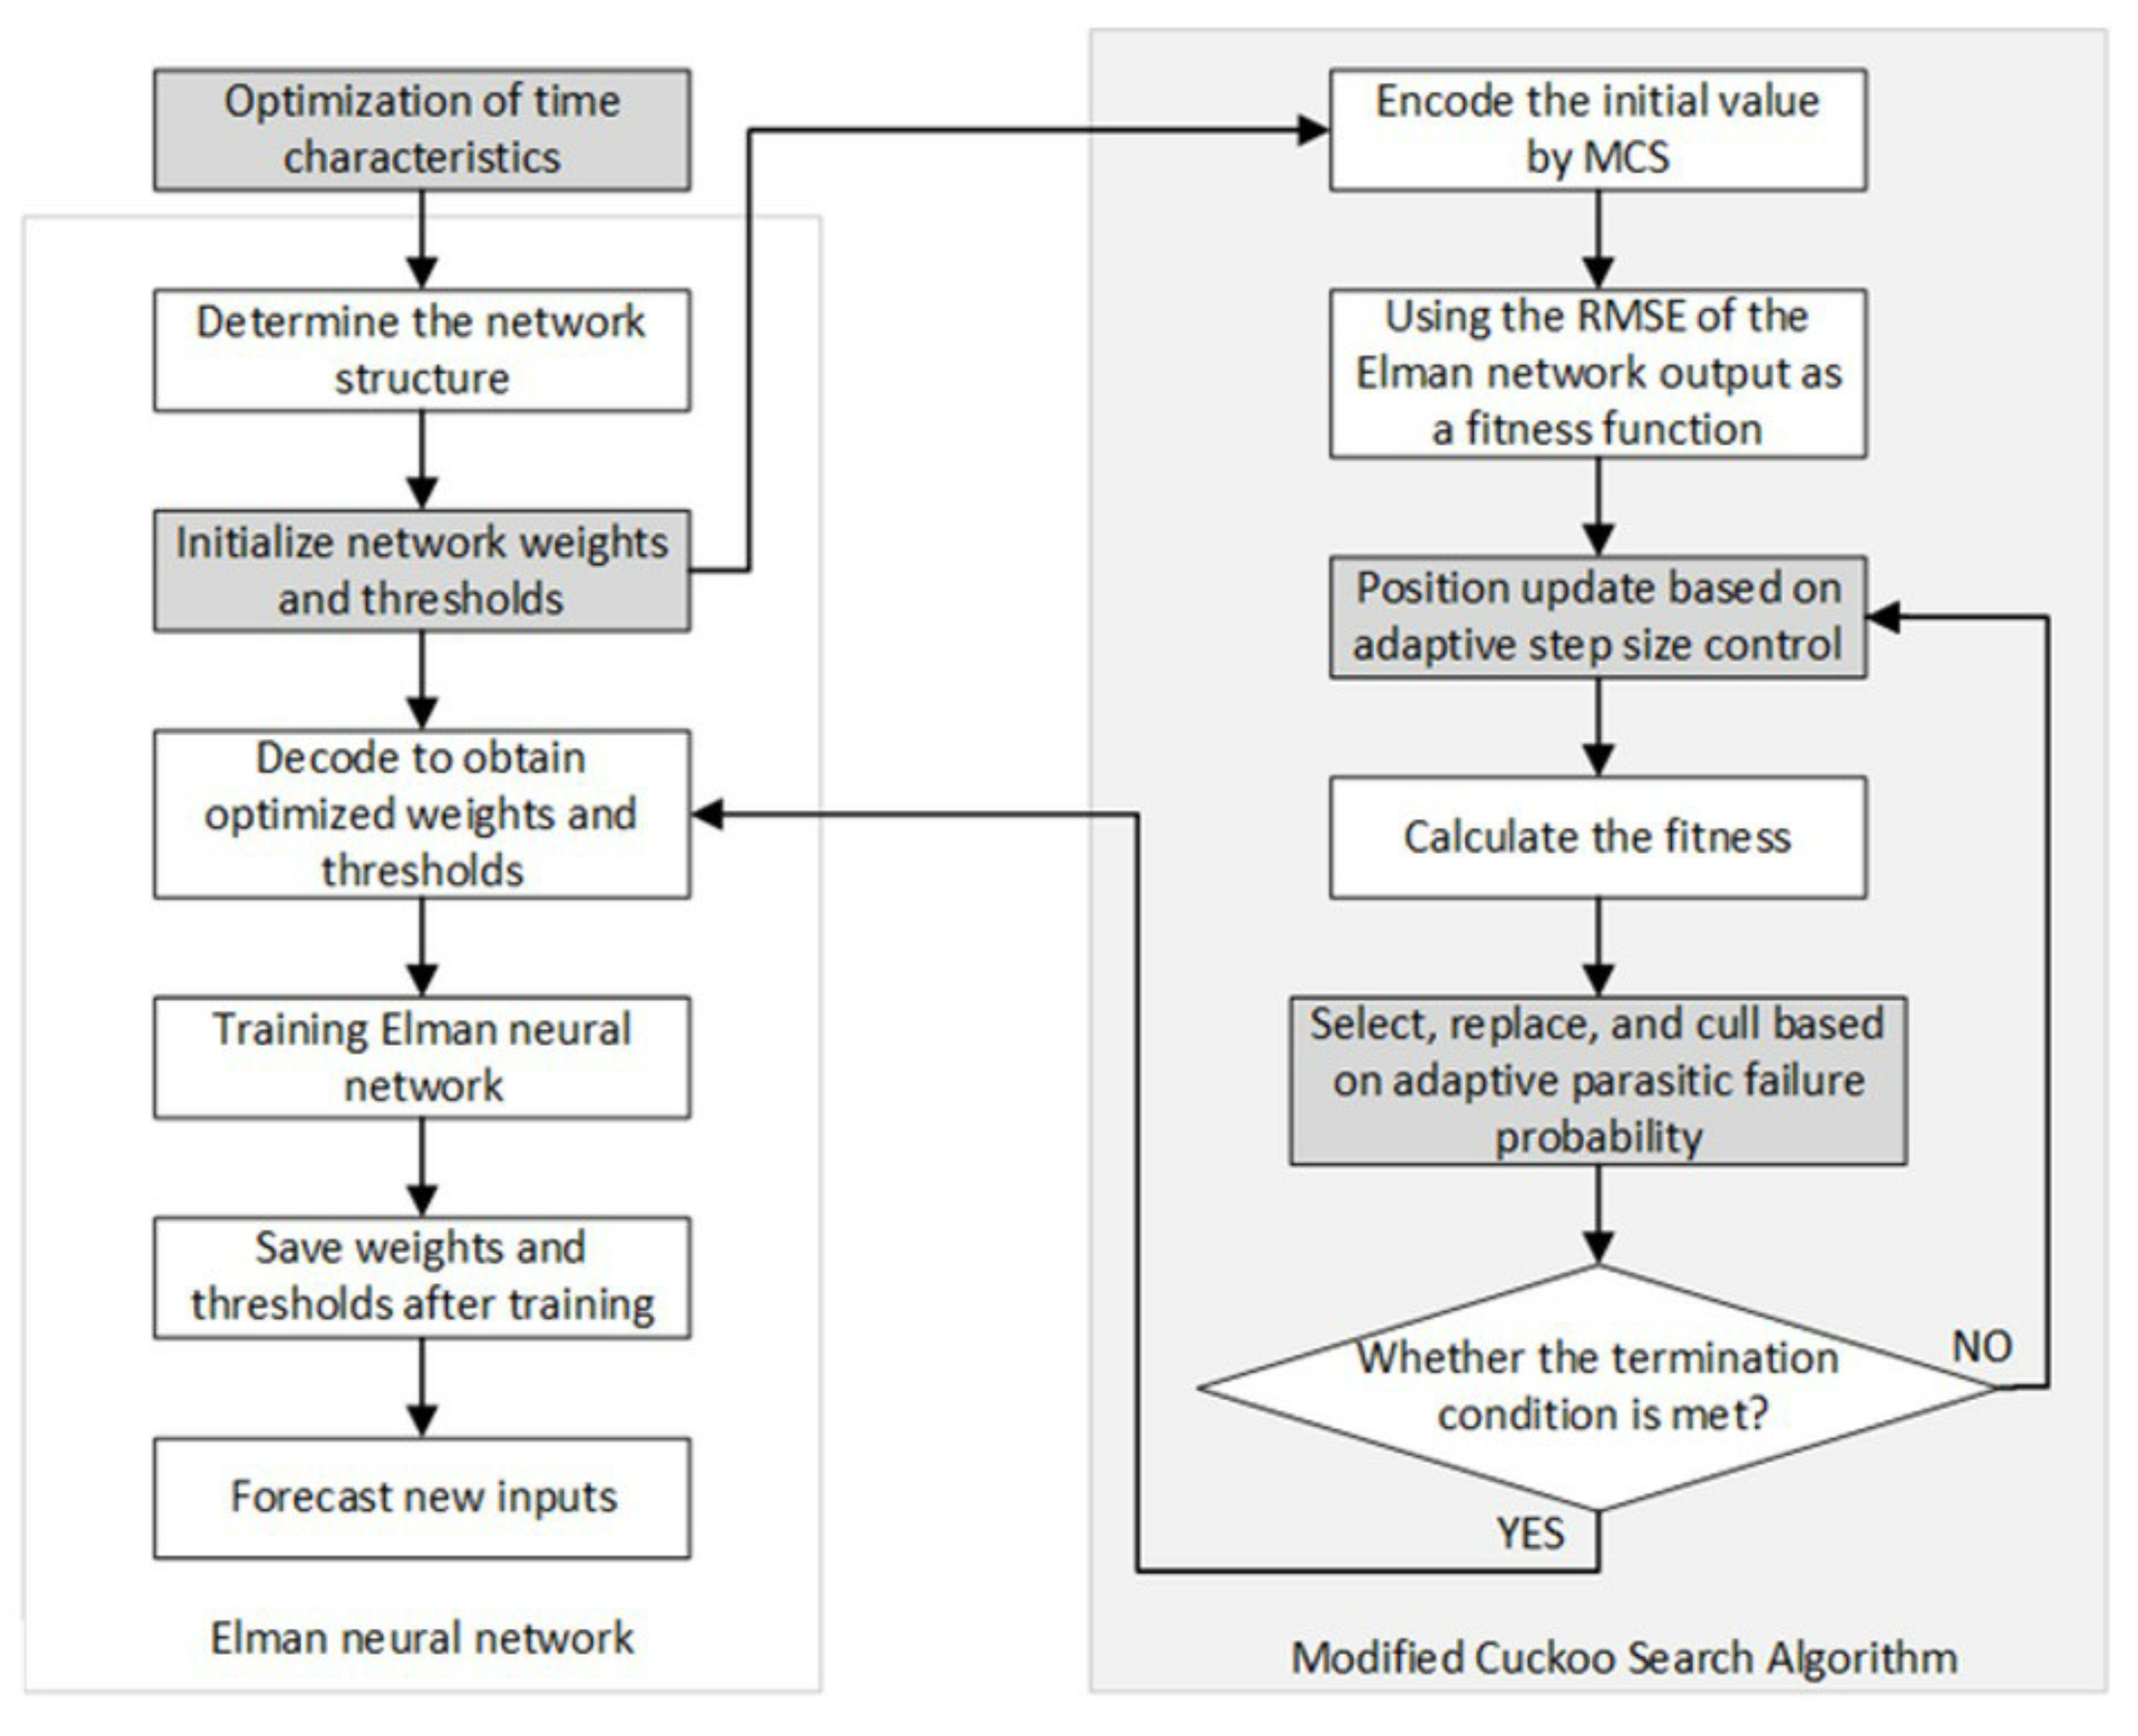
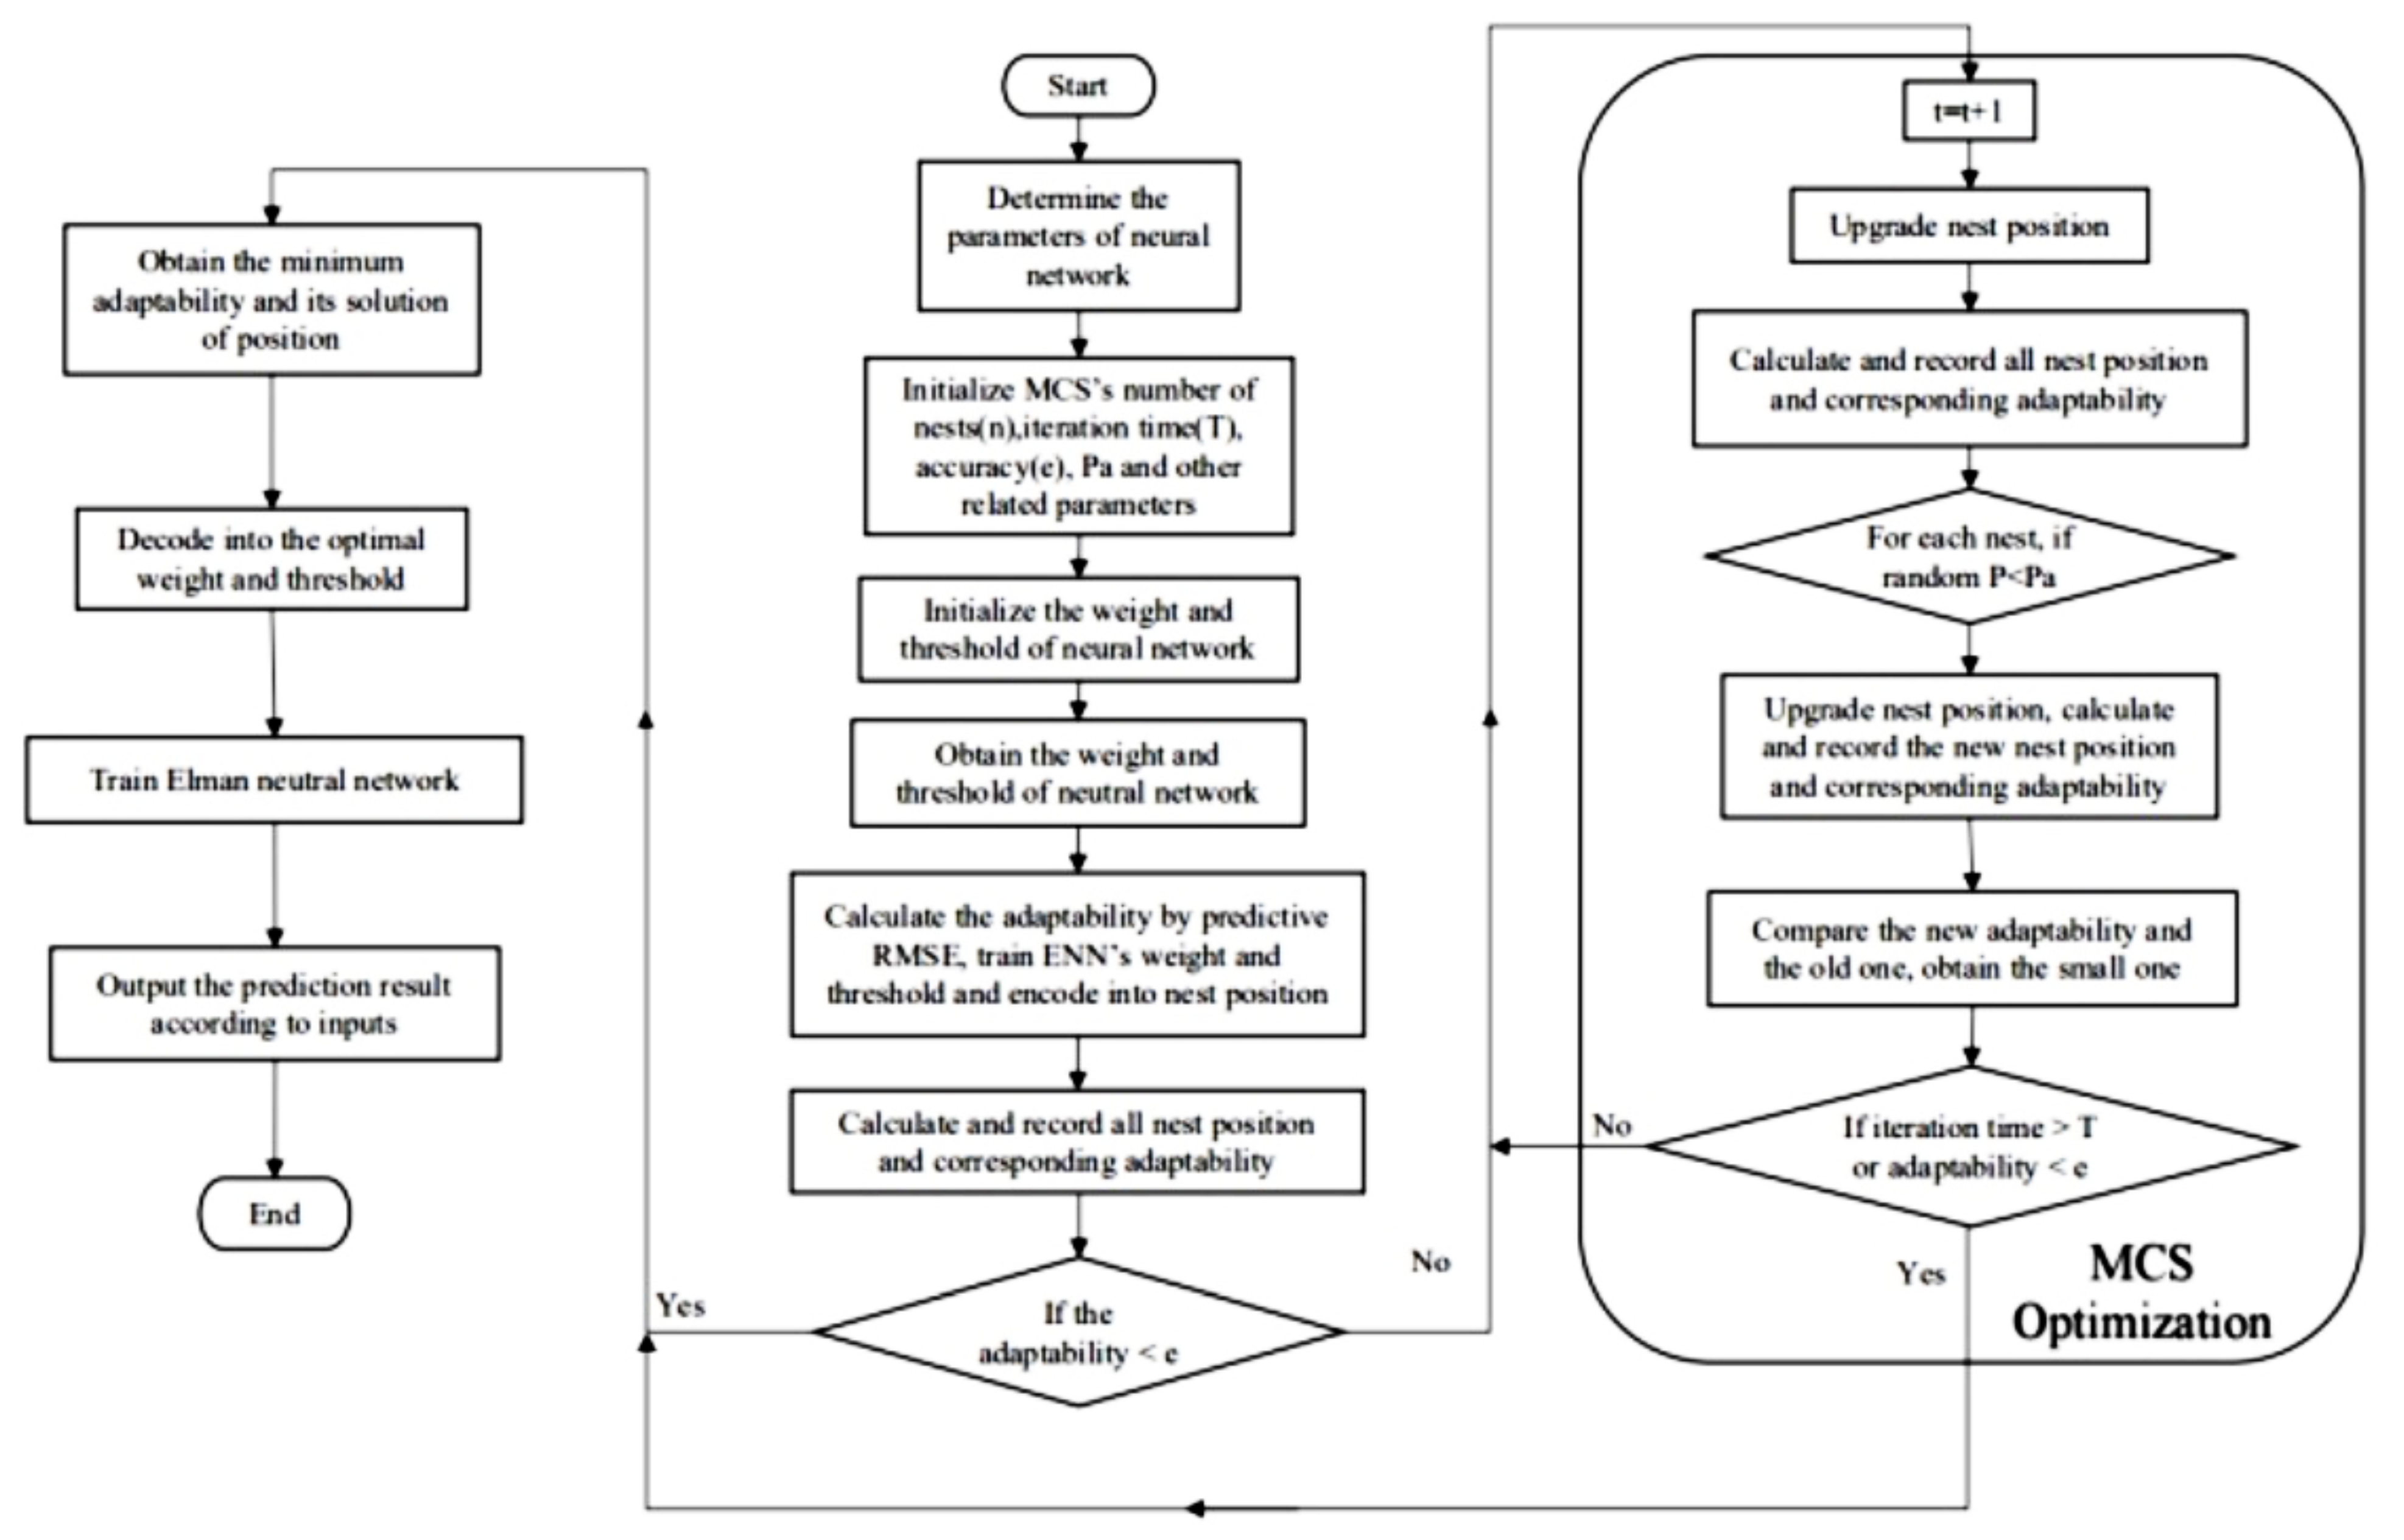
4.3. The Weight and Threshold Optimization of TMCS-ENN Model

The CS algorithm has the advantages of fewer parameters, a strong optimization ability, and the ability to be combined with other algorithms. As a result, it is frequently used to solve optimization problems. However, the general CS algorithm has a problem of slow convergence speed and incomplete global search [39]. To upgrade the algorithm’s performance, we optimize it with adaptive parasitic-failure probability and adaptive step-size control.
Parasitic-failure probability is always denoted as P α , which is a constant in the standard CS algorithm. However, we found that during the CS iteration, both good nests and bad nests appear with the same probability, which finally leads to parasitic failure. If P α is somewhat higher, good nests are more prone to being replaced instead of being retained, which makes the optimal solution hard to reach. On the contrary, a lower value of P α will make the bad nests harder to be replaced, which will slow the convergence procession. To prevent such a situation from happening, P α should be gradually reduced during iterations, being high at the beginning to find new solutions, and then lowered to retain the optimal ones. Thus, we propose an adaptive parasitic-failure probability as follows:
P α = P m i n + ( P m a x P m i n ) × ( 1 t T ) m
where P m i n and P m a x denote the minimum and maximum parasitic-failure probability, respectively; t and T denote the current number of iterations and the maximum one, respectively, and m presents a positive non-linear factor to control P α ’s declining rate. Especially, when m equals 1, P α will decrease linearly. To keep P α at a high scale at the very beginning of CS iteration for a period of time and slow it down once the locations of good nests are maintained, P α ’s declining acceleration should increase gradually, that is, the value of m should be set below 1. In our experiment, P m a x and P m i n are set to 0.5 and 0.1, respectively, and m for 0.5, the total number of iterations is 500. Figure 5 shows the curve of P α varies with the total times of iteration.
As shown in Figure 5 above, at the very beginning of our optimization, P α remained high for a period of time, while in the late stage, P α declined quickly. This trend proves that Formula (12) can make P α adaptive during iterations.
The path of Levy flight is a random walk that alternates between high-frequency short steps and low-frequency long steps during flight [40]. With regard to researching spatially global solution space, the cuckoo search algorithm shows a strong jump stochasticity, which improves its global optimization functionality. Moreover, it also leads to an incomplete and unthorough near-nests search. When the iteration lasts for a long time, the good nest location will likely be lost, because the long steps will be too long. In this case, the inefficient use of good nests’ local information will result in a low convergence accuracy, meaning that it is difficult to converge to the optimal solution. To solve this problem, we propose an adaptive step-size control approach to efficiently control the step size in every stage of the CS algorithm’s iterating process. The formula of adaptive step-size control is as follows:
α i = α m a x + α m i n 2 · x i x ¯ β i
β i = j 1 n 1 ( x i x j ) n 1
where x i denotes the solution of the current nest, α i presents the next step size of x i , α m a x and α m i n denote the maximum and minimum step size, respectively, x ¯ denotes the average of all current nest position solutions and β i denotes the average difference between the current nest position solution and other nest position solutions. In this paper, we take α m a x as 1.5 and α m i n as 0.5. When the difference between the current and average nest position solutions are large, α i will increase, with the step size becoming large. On the contrary, when the difference is small, α i will decline, with the step size becoming short. The key to step-size control is that it is upgraded according to the last iterated nest position solution. In addition, it avoids the over-large jump stochasticity of the standard CS, so that local information is used more efficiently, and the ability to search for the optimal solution of the original CS algorithm is enhanced.
We aim at solving the issue regarding the ease of causing the neural network to converge slowly and fall into the local optimum randomly as initializing the weights and thresholds of the Elman neural network [41]. In this paper, we adopt a modified cuckoo search algorithm (i.e., MCS algorithm) to optimize the Elman neural network and regard the network as the fitness function of the meta-heuristic algorithm. In addition, we use the MSC algorithm to optimize the Elman neural network’s weight and threshold, solving its flaws of low convergence speed and vulnerability of falling into a local optimal solution. To be precise, every nest may represent the best weight and threshold of the Elman neural network, and we adopt the root-mean-square error (RMSE) as the fitness function to find the best initial weight and threshold of the Elman neural network in each iteration. The MCS algorithm does not stop iterating until it reaches the iteration number or meets the minimum RMSE. Figure 6 shows the flowchart of the MCS-Elman neural network.
The MCS-Elman neural network predictive model is mainly divided into two parts:
  • Elucidate the Elman neural network’s structure, weight, and threshold number according to the dimensions of the data source.
  • Optimize the Elman neural network’s weight and threshold by using the MCS algorithm. Each individual is optimized according to the value of its fitness during optimization.

4.4. The Temporal Feature Optimization of TMCS-ENN

China is an ancient civilization with a long history and traditional culture. The Chinese population celebrate and enjoy various holidays and festivals, consuming different kinds of food on different occasions. In this context, there is a certain impact on the sugar industry, since sugar is a fundamental part of the food-making process. To be precise, different holidays and festivals bear different influences on the prediction of sugar demands, and such demands fluctuate regularly with holidays and festivals, differing from demand on regular days. If we predict the demand for raw materials as usual on special days, the prediction is usually extremely inaccurate, which may cause a great loss to companies associated with sugar usage. In this paper, we extract the holiday feature as an influential factor of the prediction model and optimize the model with it as an input variable.
In view of the high time sensitivity of sugar raw materials, this paper chooses month, half a month, and week as time granularities for separate experiments. This identifies whether each data point contains holiday factors in the form of “0” and “1”, such as Spring Festival, Lantern Festival, etc. Value “1” indicates that the divided time slice contains holiday factors; “0” indicates the opposite. The improved data with holiday characteristics are used as the influence factors of the prediction model and as the input parameters to optimize the model.
After adding temporal features to the MCS-Elman neural network, as discussed in the previous section, the prediction model is more suitable for the real situation of sugar companies. Here, we describe the prediction process using the TMCS-ENN model:
(1) Collect and collate data on the raw material purchases, consumption, and completed sugar sales of sugar companies. After analysis, select the purchase amount, consumption, sales data, and holiday and festival factor as inputs to the Elman neural network, and the next actual purchase amount as the output that will be input into the prediction model.
(2) Use initial network parameters, and randomly generate n nests q 0 = [ x 1 ( 0 ) , x 2 ( 0 ) , , x n ( 0 ) ] under certain constraint conditions. Start training and set the root-mean-square error (RMSE) as the fitness function to find the optimal solution x 1 ( 0 ) among all the current nests.
(3) Determine whether the current optimal solution of all the nests meets the precision or whether the iteration time reaches the maximum. If yes, go to (6), otherwise, continue to the next step.
(4) Replace the position of n nests using the Levy flight mode with adaptive step control to obtain q t = [ x 1 ( t ) , x 2 ( t ) , , x n ( t ) ] T . The replacement is based on the following rules: if the fitness value of the new nest is better, then perform the replacement; otherwise, retain the old nest.
(5) Generate a random number P between 0 and 1, and compare it with a parasitic-failure probability of current iteration times P a . If P > P α , retain x i ( t ) ; if P < P α , use the Levy flight mode with adaptive step control to replace nest position. Make a comparison while replacing the original nest x i ( t ) with a better fitness value x i ( t + 1 ) , otherwise retain x i ( t ) . Finally, the n nest’s replaced position is q t + 1 = [ x 1 ( t + 1 ) , x 2 ( t + 1 ) , , x n ( t + 1 ) ] T ; go to (3).
(6) Terminate the iteration and obtain the optimal solution of all current nests. The initial neural network’s optimal weight and threshold are obtained according to the optimal solution. Input data after preconditioning to train the prediction model and to finally obtain the prediction.
By analyzing the temporal feature and extracting holidays factor, the pseudocode is given to show how the TMCS-ENN prediction model works as Algorithm 1.
Algorithm 1:The pseudocode of the TMCS-ENN prediction model.
  • Set nests number n of cuckoo, accuracy e, parameters of adaptive parasitic-failure probability and adaptive step-size control, iteration time t, and initial weight and threshold of neural network.
  • Set iteration time t = 0 , encode the value of weight and threshold into x i ( t ) , belongs to natural numbers.
  • Set the RMSE of Elman neural network’s prediction as fitness function f(x)
  • For nest i, (i = 1, 2, …, n)
  • Upgrade nest i’s position according to formula f ( x i ( 0 ) ) < e , x i ( t + 1 ) = x i ( t ) + α L ( λ ) , i = 1 , 2 , , n and get the optimal f ( x i ( 0 ) )
  • End for
  • If
  •       Decode x i ( 0 ) into the optimal weight and threshold and train the neural network to output prediction.
  • End if
  •       while (true)
  •       t = t + 1
  •       For nest i, (i = 1,2, …,n)
  •             Upgrade nest i’s position x i ( t ) according to formula x i ( t + 1 ) = x i ( t ) + α L ( λ ) , i = 1 , 2 , , n , and get the optimal f ( x i ( t ) )
  •       End for
  •       If rand() < P α
  •             For nest i, (i = 1, 2, …, n)
  •                   Upgrade nest i+1’s position x i ( t + 1 ) and get f ( x i ( t + 1 ) )
  •                   If f ( x i ( t + 1 ) ) < f ( x i ( t ) )
  •                          x i ( t ) < x i ( t + 1 )
  •                   End if
  •             End for
  •       End if
  •       if f ( x i ( t ) ) < e or t>T
  •             Decode x i ( t ) into the optimal weight and threshold and train the neural network to output prediction.
  •       End if
  •       break;
  • End while

5. Experiments

The modeling process and implementation procedure of the TMCS-ENN prediction model are discussed in detail, proving that this model is practicable and feasible in theory. Thus, we need substantial data for further validation in practice. To obtain more accurate and complete data, we used data from the sugar industry for the last 5 years for experimental purposes.
In this paper, under the temporally correlated condition, including the holiday and festival factors, we conduct our experiments by exploiting the prediction model proposed above with historical data, and analyze the results. Since the process of predicting the demand for raw materials contains some specific steps, it is of vital importance to handle each step and ensure we use the appropriate method. Figure 7 shows the specific prediction steps.

5.1. Datasets and Analysis

The base dataset of our experiments consists of a large amount of production data, inventory data, order data, sales data, etc. All of these data are from the last 5 years, from a real sugar industry with several factory areas. Among all the data, the data on sugar raw materials are mainly derived from a raw material stand-alone storage system, weighbridge weighing data, and related documents. The forms of data include raw material type, amount and purchase time, etc. The fields provided by these data involve multiple tables and multiple fields, where the main data items in the original dataset are described in Table 1, Table 2 and Table 3.
As can be observed in the above tables, a close relation to time is revealed. This is an important feature that distinguishes time series from other statistical analyses. Moreover, raw material procurement, raw material consumption, and finished sugar sales are all processes of continuous development, so time series can quantitatively describe this dependence.

5.2. Experimental Data Preprocessing

Based on the prediction (TMCS-ENN) model proposed in the previous section, substantial and complete input data are conducive to improving the accuracy of predicting raw material demand. However, most of the data used for prediction come from stand-alone systems and related documents. Therefore, data processing is essential in our proposed predictive model.
The null data have a certain impact on the model prediction results. Therefore, it is necessary to process this type of data. If the null data did not affect the prediction results, we did not consider them; if the null data were critical, we filled such data with the average values for the previous month and the next month. Due to the complexity of the data, the temporal characteristics cannot be directly reflected. We chose to slice the existing data with weekly, semi-monthly, and monthly time granularities. Taking the weekly granularity as an example, the data include raw material purchases and actual consumption in a week, etc. In addition, we combined certain fields across several tables into one table. Considering the time factor, we added the label field representing the time factor: if there are holidays in the week, the field value is 1; otherwise, the value is 0.
Prediction allows the assessment of future trends, and there are usually some discrepancies between the actual situation and the prediction [42]. To evaluate a prediction model more accurately, we chose three generally used valuation indicators as follows [43]:
A c c u r a c y = 1 1 N i = 1 N | Y i Y i ^ Y i | × 100 %
R M S E = 1 N i = 1 N ( Y i Y i ^ ) 2
M A P E = 1 N i = 1 N | Y i Y i ^ Y i | × 100 %
where Y i and Y i ^ correspond to actual and predicted value, respectively, t denotes time, N denotes the total number of samples, and M denotes the sum of the number of independent variables and dependent variables.

5.3. Experiment Design and Analysis

Our experiments can be divided into four parts. In part (1), we use the CS-ENN algorithm and ENN to predict the demand for raw materials of the sugar industry, and to test and verify whether the CS algorithm can optimize ENN; in part (2), by using MCS-ENN and CS-ENN, respectively, we attempt to verify the improvement in the CS algorithm by comparative analysis; TMCS-ENN and MCS-ENN are used in part (3) separately, to verify whether they can optimize our predictive model by adding a temporal feature; and in part (4), in the case of different time granularities, we analyze the data and conclude by observing prediction accuracy and contrasting deviations.
(1)
The effect of weight and threshold optimization
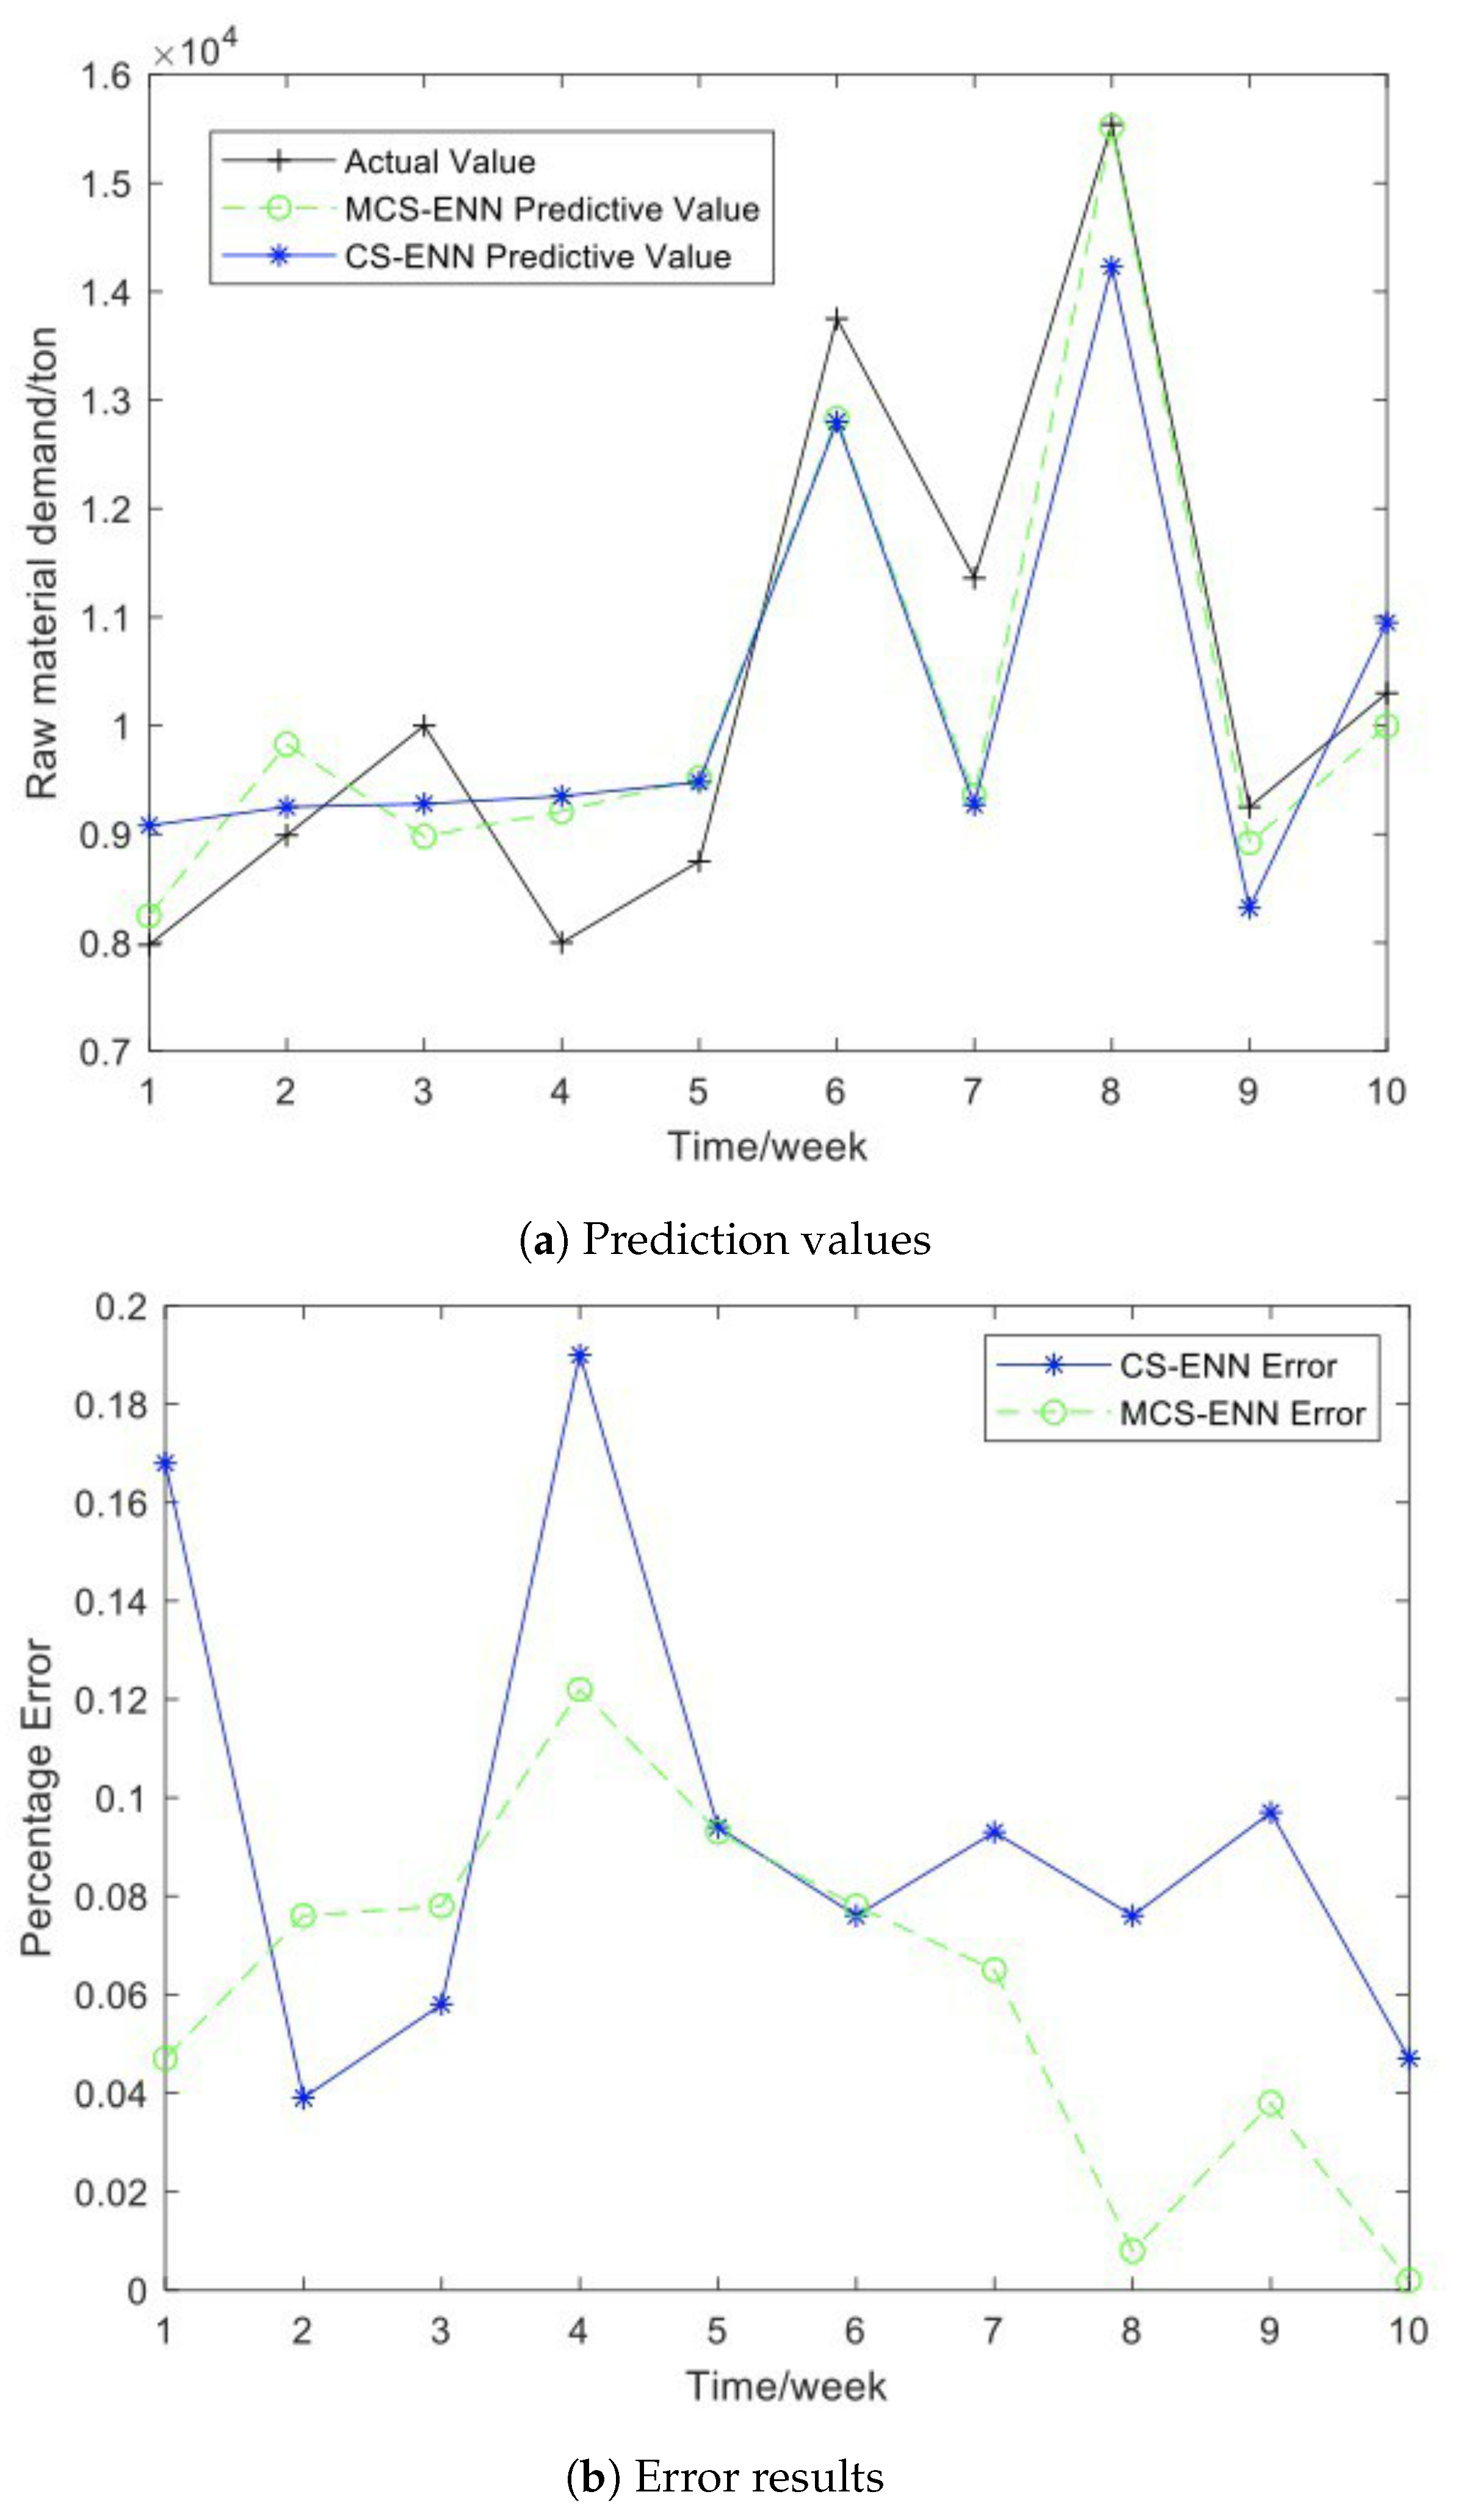
In this part, we validate the effect of weight and threshold optimization by the CS algorithm of ENN. We select week as the time granularity in this part’s experiment, using the CS-optimized weight and threshold for CS-ENN, and the random initial weight and threshold for ENN. To start, we use the purchase quantity, consumption, and end-product sales volume of Brazilian raw sugar as input variables; the output of this experiment is Brazilian raw sugar’s purchase quantity in the next time node. All of the historical data can be classified into 165 points in total. We use the last 10 weeks of data as our test sample, and the others as a training sample to train our model (the subsequent experiments all follow this standard). Figure 8a,b show the prediction result and MAPE of this experiment.
After computing, CS-Elman’s RMSE is 0.102, MAPE is 8.72%, and prediction accuracy is 91.28%, these values are 0.173, 12.15% and 87.85% for the ENN, respectively. The demand for raw materials significantly increased in both the sixth and eighth time nodes, and the inaccuracy of the ENN of these two nodes is higher than that of the CS-ENN. Compared with the ENN, the CS-ENN’s prediction accuracy increased by 3.43%, proving that optimizing the ENN with the CS algorithm can increase prediction accuracy to some extent.
(2)
The effect of MCS algorithm on predictive model
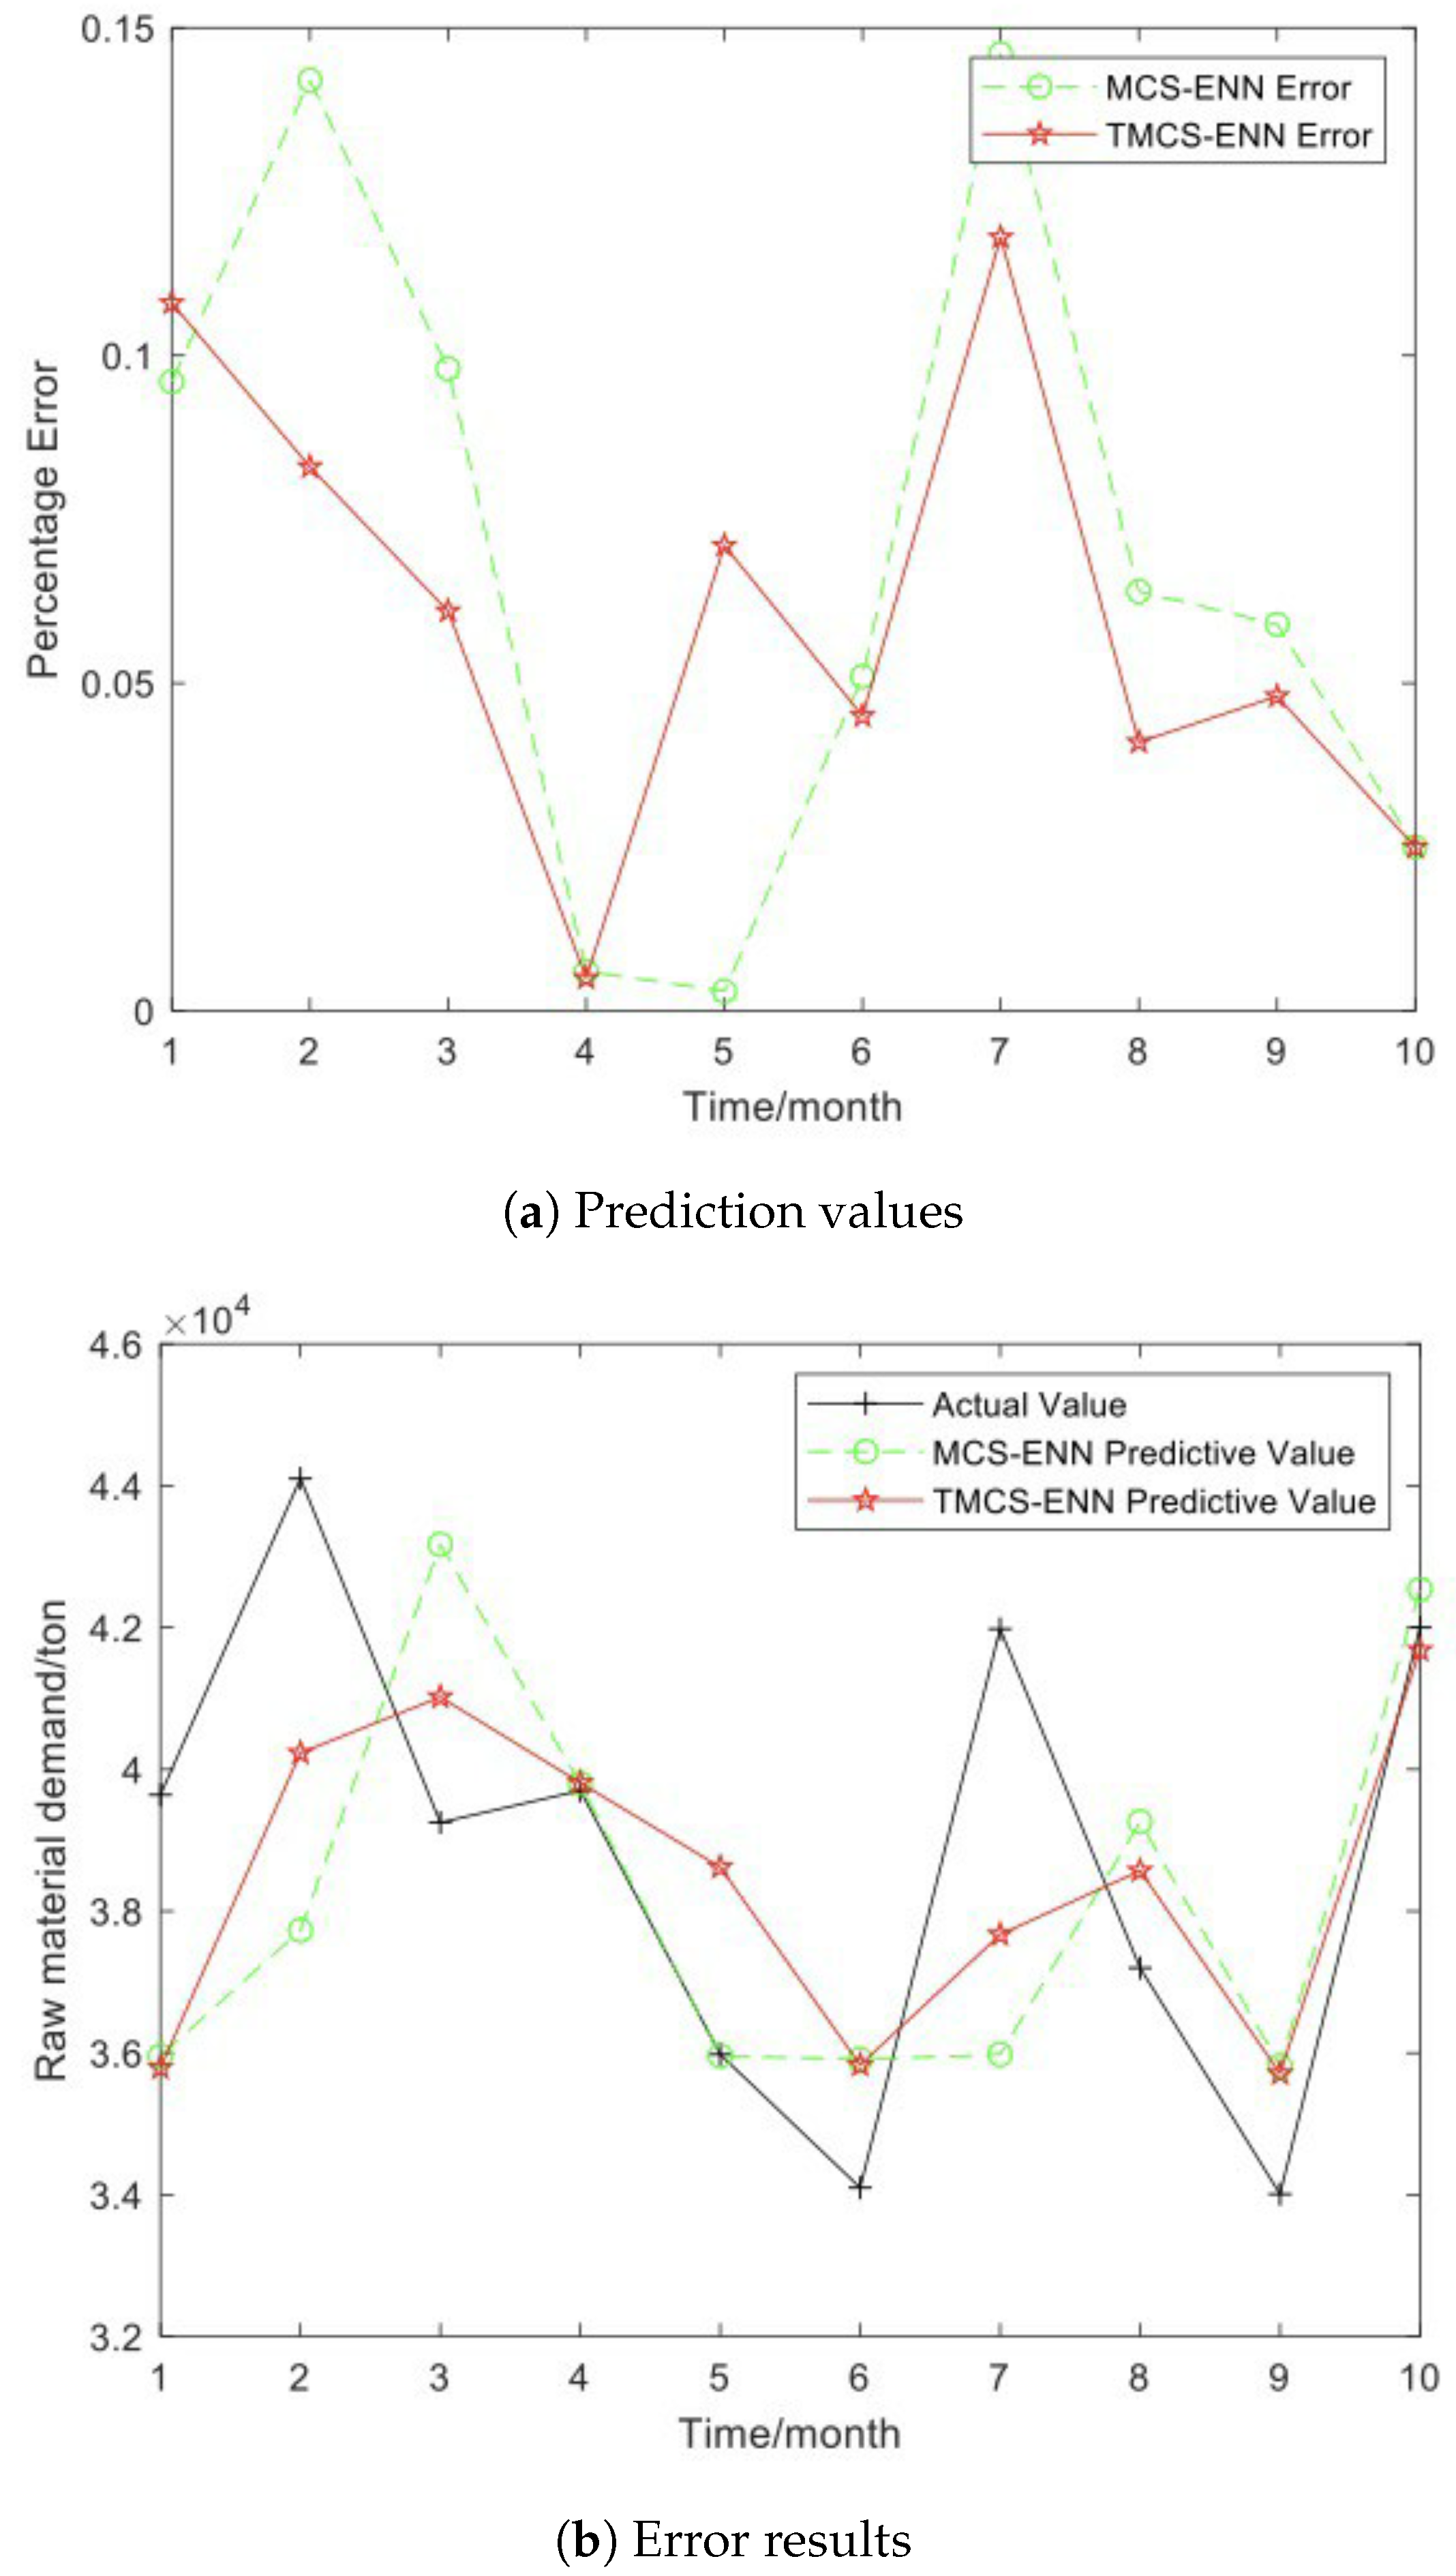
In this part of the experiment, we compare the influence of the modified CS algorithm with the influence of the original CS in our model. Similarly, we take the unit of a week as the time granularity and use adaptive parasitic-failure probability and adaptive step-size control on MCS-ENN for comparison with CS-ENN. The input and output variants, choosing the approach of the test sample and training sample, are similar to those given in part I. Figure 9a,b show the prediction results and MAPE of this experiment.
According to our results, MCS-Elman’s RMSE is 0.067, MAPE is 6.11%, and prediction accuracy is 93.89%, while these values are 0.096, 9.38%, and 90.62% for the ENN, respectively. Compared with the CS-ENN, there is an improvement in the MCS-ENN’s prediction accuracy, with an increase of 3.43%, and its deviation is slightly lower. Thus, using a modified CS algorithm can improve our predictive model’s accuracy.
(3)
The effect of temporal feature on predictive model
Considering that the temporal feature plays an important role in the purchase of raw materials, we investigate the effect of the temporal feature on the MCS-ENN. Again, we take the unit of a week as the time granularity in this experiment. We use the purchase quantity, consumption, and end-product sales volume of Brazilian raw sugar as MCS-ENN’s input variables, and add the holiday and festival factor as an additional input variable in TMCS-ENN. Figure 10a,b show the prediction results and MAPE of this experiment.
TMCS-Elman’s RMSE is 0.058, the MAPE is 5.36%, and the prediction accuracy is 94.64%, while these values are 0.092, 6.73% and 93.27% for the MCS- ENN, respectively. By taking the holiday and festival factor into consideration, the predictive model’s prediction accuracy increased by 1.37%. The reason for the prominent increase in the sixth time node is that this node itself has a temporal feature. The prediction deviation significantly decreased after adding holidays and festivals into our predictive model, showing that adding the temporal feature into our model can optimize the predictive model and enhance its accuracy.
(4)
The effect of time granularity on predictive model
To compare the effect of different kinds of time granularity on both MCS-ENN and TMCS-ENN, we choose month, half a month, and week as time granularities for separate experiments. For MCS-ENN, there are three input layers and five hidden layers, while the TMCS-ENN has four and five, respectively.
Figure 11a,b show the result of a month granularity, and the result of half a month is shown in Figure 12a,b. The result of a week granularity is discussed in part 5.
To help make it more intuitive, Table 4 shows a cross comparison of these results under different time granularities.
Through a comparison of the above experiments, we can conclude that the accuracy of the CS-ENN is higher than that of the ENN in any case. Compared with the CS-ENN, the prediction accuracy of the MCS-ENN is further improved, indicating that the improvement of the CS algorithm in this paper can improve the prediction accuracy of raw material demand. After further considering the time characteristics, the prediction accuracy of the TMCS-ENN prediction model is significantly improved, with more precise time granularity. It can be seen that the introduction of the TMCS-ENN prediction model proposed in this article will help sugar companies to purchase sugar raw materials in a scientifically founded and reasonable manner.

6. Conclusions and Future

This paper proposed a predictive Elman neural network model optimized by a temporally correlated MCS algorithm. The optimized model was then applied to the prediction of the demand for sugar raw materials of a sugar company. Through our experiments, we proved that our TMCS-ENN prediction model enhances the prediction accuracy to a certain degree, better aligning the prediction with the actual situation of sugar companies. In this paper, we performed the following: (1) Introduced time series, the Elman neural network and the cuckoo search algorithm, and modified the existing general CS algorithm to further optimize the Elman neural network. Apart from enhancing the accuracy, the MCS-optimized Elman neural network avoided becoming stuck into local optimal solution. (2) Based on the existing prediction of the demand for raw materials of the sugar industry, we considered the temporally correlated holidays factor and added it to our model, which also enhanced the prediction accuracy and corresponded to the actual change in raw material demands. (3) Focused on the problem of predicting the demand for raw materials and refined it as predicting the demand for sugar raw materials, a domain that has received little attention. The prediction result from our TMCS-ENN model was found to be highly realistic and practicable, saving costs on manual labor and preventing unnecessary losses caused by objective factors such as human judgment.
In future work, we aim to consider more influential factors, such as the tax rate of raw materials, GDP, and weather in order to further improve our model. Furthermore, in addition to sugar raw materials, the sugar industry also consumes coal, lime milk, soy milk and cream, etc., in the sugar product-making process, which should also be considered in our prediction model.

Author Contributions

Conceptualization, methodology, funding acquisition, original draft, H.C.; Validation, formal analysis, experiment, Y.Z.; Resources, data curation, writing—review and editing, W.L.; Investigation, experiment, Y.L.; Experimental analysis, conclusion, Z.C.; Data collection, D.H. All authors have read and agreed to the published version of the manuscript.

Funding

This work was partially supported by the Technology Innovation Special Program of Hubei Province (No. 2022BAA044, No.2021BAA188), the Key Project of Science and Technology Research Program of Hubei Provincial Education Department (No. D20201006), and the National Natural Science Foundation of China (No. 61977021).

Data Availability Statement

All the details of this work, including data and algorithm codes, are available from the corresponding author: [email protected].

Acknowledgments

The authors would like to thank the reviewers for their helpful suggestions, which have considerably improved the quality of the manuscript.

Conflicts of Interest

The authors declare no conflict of interest.

References

  1. Ekawati, R.; Kurnia, E.; Wardah, S.; Djatna, T. Predictive demand analytics for inventory control in refined sugar supply chain downstream of paper. In Proceedings of the 2019 International Seminar on Application for Technology of Information and Communication (iSemantic), Semarang, Indonesia, 21–22 September 2019; pp. 100–104. [Google Scholar] [CrossRef]
  2. Zhang, Q.; Zhou, M.; Li, C.; Zheng, X.; Wang, K.; Yang, S. Case analysis on value creation and sustainable development path of supply chain integrators of paper. In Proceedings of the 2018 15th International Conference on Service Systems and Service Management (ICSSSM), Hang Zhou, China, 21–22 July 2018; pp. 1–6. [Google Scholar] [CrossRef]
  3. Ke, U.F.; Liang, G.T.; Wang, X.Y. Joint inventory and production decisions under fluctuating material costs. J. Manag. Ences China 2016, 47–58. [Google Scholar]
  4. Modi, A.S. Review article on deep learning approaches of paper. In Proceedings of the 2018 International Conference on Intelligent Computing and Control Systems (ICICCS), Madurai, India, 14–15 June 2018; pp. 1635–1639. [Google Scholar] [CrossRef]
  5. Sharma, O. Deep challenges associated with deep learning of paper. In Proceedings of the ComitCon-2019: International Conference on Machine Learning, Big Data, Cloud and Parallel Computing, Faridabad, India, 14–16 February 2019; pp. 72–75. [Google Scholar] [CrossRef]
  6. Liu, J.; Liu, X.-Z.; Li, Y. Two Subpopulations Cuckoo Search Algorithm Based on Mean Evaluation Method for Function Optimization Problems. Int. J. Pattern Recognit. Artif. Intell. 2020, 34, 2059027. [Google Scholar] [CrossRef]
  7. Pan, S.; Liu, J.; Wang, Y. Forecasting stock returns with artificial neural networks. J. Zhejiang Univ. (Sci. Ed.) 2019, 46, 550–555. [Google Scholar] [CrossRef]
  8. Guo, Y.; Lu, L. Application of a Traffic Flow Prediction Model Based on Neural Network in Intelligent Vehicle Management. Int. J. Pattern Recognit. Artif. Intell. 2018, 33, 1959009.1–1959009.18. [Google Scholar] [CrossRef]
  9. Li, J.; Yang, L. Prediction of time series data based on multi-time scale rnn. Comput. Appl. Softw. 2018, 35, 33–37. [Google Scholar]
  10. Yang, H.M. Review of Time Series Prediction Methods. Comput. Sci. 2019. [Google Scholar]
  11. Klein, J.L.; Klein, D. Statistical Visions in Time: A History of Time Series Analysis, 1662–1938; Cambridge University Press: Cambridge, UK, 28 October 1997. [Google Scholar]
  12. Wu, C.L.; Chau, K.W. Data-driven models for monthly streamflow time series prediction. Eng. Appl. Artif. Intell. 2010, 23, 1350–1367. [Google Scholar] [CrossRef] [Green Version]
  13. Zhao, Q.-H.; Ni, D.-M. Integrated demand forecasting model and its integration with inventory decision. J. Manag. Sci. China 2013, 1007–9807. [Google Scholar]
  14. Abraham, T.H. (Physio) logical circuits: The intellectual origins of the McCulloch–Pitts neu-ral networks. J. Hist. Behav. Sci. 2002, 38, 3–25. [Google Scholar] [CrossRef] [PubMed]
  15. Li, J.; Cheng, J.H.; Shi, J.Y.; Huang, F. Brief introduction of back propagation (BP) neural network algorithm and its improve-ment. In Advances in Computer Science and Information Engineering; Springer: Berlin/Heidelberg, Germany, 2012; pp. 553–558. [Google Scholar]
  16. Xia, Q.-Y.; Yang, J.-M. Research on BP neural network method in spare parts demand fore-casting. In Proceedings of the 7th Annual Academic Conference of Chinese Enterprise Operations Research, Hong Kong, China, 2–3 March 2012; pp. 98–105. [Google Scholar]
  17. Jiang, S.; Yang, C.; Li, P. Research on application of BP- ANN forecast in process supply chain. Opreations Res. Manag. Sci. 2013, 12, 57–61. [Google Scholar]
  18. Huang, Y.-B.; Cai, Q.-M.; Yang, W.-L.; Huang, Y.-M. Research of spare parts requirement prediction based on support vector regression. Logist. Sci-Tech 2006, 29, 95–97. [Google Scholar] [CrossRef]
  19. Zong, C.-S.; Zheng, H.-X. Grain Yield Prediction Based on BP Neural Network Optimized by Improved Particle Swarm Optimization. Comput. Syst. Appl. 2018, 27, 204–209. [Google Scholar]
  20. Guo-yan, X.U.; Jin, Z.H.U.; Cun-you, S.I.; Wen-bin, H.U.; Fan, L.I.U. Combined Hydrological Time Series Forecasting Model Based on CNN and MC. Comput. Mod. 2019. [Google Scholar] [CrossRef]
  21. Song, K.; Lv, S.; Hu, D.; He, P. Software Defect Prediction Based on Elman Neural Network and Cuckoo Search Algorithm. Math. Probl. Eng. 2021, 2021, 5954432. [Google Scholar] [CrossRef]
  22. Gao, X.-Z.; Gao, X.-M.; Ovaska, S.J. A modified Elman neural network model with application to dynamical systems identification of paper. In Proceedings of the 1996 IEEE International Conference on Systems, Man and Cybernetics: Information Intelligence and Systems, Beijing, China, 14–17 October 1996; pp. 1376–1381. [Google Scholar]
  23. Yi, L.; Ke, X.; Junde, S.; Yuwen, Z.; Qiang, B. Forecasting model based on an improved Elman neural network and its application in the agricultural production of paper. In Proceedings of the 2013 IEEE International Conference on Granular Computing (GrC), Beijing, China, 13–15 December 2013; pp. 202–207. [Google Scholar]
  24. Yan, W. An improved Elman neural network algorithm. J. Bohai Univ. (Natural Sci. Ed. China) 2007, 377–381. [Google Scholar]
  25. Zhongji, Q.; Mandan, L.; Honggang, W. Process modeling method based on an improved Elman Neural Network of paper. In Proceedings of the 2008 7th World Congress on Intelligent Control and Automation, Chongqing, China, 25–27 June 2008; pp. 8188–8192. [Google Scholar] [CrossRef]
  26. Liu, S.; Yan, M.; Tai, H.; Xu, L.; Li, D. Prediction of dissolved oxygen content in aquaculture of Hyriopsis cumingii using elman neural network of paper. In International Conference on Computer and Computing Technologies in Agriculture; Li, D., Chen, Y., Eds.; Springer: Berlin/Heidelberg, Germany, 2012; pp. 508–518. [Google Scholar]
  27. Ouaarab, A.; Ahiod, B.; Yang, X.-S. Discrete cuckoo search algorithm for the travelling salesman problem. Neural Comput. Appl. 2014, 24, 1659–1669. [Google Scholar] [CrossRef]
  28. Cai, Z.; Yang, X. Cuckoo search algorithm with deep search of paper. In Proceedings of the 2017 3rd IEEE International Conference on Computer and Communications (ICCC), Chengdu, China, 13–16 December 2017; pp. 2241–2246. [Google Scholar] [CrossRef]
  29. Soneji, H.; Sanghvi, R.C. Towards the improvement of Cuckoo search algorithm of paper. In Proceedings of the 2012 World Congress on Information and Communication Technologies (WICT 2012), Trivandrum, India, 30 October–2 November 2012; pp. 878–883. [Google Scholar] [CrossRef]
  30. Vazquez, R.A. Training spiking neural models using cuckoo search algorithm of paper. In Proceedings of the 2011 IEEE Congress of Evolutionary Computation (CEC), New Orleans, LA, USA, 5–8 June 2011; pp. 679–686. [Google Scholar] [CrossRef]
  31. Marcos-Jorquera, D.; Maciá-Pérez, F.; Gilart-Iglesias, V.; Berná-Martínez, J.V. Business continuity model. Regeneration system for manufacturing components of paper. In Proceedings of the 2006 10th IEEE International Enterprise Distributed Object Computing Conference (EDOC’06), Hong Kong, China, 16–20 October 2006; pp. 97–105. [Google Scholar] [CrossRef] [Green Version]
  32. Kasemset, C.; Petchalalai, A. Application of mathematical model for raw material storage management of paper. In Proceedings of the 2018 IEEE International Conference on Industrial Engineering and Engineering Management (IEEM), Bangkok, Thailand, 16–19 December 2018; pp. 879–883. [Google Scholar] [CrossRef]
  33. Zheng, Y.; Yao, Z.; Zhou, H.; Yang, C.; Zhang, H.; Li, M.; Fan, L. Power generation forecast of top gas recovery turbine unit based on Elman model of paper. In Proceedings of the 2018 37th Chinese Control Conference (CCC), Wuhan, China, 25–27 July 2018; pp. 7498–7501. [Google Scholar] [CrossRef]
  34. Kang, C.H.; Cho, S.Y. Neural networks based modeling with adaptive selection of hidden layer’s node for path loss model. J. Position. Navig. Timing 2019, 8, 193–200. [Google Scholar] [CrossRef]
  35. Rastegar, R.; Hariri, A. A step forward in studying the compact genetic algorithm. Evol. Comput. 2014, 14, 277–289. [Google Scholar] [CrossRef] [Green Version]
  36. Shen, H.Y.; Wang, Z.X.; Gao, C.Y.; Qin, J.; Yao, F.B.; Xu, W. Determination of the number of hidden layer units of BP neural network. J. Tianjin Univ. Technol. 2008, 24, 13–15. [Google Scholar] [CrossRef]
  37. Wang, R.; Xu, H.; Li, B. Research on the method of determining the number of hidden layer nodes of BP neural network. Comput. Technol. Dev. 2018. [Google Scholar] [CrossRef]
  38. Yu, Y.; Li, C.; Yang, Q.; Wang, Z. The fault diagnosis based on self-organizing fuzzy clustering Elman network in wind turbines of paper. In Proceedings of the 2016 Chinese Control and Decision Conference (CCDC), Yinchuan, China, 28–30 May 2016; pp. 2940–2945. [Google Scholar] [CrossRef]
  39. Chibane, F.; Benammar, A.; Drai, R. Parameters estimation of ultrasonics echoes using the cuckoo search and adaptive cuckoo search algorithms of paper. In Proceedings of the 2018 26th European Signal Processing Conference (EUSIPCO), Rome, Italy, 3–7 September 2018; pp. 2415–2418. [Google Scholar] [CrossRef]
  40. Tholen, C.; El-Mihoub, T.A.; Nolle, L.; Zielinski, O. On the robustness of self-adaptive levy-flight of paper. In Proceedings of the 2018 OCEANS—MTS/IEEE Kobe Techno-Oceans (OTO), Kobe, Japan, 28–31 May 2018; pp. 1–5. [Google Scholar] [CrossRef]
  41. Song, Q. On the weight convergence of Elman Networks. IEEE Trans. Neural Netw. 2010, 21, 463–480. [Google Scholar] [CrossRef] [PubMed]
  42. Shi, S. Agile manufacturing predicting model based on neural network and automatic logistics predicting system in China of paper. In Proceedings of the 2012 Second International Conference on Intelligent System Design and Engineering Application, Sanya, China, 6–7 January 2012; pp. 764–767. [Google Scholar] [CrossRef]
  43. Kadam, P.; Vijayumar, S. Prediction Model: CO2 emission using machine learning of paper. In Proceedings of the 2018 3rd International Conference for Convergence in Technology (I2CT), Pune, India, 6–8 April 2018; pp. 1–3. [Google Scholar] [CrossRef]
Figure 1. The structure of the Elman neural network.
Electronics 11 02370 g001
Figure 2. The flowchart of cuckoo search algorithm.
Electronics 11 02370 g002
Figure 3. Raw material procurement data trend chart.
Electronics 11 02370 g003
Figure 4. The forecasting process of TMCS-ENN model.
Electronics 11 02370 g004
Figure 5. The curve of Pa varies with number of iterations.
Electronics 11 02370 g005
Figure 6. A flowchart of the MCS-Elman neural network.
Electronics 11 02370 g006
Figure 7. Forecast step diagram.
Electronics 11 02370 g007
Figure 8. CS-Elman and ENN prediction results.
Electronics 11 02370 g008
Figure 9. MCS-Elman and ENN prediction results.
Electronics 11 02370 g009
Figure 10. MCS-Elman and TMCS-Elman prediction results.
Electronics 11 02370 g010
Figure 11. MCS-Elman and TMCS-Elman prediction results (month).
Electronics 11 02370 g011
Figure 12. MCS-Elman and TMCS-Elman prediction results (half month).
Electronics 11 02370 g012
Table 1. Raw material purchase data set description.
Data ItemData Item
Type of raw materialsRaw sugar, including Brazilian sugar, Australian raw sugar, Thai raw sugar, etc.
Purchase quantityThe quantity of raw materials purchased in tons
Buyer nameCompany
Place of originRaw material origin
Unit priceThe price of raw materials in yuan/ton
Purchase dateTime of purchase, precise to the day
Table 2. Raw material consumption data set description.
Data ItemDescription
Type of raw materialsUsually raw sugar, including Brazilian sugar, Australian raw sugar, Thai raw sugar, etc.
Consumption quantityThe amount of consumed raw material, in tons
Factory areaProduction plant
Date of useTime of using raw material, precise to the day
Table 3. Finished sugar sales data set description.
Data ItemDescription
Product nameGenerally finished sugar, including white sugar, soft white sugar, caster sugar, etc.
Sales volumeTotal sales of finished sugar, in tons
Client’s namePurchaser
Unit priceThe price of finished sugar in yuan/ton
Sales dateFinished sugar sales time, precise to the day
Table 4. Comparison of the results under different time granularities.
RMSEMAPEPrediction Accuracy
Time GranularityTMCS-
ENN
MCS-El
Man
TMCS-
ENN
MCS-El
Man
TMCS-
ENN
MCS-El
Man
Month0.2450.3075.81%6.87%94.19%87.85%
Half month0.1170.1185.62%6.38%94.38%93.61%
Week0.0580.0925.36%6.73%94.64%93.27%
Publisher’s Note: MDPI stays neutral with regard to jurisdictional claims in published maps and institutional affiliations.

