Article

ARET-IQA: An Aspect-Ratio-Embedded Transformer for Image Quality Assessment

School of Computer Science and Technology, China University of Mining and Technology, Xuzhou 221116, China
*
Author to whom correspondence should be addressed.
Electronics 2022, 11(14), 2132; https://doi.org/10.3390/electronics11142132
Submission received: 14 June 2022 / Revised: 4 July 2022 / Accepted: 4 July 2022 / Published: 7 July 2022

Abstract

:
Image quality assessment (IQA) aims to automatically evaluate image perceptual quality by simulating the human visual system, which is an important research topic in the field of image processing and computer vision. Although existing deep-learning-based IQA models have achieved significant success, these IQA models usually require input images with a fixed size, which varies the perceptual quality of images. To this end, this paper proposes an aspect-ratio-embedded Transformer-based image quality assessment method, which can implant the adaptive aspect ratios of input images into the multihead self-attention module of the Swin Transformer. In this way, the proposed IQA model can not only relieve the variety of perceptual quality caused by size changes in input images but also leverage more global content correlations to infer image perceptual quality. Furthermore, to comprehensively capture the impact of low-level and high-level features on image quality, the proposed IQA model combines the output features of multistage Transformer blocks for jointly inferring image quality. Experimental results on multiple IQA databases show that the proposed IQA method is superior to state-of-the-art methods for assessing image technical and aesthetic quality.

1. Introduction

With the prevalence of smartphones and digital cameras, a growing number of images have sprouted in people’s daily life. However, various distortion types (e.g., blur and JPEG compression) or discordant elements (e.g., low light and monotonous color) may cause image quality degradation during the shooting and imaging process of camera devices. Consequently, image quality assessment (IQA) [1,2] that can automatically predict the technical and aesthetic quality of images is a fundamental task in the computational photography and computer vision communities, which is extremely valuable in optimizing many applications, such as image compression [3], image restoration [4], photo enhancement [5], image reconstruction [6], and image synthesis [7].
IQA can be divided into two tasks: image technical quality assessment (TQA) and image aesthetic quality assessment (AQA) [8]. The purpose of TQA is to evaluate the perceptual quality of images by measuring the degree of distortion [1], while AQA aims to infer the aesthetics of images perceived by people [2]. Since the two tasks deal with similar aspects of the people’s subjective experience on images, some recent approaches have designed a unified IQA framework to study them [9,10]. Early IQA methods mainly extract handcrafted features to train machine learning models for predicting the perceptual quality of images [11,12,13,14,15]. In recent years, the powerful feature representation ability of convolutional neural networks (CNNs) has promoted end-to-end IQA methods to achieve more notable performance [9,16,17,18,19,20,21,22]. However, since images used for model training have various sizes, these CNN-based IQA methods need to warp the input images to a fixed size (e.g., 224 × 224 ), which destroys the composition of images or produce distortions, resulting in changes in the technical or aesthetic quality of images. For example, Figure 1 shows two original images with annotated scores as well as the corresponding images warped to a fixed size. As can be seen from the figure, warping the image to a fixed size brings different perceptual quality, and directly assigning scores to warped images for model training deteriorates its evaluation ability.
To deal with the above issue, some methods have been proposed to build IQA models by introducing the aspect ratios of images or directly learning the patches of full-size images [10,24,25]. In [25], Chen et al. proposed an IQA model using an adaptive fractional dilated convolution according to images’ aspect ratios and demonstrated the significance of keeping aspect ratios in the IQA model. However, this model needs to group input images by different aspect ratios, which is cumbersome to implement during model training. Ke et al. introduced a multiscale Transformer-based IQA model to deal with images with varying sizes and aspect ratios [10], which utilized hash-based 2D absolute position encoding to embed multiple-scale patches of image-preserving aspect ratio into a Transformer model. However, it needs to learn massive patches at multiple scales of the original images, which greatly increases the computational overhead for model training and inference. Therefore, it is critical to effectively introduce the information of aspect ratios into IQA models without cumbersome preprocessing of the input images (e.g., grouping or splitting into patches).
In this paper, we propose an aspect-ratio-embedded Transformer for image quality assessment (ARET-IQA), which can easily implant the adaptive aspect ratios of input images into the multihead self-attention module of the transformer network. Specifically, the main contributions of our work are as follows:
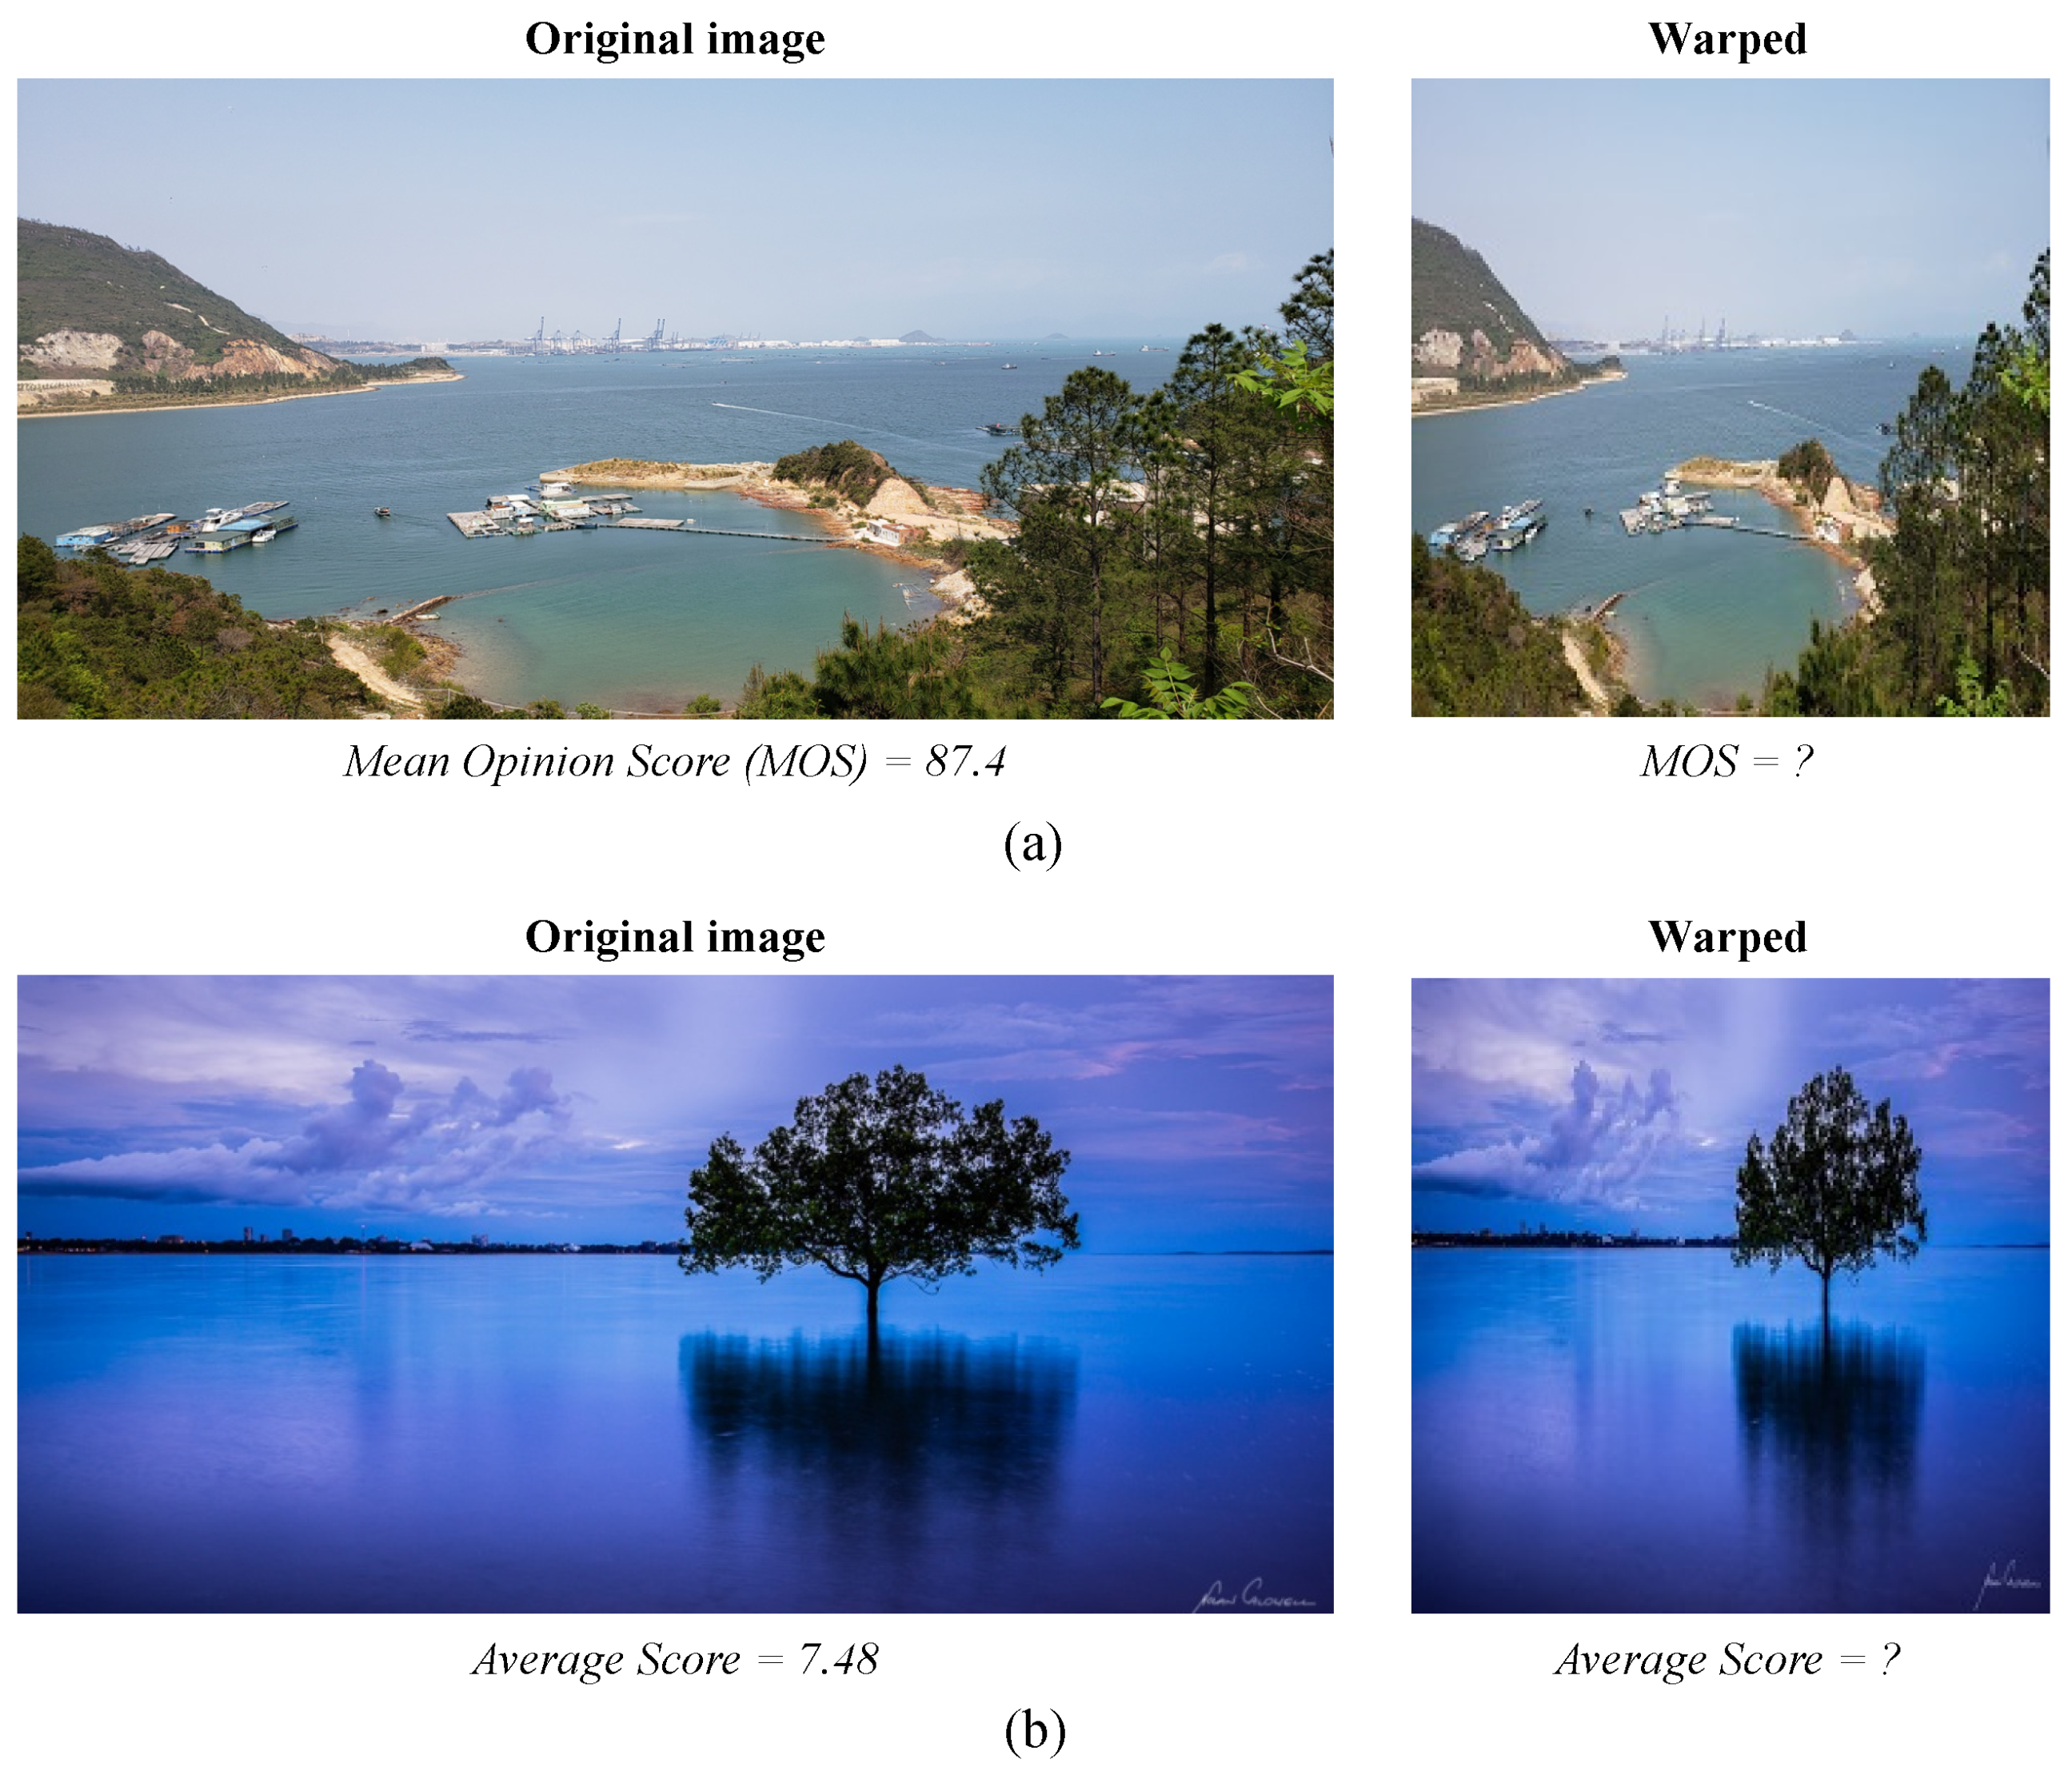
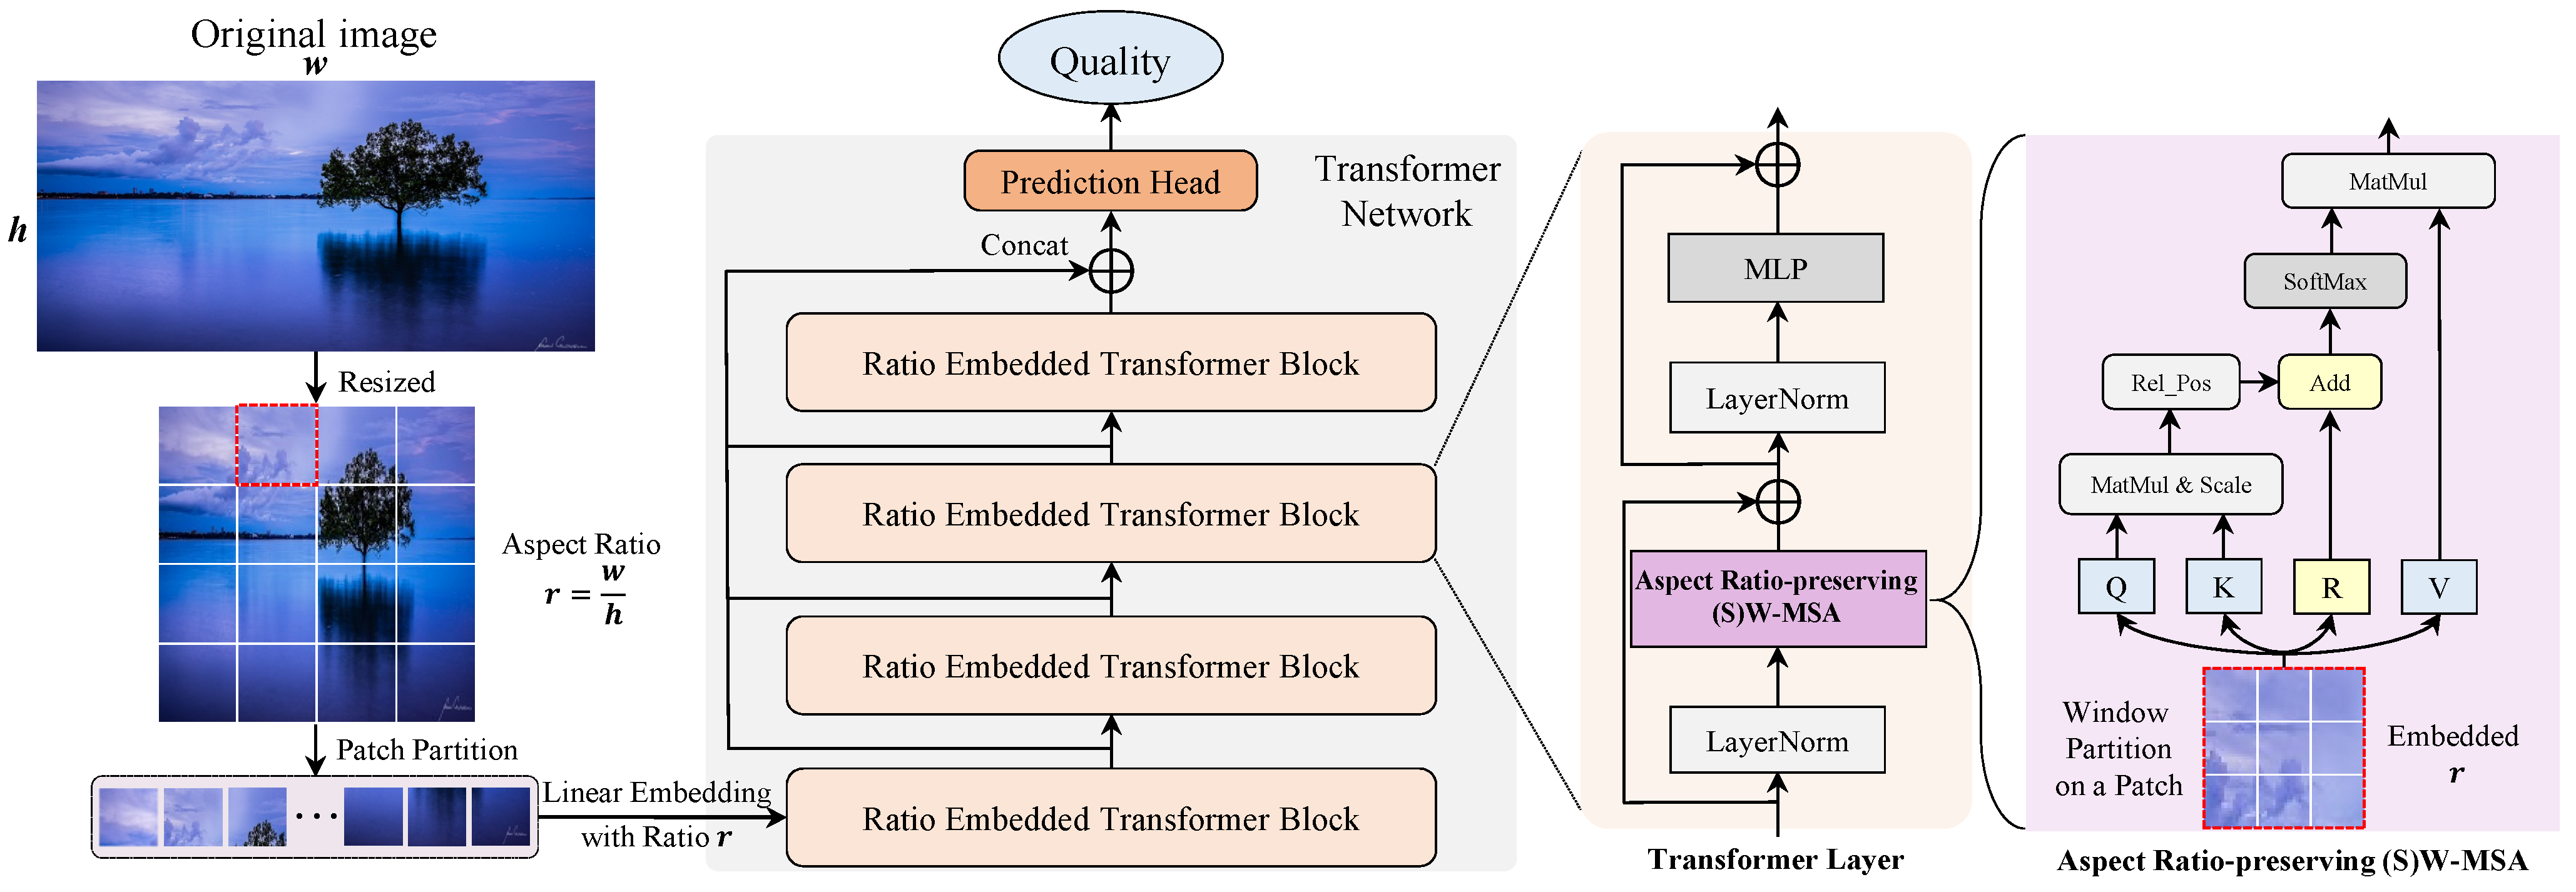
  • We adaptively embed the original aspect ratios of input images into the self-attention module of the Swin Transformer [26], which can alleviate the quality change caused by warping the input images to a fixed size and improve the evaluation performance of the proposed IQA model.
  • We employ the shifted window-based self-attention module to effectively reduce the computational overhead of our Transformer-based IQA model, which can not only capture features that measure image quality as a whole but also combine the output features of multistage Transformer blocks to jointly infer the perceptual quality of images.
  • We propose an aspect-ratio-embedded Transformer for image quality assessment (ARET-IQA), whose experimental results on multiple IQA databases demonstrate that the proposed ARET-IQA model is superior to the state-of-the-art IQA models.

2. Related Works

2.1. Image Quality Assessment

According to the concern of image distortion or aesthetics, the existing IQA methods can be divided into two categories: technical quality assessment (TQA) [27] and aesthetic quality assessment (AQA) [11]. Due to the immaturity of early image processing and transmission technology, the images delivered to the end-users are easily contaminated by various distortions. Early researchers mainly focus on TQA methods that can measure the degree of image distortion. Generally, TQA can be classified into two categories: natural scene statistics (NSS)-based methods [13,28,29] and learning-based methods [30,31,32,33]. In recent years, with the popularity of social media and photography, people have begun to pay attention to the aesthetic aspects of images. Hence, researchers have proposed many AQA methods that can predict the aesthetics of images, including handcrafted feature-based methods [11,15] and deep-learning-based methods [34,35,36].
Recent studies have demonstrated that CNN-based methods have achieved remarkable performance in both TQA and AQA [37,38]. In [9], a unified IQA framework was proposed to handle the above two tasks simultaneously, which leveraged a CNN pretrained on ImageNet to train an IQA model that can predict the distribution of quality scores. However, the approach requires the input images to be warped to a fixed size for accommodating batch training, which inevitably varies the perceptual quality of images. In view of this, several methods have been proposed to extract multipatches with a fixed size from the original images to train a CNN-based IQA model [24,39,40]. For instance, Hosu et al. [24] leveraged the fixed-size features extracted from the original images to train an IQA model, which increased the cost of additional storage for the fixed-size features. Besides, Zhu et al. [41] used spatial pyramid pooling (SPP) to directly input full-size images to CNN models for training, but it strictly limited the size of the input images to be consistent. To learn the aspect ratio of the original image in CNN models, Chen et al. [25] leveraged an adaptive fractional dilated convolution to embed image aspect ratios into the training of an IQA model. However, it needed to group input images in batch training according to varying sizes and aspect ratios. Thanks to the success of the Transformer in vision tasks, Ke et al. [10] proposed a multiscale Transformer-based IQA model to handle images with different aspect ratios, which utilized hash-based 2D absolute-position-encoding to embed multiple-scale patches of original images into a Transformer model. However, the model training with multiscale patches of full-size images greatly increases the extra cost, which is inefficient for training on IQA databases with high-resolution images [23]. Therefore, it is urgent to develop a simple and effective method to preserve the original aspect ratios of images in the learning of the deep IQA model that requires a fixed input size.

2.2. Aspect-Ratio-Preserving

The Transformer [42] was originally applied to handle the natural language processing (NLP) task [43] due to its powerful ability to capture long-range dependencies. In recent years, several researchers have begun to use the Transformer in vision tasks and achieved outstanding performance [26,44]. In particular, the Vision Transformer (ViT) split an image into a sequence of nonoverlapping patches and input them into the Transformer based on self-attention for image classification [44]. This method employed absolute positional embeddings to encode the sequence of input patches. In [26], the authors proposed a more efficient Transformer model by restricting the self-attention computation to local windows, which used relative positional embeddings and window shifting to obtain cross-window connections on the whole images. Due to the huge cost of self-attention computation, the Transformer usually requires all input images to be resized to a fixed resolution (e.g., 224 × 224 ). To preserve the original aspect ratios of input images in Transformer, an effective strategy is to utilize the aspect ratio to compensate for the self-attention computation on the resized images. Meanwhile, in order to reduce the computational burden and improve learning efficiency, we employed the Swin Transformer [26] as the backbone network and embedded the original aspect ratios of input images into the local window-based multihead self-attention module.

3. Proposed Method

In this section, we introduce the proposed aspect-ratio-embedded Transformer for image quality assessment, which is termed ARET-IQA. The proposed ARET-IQA can easily plant the original aspect ratios of input images into the self-attention computation in the Transformer and comprehensively utilize low-level and high-level features to predict the perceptual quality of images. In Figure 2, we show the overview framework of the proposed IQA method, which is based on a typical Swin Transformer model. First, we split the images with fixed size into nonoverlapping patches and embed the patches and the original aspect ratios into the Transformer blocks. Then, we propose an aspect-ratio-preserving (shifted) window-based multihead self-attention ((S)W-MSA) in each ratio-embedded Transformer block, which can utilize the aspect ratios to adjust the computation of self-attention. Finally, we leverage a prediction head to jointly infer the perceptual quality of images by combining the outputs of all Transformer blocks.

3.1. Patch and Aspect Ratio Embedding

In our method, we adopt a typical Swin Transformer [26] as the backbone network whose parameters are pretrained on ImageNet [45]. As shown in Figure 2, the structure of the proposed Transformer network is inherited from the Swin Transformer, which consists of four ratio-embedded Transformer blocks and a prediction head. In particular, we employ a residual connection after each Transformer block to obtain multilevel image features. In each Transformer block, we embed the original aspect ratios of images into multiple Transformer layers and the number of Transformer layers is a multiple of 2, one of which is for an aspect-ratio-preserving W-MSA, and the other is for an aspect-ratio-preserving SW-MSA. In the prediction head, a two-layer multilayer perceptron (MLP) is applied for predicting the perceptual quality of an image.
Assume that the width and height of an image are w and h, respectively. To fit the input of the proposed Transformer network, the image is resized to a fixed size x R W × H × C ( W = H ), where W, H, and C represent the width, height, and channel-wise dimension of the resized image x . Hence, the original aspect ratio of the image can be computed by r = w / h . In the step of patch partition, the image is split into m × m patches { x i } i = 1 L R W m × H m , where L = m × m × C denotes the number of patches. Then, we employ an embedding layer to feed the linearly combined image patch x R W m × H m × L together with the corresponding aspect ratio r into the proposed Transformer network.

3.2. Aspect-Ratio-Preserving Multihead Self-Attention

In the proposed network, each ratio-embedded Transformer block consists of multiple Transformer layers, which include an aspect-ratio-preserving W-MSA or an aspect-ratio-preserving SW-MSA, followed by a two-layer MLP. Particularly, a LayerNorm (LN) layer and a residual connection are applied before and after each aspect-ratio-preserving (S)W-MSA module and each MLP module, respectively. For efficient training, the computation of the self-attention is performed on a local window of image patches.
Suppose that the image patch x contains n × n local windows { x j } j = 1 P R W m n × H m n , where P = m n × m n × C denotes the number of local windows. Then, we can obtain the linearly combined image window X R W m n × H m n × P . In a Transformer layer for aspect-ratio-preserving W-MSA, the whole process is defined as
X ^ l = ARW MSA ( LN ( X l 1 ) ) + X l 1 , X l = MLP ( LN ( X ^ l ) ) + X ^ l ,
where ARW-MSA denotes the aspect-ratio-preserving W-MSA, and X ^ l and X l represent the output features of the ARW-MSA and MLP for the lth layer, respectively. Following by the layer, the process of a Transformer layer for aspect-ratio-preserving SW-MSA can be formulated as
X ^ l + 1 = ARSW MSA ( LN ( X l ) ) + X l , X l + 1 = MLP ( LN ( X ^ l + 1 ) ) + X ^ l + 1 ,
where ARSW-MSA denotes the aspect-ratio-preserving SW-MSA, and X ^ l + 1 and X l + 1 represent the output features of the ARSW-MSA and MLP for the ( l + 1 ) th layer, respectively. In the ARSW-MSA, the self-attention computation based on shifted windows facilitates connections between adjacent windows and the calculation process details in [26].
In each ARW-MSA or ARSW-MSA, to introduce the original aspect ratio of an image, we add the aspect ratio r to the computation of the multihead self-attention on the image window X , and the proposed aspect-ratio-preserving self-attention matrix A can be formulated as
A = SoftMax ( Q K T / d + B + α A d ) V ,
where α is the coefficient to control the term of the aspect-ratio-preserving position relation matrix A d on the computation of the multihead self-attention. Q , K , V R M 2 × d denote the query, key, and value based on the image window X , respectively. M = W m n = H m n and d are the width (or height) and dimension of the query (or key). B R M 2 × M 2 represents the relative position bias with learnable parameters to capture the spatial relation of the pixels in the local windows [26]. However, the bias term B cannot learn the true spatial position correlations of images with various aspect ratios. In view of this, we leverage the aspect ratio r to obtain the spatial position relations between pairwise pixels in local windows. Assume that ( X i , X j ) and ( X i , X j ) denote the coordinates of two pixels in the image window X , where 1 X i , X j , X i , X j M . The aspect-ratio-embedded spatial distance between these two pixels can be calculated by
d i s ( ( X i , X j ) , ( X i , X j ) ) = ( ( X i X i ) × r ) 2 + ( X j X j ) 2 .
Then, the affinity matrix A d R M 2 × M 2 of the aspect-ratio-embedded spatial position correlations can be formulated as
A d = Max ( d i s ( ( X i , X j ) , ( X i , X j ) ) ) d i s ( ( X i , X j ) , ( X i , X j ) ) ,
where Max ( · ) indicates the max value operation. In this way, we add the aspect-ratio-preserving position relation matrix A d to the multihead self-attention, enabling the proposed Transformer network to capture the influence of the original aspect ratio on image quality in modeling training. In addition, the proposed A d is only related to the aspect ratios of the original images, which does not add additional learning burden in the AR(S)W-MSA module of all ratio-embedded Transformer blocks.

3.3. Quality Prediction

After each ratio-embedded Transformer block, we utilize the global average pooling to obtain the output features of these multistage blocks. Suppose that f t 1 , f t 2 , f t 3 , and f t 4 are the output features of four ratio-embedded Transformer blocks, which can be computed by
f t 1 = GAP ( RET θ 1 ( X ) ) , f t 2 = GAP ( RET θ 2 ( RET θ 1 ( X ) ) ) , f t 3 = GAP ( RET θ 3 ( RET θ 2 ( RET θ 1 ( X ) ) ) ) , f t 4 = GAP ( RET θ 4 ( RET θ 3 ( RET θ 2 ( RET θ 1 ( X ) ) ) ) ) ,
where GAP denotes the global average pooling operation. RET θ 1 , RET θ 2 , RET θ 3 , and RET θ 4 indicate the four ratio-embedded Transformer blocks. The residual connection is applied after each Transformer block to concatenate the multilevel features, which is defined as
f = c o n c a t ( f t 1 , f t 2 , f t 3 , f t 4 ) ,
where c o n c a t ( · ) indicates the connect function. Then, we propose a prediction head to map the combine features to the perceptual quality of an image, which consists of a two-layer MLP and it is defined as
q ^ = M L P θ ( f ) ,
where q ^ is the predicted image quality and θ denotes the parameters of the prediction head M L P θ .
When training on the IQA databases, we leverage the l 2 loss function for a single mean opinion score (MOS) [40], which takes the form
L = 1 N i = 1 N ( q i q ^ i ) 2 ,
where N is the number of training images. q ^ i and q i are the predicted and ground-truth quality scores of the ith image in the training set. For the quality score distribution [9], we employ the earth mover’s distance (EMD) loss function to optimize the parameters of the Transformer network, which is formulated as
L = 1 N i = 1 N 1 P p = 1 P | C D F q ( p ) C D F q ^ ( p ) | 2 1 2 ,
where q ^ i and q i are the predicted and ground-truth normalized score distributions and C D F q ( p ) = p = 1 P q ( p ) denotes the cumulative distribution function.
In this manner, the proposed IQA model based on the aspect-ratio-embedded Transformer can be obtained by training on the IQA databases. In the inference phase, we input a testing image into the proposed ARET-IQA model and can obtain the perceptual quality of the image.

4. Experimental Results

In this section, we verify the performance of the proposed ARET-IQA on two categories of IQA databases, one of which is for technical quality assessment (TQA), and the other is for aesthetic quality assessment (AQA).

4.1. Databases

The TQA database was used to train the IQA models that can evaluate the quality of images based on the degree of distortion; it includes the LIVE challenge [46], KonIQ-10k [27], and SPAQ [23] databases. The LIVE challenge [46] database contains 1162 images in the wild, which are polluted by various distortions (e.g., motion blur and overexposure). The quality score of each image ranges from 0 to 100 and a higher score indicates a better quality; the quality score was obtained by online crowdsourcing. KonIQ-10k [27] is a relatively large-scale database that contains 10,073 images with authentic distortion. The quality scores of these images are in the range [ 1 , 5 ] and higher scores indicate better quality. The SPAQ [23] database consists of 11,125 images with high resolution that were captured by 66 smartphones, where each image is annotated with a quality score and some attributes. We only used the quality scores of these images as the supervised labels for model training, which range from 0 to 100 and the higher the score, the higher the quality. For the three databases, we followed the same training–testing partitioning policy as the previous literature [37,40,41], which randomly sampled 80% images for model training and validation, and the remaining 20% images for model testing. Moreover, the l 2 loss function was used to train a regression on the single mean opinion scores of images in the three TQA databases.
The AQA database was used to train the IQA models that infer the quality of images from the aspect of aesthetics; we employed the AVA database [11] in our experiment. AVA is the most famous AQA database that consists of more than 250,000 images, where each image received ten-point ratings from about 210 photographers. The aesthetic ratings of these images are in the range [1, 10], and a higher rating indicates better quality. Similar to previous works [10,11], we sampled 230,000 images for model training and validation, and the rest of the 20,000 images were used for model testing. In addition, we employ the EMD loss function to predict the ten-scale score distribution of images in the AVA database.

4.2. Experimental Settings

Implementation details: The ratio-embedded Transformer blocks of the proposed network was inherited from the Swin Transformer [26] pretrained on ImageNet [45]. In the prediction head, M L P θ was composed of two fully connected layers with 512 nodes and 1 node (for AVA, 10 nodes), the parameters of which were randomly initialized. Images were resized to 224 × 224 × 3 (or 384 × 384 × 3 ) for feeding into the proposed Transformer network and the hyperparameter α was set to 0.5. In the model training, the learning rates of the Transformer blocks and the prediction head were set to 1 × 10 5 and 1 × 10 3 . In addition, we set the batch size and the number of epochs to 100 and 50, respectively. Throughout the training process of the proposed model, the learning rates dropped to a factor of 0.5 after every five epochs. We adopted Adam to optimize the parameters of our ARET-IQA model, which was implemented on PyTorch.
Evaluation criterion: For the TQA task [37,40,41], we adopted the Spearman rank-order correlation coefficient (SRCC) and Pearson linear correlation coefficient (PLCC) to evaluate the performance of the quality score regression. The values of SRCC and PLCC are in the range [ 1 , 1 ] , and better IQA methods should have higher values of SRCC and PLCC. For the AQA task of score distribution prediction [9,10,22], we employed another two criteria (i.e., overall accuracy (ACC) and earth mover’s distance (EMD)) besides SRCC and PLCC for verifying the performance of IQA methods. The value of ACC is in the range [ 0 , 1 ] , and better IQA methods should have higher values of ACC and lower values of EMD.

4.3. Comparing with the State-of-the-Art IQA Methods

4.3.1. Performance on TQA Databases

To verify the performance of our ARET-IQA model, we compared the proposed method with several state-of-the-art IQA methods on three TQA databases: LIVE challenge [46], KonIQ-10k [27], and SPAQ [23]. To avoid random bias, we performed ten repeated runs on these databases and report the average results.
In Table 1, we show the tested results (SRCC and PLCC) on the LIVE challenge and KonIQ-10k databases, where the best results for each database are shown in bold. Overall, ARET-IQA (384) and ARET-IQA (224) yield the best and second-best results in terms of SRCC and PLCC, which denotes that the prediction monotonicity and consistency of our method are superior to the other IQA methods even if the images in the databases have the same sizes (e.g., 1024 × 768 in KonIQ-10k). Specifically, our method significantly outperforms five handcrafted features-based IQA methods (BLIINDS-II [28], BRISQUE [13], ILNIQE [29], CORNIA [30], and HOSA [31]) and six CNN-based IQA methods (BIECON [32], WaDIQaM-NR [18], DB-CNN [37], HyperNet [40], and MetaIQA+ [41]), which demonstrates the effectiveness of using the Transformer network in the IQA task. Compared with two transformer-based IQA methods (MUSIQ [10] and TRIQ [47]), our method also achieves superior performance on these two databases, indicating that the proposed ARET-IQA is efficient in embedding the original aspect ratios into the Swin Transformer without additional learnable network parameters.
Table 2 shows the tested results (SRCC and PLCC) on the SPAQ database, where the images have varying sizes and aspect ratios. As shown in the table, our method based on the Swin Transformer network with two input resolutions is superior to the other IQA methods, which illustrates the effectiveness of the proposed ARET-IQA for assessing the quality of images with various aspect ratios. Specifically, the deep-learning-based IQA models are better than handcrafted feature-based IQA models. Compared with the other IQA models that are also based on CNN and Transformer, our method has a significant performance improvement, which also illustrates the usefulness of introducing the original aspect ratios of images in the multihead self-attention computation, even when the proposed Transformer requires fixed input sizes.

4.3.2. Performance on AQA Database
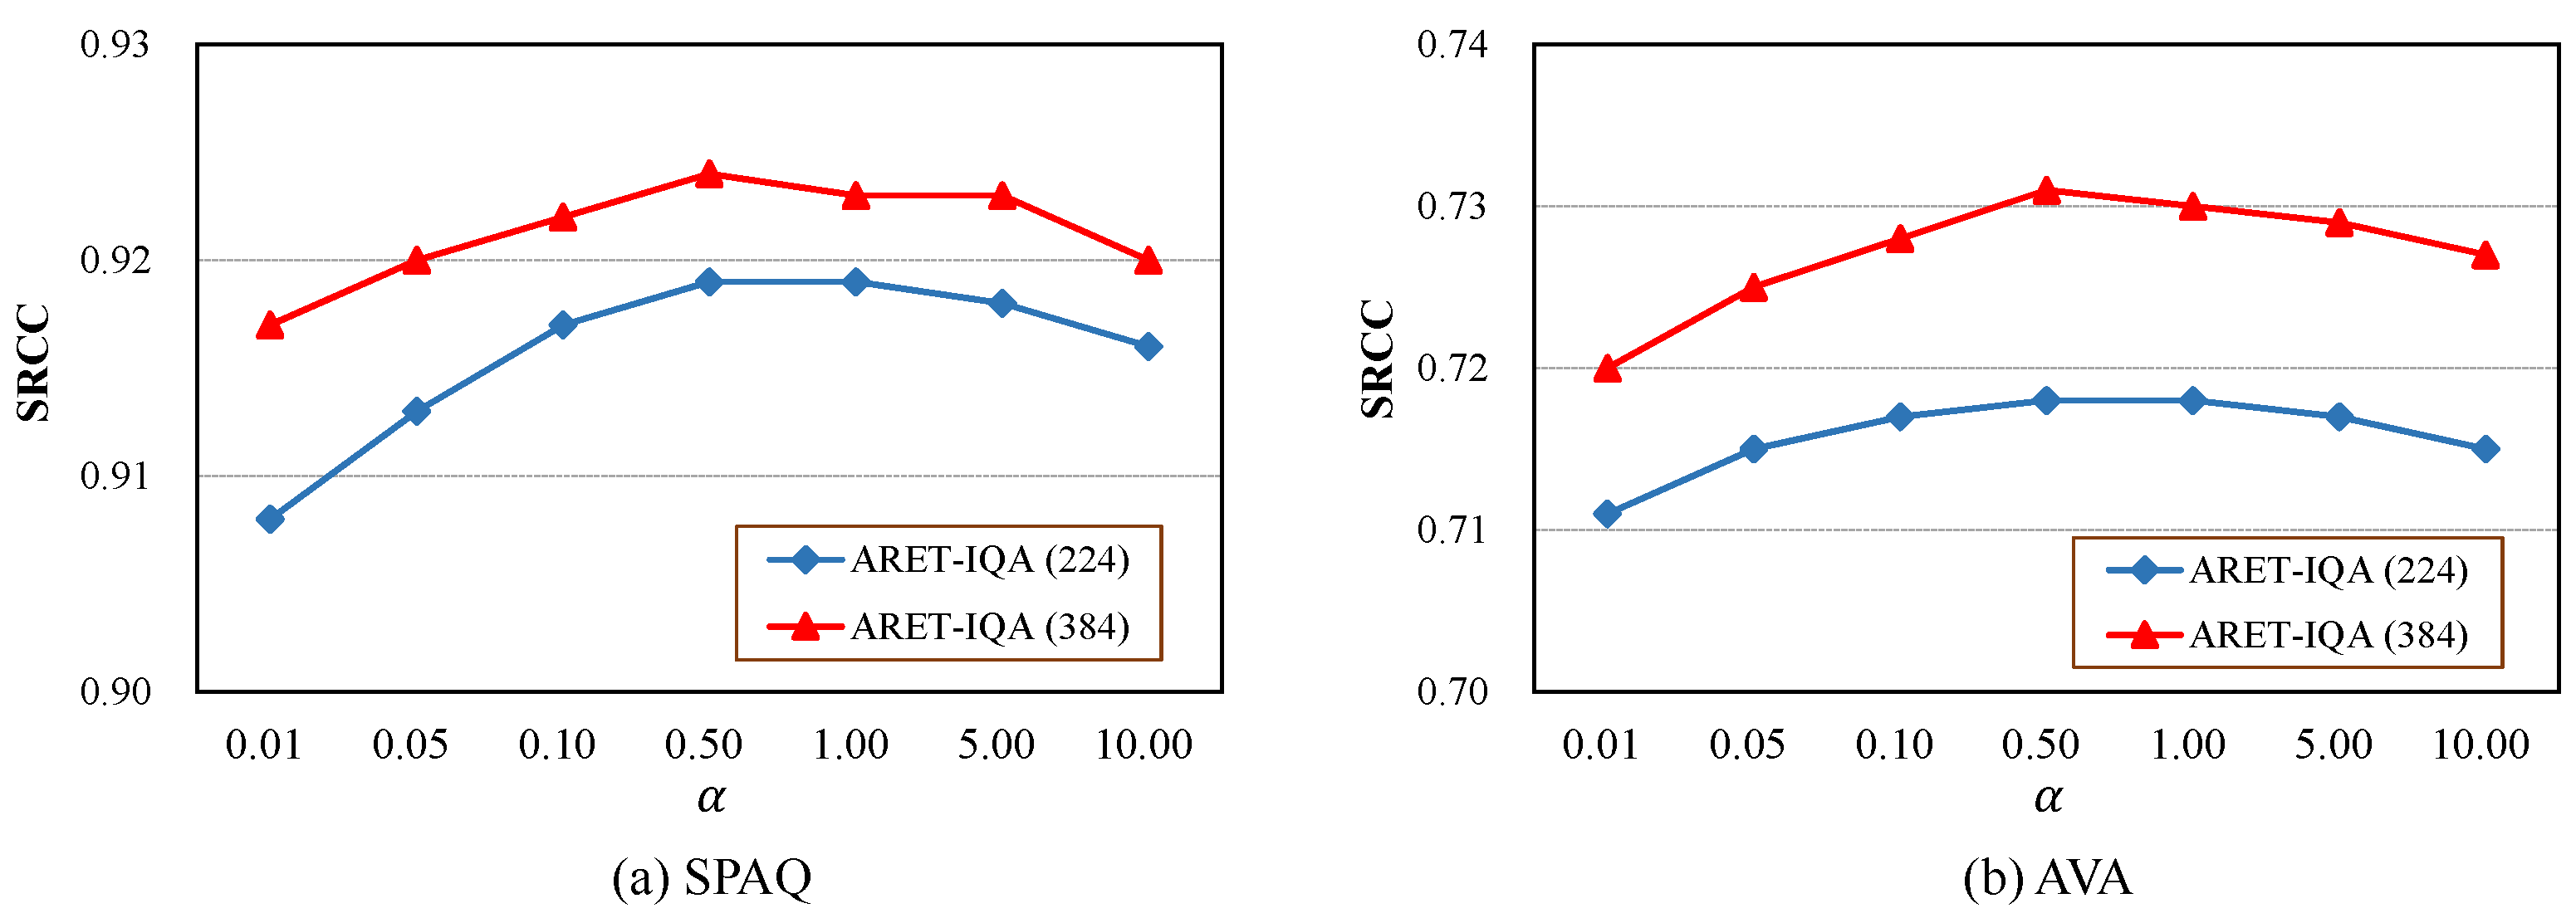
To further evaluate the performance of our ARET-IQA model on aesthetic quality assessment, we compared our method with several representative IQA methods on a widely used TQA database: AVA [11]. Since the score distribution of images in AVA can be transformed into mean scores and a binary class, we show the comparison results of the proposed method with three tasks of IQA methods [22] in Table 3, where ACC is used for the binary classification, SRCC and PLCC are used for the score regression, and EMD is used for the distribution prediction.
As shown in the table, the proposed ARET-IQA delivers better performance than the other IQA methods in the tasks of score regression and distribution prediction, which also demonstrates the effectiveness of our method in aesthetic quality assessment by learning the aspect ratios of images in the Transformer network. Compared with ARET-IQA (224), the improvement of ARET-IQA (384) on SRCC and PLCC is 1.3% and 1.5%, respectively. This indicates that it is more efficient to embed image aspect ratios in the Transformer with higher input resolutions. For the binary classification, although several CNN-based IQA methods (PA_IAA [38], HLA-GCN [35] and Zhu et al. [36]) are better than the Transformer-based IQA methods (MUSIQ [10] and our method), ARET-IQA (384) still outperforms MUSIQ by 2.1%. This demonstrates that the proposed ARET-IQA is more effective in evaluating image aesthetic quality by using a simple aspect-ratio-embedding strategy instead of directly learning the massive original image patches in the Transformer network.

4.4. Ablation Study

In this subsection, two ablation studies were performed to verify the impact of embedding the aspect ratio on the performance of our ARET-IQA based on the Transformer network.
We first discuss the efficacy of a key hyperparameter, α (the coefficient to control the term of the aspect-ratio-preserving position relation matrix on the computation of the multihead self-attention), in our model based on the Swin Transformer with two default input resolutions, i.e., ARET-IQA (224) and ARET-IQA (384). We set α to different values and Figure 3 shows the test results (SRCC) on a TQA database (SPAQ [27]) and an AQA database (AVA [11]), where the images have various aspect ratios. As shown in the figure, we can observe that when α is set to 0.5, ARET-IQA (224) and ARET-IQA (384) can achieve the best performance on both TQA and AQA databases. Specifically, when α increases from 0.01 to 0.5, the SRCC values of the proposed ARET-IQA increase dramatically, which proves the necessity of introducing image aspect ratio information into the multihead self-attention of the Transformer. When α exceeds 0.5, the SRCC values of our model on the two databases decrease slightly. Consequently, we set α to 0.5 in all our experiments.
Then, we further verified the contribution of embedding the image aspect ratio and combining multilevel features in the proposed method for learning image quality. In our model, we removed the aspect-ratio-preserving position relation matrix from the computation of the multihead self-attention (ARET-IQA w/o ratio). We replaced the multilevel features with the output features of the last Transformer block in the proposed model, which is called “ARET-IQA w/o multi”. A baseline model is to simultaneously eliminate the image aspect ratio information and the multilevel feature combination in the proposed method. We conducted the above ablation experiments on the SPAQ [27] and AVA [11] databases and list the tested results (SRCC and PLCC) of our ARET-IQA (384) in Table 4. Overall, the full version of our ARET-IQA model achieves the best performance on both databases. Concretely, ARET-IQA significantly outperforms “ARET-IQA w/o ratio”, which indicates that embedding the image aspect ratio in the proposed Transformer network is efficient for learning the technical and aesthetic quality of images without cumbersome preprocessing of the input images. Compared with “ARET-IQA w/o multi”, ARET-IQA also yields slight performance improvement, which demonstrates the effectiveness of learning image quality by combining the output features of multistage Transformer blocks in our model. In addition, ARET-IQA is superior to the baseline model by a large margin, which also proves that jointly introducing the image aspect ratio information and the multilevel feature combination into the Transformer contributes to the proposed model for assessing image quality.

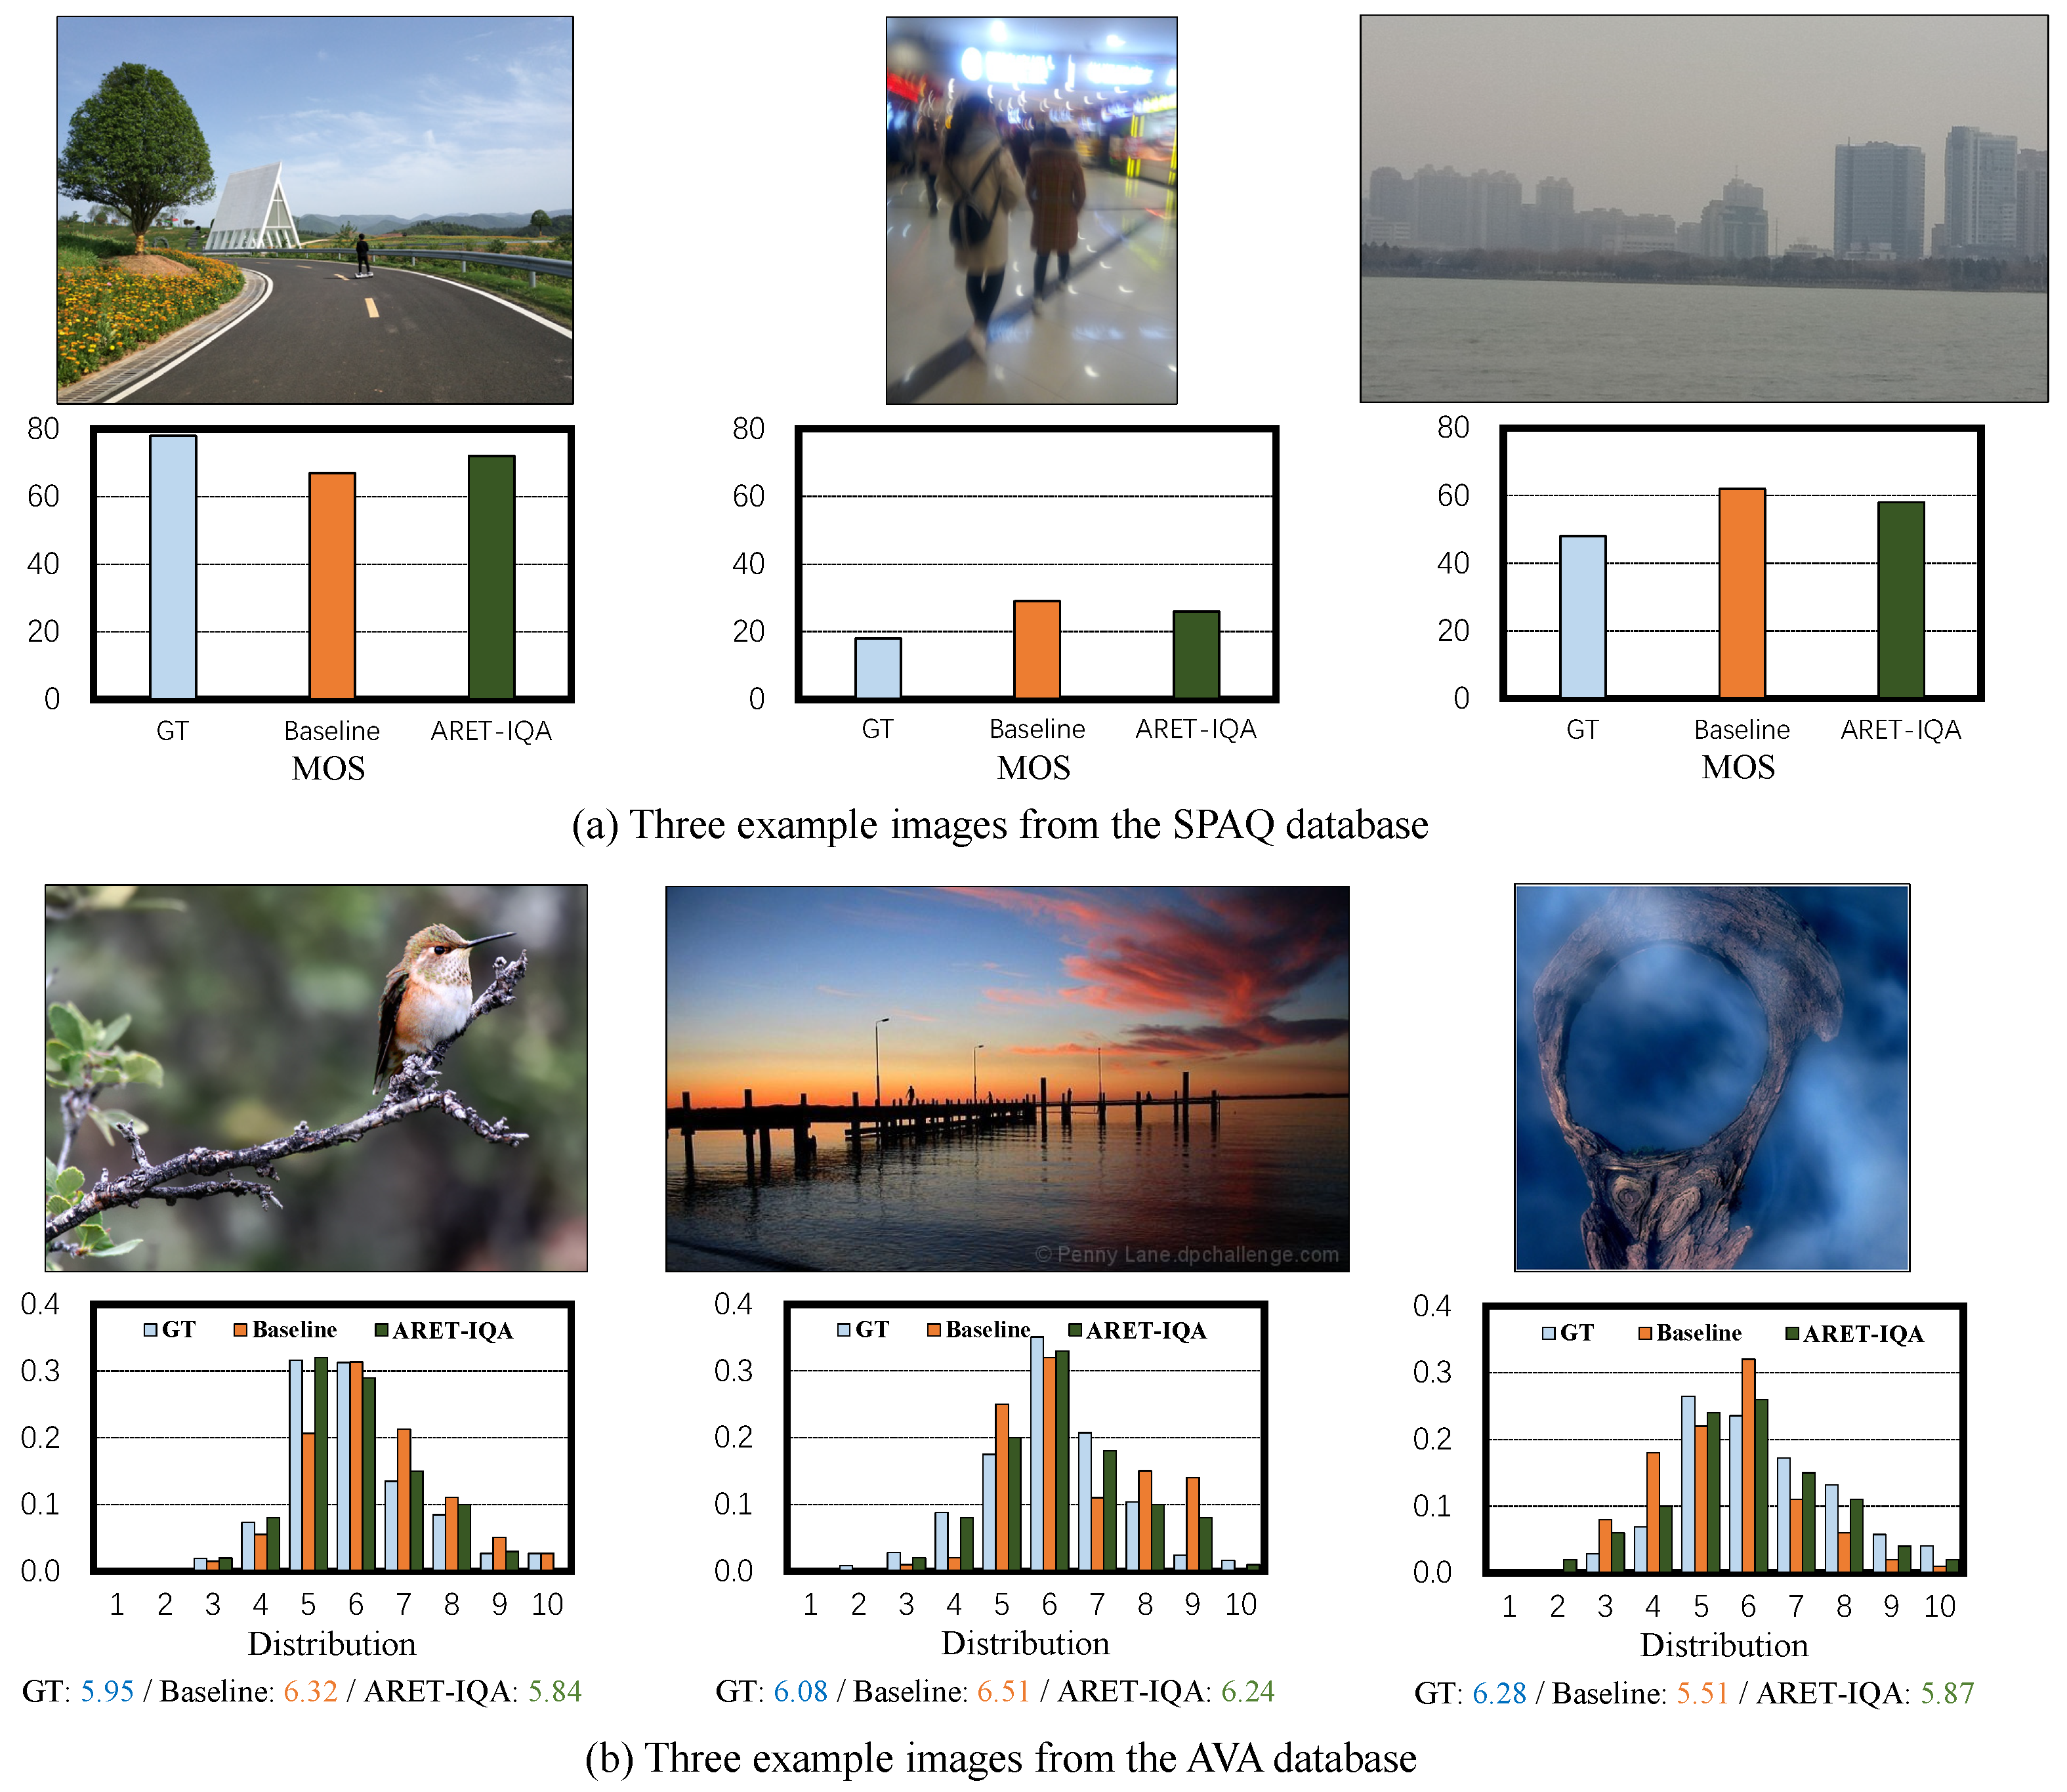
4.5. Visual Analysis

To intuitively demonstrate the effectiveness of our model for predicting image quality, we randomly selected some example images with varying aspect ratios on the SPAQ [27] and AVA [11] databases and evaluated them with the proposed ARET-IQA (384) and the baseline model based on the same Transformer network. The test results of these images are shown in Figure 4. Compared with the baseline model, the predicted quality scores (MOS or distribution) of the proposed ARET-IQA are more consistent with the ground truth in the two databases, which shows the usefulness of our method to embed the original aspect ratios of images in the Transformer network. In addition, our method can obtain the aesthetic scores of the images with different aspect ratios more accurately than the baseline model on the AVA database. It is worth noting that the learnable parameters of our ARET-IQA model are the same as those of the baseline model, which demonstrates that the proposed aspect ratio embedding strategy can effectively predict the technical and aesthetic quality of images with various aspect ratios and sizes without adding additional computational burden in the Transformer.
According to the above visual analysis, our method can perform well in predicting image quality. However, there are many factors that can affect the quality of images and need to be inferred comprehensively, so the proposed method has some failure cases in image quality assessment, as shown in Figure 5. For the two images with complex backgrounds and aspect ratios close to 1, our method performs worse than the baseline model. This demonstrates that our method mainly captures correlations between local regions and lacks the ability to infer image quality by integrating global information.

5. Conclusions

In this paper, we presented an image quality assessment based on the aspect-ratio-embedded Transformer (ARET-IQA). Compared to extensive state-of-the-art IQA methods, our ARET-IQA can more effectively predict the perceptual quality of images that have various sizes, which was achieved through embedding the original aspect ratios of images in the multihead self-attention of the Swin Transformer network. Moreover, the proposed IQA method was shown to be efficient in assessing image quality by combining the output features of multistage Transformer blocks. Experimental results and a visual analysis on four IQA databases showed that the proposed method can effectively evaluate the perceptual quality of images in terms of both technology and aesthetics. In the future, the proposed method will enlighten a novel way to introduce the native resolution information of images in deep-learning-based IQA models with fixed input sizes.

Author Contributions

Conceptualization, H.Z. and Y.Z.; methodology, H.Z. and Z.S.; software, H.Z.; validation, W.-L.D., J.Z. and R.Y.; formal analysis, W.-L.D.; investigation, H.Z.; resources, H.Z.; data collection, H.Z.; writing—original draft preparation, H.Z.; writing—review and editing, Y.Z. and Z.S.; visualization, H.Z.; supervision, Y.Z.; project administration, Y.Z.; funding acquisition, H.Z. All authors have read and agreed to the published version of the manuscript.

Funding

This work was supported by the National Natural Science Foundation of China under grants 62101555, 62106268, 62002360 and 62172417, the Natural Science Foundation of Jiangsu Province under grants BK20210488 and BK20201346, the Project funded by China Postdoctoral Science Foundation under grant 2022M713379, the Fundamental Research Funds for the Central Universities under grant 2021QN1071, the High-Level Talent Program for Innovation and Entrepreneurship (ShuangChuang Doctor) of Jiangsu Province under grant JSSCBS20211220, and the Six Talent Peaks High-level Talents in Jiangsu Province under grant 2015-DZXX-010.

Data Availability Statement

The experiment uses four public IQA databases, including the LIVE challenge, KonIQ-10k, SPAQ, and AVA databases. LIVE challenge: http://live.ece.utexas.edu/research/ChallengeDB/index.html (accessed on 1 May 2022); KonIQ-10K: http://database.mmsp-kn.de/ (accessed on 1 May 2022); SPAQ: https://github.com/h4nwei/SPAQ (accessed on 1 May 2022); AVA: https://academictorrents.com/details/71631f83b11d3d79d8f84efe0a7e12f0ac001460 (accessed on 1 May 2022).

Conflicts of Interest

The authors declare no conflict of interest.

References

  1. Kim, J.; Zeng, H.; Ghadiyaram, D.; Lee, S.; Zhang, L.; Bovik, A.C. Deep Convolutional Neural Models for Picture-Quality Prediction: Challenges and Solutions to Data-Driven Image Quality Assessment. IEEE Signal Process. Mag. 2017, 34, 130–141. [Google Scholar] [CrossRef]
  2. Deng, Y.; Chen, C.L.; Tang, X. Image Aesthetic Assessment: An Experimental Survey. IEEE Signal Process. Mag. 2017, 34, 80–106. [Google Scholar] [CrossRef] [Green Version]
  3. Zheng, B.; Zhang, J.; Sun, G.; Ren, X. EnGe-CSNet: A Trainable Image Compressed Sensing Model Based on Variational Encoder and Generative Networks. Electronics 2021, 10, 1089. [Google Scholar] [CrossRef]
  4. Zhang, Y.; Sun, L.; Yan, C.; Ji, X.; Dai, Q. Adaptive Residual Networks for High-Quality Image Restoration. IEEE Trans. Image Process. 2018, 27, 3150–3163. [Google Scholar] [CrossRef]
  5. Fan, R.; Li, X.; Lee, S.; Li, T.; Zhang, H.L. Smart Image Enhancement Using CLAHE Based on an F-Shift Transformation during Decompression. Electronics 2020, 9, 1374. [Google Scholar] [CrossRef]
  6. Wang, R.; Qin, Y.; Wang, Z.; Zheng, H. Group-Based Sparse Representation for Compressed Sensing Image Reconstruction with Joint Regularization. Electronics 2022, 11, 182. [Google Scholar] [CrossRef]
  7. Varga, D. Analysis of Benford’s Law for No-Reference Quality Assessment of Natural, Screen-Content, and Synthetic Images. Electronics 2021, 10, 2378. [Google Scholar] [CrossRef]
  8. Guha, T.; Hosu, V.; Saupe, D.; Goldlücke, B.; Kumar, N.; Lin, W.; Martinez, V.; Somandepalli, K.; Narayanan, S.; Cheng, W.H.; et al. ATQAM/MAST’20: Joint Workshop on Aesthetic and Technical Quality Assessment of Multimedia and Media Analytics for Societal Trends. In Proceedings of the ACM International Conference on Multimedia, Virtual Event, 12–16 October 2020; pp. 4758–4760. [Google Scholar] [CrossRef]
  9. Talebi, H.; Milanfar, P. NIMA: Neural Image Assessment. IEEE Trans. Image Process. 2018, 27, 3998–4011. [Google Scholar] [CrossRef] [Green Version]
  10. Ke, J.; Wang, Q.; Wang, Y.; Milanfar, P.; Yang, F. MUSIQ: Multi-scale Image Quality Transformer. In Proceedings of the IEEE/CVF International Conference on Computer Vision, Montreal, QC, Canada, 10–17 October 2021; pp. 5128–5137. [Google Scholar] [CrossRef]
  11. Murray, N.; Marchesotti, L.; Perronnin, F. AVA: A large-scale database for aesthetic visual analysis. In Proceedings of the IEEE Conference on Computer Vision and Pattern Recognition, Providence, RI, USA, 16–21 June 2012; pp. 2408–2415. [Google Scholar] [CrossRef]
  12. Zhang, L.; Zhang, L.; Mou, X.; Zhang, D. FSIM: A Feature Similarity Index for Image Quality Assessment. IEEE Trans. Image Process. 2011, 20, 2378–2386. [Google Scholar] [CrossRef] [Green Version]
  13. Mittal, A.; Moorthy, A.K.; Bovik, A.C. No-Reference Image Quality Assessment in the Spatial Domain. IEEE Trans. Image Process. 2012, 21, 4695–4708. [Google Scholar] [CrossRef]
  14. Tang, L.; Sun, K.; Huang, S.; Wang, G.; Jiang, K. Quality Assessment of View Synthesis Based on Visual Saliency and Texture Naturalness. Electronics 2022, 11, 1384. [Google Scholar] [CrossRef]
  15. Datta, R.; Joshi, D.; Li, J.; Wang, J.Z. Studying Aesthetics in Photographic Images Using a Computational Approach. In Proceedings of the European Conference on Computer Vision, Graz, Austria, 7–13 May 2006; pp. 288–301. [Google Scholar] [CrossRef]
  16. Ma, K.; Liu, W.; Zhang, K.; Duanmu, Z.; Wang, Z.; Zuo, W. End-to-End Blind Image Quality Assessment Using Deep Neural Networks. IEEE Trans. Image Process. 2018, 27, 1202–1213. [Google Scholar] [CrossRef] [PubMed]
  17. Wu, J.; Ma, J.; Liang, F.; Dong, W.; Shi, G.; Lin, W. End-to-End Blind Image Quality Prediction With Cascaded Deep Neural Network. IEEE Trans. Image Process. 2020, 29, 7414–7426. [Google Scholar] [CrossRef]
  18. Bosse, S.; Maniry, D.; Müller, K.R.; Wiegand, T.; Samek, W. Deep Neural Networks for No-Reference and Full-Reference Image Quality Assessment. IEEE Trans. Image Process. 2018, 27, 206–219. [Google Scholar] [CrossRef] [PubMed] [Green Version]
  19. Zhu, H.; Li, L.; Wu, J.; Dong, W.; Shi, G. MetaIQA: Deep Meta-Learning for No-Reference Image Quality Assessment. In Proceedings of the IEEE/CVF Conference on Computer Vision and Pattern Recognition, Seattle, WA, USA, 13–19 June 2020; pp. 14131–14140. [Google Scholar] [CrossRef]
  20. Guan, X.; Li, F.; He, L. Quality Assessment on Authentically Distorted Images by Expanding Proxy Labels. Electronics 2020, 9, 252. [Google Scholar] [CrossRef] [Green Version]
  21. Kong, S.; Shen, X.; Lin, Z.; Mech, R.; Fowlkes, C. Photo Aesthetics Ranking Network with Attributes and Content Adaptation. In Proceedings of the European Conference, Amsterdam, The Netherlands, 11–14 October 2016; pp. 662–679. [Google Scholar] [CrossRef] [Green Version]
  22. Zeng, H.; Cao, Z.; Zhang, L.; Bovik, A.C. A Unified Probabilistic Formulation of Image Aesthetic Assessment. IEEE Trans. Image Process. 2020, 29, 1548–1561. [Google Scholar] [CrossRef]
  23. Fang, Y.; Zhu, H.; Zeng, Y.; Ma, K.; Wang, Z. Perceptual Quality Assessment of Smartphone Photography. In Proceedings of the IEEE/CVF Conference on Computer Vision and Pattern Recognition, Seattle, WA, USA, 13–19 June 2020; pp. 3674–3683. [Google Scholar] [CrossRef]
  24. Hosu, V.; Goldlucke, B.; Saupe, D. Effective Aesthetics Prediction With Multi-Level Spatially Pooled Features. In Proceedings of the IEEE Conference on Computer Vision and Pattern Recognition, Long Beach, CA, USA, 16–20 June 2019; pp. 9375–9383. [Google Scholar] [CrossRef] [Green Version]
  25. Chen, Q.; Zhang, W.; Zhou, N.; Lei, P.; Xu, Y.; Zheng, Y.; Fan, J. Adaptive Fractional Dilated Convolution Network for Image Aesthetics Assessment. In Proceedings of the IEEE/CVF Conference on Computer Vision and Pattern Recognition, Seattle, WA, USA, 13–19 June 2020; pp. 14102–14111. [Google Scholar] [CrossRef]
  26. Liu, Z.; Lin, Y.; Cao, Y.; Hu, H.; Wei, Y.; Zhang, Z.; Lin, S.; Guo, B. Swin Transformer: Hierarchical Vision Transformer using Shifted Windows. In Proceedings of the IEEE/CVF International Conference on Computer Vision, Montreal, QC, Canada, 10–17 October 2021; pp. 9992–10002. [Google Scholar] [CrossRef]
  27. Hosu, V.; Lin, H.; Sziranyi, T.; Saupe, D. KonIQ-10k: An Ecologically Valid Database for Deep Learning of Blind Image Quality Assessment. IEEE Trans. Image Process. 2020, 29, 4041–4056. [Google Scholar] [CrossRef] [PubMed] [Green Version]
  28. Saad, M.A.; Bovik, A.C.; Charrier, C. Blind Image Quality Assessment: A Natural Scene Statistics Approach in the DCT Domain. IEEE Trans. Image Process. 2012, 21, 3339–3352. [Google Scholar] [CrossRef]
  29. Zhang, L.; Zhang, L.; Bovik, A.C. A Feature-Enriched Completely Blind Image Quality Evaluator. IEEE Trans. Image Process. 2015, 24, 2579–2591. [Google Scholar] [CrossRef] [Green Version]
  30. Ye, P.; Kumar, J.; Kang, L.; Doermann, D. Unsupervised feature learning framework for no-reference image quality assessment. In Proceedings of the IEEE Conference on Computer Vision and Pattern Recognition, Providence, RI, USA, 16–21 June 2012; pp. 1098–1105. [Google Scholar] [CrossRef] [Green Version]
  31. Xu, J.; Ye, P.; Li, Q.; Du, H.; Liu, Y.; Doermann, D. Blind Image Quality Assessment Based on High Order Statistics Aggregation. IEEE Trans. Image Process. 2016, 25, 4444–4457. [Google Scholar] [CrossRef]
  32. Kim, J.; Lee, S. Fully Deep Blind Image Quality Predictor. IEEE J. Sel. Topics Signal Process. 2017, 11, 206–220. [Google Scholar] [CrossRef]
  33. Kim, J.; Nguyen, A.D.; Lee, S. Deep CNN-Based Blind Image Quality Predictor. IEEE Trans. Neural Netw. Learn. Syst. 2019, 30, 11–24. [Google Scholar] [CrossRef] [PubMed]
  34. Lu, X.; Lin, Z.; Jin, H.; Yang, J.; Wang, J.Z. RAPID: Rating Pictorial Aesthetics using Deep Learning. In Proceedings of the ACM International Conference on Multimedia, Orlando, FL, USA, 3–7 November 2014; pp. 457–466. [Google Scholar] [CrossRef]
  35. She, D.; Lai, Y.K.; Yi, G.; Xu, K. Hierarchical Layout-Aware Graph Convolutional Network for Unified Aesthetics Assessment. In Proceedings of the IEEE Conference on Computer Vision and Pattern Recognition, Virtual, 19–25 June 2021; pp. 8471–8480. [Google Scholar] [CrossRef]
  36. Zhu, H.; Zhou, Y.; Yao, R.; Wang, G.; Yang, Y. Learning image aesthetic subjectivity from attribute-aware relational reasoning network. Pattern Recogn. Lett. 2022, 155, 84–91. [Google Scholar] [CrossRef]
  37. Zhang, W.; Ma, K.; Yan, J.; Deng, D.; Wang, Z. Blind Image Quality Assessment Using a Deep Bilinear Convolutional Neural Network. IEEE Trans. Circuits Syst. Video Technol. 2020, 30, 36–47. [Google Scholar] [CrossRef] [Green Version]
  38. Li, L.; Zhu, H.; Zhao, S.; Ding, G.; Lin, W. Personality-Assisted Multi-Task Learning for Generic and Personalized Image Aesthetics Assessment. IEEE Trans. Image Process. 2020, 29, 3898–3910. [Google Scholar] [CrossRef]
  39. Ma, S.; Liu, J.; Chen, C.W. A-Lamp: Adaptive Layout-Aware Multi-patch Deep Convolutional Neural Network for Photo Aesthetic Assessment. In Proceedings of the IEEE Conference on Computer Vision and Pattern Recognition, Honolulu, HI, USA, 21–26 July 2017; pp. 722–731. [Google Scholar] [CrossRef] [Green Version]
  40. Su, S.; Yan, Q.; Zhu, Y.; Zhang, C.; Ge, X.; Sun, J.; Zhang, Y. Blindly Assess Image Quality in the Wild Guided by a Self-Adaptive Hyper Network. In Proceedings of the IEEE/CVF Conference on Computer Vision and Pattern Recognition, Seattle, WA, USA, 13–19 June 2020; pp. 3664–3673. [Google Scholar] [CrossRef]
  41. Zhu, H.; Li, L.; Wu, J.; Dong, W.; Shi, G. Generalizable No-Reference Image Quality Assessment via Deep Meta-Learning. IEEE Trans. Circuits Syst. Video Technol. 2022, 32, 1048–1060. [Google Scholar] [CrossRef]
  42. Vaswani, A.; Shazeer, N.; Parmar, N.; Uszkoreit, J.; Jones, L.; Gomez, A.N.; Kaiser, L.u.; Polosukhin, I. Attention is All you Need. In Proceedings of the Advances in Neural Information Processing Systems, Long Beach, CA, USA, 4–9 December 2017; pp. 5998–6008. [Google Scholar]
  43. Yang, Z.; Dai, Z.; Yang, Y.; Carbonell, J.; Salakhutdinov, R.R.; Le, Q.V. XLNet: Generalized Autoregressive Pretraining for Language Understanding. In Proceedings of the Advances in Neural Information Processing Systems, Vancouver, BC, Canada, 8–14 December 2019; pp. 5754–5764. [Google Scholar]
  44. Dosovitskiy, A.; Beyer, L.; Kolesnikov, A.; Weissenborn, D.; Zhai, X.; Unterthiner, T.; Dehghani, M.; Minderer, M.; Heigold, G.; Gelly, S.; et al. An Image is Worth 16×16 Words: Transformers for Image Recognition at Scale. In Proceedings of the 9th International Conference on Learning Representations, Virtual, Austria, 3–7 May 2021. [Google Scholar]
  45. Krizhevsky, A.; Sutskever, I.; Hinton, G.E. ImageNet Classification with Deep Convolutional Neural Networks. Commun. ACM 2017, 60, 84–90. [Google Scholar] [CrossRef]
  46. Ghadiyaram, D.; Bovik, A.C. Massive Online Crowdsourced Study of Subjective and Objective Picture Quality. IEEE Trans. Image Process. 2016, 25, 372–387. [Google Scholar] [CrossRef] [Green Version]
  47. You, J.; Korhonen, J. Transformer For Image Quality Assessment. In Proceedings of the IEEE International Conference on Image Processing, Anchorage, AK, USA, 19–22 September 2021; pp. 1389–1393. [Google Scholar] [CrossRef]
Figure 1. Two original images with annotated scores (MOS or average score) as well as the corresponding images warped to a fixed size. (a) An example image from a TQA database [23]. (b) An example image from an AQA database [11].
Electronics 11 02132 g001
Figure 2. The overview framework of the proposed IQA method, which is based on a typical Swin Transformer model. First, the warped image with a fixed size is split into nonoverlapping patches and the patches and original aspect ratios are embedded into the Transformer blocks. Then, we propose an aspect-ratio-preserving (shifted) window-based multihead self-attention ((S)W-MSA) in each ratio-embedded Transformer block. Finally, the perceptual quality of images can be jointly inferred by combining the multistage Transformer blocks through a prediction head.
Electronics 11 02132 g002
Figure 3. The efficacy of hyperparameter α in our model (ARET-IQA (224) and ARET-IQA (384)) on the SPAQ [27] and AVA [11] databases.
Electronics 11 02132 g003
Figure 4. Example results of the proposed ARET-IQA (384) and the baseline model on the SPAQ [27] and AVA [11] databases. The predicted quality scores (MOS or distribution) of the baseline and our ARET-IQA as well as the corresponding ground truth (GT) are shown below each image. In the AVA database, we also show the average scores of aesthetic distribution.
Electronics 11 02132 g004
Figure 5. Two failure examples of the proposed ARET-IQA (384) and the baseline model on the SPAQ [27] and AVA [11] databases. The predicted quality scores (MOS or distribution) of the baseline and our ARET-IQA as well as the corresponding ground truth (GT) are shown below each image. In the AVA database, we also show the average scores of aesthetic distribution.
Electronics 11 02132 g005
Table 1. Comparison results (PLCC and SRCC) of the proposed method with several state-of-the-art IQA methods on the LIVE challenge [46] and KonIQ-10k [27] databases, where “-” indicates unreported results. In our ARET-IQA model, the input images were resized to two default resolutions for the Transformer network: 224 × 224 (ARET-IQA (224)) and 384 × 384 (ARET-IQA (384)).
MethodsLIVE ChallengeKonIQ-10k
PLCC ↑SRCC ↑PLCC ↑SRCC ↑
BLIINDS-II [28]0.5070.4630.6150.529
BRISQUE [13]0.6450.6070.6810.665
ILNIQE [29]0.5080.4320.5370.501
CORNIA [30]0.6620.6180.7950.780
HOSA [31]0.6780.6590.8130.805
BIECON [32]0.6130.5950.6510.618
WaDIQaM-NR [18]0.6800.6710.7610.739
DB-CNN [37]0.8690.8510.8690.856
MetaIQA [19]0.8350.8020.8870.850
HyperNet [40]0.8820.8590.9170.906
MetaIQA+ [41]0.8720.8520.9210.909
MUSIQ [10]--0.9260.918
TRIQ [47]0.8260.8120.9250.907
ARET-IQA (224)0.8910.8740.9370.925
ARET-IQA (384)0.8990.8820.9450.932
Table 2. Comparison results (PLCC and SRCC) of the proposed method with several state-of-the-art IQA methods on the SPAQ database [27], where the best results for each database are shown in bold. In our ARET-IQA model, the input images were resized to two default resolutions for the Transformer network: 224 × 224 (ARET-IQA (224)) and 384 × 384 (ARET-IQA (384)).
MethodsPLCC ↑SRCC ↑
BRISQUE [13]0.8170.809
ILNIQE [29]0.7210.713
CORNIA [30]0.7250.709
HOSA [31]0.8730.866
DB-CNN [37]0.9150.911
MetaIQA [19]0.8710.870
HyperNet [40]0.9140.909
Baseline (Fang et al.) [41]0.9090.908
MUSIQ [10]0.9210.917
TRIQ [47]0.8480.857
ARET-IQA (224)0.9250.919
ARET-IQA (384)0.9320.924
Table 3. Performance comparison with several representative IQA methods on the AVA database [11]. The best results are highlighted in bold font and “-” denotes unreported results. In our ARET-IQA model, the input images were resized to two default resolutions for the Transformer network: 224 × 224 (ARET-IQA (224)) and 384 × 384 (ARET-IQA (384)).
MethodsBinary ClassificationScore RegressionDistribution Prediction
ACC (%)↑PLCC ↑SRCC ↑EMD ↓
Murray et al. [11]68.0---
RAPID [34]74.5---
A-Lamp [39]82.5---
Kong et al. [21]77.3-0.558-
NIMA [9]81.50.6360.6120.050
PA_IAA [38]83.70.6780.6770.047
Zeng et al. [22]80.80.7200.7190.0650
AFDC [25]83.00.6710.6490.045
MUSIQ [10]81.50.7380.726-
HLA-GCN [35]84.60.6870.6650.043
Zhu et al. [36]85.10.7020.6830.041
ARET-IQA (224)82.90.7290.7180.043
ARET-IQA (384)83.60.7440.7310.040
Table 4. Ablation study results (SRCC and PLCC) of the proposed ARET-IQA (384) on the SPAQ [27] and AVA [11] databases, where the best results on each database are highlighted in bold font.
ModelsSPAQAVA
PLCC ↑SRCC ↑PLCC ↑SRCC ↑
Baseline0.9100.9060.7250.712
ARET-IQA w/o ratio0.9190.9140.7330.719
ARET-IQA w/o multi0.9270.9210.7410.726
ARET-IQA0.9320.9240.7440.731
Publisher’s Note: MDPI stays neutral with regard to jurisdictional claims in published maps and institutional affiliations.

