Article

Classification of Left and Right Coronary Arteries in Coronary Angiographies Using Deep Learning

by
Christian Kim Eschen
1,*,
Karina Banasik
1,
Alex Hørby Christensen
2,3,
Piotr Jaroslaw Chmura
1,
Frants Pedersen
2,3,
Lars Køber
2,3,
Thomas Engstrøm
2,3,
Anders Bjorholm Dahl
4,
Søren Brunak
1 and
Henning Bundgaard
2,3
1
Novo Nordisk Foundation Center for Protein Research, Faculty of Health and Medical Sciences, University of Copenhagen, 2100 Copenhagen, Denmark
2
Rigshospitalet, The Heart Center, Department of Cardiology, Faculty of Health and Medical Sciences, University of Copenhagen, 2100 Copenhagen, Denmark
3
Department of Clinical Medicine, Faculty of Health and Medical Sciences, University of Copenhagen, 2100 Copenhagen, Denmark
4
Department of Applied Mathematics and Computer Science Visual Computing, Technical University of Denmark, 2800 Lyngby, Denmark
*
Author to whom correspondence should be addressed.
Electronics 2022, 11(13), 2087; https://doi.org/10.3390/electronics11132087
Submission received: 1 June 2022 / Revised: 24 June 2022 / Accepted: 1 July 2022 / Published: 3 July 2022
(This article belongs to the Special Issue Deep Learning for Medical Images: Challenges and Solutions)

Abstract

:
Multi-frame X-ray images (videos) of the coronary arteries obtained using coronary angiography (CAG) provide detailed information about the anatomy and blood flow in the coronary arteries and play a pivotal role in diagnosing and treating ischemic heart disease. Deep learning has the potential to quickly and accurately quantify narrowings and blockages of the arteries from CAG videos. A CAG consists of videos acquired separately for the left coronary artery and the right coronary artery (LCA and RCA, respectively). The pathology for LCA and RCA is typically only reported for the entire CAG, and not for the individual videos. However, training of stenosis quantification models is difficult when the RCA and LCA information of the videos are unknown. Here, we present a deep learning-based approach for classifying LCA and RCA in CAG videos. Our approach enables linkage of videos with the reported pathological findings. We manually labeled 3545 and 520 videos (approximately seven videos per CAG) to enable training and testing of the models, respectively. We obtained F1 scores of 0.99 on the test set for LCA and RCA classification LCA and RCA classification on the test set. The classification performance was further investigated with extensive experiments across different model architectures (R(2+1)D, X3D, and MVIT), model input sizes, data augmentations, and the number of videos used for training. Our results showed that CAG videos could be accurately curated using deep learning, which is an essential preprocessing step for a downstream application in diagnostics of coronary artery disease.

1. Introduction

Coronary angiography (CAG) is considered the gold standard for diagnosing ischemic heart disease (IHD) [1,2,3]. During the CAG procedure, a catheter inserted percutaneously via the femoral or radial arteries is used to inject an iodinated contrast agent into the coronary arteries. The catheter is inserted separately into the left coronary artery (LCA) and the right coronary artery (RCA). Recordings during and just after injection of contrast provide detailed information about the anatomy and the blood flow in the coronary arteries. The examination consists of multiple X-ray multi-frame CAG images (videos) taken from different angles. For a routine examination, approximately seven videos are recorded. Typically, CAG videos are visually assessed to determine if the arterial lumen is narrowed (stenosis) and how severe it is (percentage). However, the initial assessment is done by “eyeballing” the degree of stenosis, which is subjective and has high observer variance [4,5,6,7,8].
Accurate and quantitative analysis of the CAG videos may alleviate an invasive procedure to measure the Fractional Flow Reserve (FFR) by a pressure wire directly to determine the severity of the stenosis [9]. Current CAG guidelines [9] suggest the FFR is measured in case of borderline stenosis (40–90% narrowing assessed by eyeballing) to confirm its significance. FFR is determined by measuring the reduction in blood pressure across the stenosis. The pressure reduction is linearly correlated to flow during maximal hyperemia. Rather than performing invasive procedures with the risk of complications, it would be a major advantage to obtain this information about coronary artery disease from the CAG videos to improve clinical decisions for the individual patient.
Pathological findings (a.k.a. stenosis, narrowings, or lesions) are routinely reported after a CAG, and millions of these lesions have been identified in previous examinations. Training and validation of a deep learning model for stenosis assessment based on visual assessment or FFR measurement from large-scale datasets from previously performed examinations would potentially yield a more robust and objective assessment. The pathological findings in these datasets, including visual assessment of stenosis, are typically reported using the 16-segment classification system [10,11]. The 16-segment classification system divides the coronary artery tree into 16 sites originating from both LCA and RCA. The LCA is divided into Left Main (LM), Left Circumflex Artery (LCX), First Diagonal (D1), Second Diagonal (D2), Left Anterior Descending Artery (LAD), and The Marginal Branches (M1 and M2). Similarly, the RCA contains the segments; Posterior Descending Artery (PDA), and Posterior Left Ventricular Artery (PLA). The PDA and the PLA originate from the RCA in 80% of the population (right dominant), and for 10% the PDA and PLA originate from the LCA (left dominant). For the last 10%, the PDA and the PLA originate from both the LCA and the RCA (co-dominant). The type of coronary artery dominance is also reported during CAG [12]. The databases storing these reported pathological findings have limited relation to the Picture Archiving and Communication system (PACS), which stores the CAG video files.
Typically, there is no way to extract the specific key videos in a CAG that were used to identify the reported pathology. Reported pathology such as “stenosis eyeball 70% on proximal RCA” will only be present in a video of the RCA, and vice versa for pathology concerning the LCA. Unfortunately, the content of the specific video (e.g., information about the presence of the LCA or RCA) is not stored in the Digital Imaging and Communications in Medicine (DICOM) metadata. As each CAG consists of both videos from LCA and RCA, and as the reported pathological findings only relate to the entire CAG, it is often impossible to link the videos and the reported pathology. Hence, directly linking the videos with pathological findings, e.g., “stenosis eyeball 70% on proximal RCA”, is not possible. The reported pathology is thus not directly suited for training a deep learning model. Nevertheless, no information exists describing which videos contain LCA or RCA. Due to the lack of information, CAG image analysis workflows would often require extensive data curation. Linking the pathology to the specific video containing the pathology would enable training of stenosis quantification deep learning models with millions of videos from existing examinations.
In recent years, there has been increased attention on applying deep learning to CAGs. For instance, studies have explored the application of deep learning for vessel segmentation and stenosis identification on single frame images in 2D. In recent publications, segmentation of the main branches in the coronary artery tree and quantifying the degree of stenosis have been attempted [13,14,15,16,17]. Automatic detection of a stenosis on RCA was investigated by Moon et al. [18] using a combined model pipeline, in which a keyframe extraction model predicted the relevant frame followed by another model predicting stenosis. Classification of LCA and RCA has been attempted by Avram et al. [17], reporting a F1 score of 0.93 on contrast-containing single frames. As these previous studies only utilized 2D information [13,14,15,16,17,18], a relevant frame extraction phase is needed for deploying the model into the real world. For training these models, extensive frame-level annotations are needed.
To build robust and quantitative assessment of CAG videos using deep learning, there is a need to link the videos with databases containing reported lesions. This can be done by classifying CAG videos into meaningful categories. In this paper, we present a framework for classifying CAG videos into LCA and RCA using deep learning (see Figure 1). The objective is to present an end-to-end CAG video classification framework, explore the performance of different state-of-the-art architectures for video classification, investigate different data augmentations, and finally, examine the number of labeled CAG videos needed for LCA and RCA classification. For simplicity, the data used in this paper is limited to patients without significant stenoses.

2. Materials and Methods

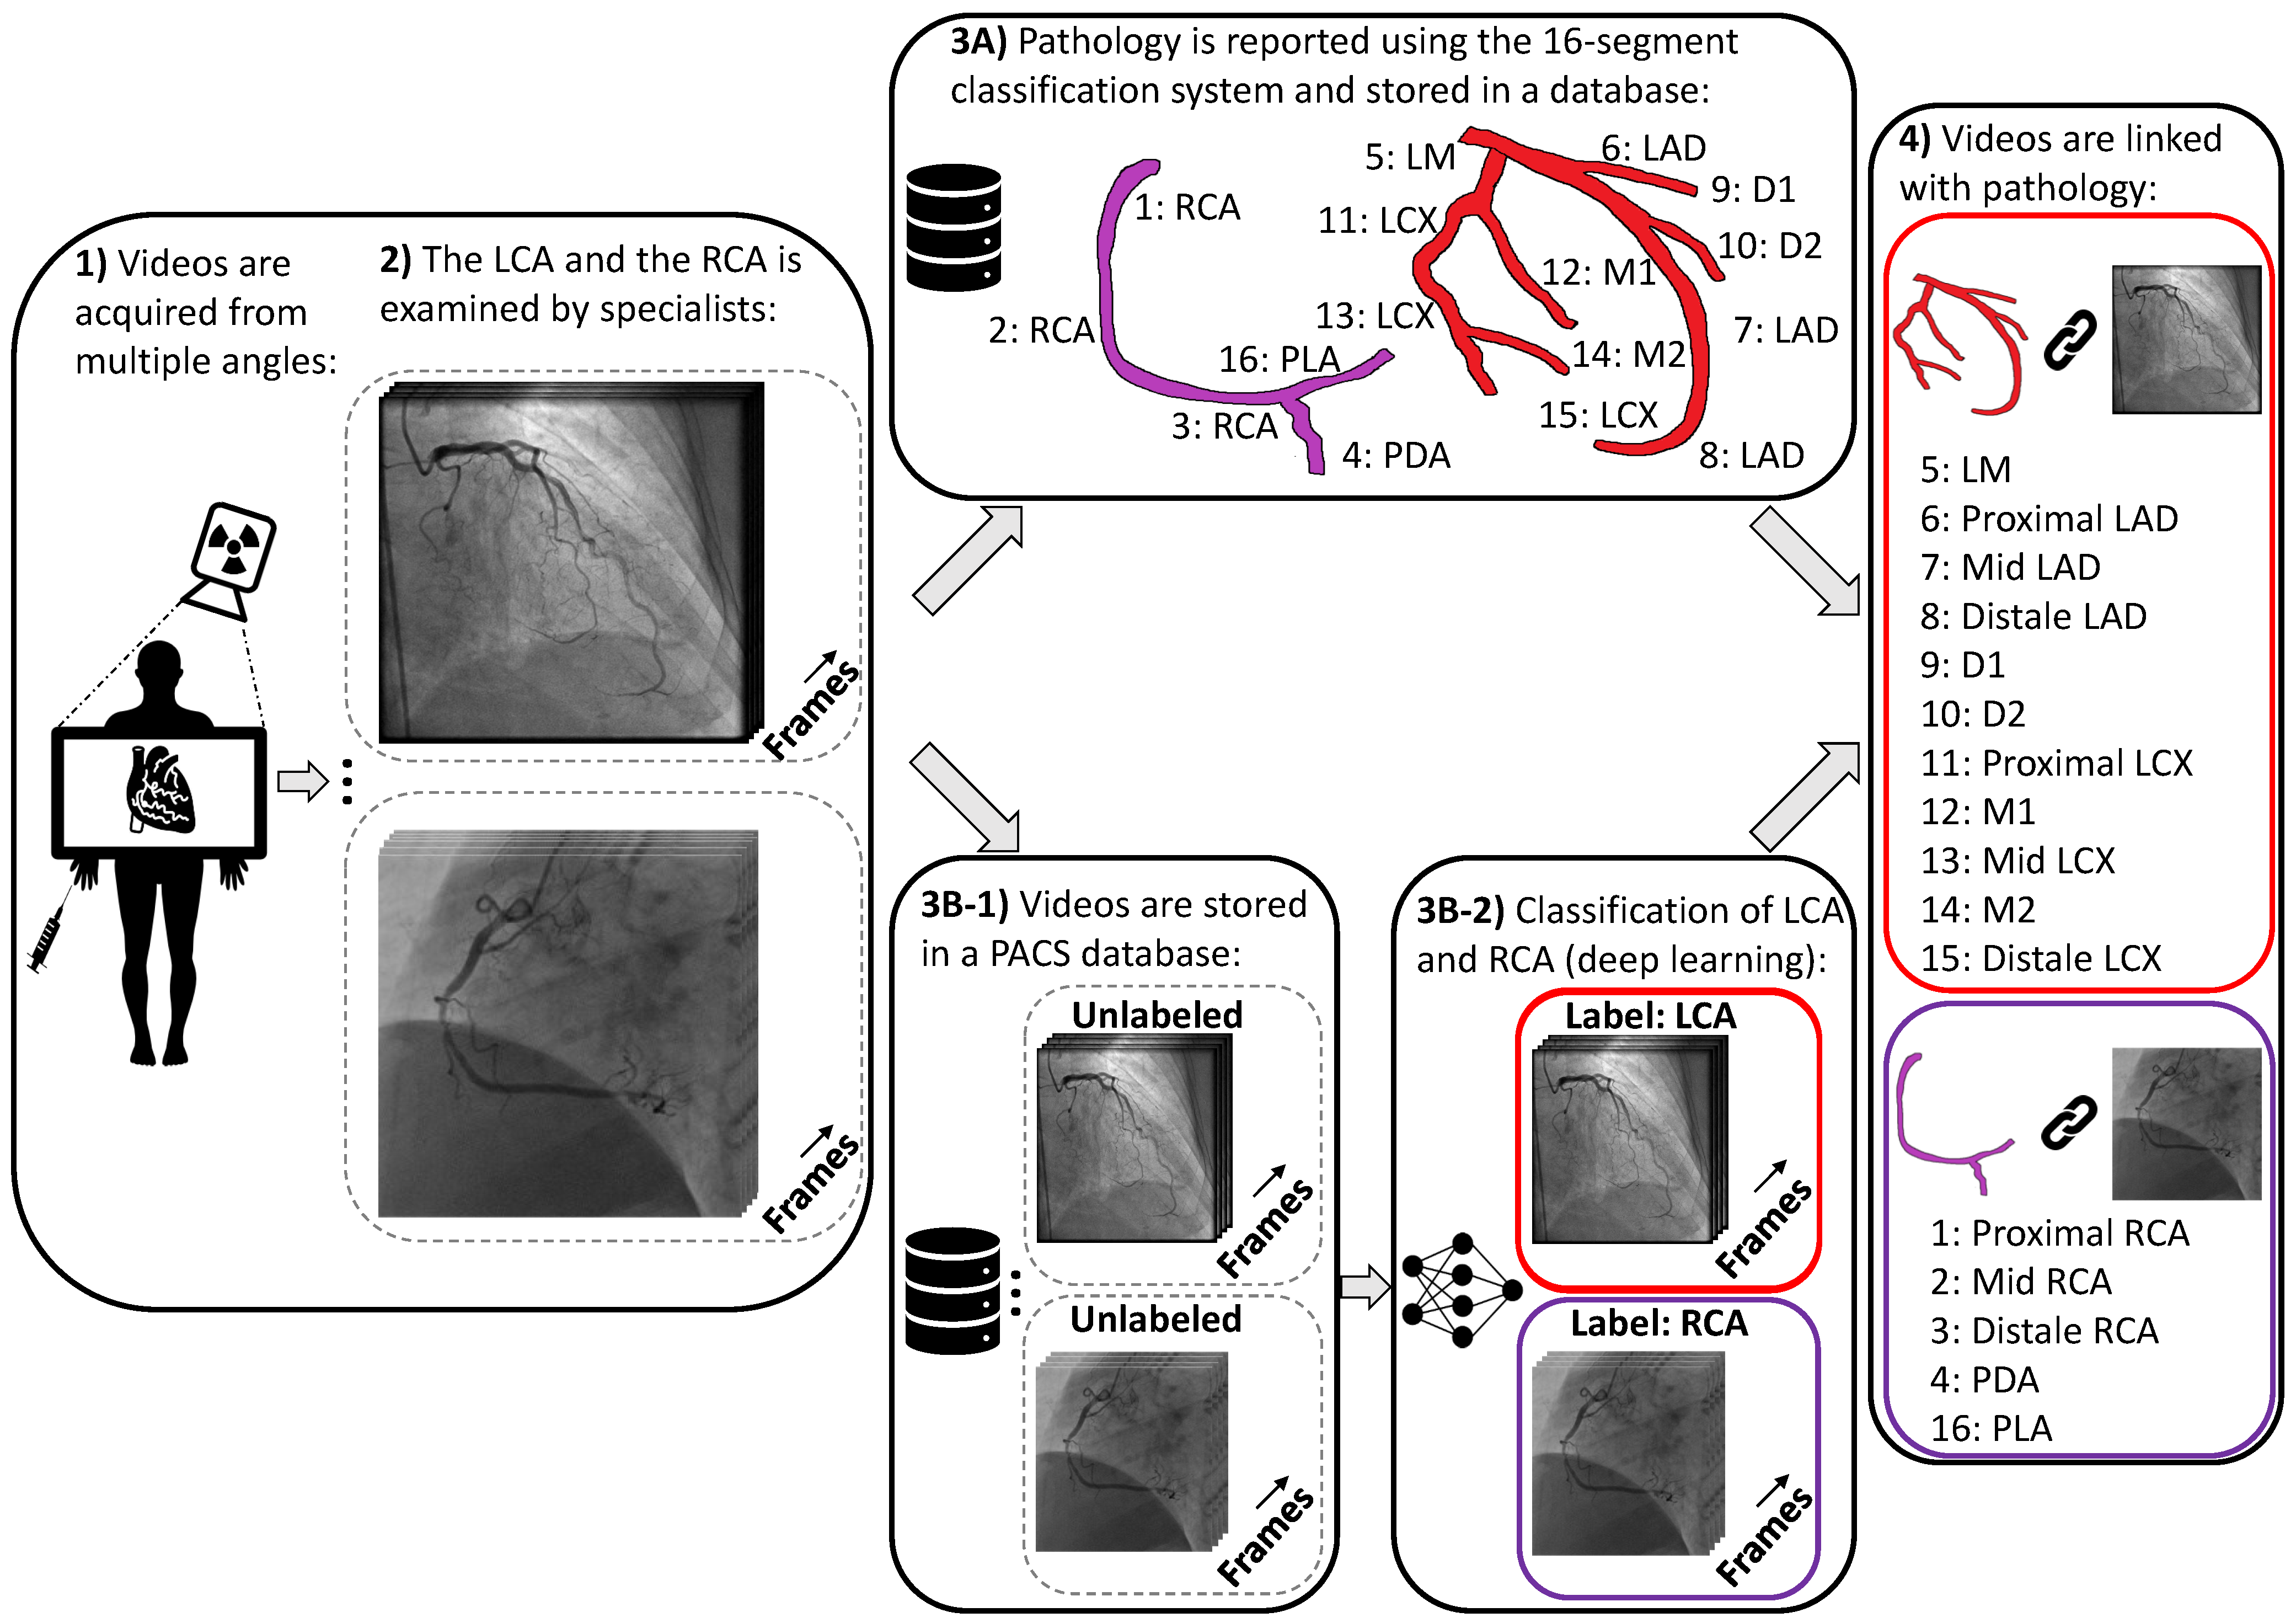
2.1. Data Collection and Data Curation

CAG multi-frame videos were selected, anonymized, and extracted. The videos are acquired at Rigshospitalet, Copenhagen, Denmark. To simplify the labelling process, we included patients without any significant stenoses, i.e., patients clinically categorized with “no vessel abnormalities” or “atheromatous coronary arteries without significant stenoses”. In addition, we excluded patients with any inserted cardiac devices. Based on these criteria, we randomly selected and manually annotated 3545 CAG videos with the categorical value “Left Coronary Artery” and “Right Coronary Artery” originating from 530 patients. These videos were split into 80% for training and 20% for validation grouped by the patients’ anonymized unique identification ID. We also collected a test set of 520 CAG videos originating from 78 patients, which was not used for model development, and only served as a tool for reporting unbiased performance measures. In both the training and the test data sets, the ratios of manually annotated LCA and RCA were 67% and 33%, respectively, and the average number of videos pr CAG was 6.7 pr patient. The videos originated from Philips and Siemens scanners, and 52% of the videos were obtained from males.

2.2. Methods

CAG videos consist of sequential sets of images giving 3D volumes, so we experimented with 3D deep learning models. We explored supervised video classification frameworks based on convolutional neural networks (CNNs) and visual transformers, which take a video as input and use the LCA and RCA annotations as targets. We have chosen three model architectures for our experiments; R(2+1)D [19], X3D [20], and MVIT [21], which previously have shown state-of-the-art results on natural video classification tasks such as the Kinetics [22] and Ava [23]. The R(2+1)D and the X3D utilizes 3D CNNs, and the MVIT is a transformer-based architecture (see Table 1).

2.2.1. Baseline

The X-ray acquisition device is usually set in a specific configuration to record LCA and RCA. We wanted to test if using scanner parameters were sufficient to classify the recordings into LCA and RCA. The scanner parameters stored in the metadata in the DICOM files include the Positioner Primary Angle, the Positioner Secondary Angle, Distance From Source to Detector, and Distance From Detector to Patient. Based on this information, we implemented a logistic regression model, a support vector machine model (SVM), and two multi-layer perceptron (MLP) models, each with one hidden layer. For the SVM we use radial basis function as kernel. The size of the hidden layers in the two MLP models was 50 and 500, respectively, and we used the ReLU activation function.

2.2.2. R(2+1)D

R(2+1)D [19] is a video-classification model based on 3D CNNs. Tran et al. [19] investigated the performance difference between 2D and 3D CNNs on video classification using ResNet [24] architectures. Based on extensive experiments, Tran et al. showed a significant performance increase using 3D CNNs. Another contribution from Tran et al. was the invention of the “R(2+1)D” block, in which the standard 3D convolutional block with convolutions of size (3 × 3 × 3) is replaced with a block containing spatial convolutions of size (3 × 3 × 1), ReLU, Batch Normalization [25] and a temporal convolutional (1 × 1 × 3). Using this approach, spatial features and temporal features are decoupled. Based on the ”R(2+1)D” block, Tran et al. built a novel model architecture, and they showed that this model could easily outperform standard 3D CNNs with ResNet architectures and achieve state-of-the-art performance. For our experiments, we utilized the R(2+1)D-18 model architecture with 18 layers and with 33.3 million parameters.

2.2.3. X3D

X3D [20] is a family of convolutional neural networks used for video classification. In X3D all convolutional building blocks consist of channel-wise separable convolutions inspired by MobileNets [26] for reduced computational complexity. In relation to R(2+1)D [19], the number of parameters and computations can be reduced by a factor of 10 while maintaining the same performance. Using these settings, Feichtenhofer [20] empirically estimated optimal model architectures for video classification concerning spatial and temporal input sizes, model width, and model depth. One of the most interesting findings is that relative light models with small width and few parameters can perform well with somewhat high spatial and temporal input sizes. We utilized the X3D-s model variant with 3.76 million parameters for our experiments.

2.2.4. MVIT

MVIT [21] is a transformer-based model used for video classifcation. The MVIT is a multiscale version of the Vision Transformer [27]. The model splits and unrolls the input into a sequence of patches. This sequence is combined with positional embedding, giving information about the spatial location in the input sequence. The information in the sequence is passed to a transformer encoder, which consists of multiheaded attention blocks. The MVIT uses attention pooling to learn feature representations at different scales. The MVIT learns features from high resolution with few feature channels to low input resolutions with a high number of feature channels. We experimented with the MVIT-32-3 and MVIT-16-4 model variants for inputs with 32 frames and 16 frames, respectively. Both models have 36.6 million parameters.

2.2.5. Preprocessing and Data Augmentations

The videos were initially resized to a fixed spatial resolution, e.g., 224 × 224 pixels. Since the videos have varying numbers of frames, the input volumes were generated by randomly sampling a fixed temporal length of 32. This gives an effective fixed 3D input volume of size 224 × 224 × 32. If the number of frames for a given input was smaller than the fixed temporal size, the input was zero-padded. We tested the effect of random rotations, random translation, and random spatial and temporal scaling. We also tested the effect of combining all these augmentations. In the random rotation experiments, we randomly rotated the input from 0 to 15 degrees in the spatial plane (the coronal plane). To mitigate collimator effects, which limit the maximum field of view size, we experimented with a random translation of the inputs with 50 pixels in the spatial domain with zero-padding. Scaling is randomly applied in the spatial domain with the factors 0.5–1.5 and with linear interpolation. To simulate different temporal resolutions, we randomly resampled temporally by factors of 0.5–1.5 using nearest-neighbor interpolation. Each 3D input volume was normalized similarly to the previous procedures in [19,20,21].

2.2.6. Implementation Details

We trained all models on 8X A100 GPUs in a distributed setting with a batch size of 8 videos per GPU. We used the linear scaling rule [28], giving an effective learning rate of 0.01. We defined an epoch as an iteration of 128 samples, and we trained the model for 400 epochs. After each epoch, we replaced 1% of the 128 samples with samples from the global training data pool. By limiting the number of samples in each epoch to 128, all deterministic transforms were caught on the GPU, overcoming any IO and CPU bottlenecks, and utilizing all GPU resources. The learning rate was reduced by a factor of 10 after 200 epochs. The total training time for the entire dataset was approximately 1 h for all models. The inference was carried out by randomly sampling 10 inputs using the previously described preprocessing in Section 2.2.5 with resizing and random cropping in the temporal domain. The final prediction was calculated as an ensemble of the probabilities for the 10 samples.

3. Results

3.1. Performance Using Meta Data

We evaluated the predictive performance of the scanner parameters stored in the meta data on the LCA and RCA classification. On the test set, we obtained a F1 score for the logistic regression classifier and F1 scores of the two MLPs at the test set of 0.75, 0.88, and 0.89, respectively (see Table 2). As seen in Table 2, the performance differences between the MLPs and the logistic regression is large.

3.2. Model and Input Size Comparison

Table 3 shows the classification performance reported using the F1 score for different model architectures, different model input sizes, and different data augmentation techniques. As the MVIT-32-3 and MVIT-16-4 model variants require specific input sizes, it was not possible to get results for spatial input sizes with 130 × 130 pixels. All models were trained with pretrained weights from Kinetics. Notably, all results presented in Table 3 have high F1 scores (F1 0.99), indicating that the LCA and RCA classification performance did not depend on the input size, data augmentations or model architecture choice.

3.3. Effect of Data Size

To show the performance achieved with different dataset sizes, we evaluated the performance with various sample sizes. As seen in Figure 2, high F1 scores can be achieved with few samples. For instance, approximately 1500 samples gave an F1 score of 0.99 using all three models. In general, we see a performance increase for all models using pretrained weights. We also noticed that the performance of MVIT-B-32-3 experiments without pretrained weights did not exceed F1 scores greater than 0.90, indicating that pretraining was necessary to obtain a satisfactory performance. This was not the case for R(2+1)D-18 and X3D-S (F1 > 0.95) when training with more than 1500 samples. Interestingly, data augmentation did not improve performance much despite increasing the number of training samples.

4. Discussion and Conclusions

We evaluated the LCA and RCA classification performance for different model architectures and settings, and for all the settings and models, the F1 scores were approximately 0.99. The baseline assessment using the information stored in the meta-data confirmed that there exists no simple way to classify the CAG videos into LCA and RCA with high F1 score (F1 = 0.89), without using the videos as input. The high test F1 scores showed that the model generalized well, and that the binary LCA and RCA classification problem was solved for patients without lesions. Experiments showed that the classification problem could be solved with various model architectures. Additionally, we showed that we only needed approximately 1500 samples to obtain an F1 score of 0.99, and we showed that this was the case for all three models (X3D-s, R(2+1)D-18 and MVI-B32x3). The only nonrobust setting was the MVIT model without pretraining, resulting in high fluctuations and low F1 scores. This can be explained by Vision Transformer models require more data than CNN models. Thus, pretraining might be crucial for good performance, which has also been reported by Dosovitskiy et al. [27].
For simplicity, we annotated videos from patients without any significant coronary artery lesions, limiting the generalizability to other pathologies. Additionally, we excluded cases where neither the LCA nor the RCA is present due to, e.g., proximal occlusions. In future work, CAG videos of patients with lesions and videos with neither LCA nor RCA present, will be considered. We were not able to investigate the performance of an external independent test set, and future work will examine how well the system performs on data from a independent another hospital. These findings may prove useful for preprocessing for other downstream research questions using deep learning in CAGs. In conclusion, the classification of LCA and RCA on CAG using deep learning presented in this paper showed promising results with high F1-scores of 0.99 for various model architectures and settings.

Author Contributions

Conceptualization, C.K.E., K.B., A.B.D., A.H.C., S.B. and H.B.; methodology, C.K.E., A.B.D. and S.B.; software, C.K.E.; validation, C.K.E.; formal analysis, C.K.E.; investigation, C.K.E.; resources, F.P., L.K., T.E., P.J.C., S.B. and H.B.; data curation, C.K.E. and P.J.C.; writing—original draft preparation, C.K.E., K.B., A.H.C., F.P., L.K., T.E., A.B.D., S.B. and H.B.; writing—review and editing, C.K.E., K.B., A.H.C., P.J.C., F.P., L.K., T.E., A.B.D., S.B. and H.B.; visualization, C.K.E.; supervision, K.B., A.B.D., A.H.C., S.B. and H.B.; project administration, C.K.E., S.B. and H.B.; funding acquisition, S.B. and H.B. All authors have read and agreed to the published version of the manuscript.

Funding

This work was supported by Novo Nordisk Foundation (grants NNF17OC0027594 and NNF14CC0001) and the Danish Innovation Found (5184-00102B) project.

Institutional Review Board Statement

Data access was approved by National Committee on Health Research Ethics (1708829 “Genetics of cardiovascular disease”, ID P-2019-93), and by the Danish Patient Safety Authority (3-3013-1731-1, appendix 31-1522-23).

Informed Consent Statement

Patient consent was waived due to exempt granted by the National Committee on Health Research Ethics.

Data Availability Statement

Data is available on reasonable request. Danish legislation needs to be followed.

Conflicts of Interest

The authors declare no conflict of interest.

References

  1. Shah, N.S.; Molsberry, R.; Rana, J.S.; Sidney, S.; Capewell, S.; O’Flaherty, M.; Carnethon, M.; Lloyd-Jones, D.M.; Khan, S.S. Heterogeneous trends in burden of heart disease mortality by subtypes in the United States, 1999–2018: Observational analysis of vital statistics. BMJ 2020, 370, m2688. [Google Scholar] [CrossRef] [PubMed]
  2. Mozaffarian, D.; Benjamin, E.J.; Go, A.S.; Arnett, D.K.; Blaha, M.J.; Cushman, M.; De Ferranti, S.; Després, J.P.; Fullerton, H.J.; Howard, V.J.; et al. Heart disease and stroke statistics—2015 update: A report from the American Heart Association. Circulation 2015, 131, e29–e322. [Google Scholar] [CrossRef] [PubMed] [Green Version]
  3. McDonagh, T.A.; Metra, M.; Adamo, M.; Gardner, R.S.; Baumbach, A.; Böhm, M.; Burri, H.; Butler, J.; Čelutkienė, J.; Chioncel, O.; et al. 2021 ESC Guidelines for the diagnosis and treatment of acute and chronic heart failure: Developed by the Task Force for the diagnosis and treatment of acute and chronic heart failure of the European Society of Cardiology (ESC) With the special contribution of the Heart Failure Association (HFA) of the ESC. Eur. Heart J. 2021, 42, 3599–3726. [Google Scholar] [PubMed]
  4. Leape, L.L.; Park, R.E.; Bashore, T.M.; Harrison, J.K.; Davidson, C.J.; Brook, R.H. Effect of variability in the interpretation of coronary angiograms on the appropriateness of use of coronary revascularization procedures. Am. Heart J. 2000, 139, 106–113. [Google Scholar] [CrossRef]
  5. Zir, L.M.; Miller, S.W.; Dinsmore, R.E.; Gilbert, J.; Harthorne, J. Interobserver variability in coronary angiography. Circulation 1976, 53, 627–632. [Google Scholar] [CrossRef] [PubMed]
  6. Marcus, M.L.; Skorton, D.J.; Johnson, M.R.; Collins, S.M.; Harrison, D.G.; Kerber, R.E. Visual estimates of percent diameter coronary stenosis: “A battered gold standard”. J. Am. Coll. Cardiol. 1988, 11, 882–885. [Google Scholar] [CrossRef] [Green Version]
  7. Raphael, M.; Donaldson, R. A “significant” stenosis: Thirty years on. Lancet 1989, 333, 207–209. [Google Scholar] [CrossRef]
  8. Grundeken, M.J.; Ishibashi, Y.; Genereux, P.; LaSalle, L.; Iqbal, J.; Wykrzykowska, J.J.; Morel, M.A.; Tijssen, J.G.; De Winter, R.J.; Girasis, C.; et al. Inter–Core Lab Variability in Analyzing Quantitative Coronary Angiography for Bifurcation Lesions: A Post-Hoc Analysis of a Randomized Trial. JACC Cardiovasc. Interv. 2015, 8, 305–314. [Google Scholar] [CrossRef] [PubMed] [Green Version]
  9. Neumann, F.J.; Sousa-Uva, M.; Ahlsson, A.; Alfonso, F.; Banning, A.P.; Benedetto, U.; Byrne, R.A.; Collet, J.P.; Falk, V.; Head, S.J.; et al. 2018 ESC/EACTS Guidelines on myocardial revascularization. Eur. Heart J. 2019, 40, 87–165. [Google Scholar] [CrossRef] [PubMed]
  10. Austen, W.G.; Edwards, J.E.; Frye, R.L.; Gensini, G.; Gott, V.L.; Griffith, L.S.; McGoon, D.C.; Murphy, M.; Roe, B.B. A reporting system on patients evaluated for coronary artery disease. Report of the Ad Hoc Committee for Grading of Coronary Artery Disease, Council on Cardiovascular Surgery, American Heart Association. Circulation 1975, 51, 5–40. [Google Scholar] [CrossRef] [PubMed] [Green Version]
  11. Sianos, G.; Morel, M.A.; Kappetein, A.P.; Morice, M.C.; Colombo, A.; Dawkins, K.; van den Brand, M.; Van Dyck, N.; Russell, M.E.; Mohr, F.W.; et al. The SYNTAX Score: An angiographic tool grading the complexity of coronary artery disease. EuroIntervention 2005, 1, 219–227. [Google Scholar] [PubMed]
  12. Parikh, N.I.; Honeycutt, E.F.; Roe, M.T.; Neely, M.; Rosenthal, E.J.; Mittleman, M.A.; Carrozza, J.P., Jr.; Ho, K.K. Left and codominant coronary artery circulations are associated with higher in-hospital mortality among patients undergoing percutaneous coronary intervention for acute coronary syndromes: Report From the National Cardiovascular Database Cath Percutaneous Coronary Intervention (CathPCI) Registry. Circ. Cardiovasc. Qual. Outcomes 2012, 5, 775–782. [Google Scholar] [PubMed] [Green Version]
  13. Yang, S.; Kweon, J.; Roh, J.H.; Lee, J.H.; Kang, H.; Park, L.J.; Kim, D.J.; Yang, H.; Hur, J.; Kang, D.Y.; et al. Deep learning segmentation of major vessels in X-ray coronary angiography. Sci. Rep. 2019, 9, 16897. [Google Scholar] [CrossRef] [PubMed]
  14. Iyer, K.; Najarian, C.P.; Fattah, A.A.; Arthurs, C.J.; Soroushmehr, S.; Subban, V.; Sankardas, M.A.; Nadakuditi, R.R.; Nallamothu, B.K.; Figueroa, C.A. Angionet: A convolutional neural network for vessel segmentation in X-ray angiography. Sci. Rep. 2021, 11, 18066. [Google Scholar] [CrossRef] [PubMed]
  15. Nasr-Esfahani, E.; Karimi, N.; Jafari, M.H.; Soroushmehr, S.M.R.; Samavi, S.; Nallamothu, B.; Najarian, K. Segmentation of vessels in angiograms using convolutional neural networks. Biomed. Signal Process. Control 2018, 40, 240–251. [Google Scholar] [CrossRef]
  16. Zai, S.; Abbas, A. An Effective Enhancement and Segmentation of Coronary Arteries in 2D Angiograms. In Proceedings of the 2018 International Conference on Smart Computing and Electronic Enterprise (ICSCEE), Kuala Lumpur, Malaysia, 11–12 July 2018; pp. 1–4. [Google Scholar]
  17. Avram, R.; Olgin, J.; Wan, A.; Ahmed, Z.; Verreault-Julien, L.; Abreau, S.; Wan, D.; Gonzalez, J.E.; So, D.; Soni, K.; et al. CATHAI: Fully automated coronary angiography interpretation and stenosis detection using a deep learning-based algorithmic pipeline. J. Am. Coll. Cardiol. 2021, 77, 3244. [Google Scholar] [CrossRef]
  18. Moon, J.H.; Cha, W.C.; Chung, M.J.; Lee, K.S.; Cho, B.H.; Choi, J.H. Automatic stenosis recognition from coronary angiography using convolutional neural networks. Comput. Methods Programs Biomed. 2021, 198, 105819. [Google Scholar] [CrossRef] [PubMed]
  19. Tran, D.; Wang, H.; Torresani, L.; Ray, J.; LeCun, Y.; Paluri, M. A closer look at spatiotemporal convolutions for action recognition. In Proceedings of the IEEE conference on Computer Vision and Pattern Recognition, Salt Lake City, UT, USA, 18–23 June 2018; pp. 6450–6459. [Google Scholar]
  20. Feichtenhofer, C. X3D: Expanding architectures for efficient video recognition. In Proceedings of the IEEE/CVF Conference on Computer Vision and Pattern Recognition, Seattle, WA, USA, 13–19 June 2020; pp. 203–213. [Google Scholar]
  21. Fan, H.; Xiong, B.; Mangalam, K.; Li, Y.; Yan, Z.; Malik, J.; Feichtenhofer, C. Multiscale vision transformers. In Proceedings of the IEEE/CVF International Conference on Computer Vision, Montreal, QC, Canada, 10–17 October 2021; pp. 6824–6835. [Google Scholar]
  22. Kay, W.; Carreira, J.; Simonyan, K.; Zhang, B.; Hillier, C.; Vijayanarasimhan, S.; Viola, F.; Green, T.; Back, T.; Natsev, P.; et al. The kinetics human action video dataset. arXiv 2017, arXiv:1705.06950. [Google Scholar]
  23. Gu, C.; Sun, C.; Ross, D.A.; Vondrick, C.; Pantofaru, C.; Li, Y.; Vijayanarasimhan, S.; Toderici, G.; Ricco, S.; Sukthankar, R.; et al. Ava: A video dataset of spatio-temporally localized atomic visual actions. In Proceedings of the IEEE Conference on Computer Vision and Pattern Recognition, Salt Lake City, UT, USA, 18–23 June 2018; pp. 6047–6056. [Google Scholar]
  24. He, K.; Zhang, X.; Ren, S.; Sun, J. Deep residual learning for image recognition. In Proceedings of the IEEE Conference on Computer Vision and Pattern Recognition, Las Vegas, NV, USA, 27–30 June 2016; pp. 770–778. [Google Scholar]
  25. Ioffe, S.; Szegedy, C. Batch normalization: Accelerating deep network training by reducing internal covariate shift. In Proceedings of the International Conference on Machine Learning, Lille, France, 6–11 July 2015; pp. 448–456. [Google Scholar]
  26. Howard, A.G.; Zhu, M.; Chen, B.; Kalenichenko, D.; Wang, W.; Weyand, T.; Andreetto, M.; Adam, H. Mobilenets: Efficient convolutional neural networks for mobile vision applications. arXiv 2017, arXiv:1704.04861. [Google Scholar]
  27. Dosovitskiy, A.; Beyer, L.; Kolesnikov, A.; Weissenborn, D.; Zhai, X.; Unterthiner, T.; Dehghani, M.; Minderer, M.; Heigold, G.; Gelly, S.; et al. An Image is Worth 16x16 Words: Transformers for Image Recognition at Scale. In Proceedings of the International Conference on Learning Representations, Virtual Event, 3–7 May 2021. [Google Scholar]
  28. Goyal, P.; Dollár, P.; Girshick, R.; Noordhuis, P.; Wesolowski, L.; Kyrola, A.; Tulloch, A.; Jia, Y.; He, K. Accurate, large minibatch sgd: Training imagenet in 1 hour. arXiv 2017, arXiv:1706.02677. [Google Scholar]
Figure 1. Overview of the proposed framework for linking CAGs and reported pathology. (1) Videos are recorded from various angles. (2) Videos are examined by specialists. (3A) Pathology is reported in a database. (3B-1) Videos are stored, but there is no information about which videos contain LCA or RCA. (3B-2) Classification of LCA and RCA is performed using deep learning (the models presented in this paper). (4) Videos are merged with databases containing pathological findings.
Electronics 11 02087 g001
Figure 2. The F1 scores reported at the test set vs different number of samples used for training and validation with different model architectures and data augmentation settings.
Electronics 11 02087 g002
Table 1. Comparison of the deep learning architectures.
Model TypeCNNTransformerParametersInference Throughput (Videos/Second)
R(2+1)D-18 33.3 million31.79
X3D-S 3.76 million19.78
MVIT32-3 36.6 million21.06
Table 2. Classification performance on the test set using the meta-data.
Model TypeData TypeParametersF1 Score
Logistic regressionMeta data50.75
Support Vector MachineMeta data25430.84
MLP (50 hidden units)Meta data3520.88
MLP (500 hidden units)Meta data35020.89
X3D-S (CNN)Videos3.76 millions0.99
Table 3. Comparison of classification performance across different input sizes, model architectures and different data augmentation techniques.
Spatial Size: 130 × 130 Spatial Size: 224 × 224
ModelsAugmentation TypesTemporal Size: 16Temporal Size: 32Temporal Size: 64Temporal Size: 16Temporal Size: 32
R(2+1)D-18w/o augs0.9930.9820.9940.9880.982
w/translation0.9880.980.9880.9960.994
w/rotation0.9880.9940.9970.9970.987
w/scaling temporal0.990.9970.9960.9940.993
w/scaling spatial0.9940.9880.9880.9870.988
w/all augs0.990.9930.9880.990.99
X3D-sw/o augs0.9940.9940.9940.9960.994
w/translation0.9860.9940.9880.9880.994
w/rotation0.990.990.990.9910.988
w/scaling temporal0.9880.9880.9880.9960.994
w/scaling spatial0.9850.9960.9880.9860.984
w/all augs0.990.990.9960.9940.993
MVIT-B
(16 × 4, 32 × 3)
w/o augsN/AN/AN/A0.9960.993
w/translationN/AN/AN/A0.9880.993
w/rotationN/AN/AN/A0.9930.993
w/scaling temporalN/AN/AN/A0.9880.996
w/scaling spatialN/AN/AN/A0.9940.996
w/all augsN/AN/AN/A0.9850.993
Publisher’s Note: MDPI stays neutral with regard to jurisdictional claims in published maps and institutional affiliations.

