Article

Inhibiting Oil Splitting and Backflow in Electrowetting Displays by Designing a Power Function Driving Waveform

1
Guangdong Provincial Key Laboratory of Optical Information Materials and Technology & Institute of Electronic Paper Displays, South China Academy of Advanced Optoelectronics, South China Normal University, Guangzhou 510006, China
2
School of Electronic Science and Engineering (National Exemplary School of Microelectronics), University of Electronic Science and Technology of China, Chengdu 611731, China
3
College of Electron and Information, University of Electronic Science and Technology of China, Zhongshan Institute, Zhongshan 528402, China
4
Guangdong Communication Polytechnic, Guangzhou 510650, China
*
Author to whom correspondence should be addressed.
Electronics 2022, 11(13), 2081; https://doi.org/10.3390/electronics11132081
Submission received: 2 June 2022 / Revised: 27 June 2022 / Accepted: 29 June 2022 / Published: 2 July 2022
(This article belongs to the Special Issue Flexible Devices and Optoelectronics Technologies)

Abstract

:
Electrowetting display (EWD) is one of the latest and most promising reflective displays. However, some defects are easily caused in a driving process. For example, the aperture ratio of pixels can be reduced due to oil splitting, and the grayscale cannot be stabilized due to charge trapping. These defects can be effectively solved by designing driving waveforms for EWDs. So, a power function driving waveform was proposed in this paper, which consisted of an oil splitting suppression stage, a direct current (DC) driving stage and an oil stabilization stage. Firstly, the relationships among luminance values, power constants and driving time were measured. An optimal oil splitting suppression stage was obtained, which could effectively inhibit oil splitting. Then, the response time could be reduced by a DC voltage in the DC driving stage. Finally, a voltage slope was tested during the oil stabilization stage, which was used to counteract voltage created by the charge trapping. The experimental results showed that compared with a linear function waveform, the response time could be shortened by 16.1%, and the luminance value could be increased by 3.8%. The aperture ratio and oil stability of EWD can be effectively improved by these findings, thereby increasing its potential application in the display field.

1. Introduction

As a new type of electronic paper technology, electrowetting technology can be used to produce displays, which are called electrowetting displays (EWDs) [1,2]. Compared with conventional electronic paper displays [3], EWDs have the advantages of low production cost, extremely high viewing angle, fast response speed and color display [4,5,6,7]. They can be used in wearable electronic devices, electronic tags and other fields [8,9]. Therefore, EWDs have great commercial value. Many academics and investors are attracted to this technology.
In 2003, the EWD was proposed by Hayes, and relevant results were published in Nature [10]. Colored oil in EWD pixels can be driven by a voltage sequence to flatten or shrink on an insulating layer [11]. Thereby, the “off” and “on” states of pixels are realized. These voltage sequences are called driving waveforms [12,13]. As one of the most critical technologies, the study of driving waveforms directly affects the response time, aperture ratio and grayscale stability of EWDs [14,15,16]. Designing an optimized driving waveform is an effective way to improve the performance of EWDs. A conventional driving waveform is a pulse width modulation (PWM) square wave [17]. The aperture ratio of pixels can be controlled by the magnitude of voltages. It has been proven that many defects, such as oil splitting and charge trapping, could be caused by PWM square wave [18,19,20]. The aperture ratio may be reduced due to oil splitting, and an unstable grayscale is caused due to charge trapping. The commercialization of EWDs is severely hindered by these defects. Therefore, many novel driving waveforms have been proposed to achieve high-performance EWDs. It has been found that voltage mutation is a cause of oil splitting [21]. Therefore, a linear function waveform and an exponential waveform were proposed [22,23]. Driving voltage rose from 0 V to the voltage where pixels could reach the target luminance. Oil splitting could be effectively resolved, but the response time of EWDs was prolonged. Therefore, a driving waveform based on the concept of threshold voltage was proposed [24]. The driving voltage rose from the threshold voltage, a short response time was achieved, and oil splitting was suppressed. In addition to the problem of oil splitting, maintaining a stable aperture ratio was another challenge in designing a high-performance driving waveform. Oil was difficult to stabilize in a shrinking state due to charge trapping [25]. In order to resolve this defect, a waveform with a reset signal was proposed [26]. A periodic negative voltage was used to release trapped charges. However, flickers could be caused due to a low frequency of the negative voltage. Therefore, a new oil stabilization waveform was proposed to reduce flickers. A high-frequency alternating current (AC) voltage was used to achieve stable grayscale display [27]. These excellent driving waveforms provided inspiration and reference directions for our experiments.
In this paper, a driving waveform based on oil splitting theory and a power function was proposed. In order to reduce oil splitting during the oil splitting suppression stage, the relationships among power constants, driving time and luminance values of pixels were studied. Next, a direct current (DC) driving voltage was used to increase the aperture ratio of pixels and shorten the response time. Then, a linear function waveform was used to counteract the voltage created by charge trapping, thereby stabilizing the colored oil. Compared with conventional driving waveforms of EWDs, a higher aperture ratio and a more stable grayscale could be achieved.

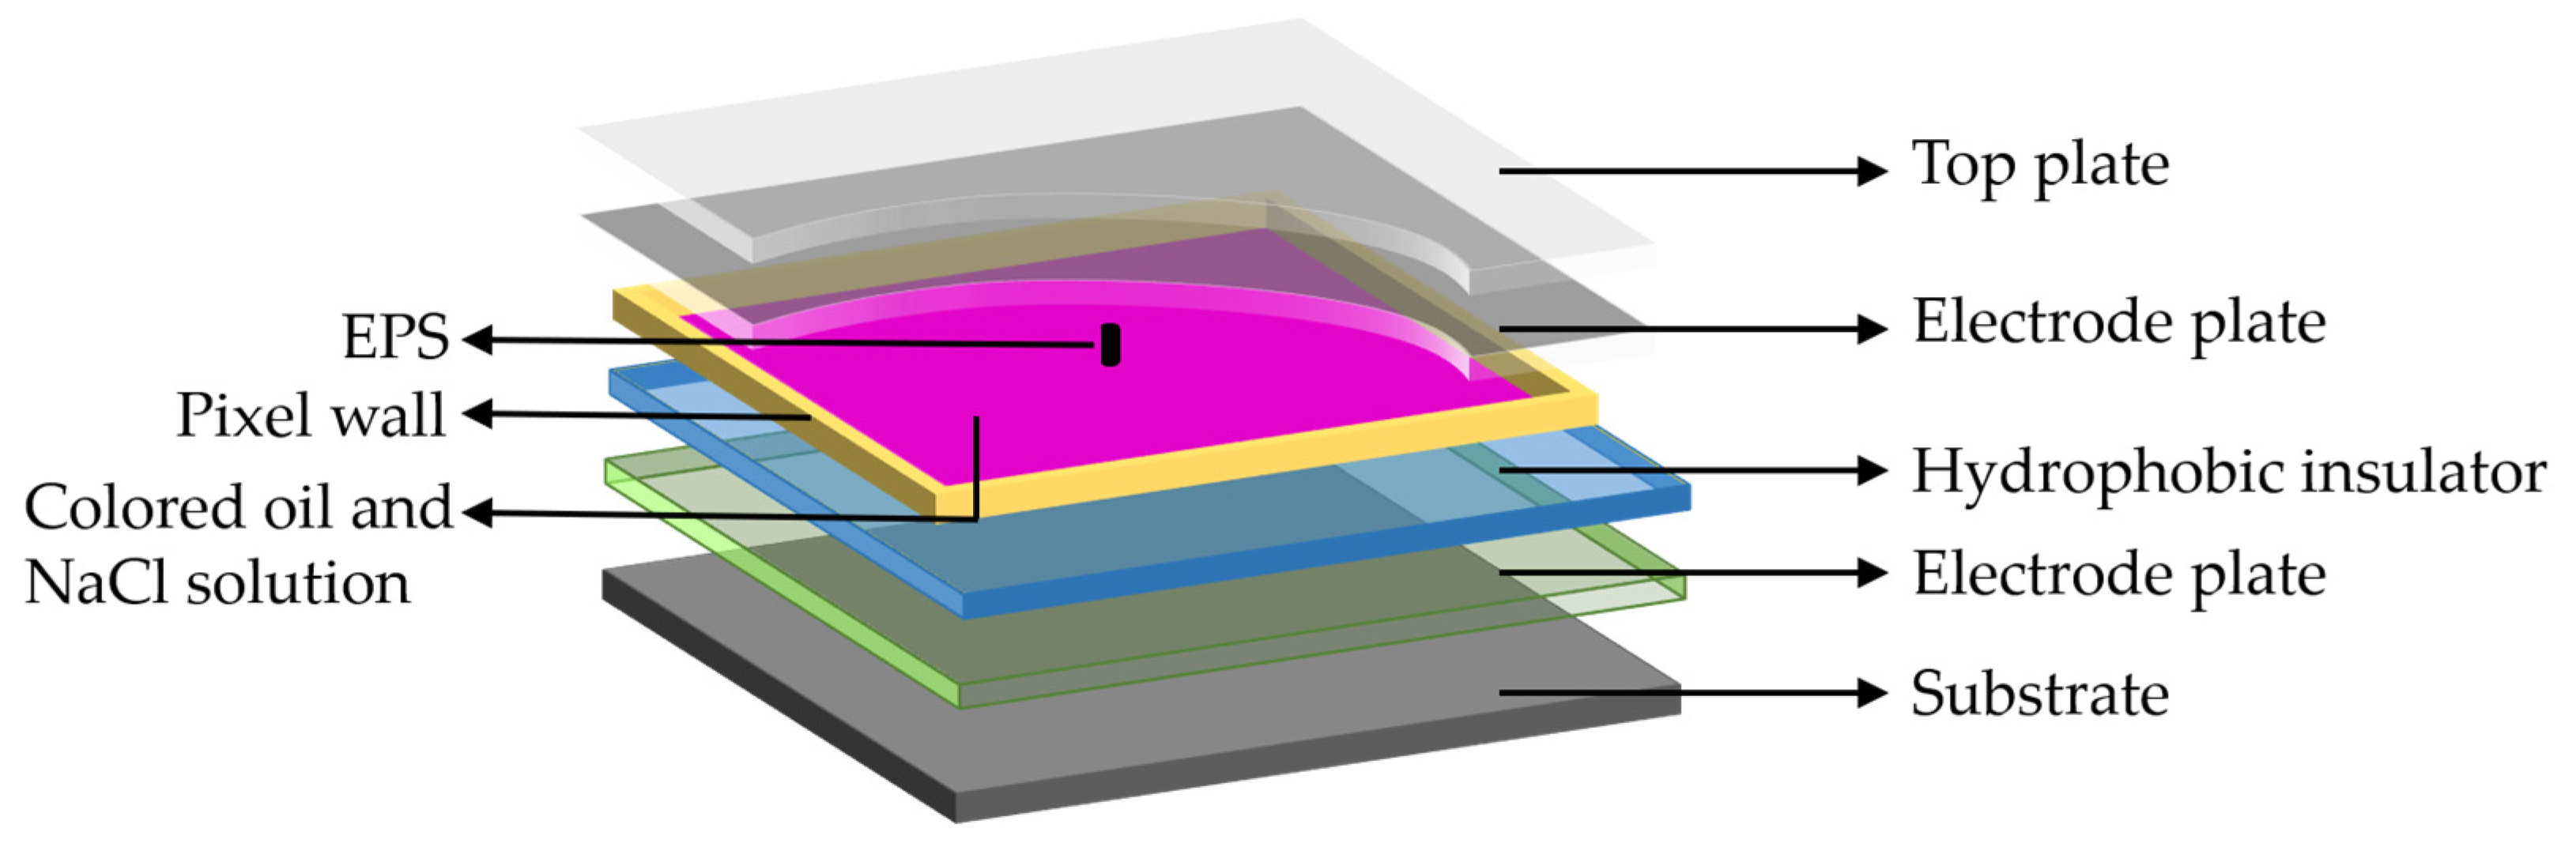
2. Principles of EWDs
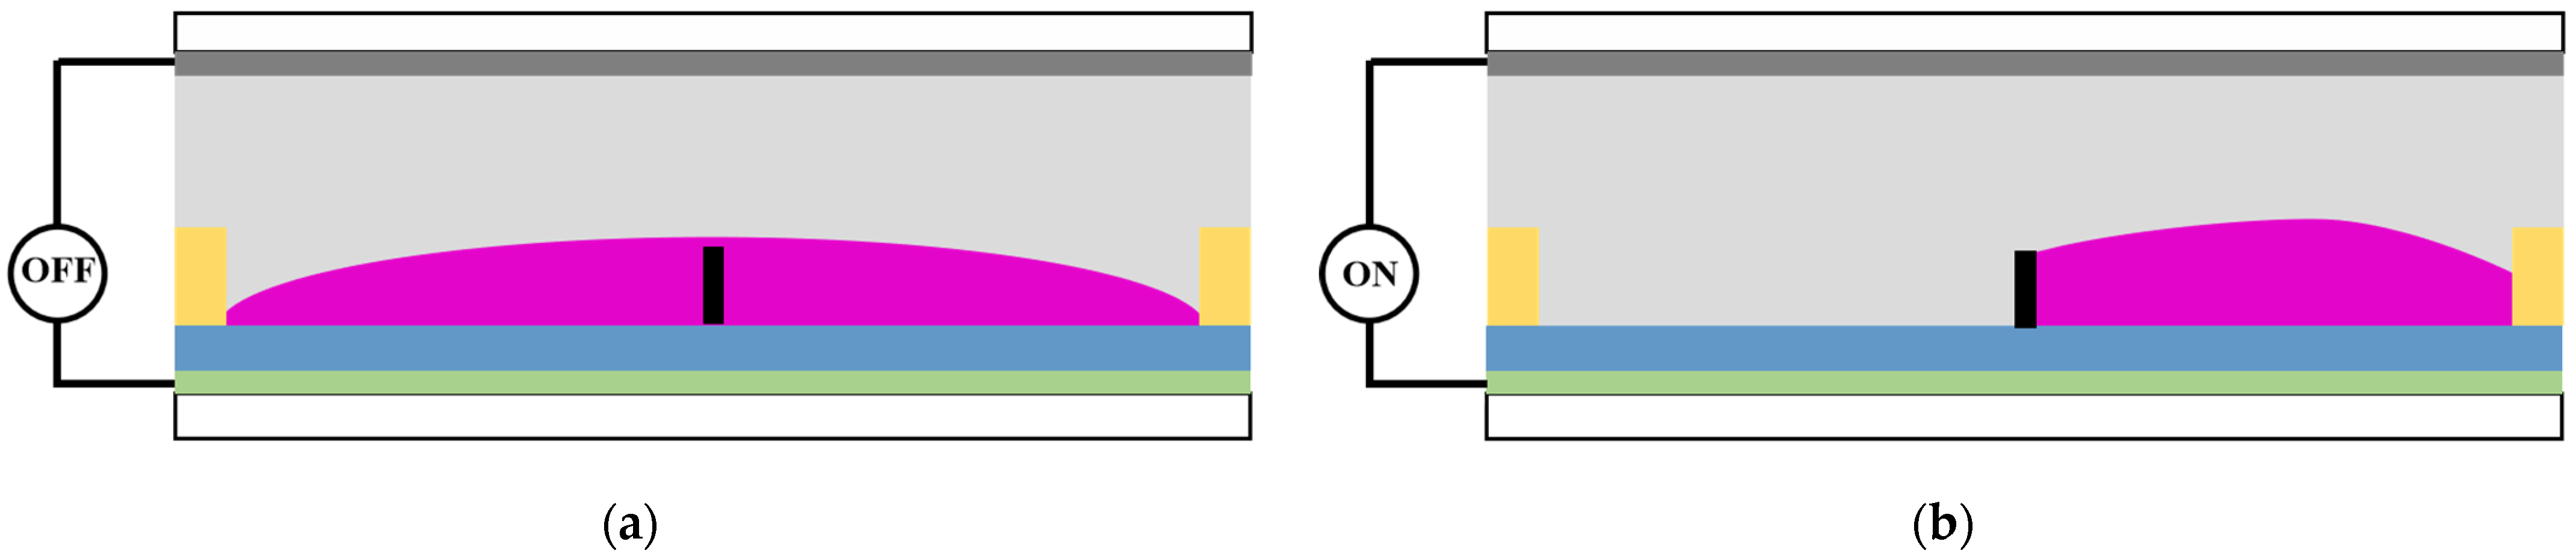
2.1. Model of EWDs

Electrowetting technology refers to a wettability of droplets on an underlying solid structure (strong hydrophobic materials) by applying a voltage [10]. That is to say, droplets can be deformed and displaced by changing the voltage. This technology has been used in EWDs. A typical EWD pixel structure is shown in Figure 1. It consists of a top plate, a substrate, two indium tin oxide (ITO) glass plates, colored oil, conductive liquid (NaCl aqueous solution), an insulator layer, pixel walls and an extra pinning structure (EPS) [28]. Among these, the color of the oil and the substrate can be displayed by pixels; the two ITO glass plates are a common electrode plate and a pixel electrode plate; pixel walls are used to separate oil among different pixels; and the EPS is used to control the oil motion [29].
The threshold voltage refers to the minimum voltage at which the force balance of oil was broken and the luminance value of the EWD was increased. The colored oil is spread between the insulating layer and the NaCl aqueous solution when the voltage between the two electrode plates is less than the threshold voltage. Incident light is reflected by oil, so pixels display the color of the oil, as shown in Figure 2a. As the voltage between the two electrode plates increases, the insulating layer gradually transforms from hydrophobicity to oleophobicity, and oil is pushed away by the NaCl aqueous solution. As shown in Figure 2b, the exposed area of the substrate increases; the ratio of this area to the total area of a pixel is called the aperture ratio [8]. One of the key parameters is to measure the performance of EWDs, which can be characterized by the contact angle because these two parameters are proportional [30]. The contact angle is the angle of tangents at the intersection of solid, liquid and gas phases. The famous Lippmann–Young equation was derived in 1875 and can be used to describe the relationship between the contact angle and the applied voltage in EWDs [31], as shown in Equation (1).
cos θ V cos θ 0 = K V 2
where θ V is the contact angle when a driving voltage is applied. θ 0 is the contact angle when oil is laid on the insulating layer. K is a constant related to the materials and structures of EWDs. V is the voltage applied to the two electrode plates. It can be seen that the contact angle is proportional to the square of the driving voltage. Theoretically, there is a one-to-one correspondence between the driving voltage and the contact angle. However, due to the influence of the structure and materials of the EWD, there were some defects in the driving process, such as oil splitting and charge trapping. So the Lippmann–Young equation needed to be optimized.
Oil splitting means that the oil shrinks into two or more corners of the pixels during the driving process [32]. In addition, the voltage on the two electrode plates of the EWD is partially canceled, causing oil backflow [33]. The Lippmann–Young equation can be modified, as shown in Equation (2).
cos θ V cos θ 0 = k ( V V G ) 2
where V G is the voltage generated by the charge trapping. Trapped charges can be quickly released by a negative voltage. The charge and discharge characteristics of the insulating layer can be equivalent to a capacitor. Therefore, the driving voltage cannot be too large to prevent the insulating layer from being broken down.

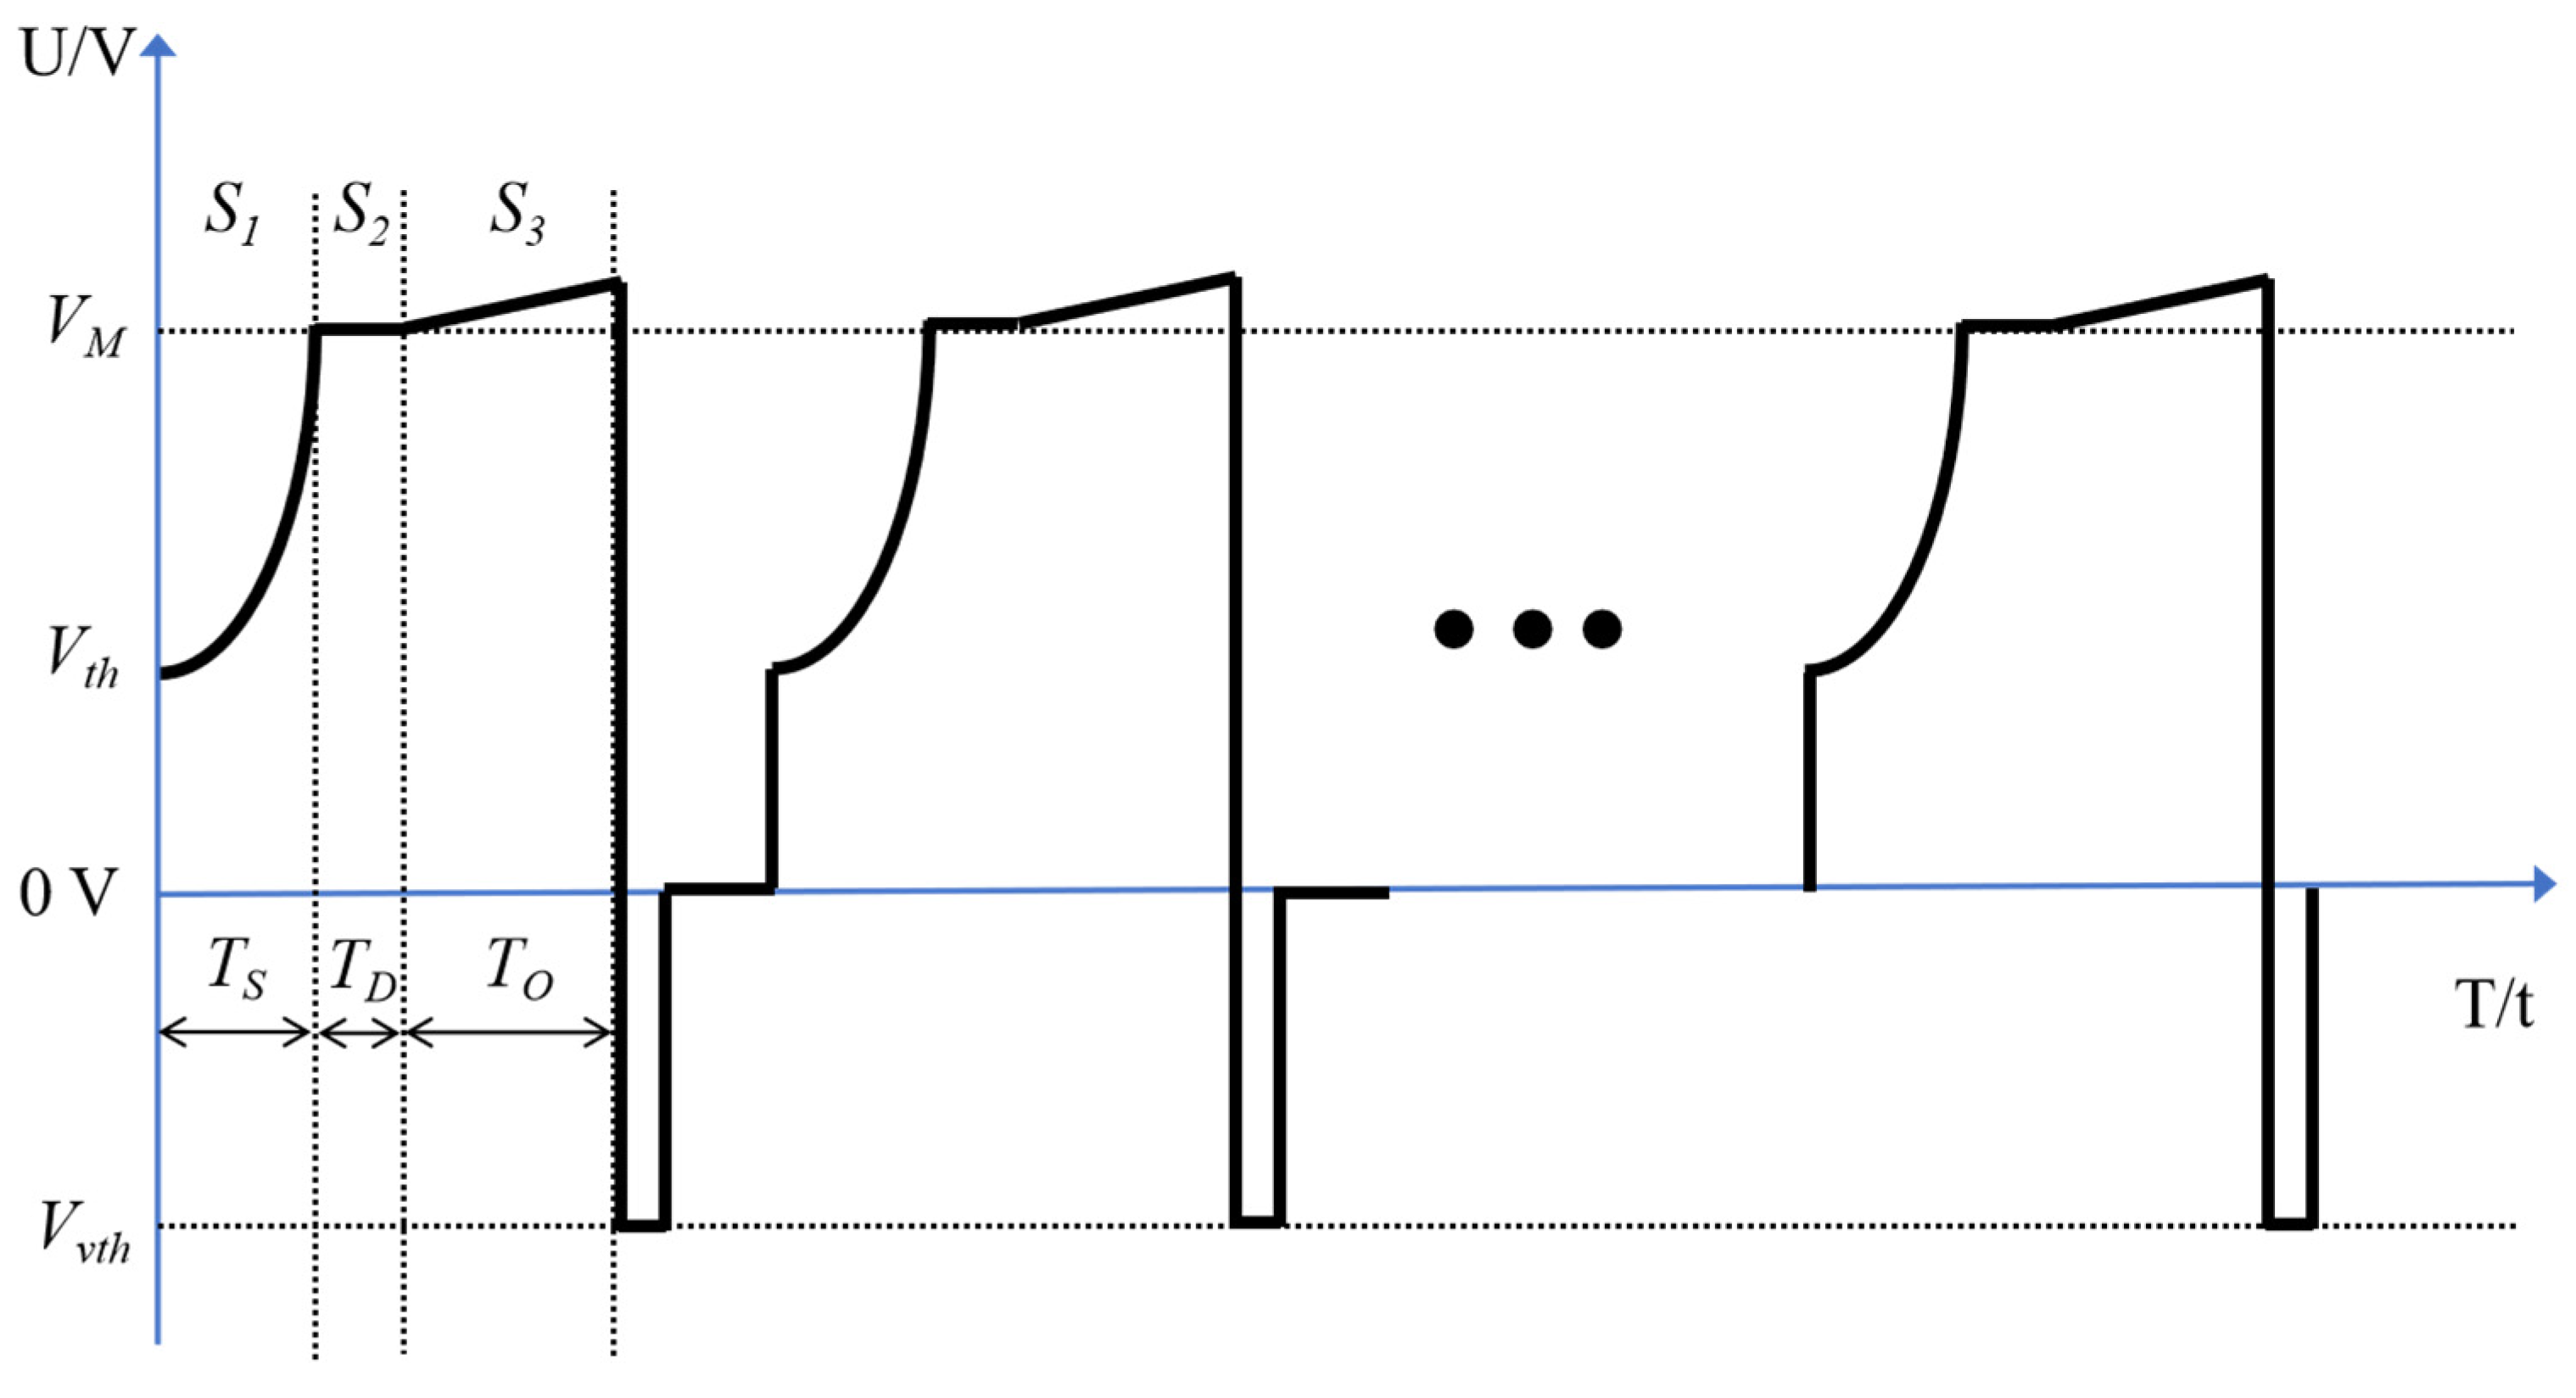
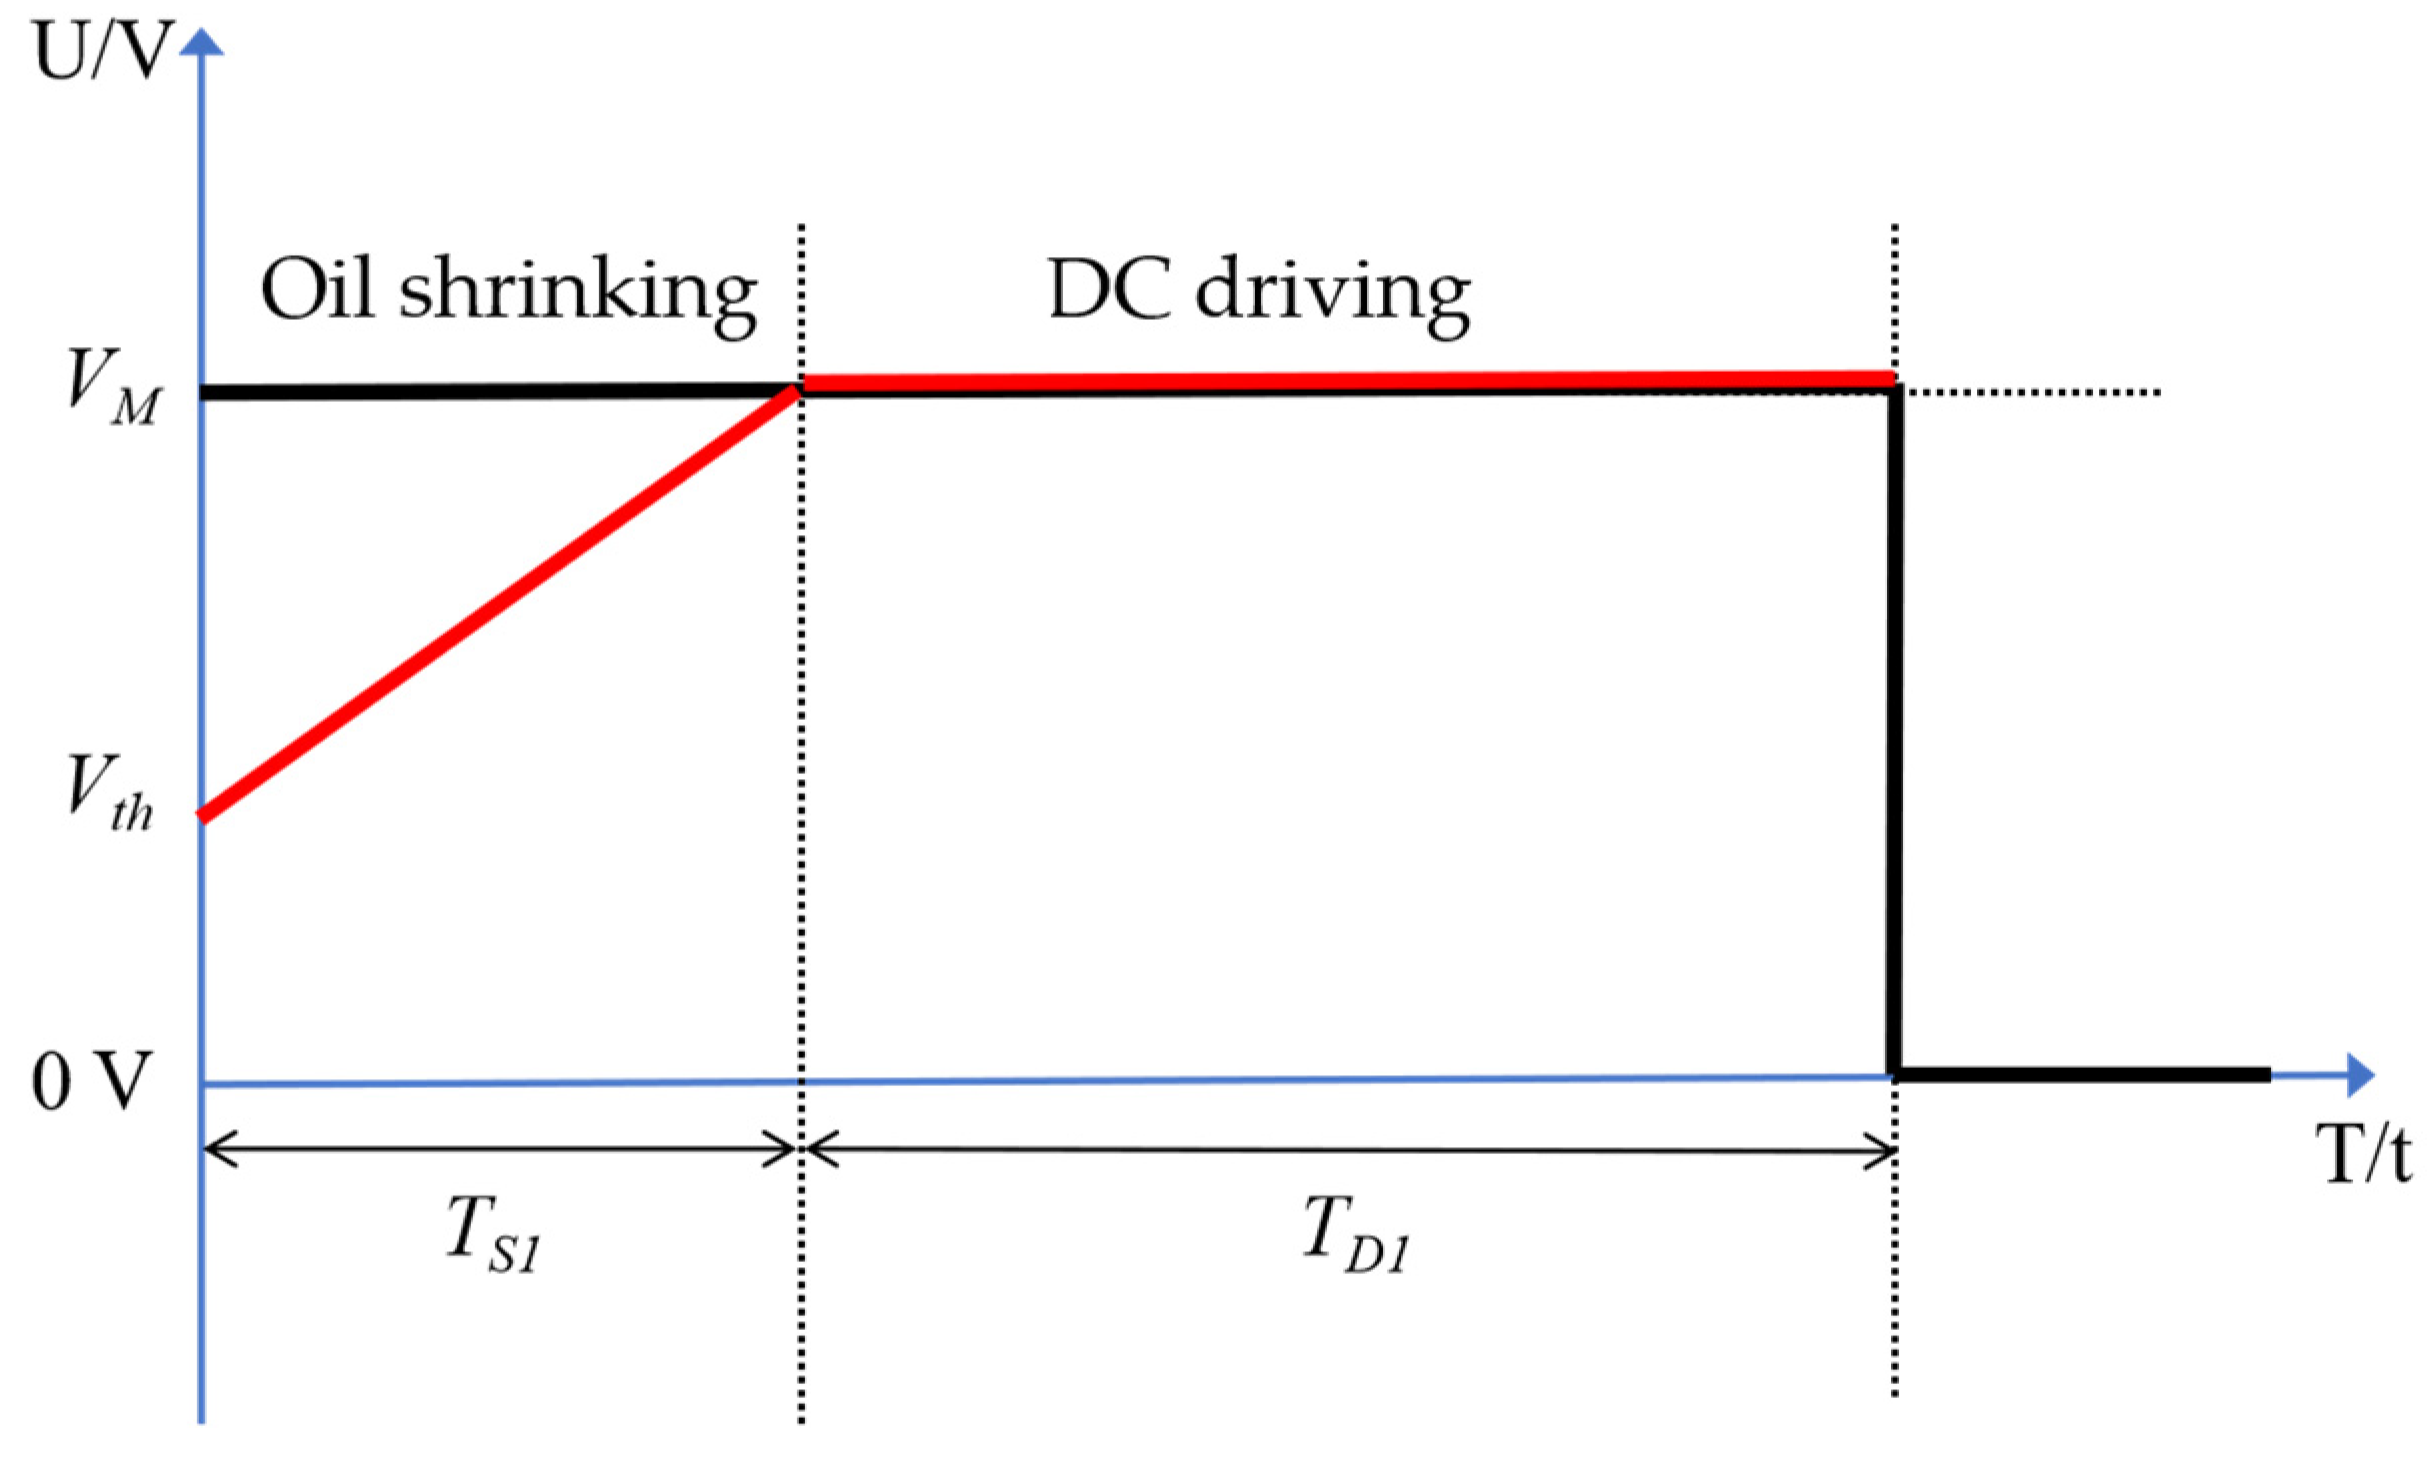
2.2. Driving Waveform Design

In order to reduce the influence of oil splitting and charge trapping on EWDs, a driving waveform based on oil splitting theory and a power function was designed. The designed driving waveform is shown in Figure 3. It is composed of an oil splitting suppression stage, a DC driving stage and an oil stabilization stage.
Firstly, in the oil splitting suppression stage, a designed waveform rises from V t h to V M . It can be described as shown in Equation (3).
V = V t h + V M V t h T s a × t a
where a is a power constant. t represents driving time. The driving waveform is a PWM square wave when a is equal to 0, and the driving waveform is a linear function waveform when a is equal to 1. It has been proven that the linear function waveform has a better drive performance compared to the PWM square wave [27]. However, other power constants have not been tested. The slope of driving voltage can be controlled by adjusting a and T s to suppress oil splitting. Then, since the oil splitting has been resolved, the DC driving stage is designed to obtain a short response time. Pixels can be quickly switched to a fully “on” state when they are driven by a DC voltage. Moreover, a linear function waveform is designed in the oil stabilization stage. The driving voltage starts to increase from V M . V G can be canceled out to achieve a stable grayscale. Finally, trapped charges remain in the insulating layer since no negative voltage is applied. These charges need to be released in order to obtain the same drive effect every time. Therefore, a negative voltage of several milliseconds is applied after the oil stabilization stage. Flickers and oil oscillation can be avoided because the magnitude of this voltage is less than the threshold voltage.

3. Experimental Results and Discussion

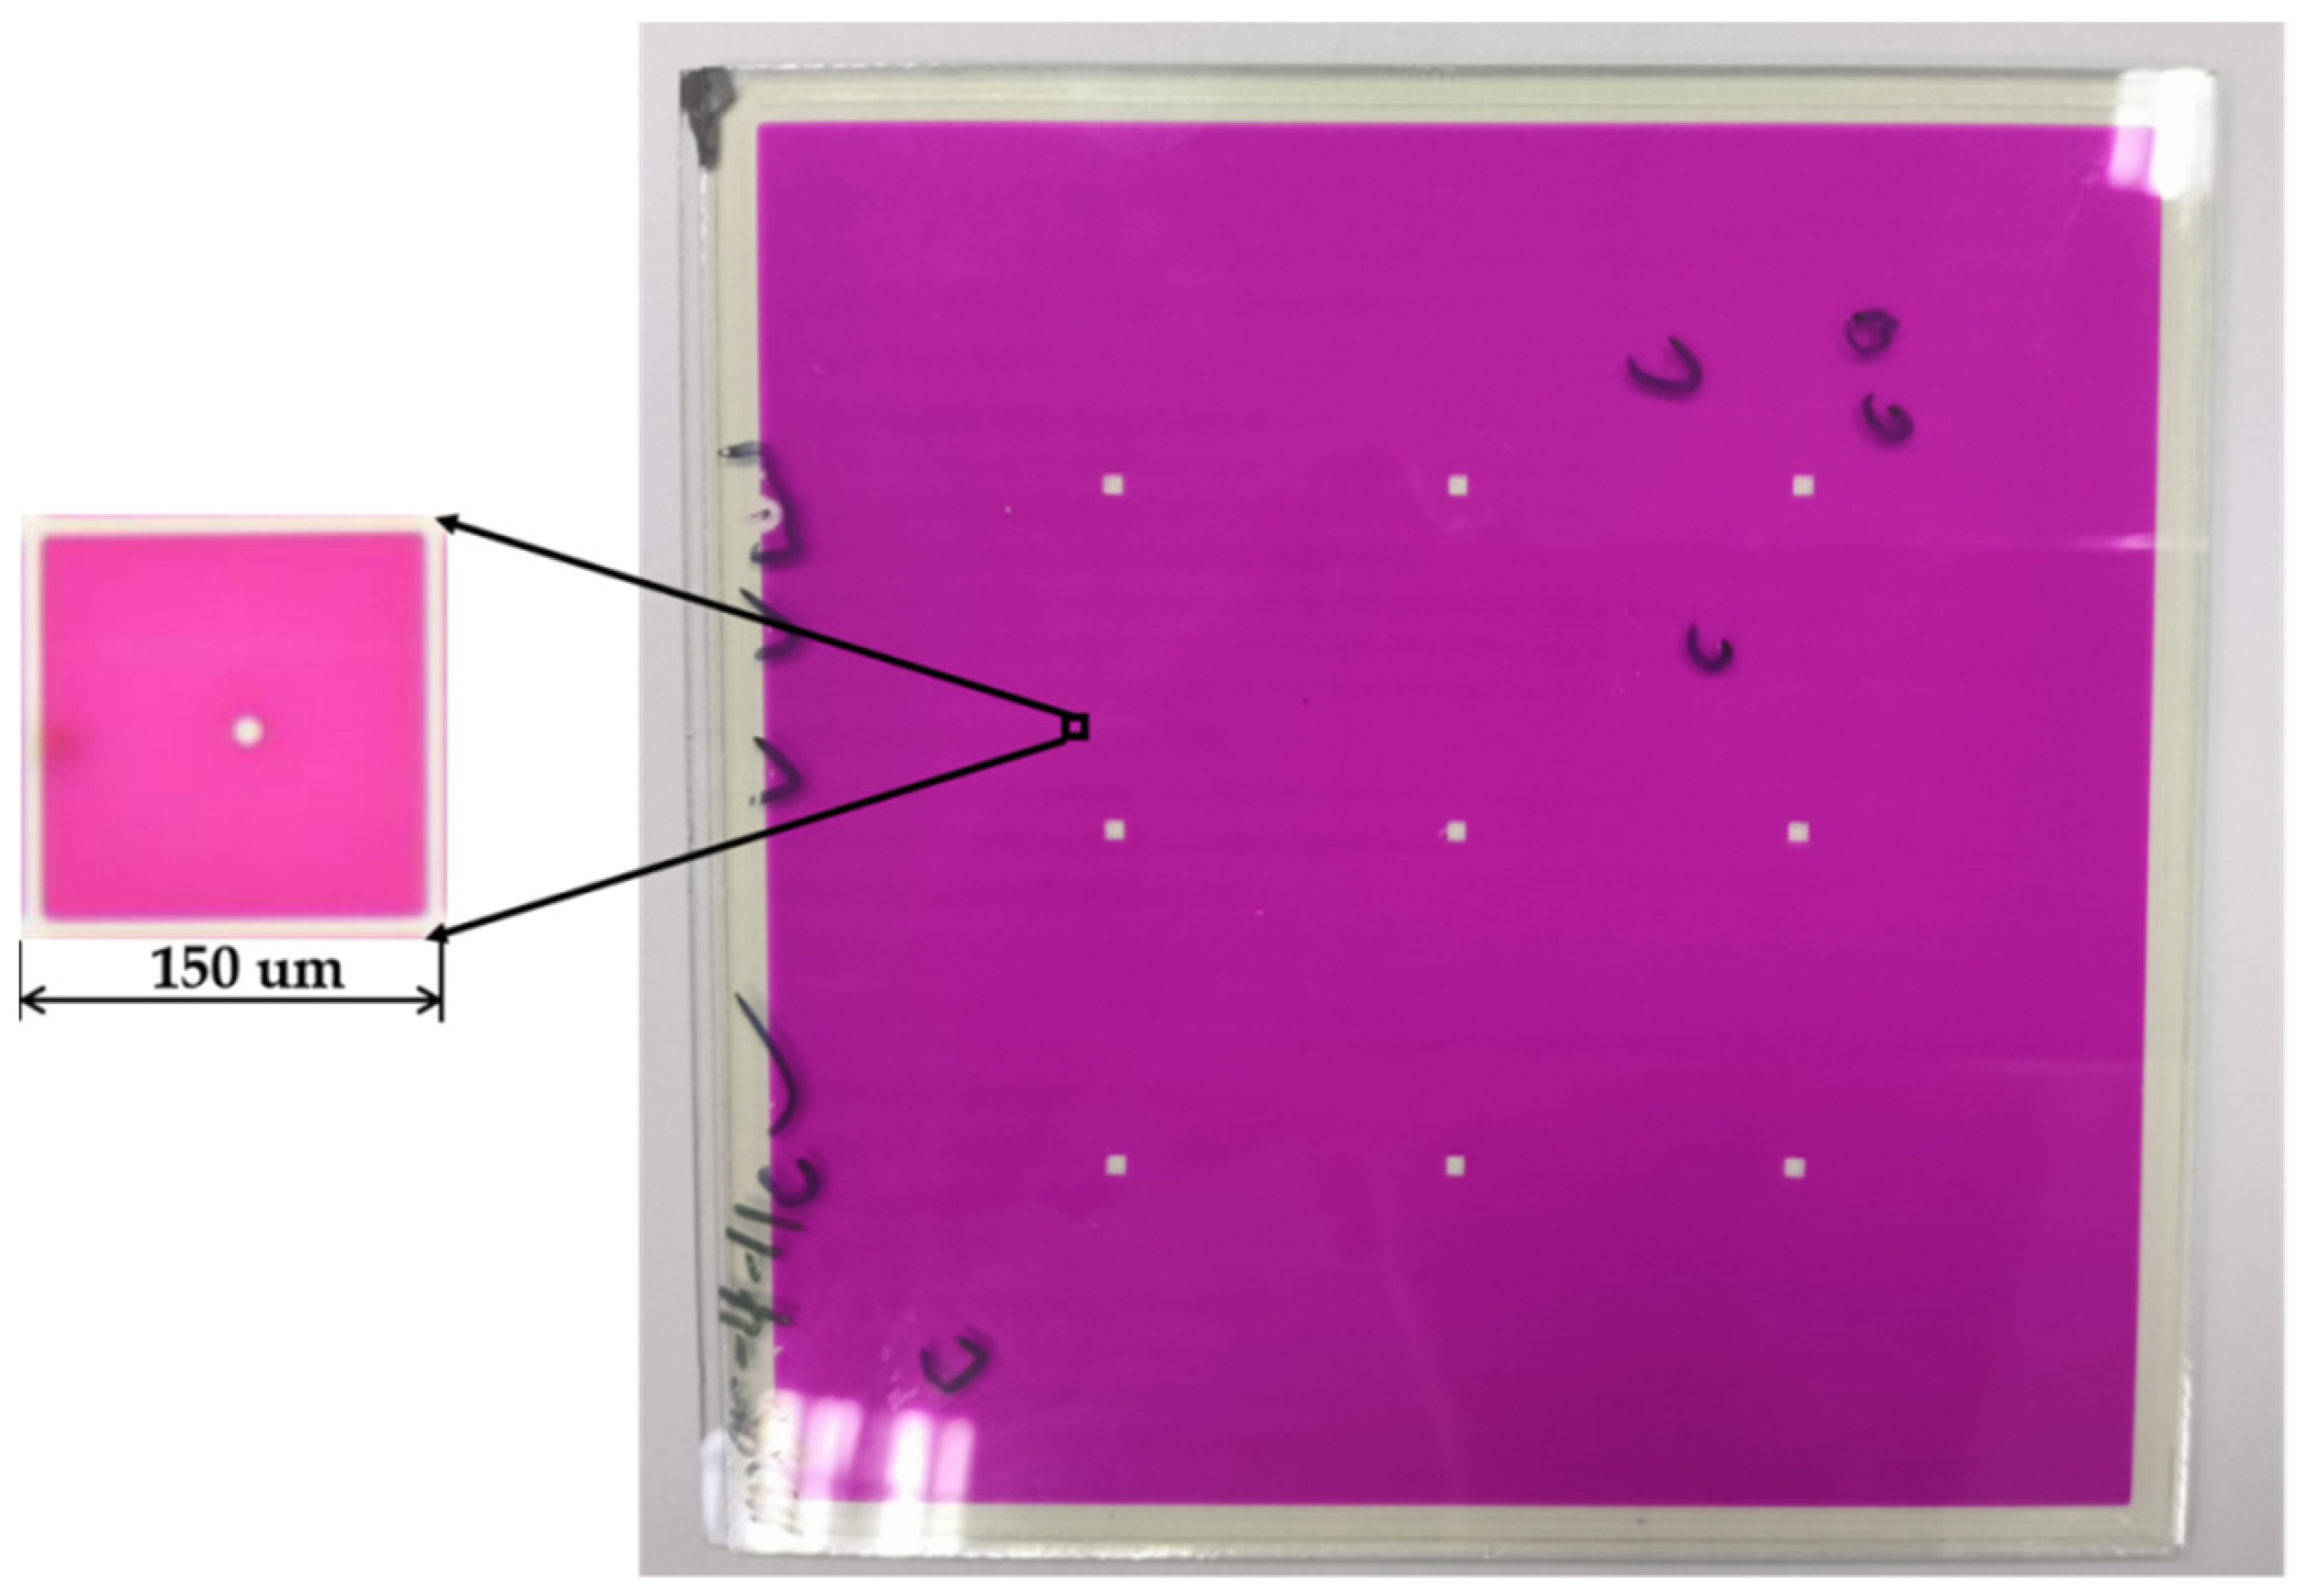
3.1. Experimental Platform

In this experiment, the aperture ratio could be characterized by the luminance value of the EWD, and the response time could be characterized by the change speed of the luminance value. Therefore, an experimental platform for recording EWD luminance values was built. The platform consisted of a computer, a function generator, a voltage amplifier, a colorimeter and a microscope. Parameters of these instruments are shown in Table 1. Firstly, driving waveforms could be edited by software (Matlab) on the computer, and files of driving waveform were transferred to the function generator through a universal serial bus (USB) interface. A maximum of 5 V could be output by the function generator, which could not drive the EWD. Therefore, the voltage amplifier was used to multiply the amplitude of driving waveforms by 10, and then the output voltage was applied to the EWD. The colorimeter was placed on the EWD to record its luminance value, and the microscope was used to observe the state of the colored oil.
The EWD used in our experiments is shown in Figure 4. It was designed and prepared by us. The size of the EWD was 10 × 10 cm2, and the resolution was 320 × 240. The size of each pixel was 150 × 150 um2, and the height was 18 um. The thickness of the two electrode plates was 2.5 nm, and the thickness of the insulating layer was 1 nm. The color of the oil was magenta, and both the top plate and the substrate were transparent.

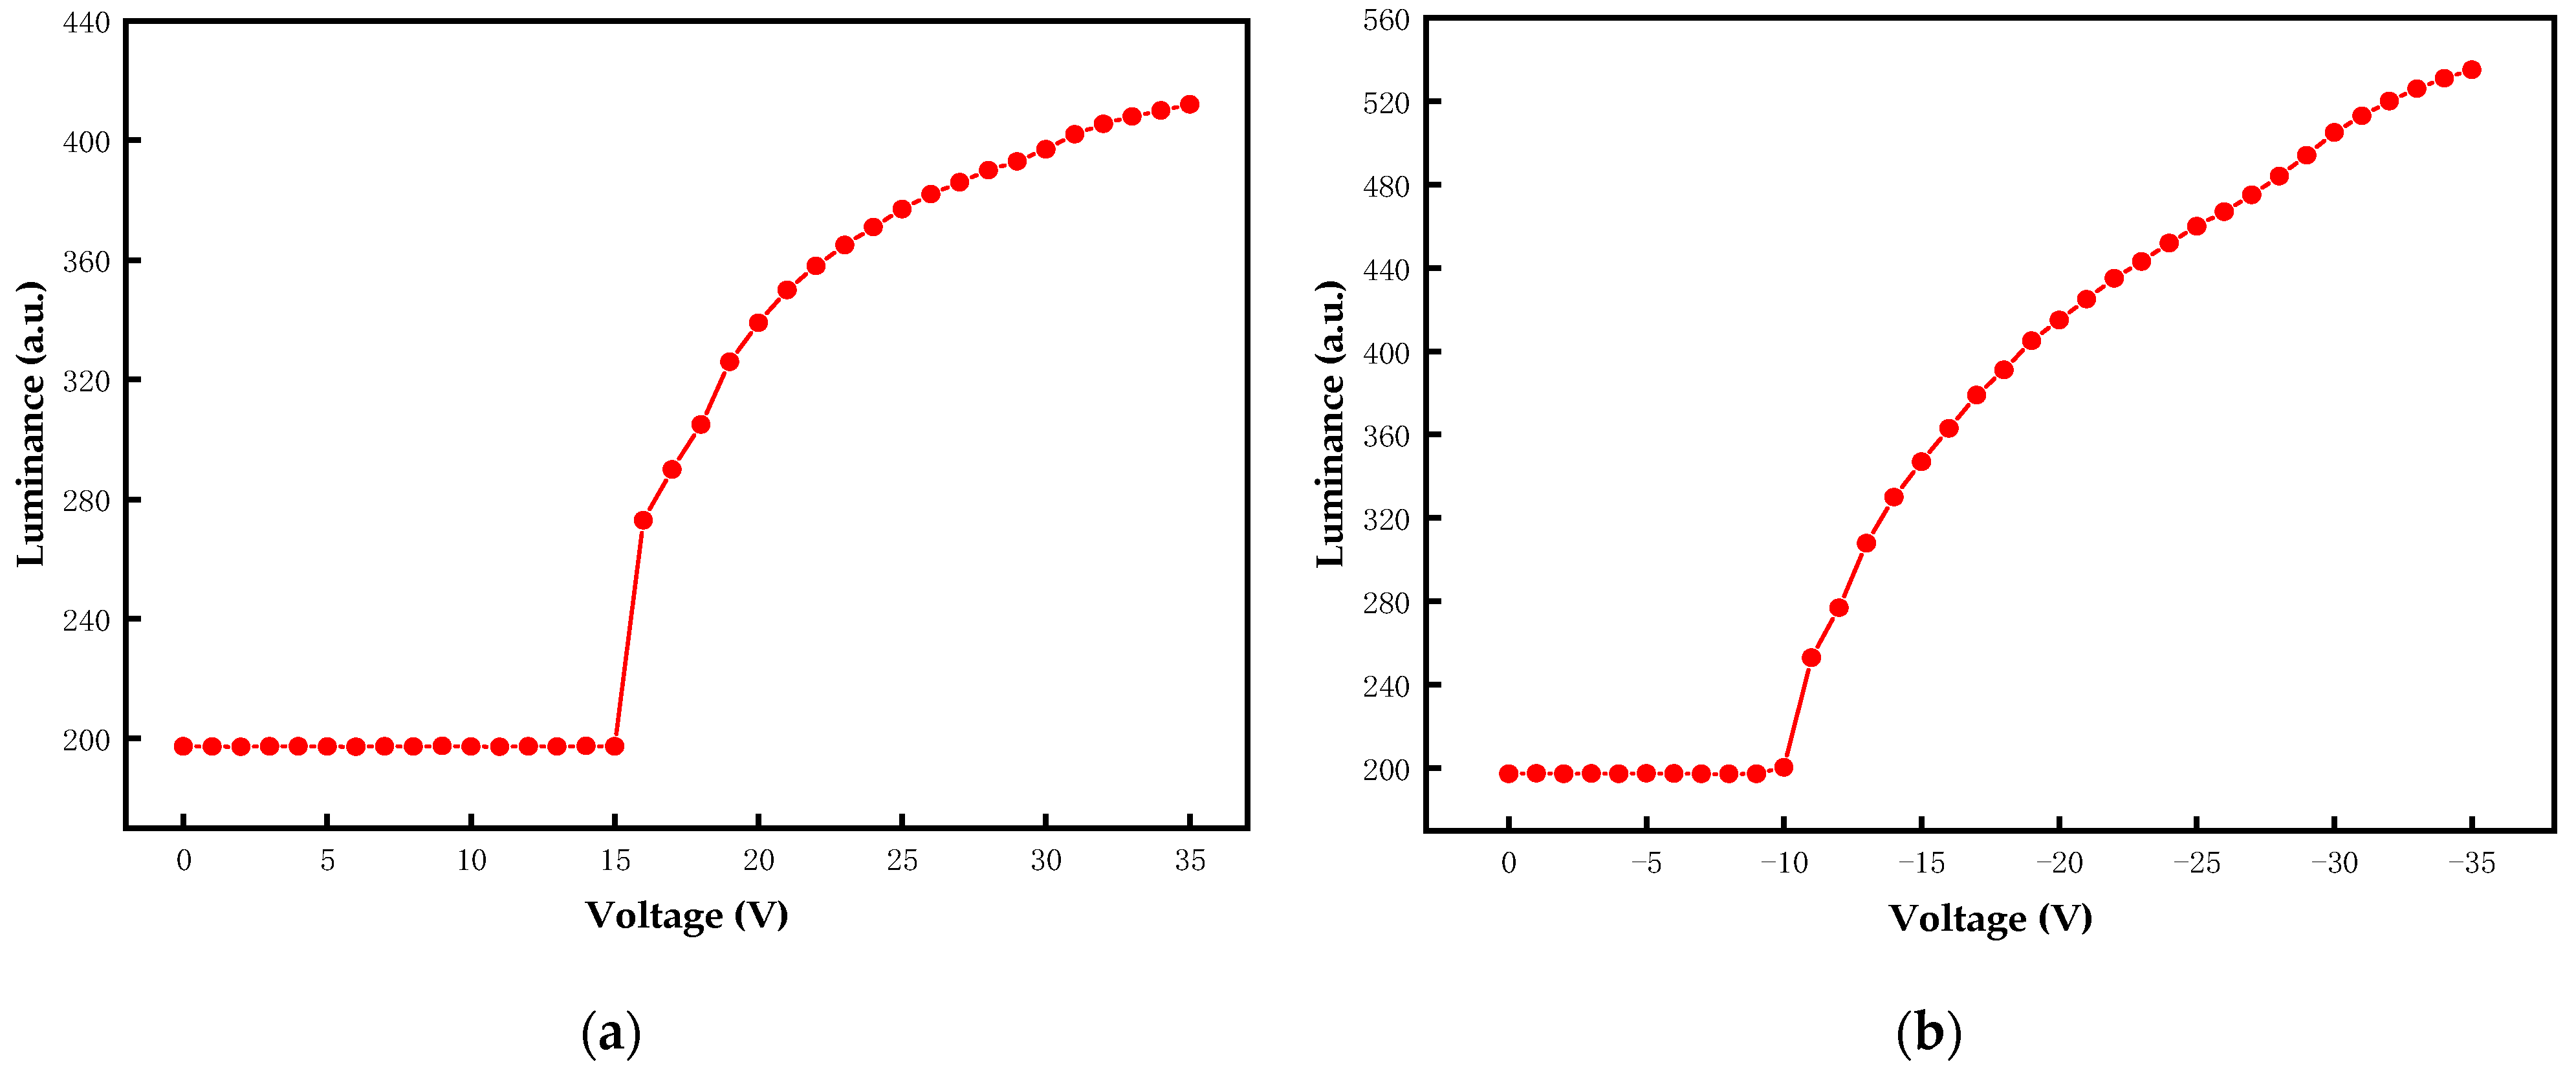
3.2. Threshold Voltage

In this paper, the threshold voltage needed to be measured first. A 0 V to 35 V DC voltage was used for testing V t h , and a 0 V to −35 V DC voltage was used for testing V v t h . The relationship between luminance values of the EWD and DC voltages is shown in Figure 5a,b. It can be seen that the luminance value was stable when the voltage amplitude was low, which meant that the oil was still flat on the insulating layer. The luminance value changed suddenly when the voltage amplitude reached the threshold voltage. Experiments showed that the positive threshold voltage and negative threshold voltage of the EWD were different. V t h and V v t h were 15 V and −10 V, respectively. Furthermore, a higher luminance value could be obtained by the negative voltage when voltage amplitudes were the same. Therefore, negative voltages were more suitable for driving the EWD. The proposed driving waveform was modified as follows: the negative voltage was used to drive the colored oil, and the positive voltage was used to release trapped charges. One cycle of the proposed driving waveform is shown in Figure 6.

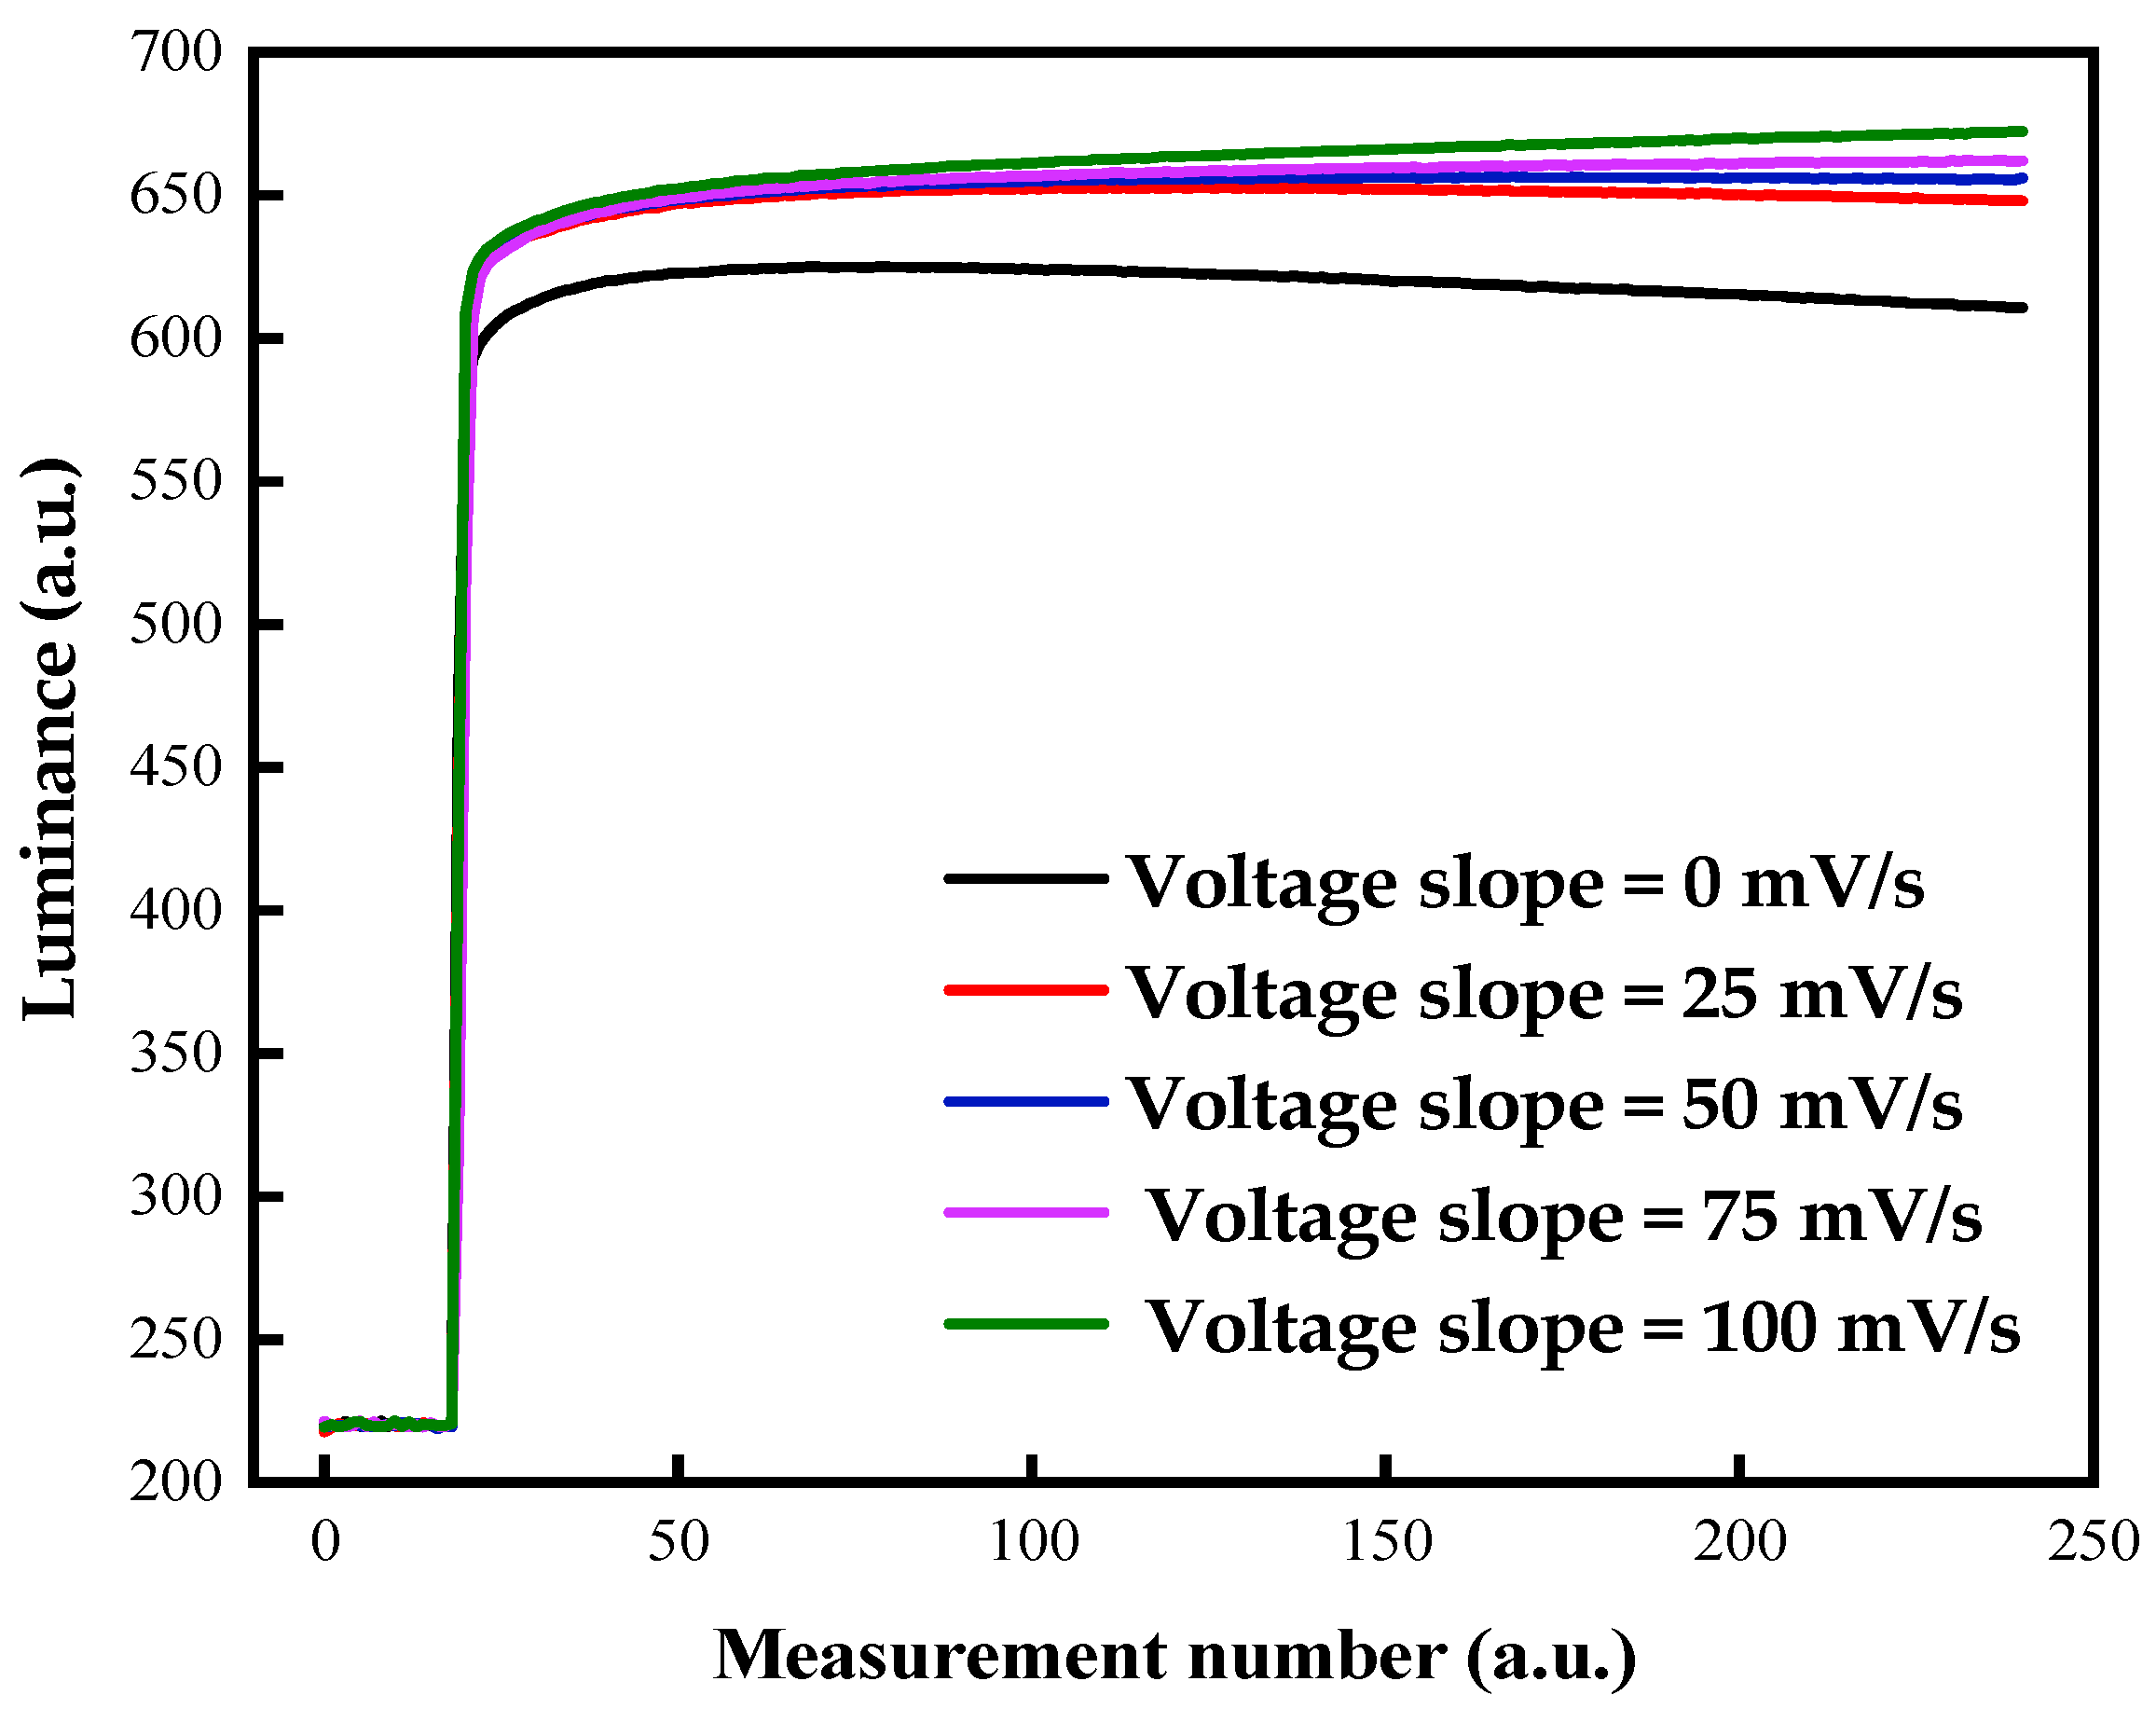
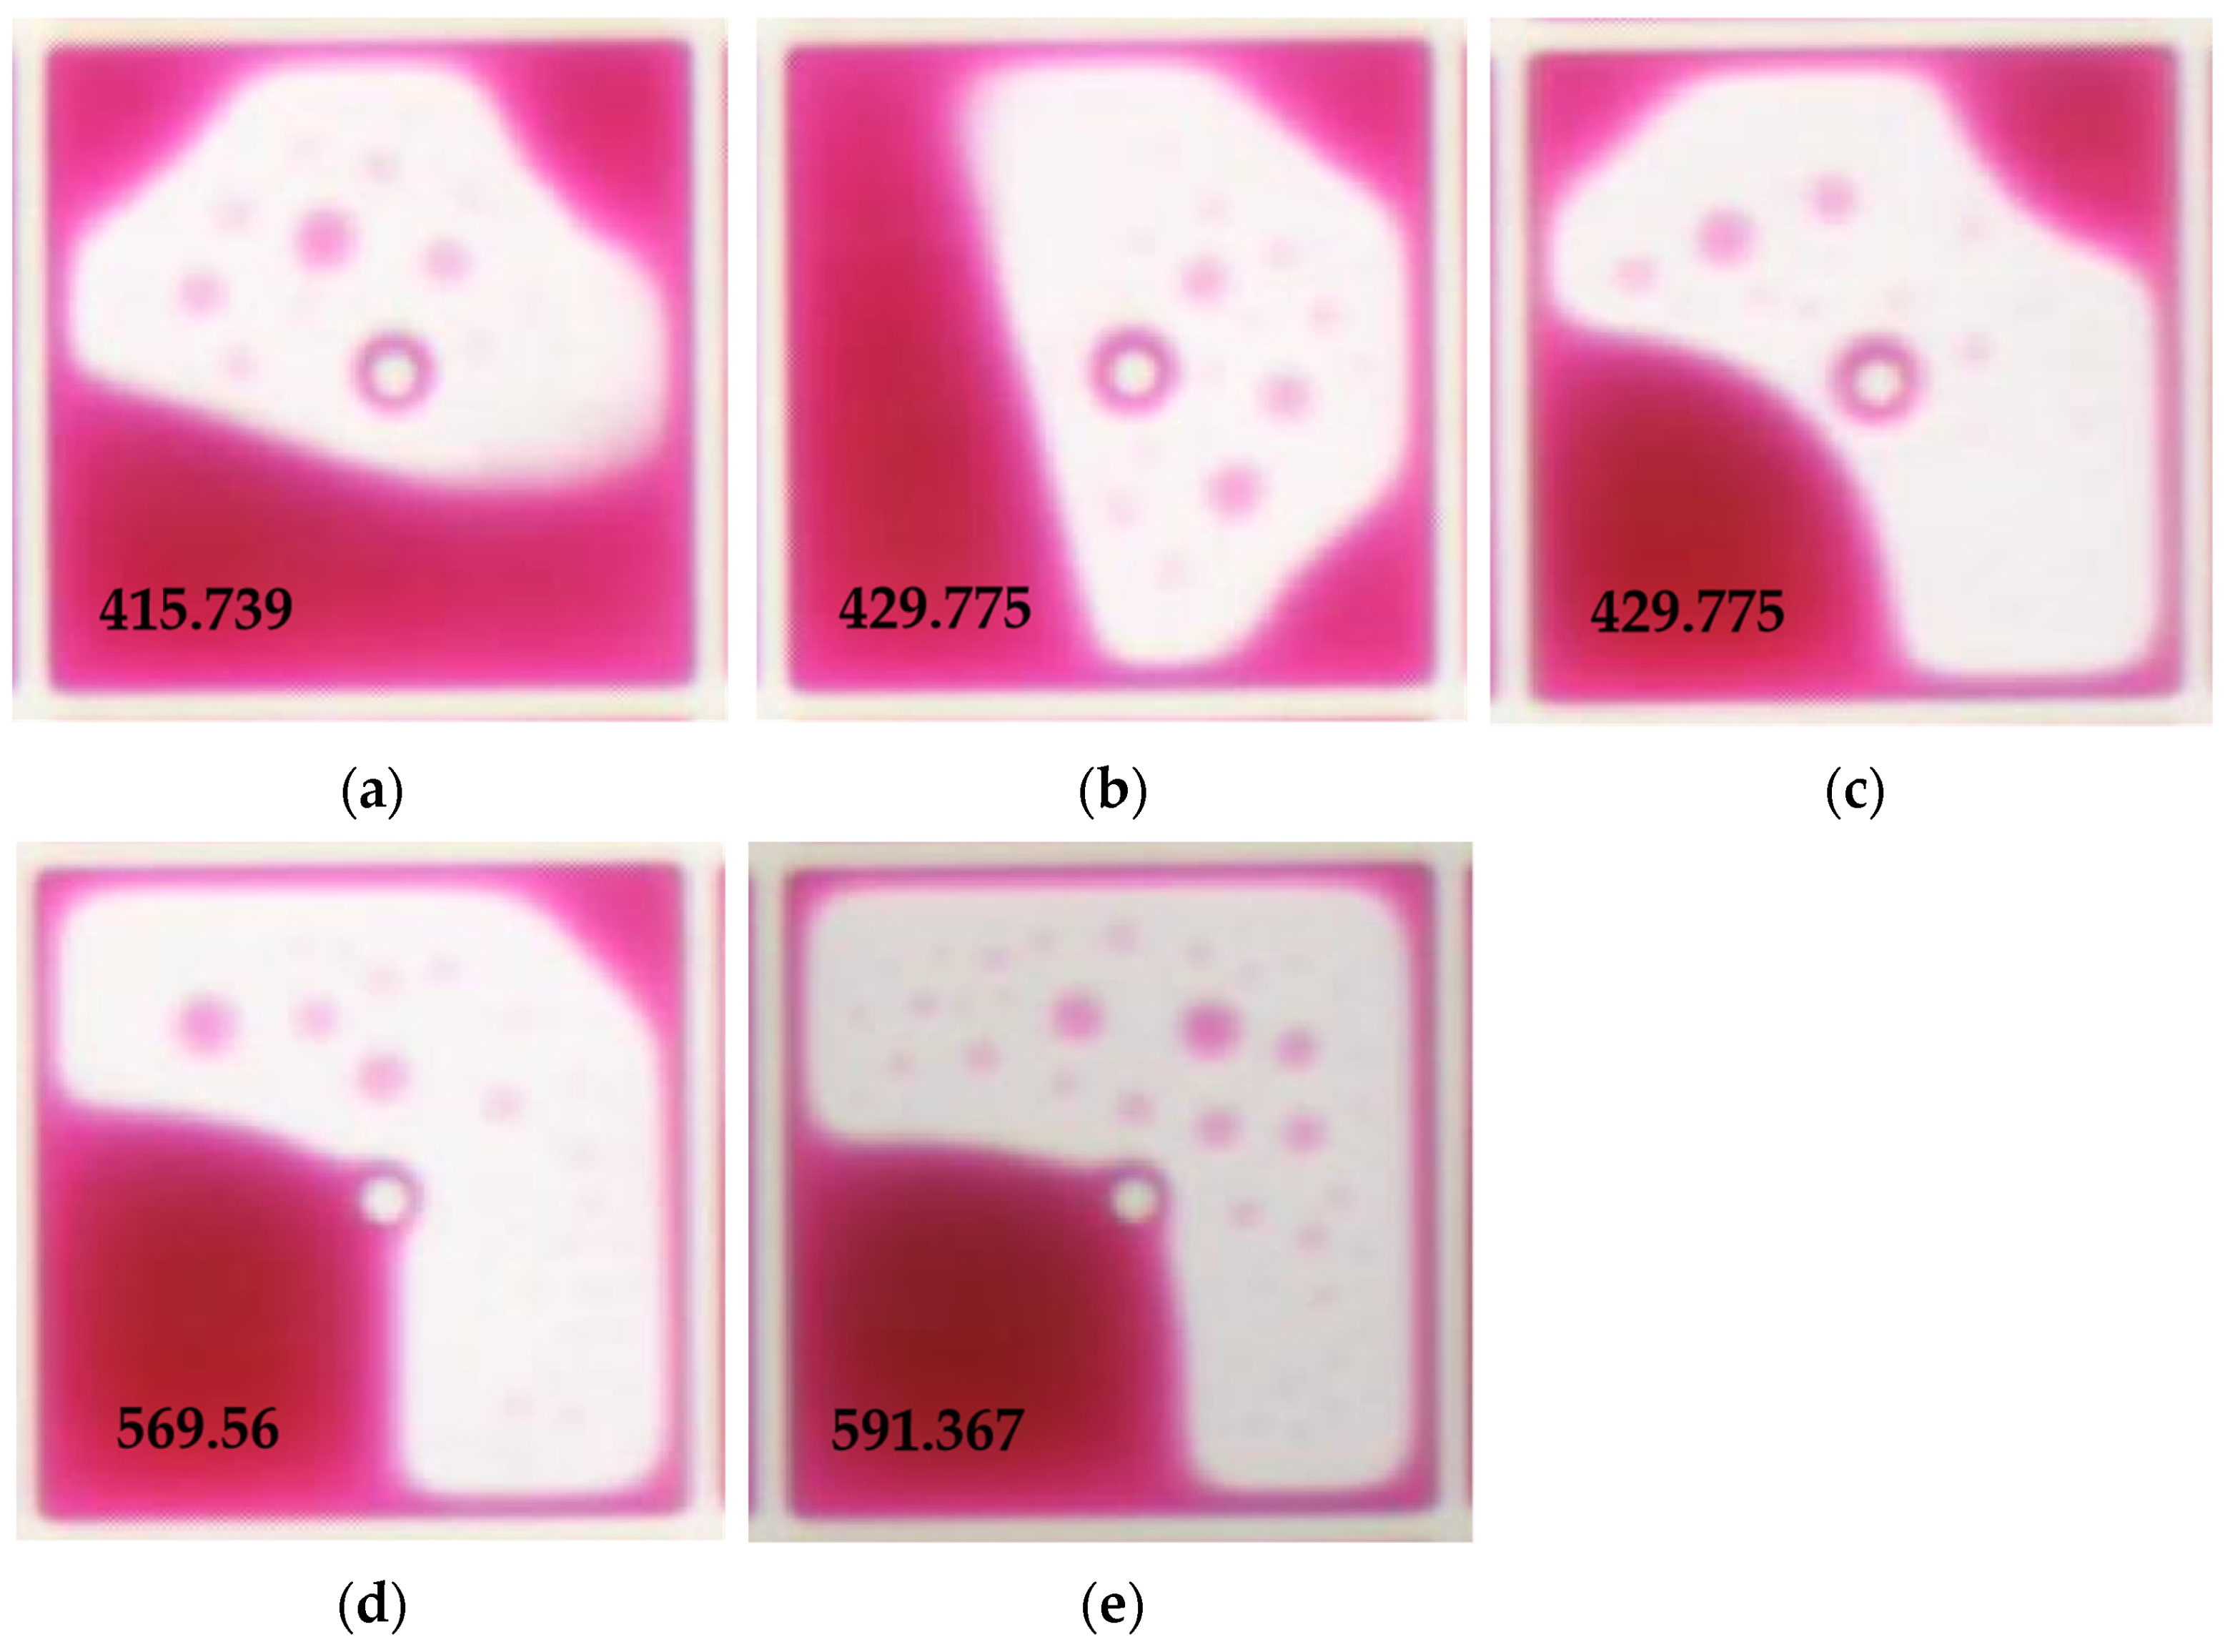
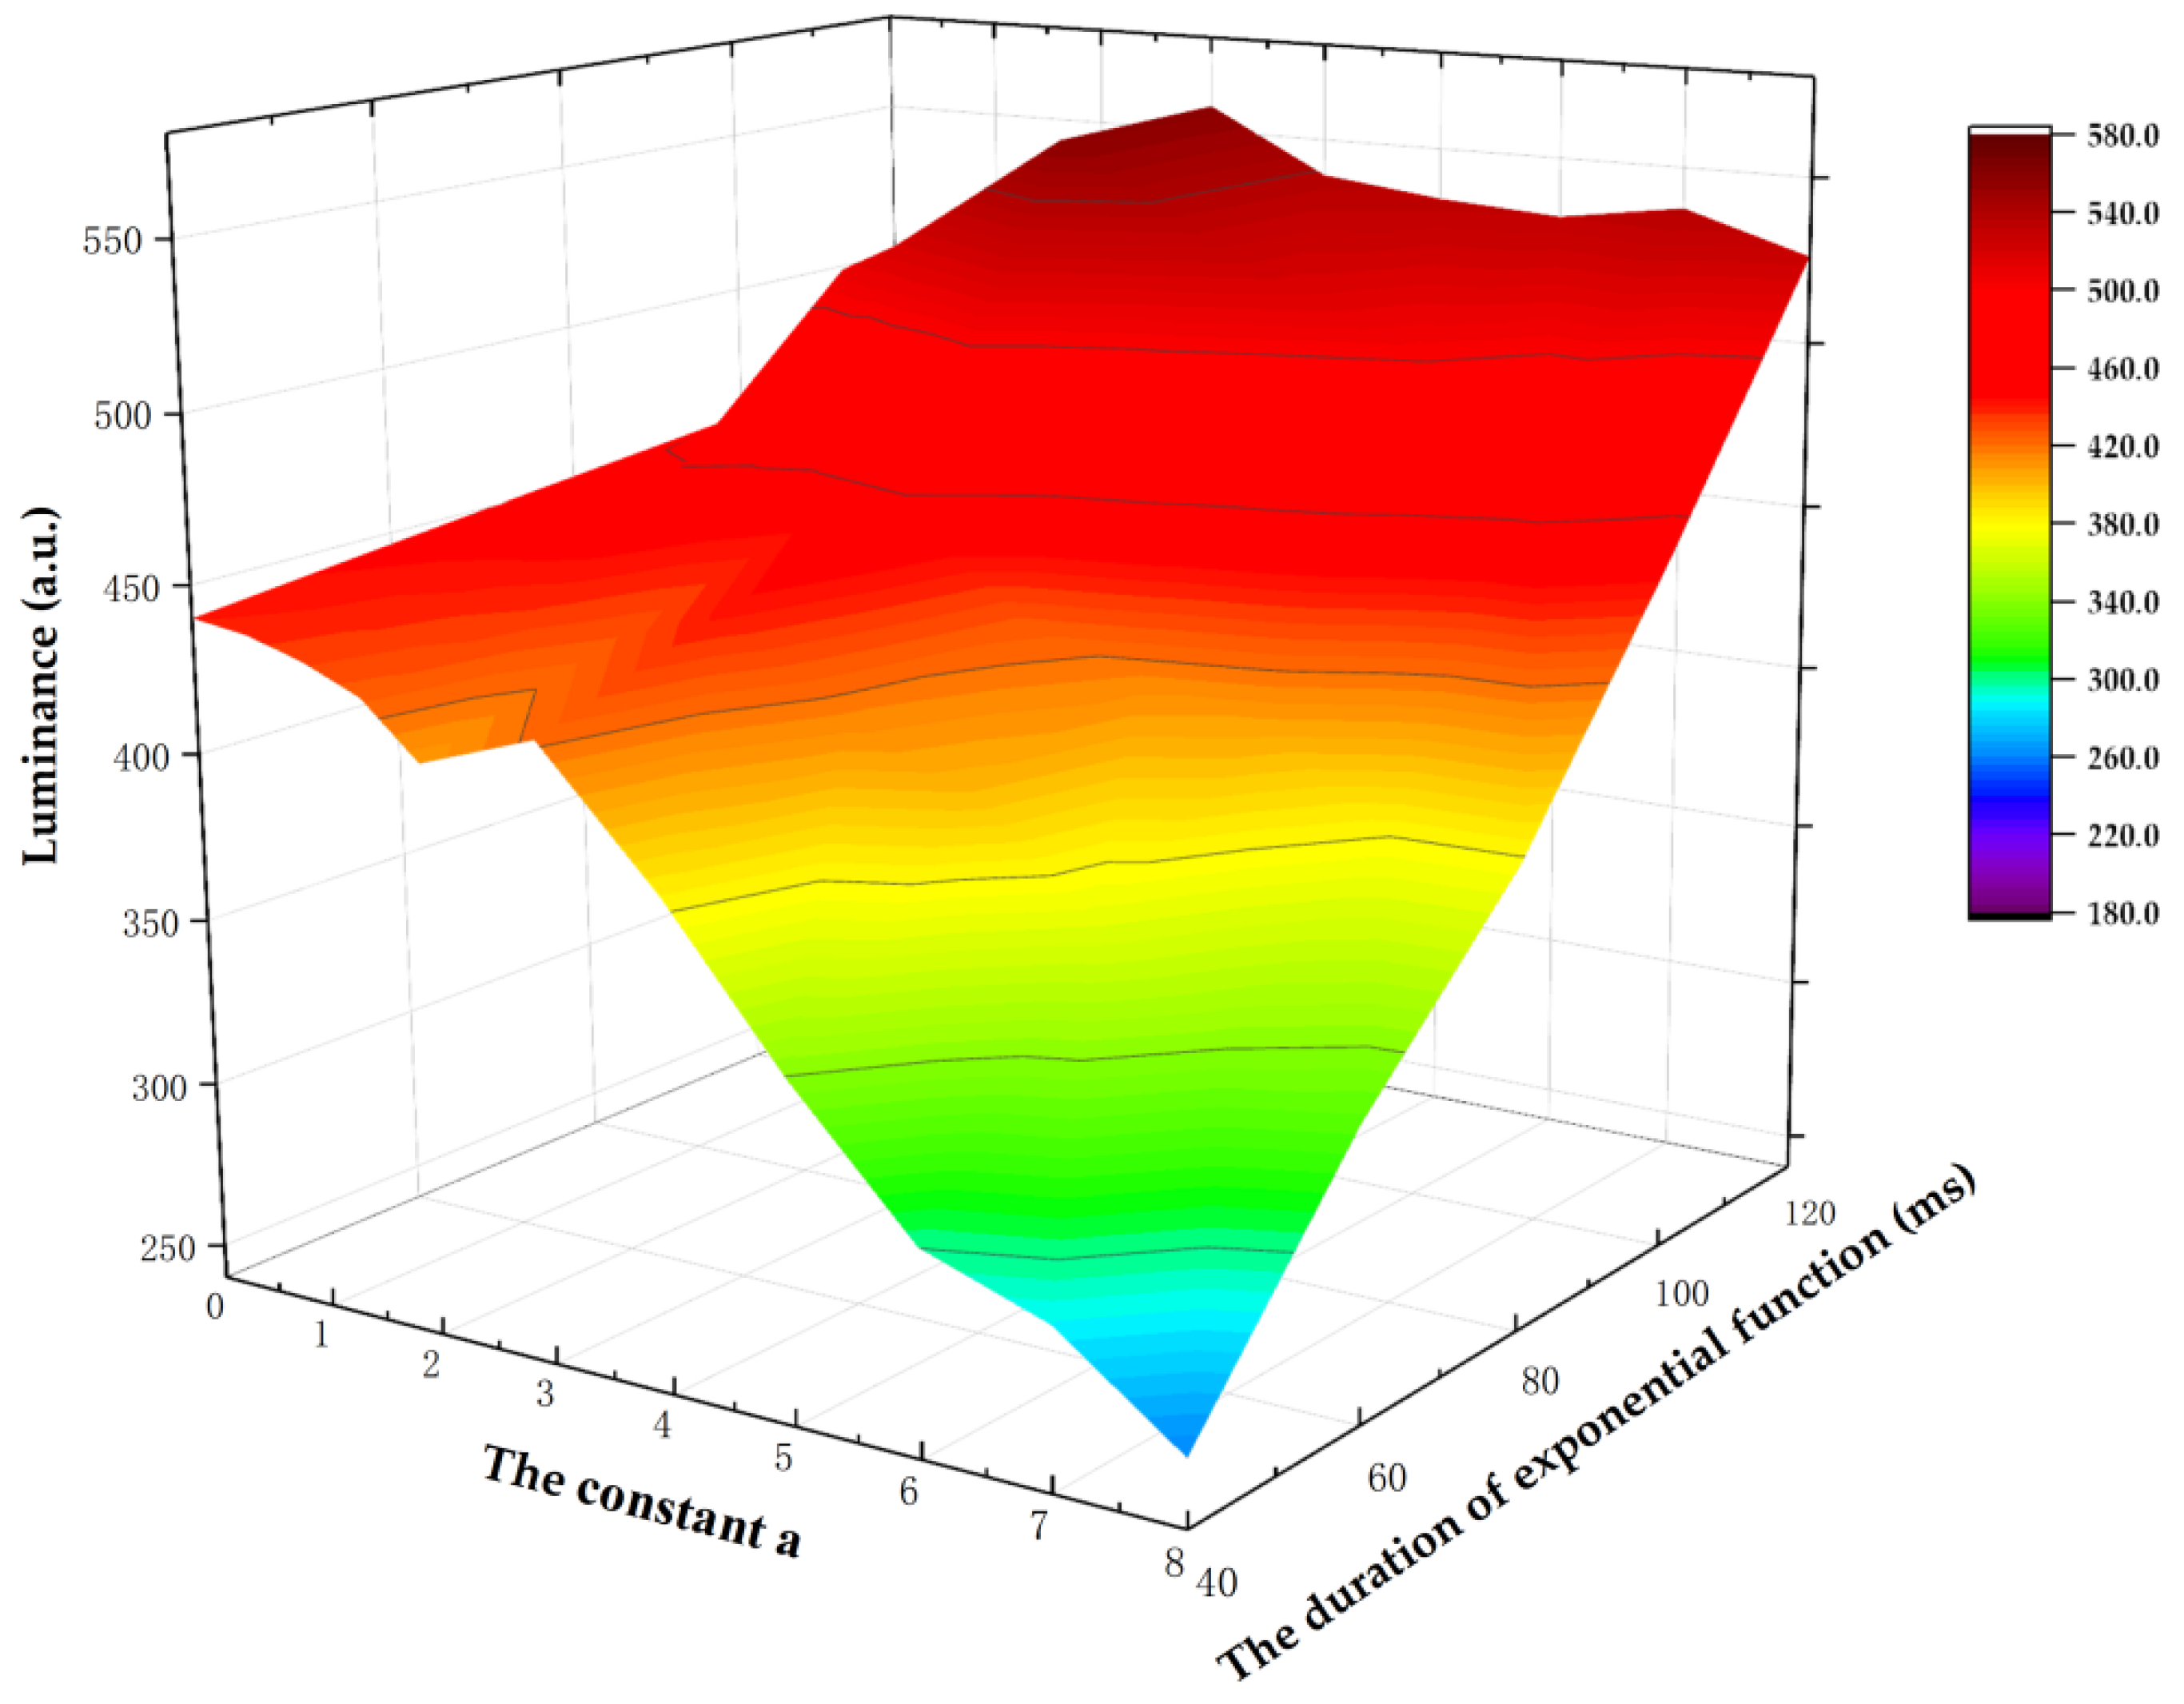
3.3. Optimization of Oil Splitting Suppression Stage

A power function waveform was used in the oil splitting suppression stage. The optimal parameters for a and T s needed to be tested to obtain a good driving effect. The driving waveform approached a square wave when a was greater than 8, so a was set to 0, 0.5, 1, 1.5, 2, 3, 4, 5, 6, 7 and 8 in the experiment. T s was set to 40 ms to 120 ms because pixels could not be turned on when T s was short, and the response time was affected when T s was long. The results of our experiment are shown in Figure 7 and Table 2. The experimental data showed that when a was set to 0 and 0.5, the luminance value was less than 500 due to severe oil splitting caused by voltage mutation. When a was set to 1 and 1.5, oil splitting was still caused, but the oil recombined as T s increased. The luminance value was increased when a was increased from 2 to 3, and it was decreased when a was increased from 3 to 8. This was because the voltage slope was small, and the oil slowly shrank when a was less than 3. The voltage slope was large, and the oil was split when a was greater than 3. In addition, it can also be seen that the luminance value was directly proportional to T s . The luminance value changed suddenly when T s increased from 80 ms to 100 ms, and it remained almost unchanged when T s increased from 100 ms to 120 ms. The reason for this phenomenon was that oil splitting had been suppressed and a large voltage was required to turn on pixels. Therefore, a was set to 3, and T s was set to 100 ms for a maximum luminance value in this stage.

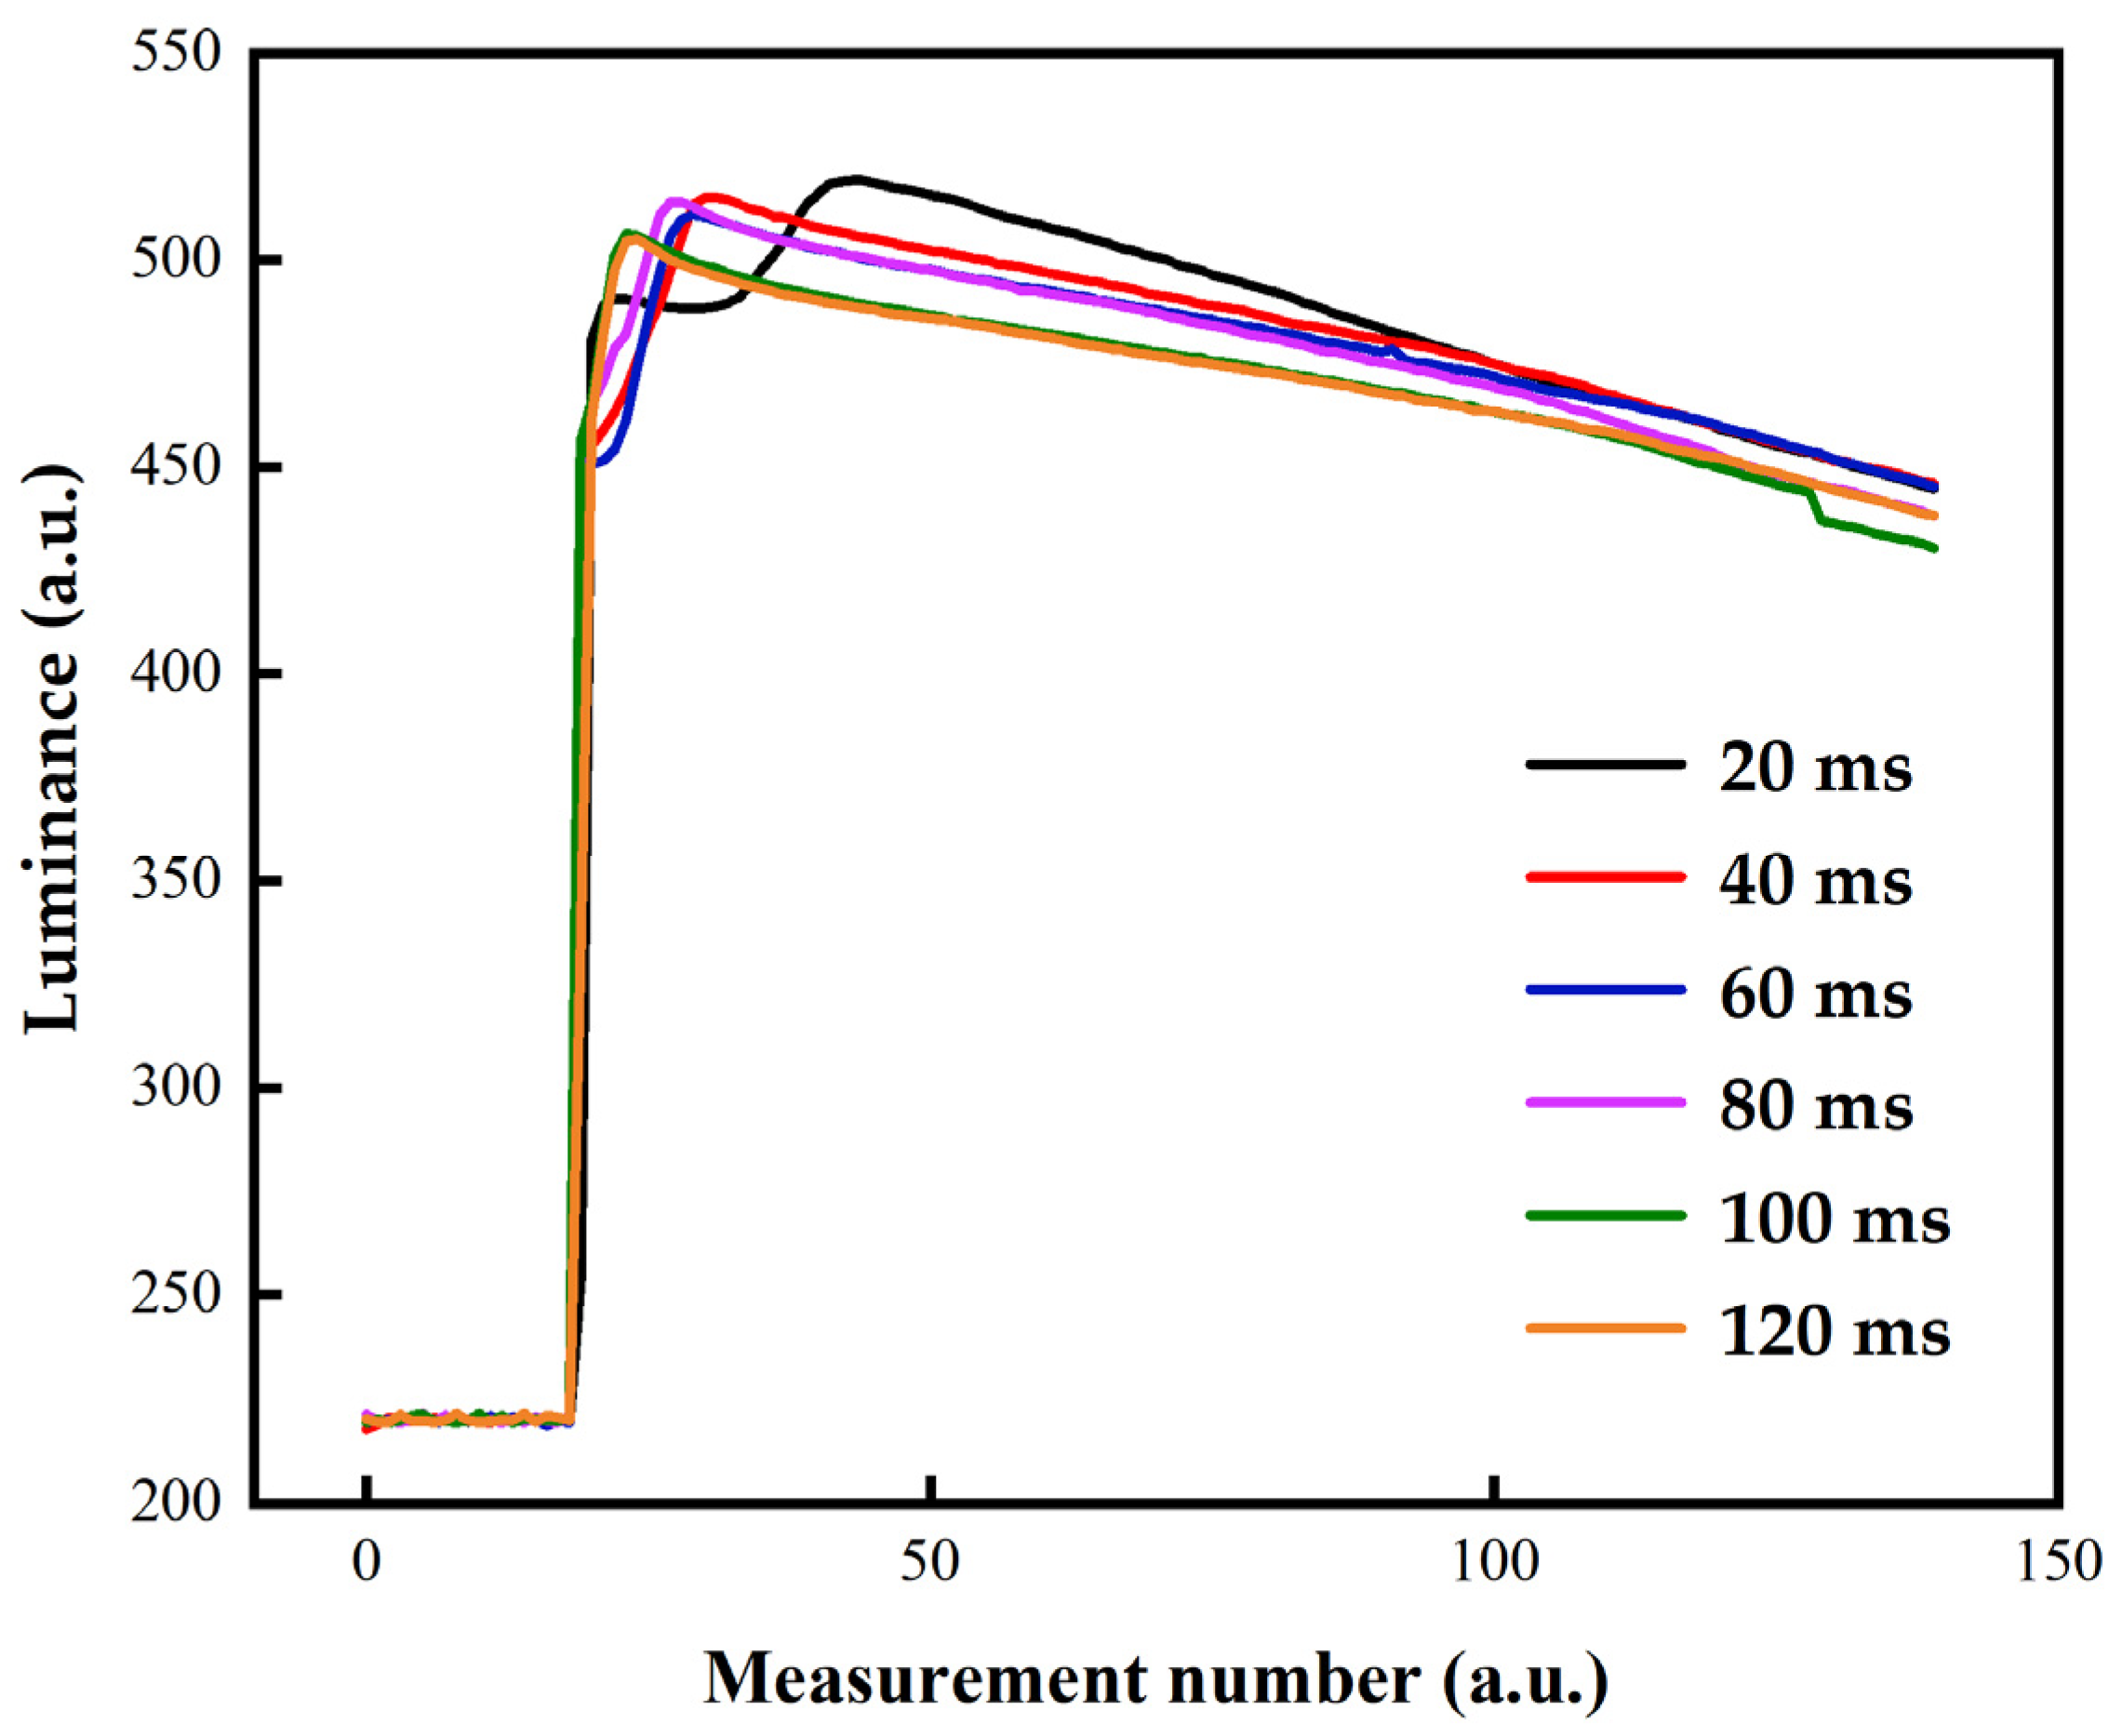
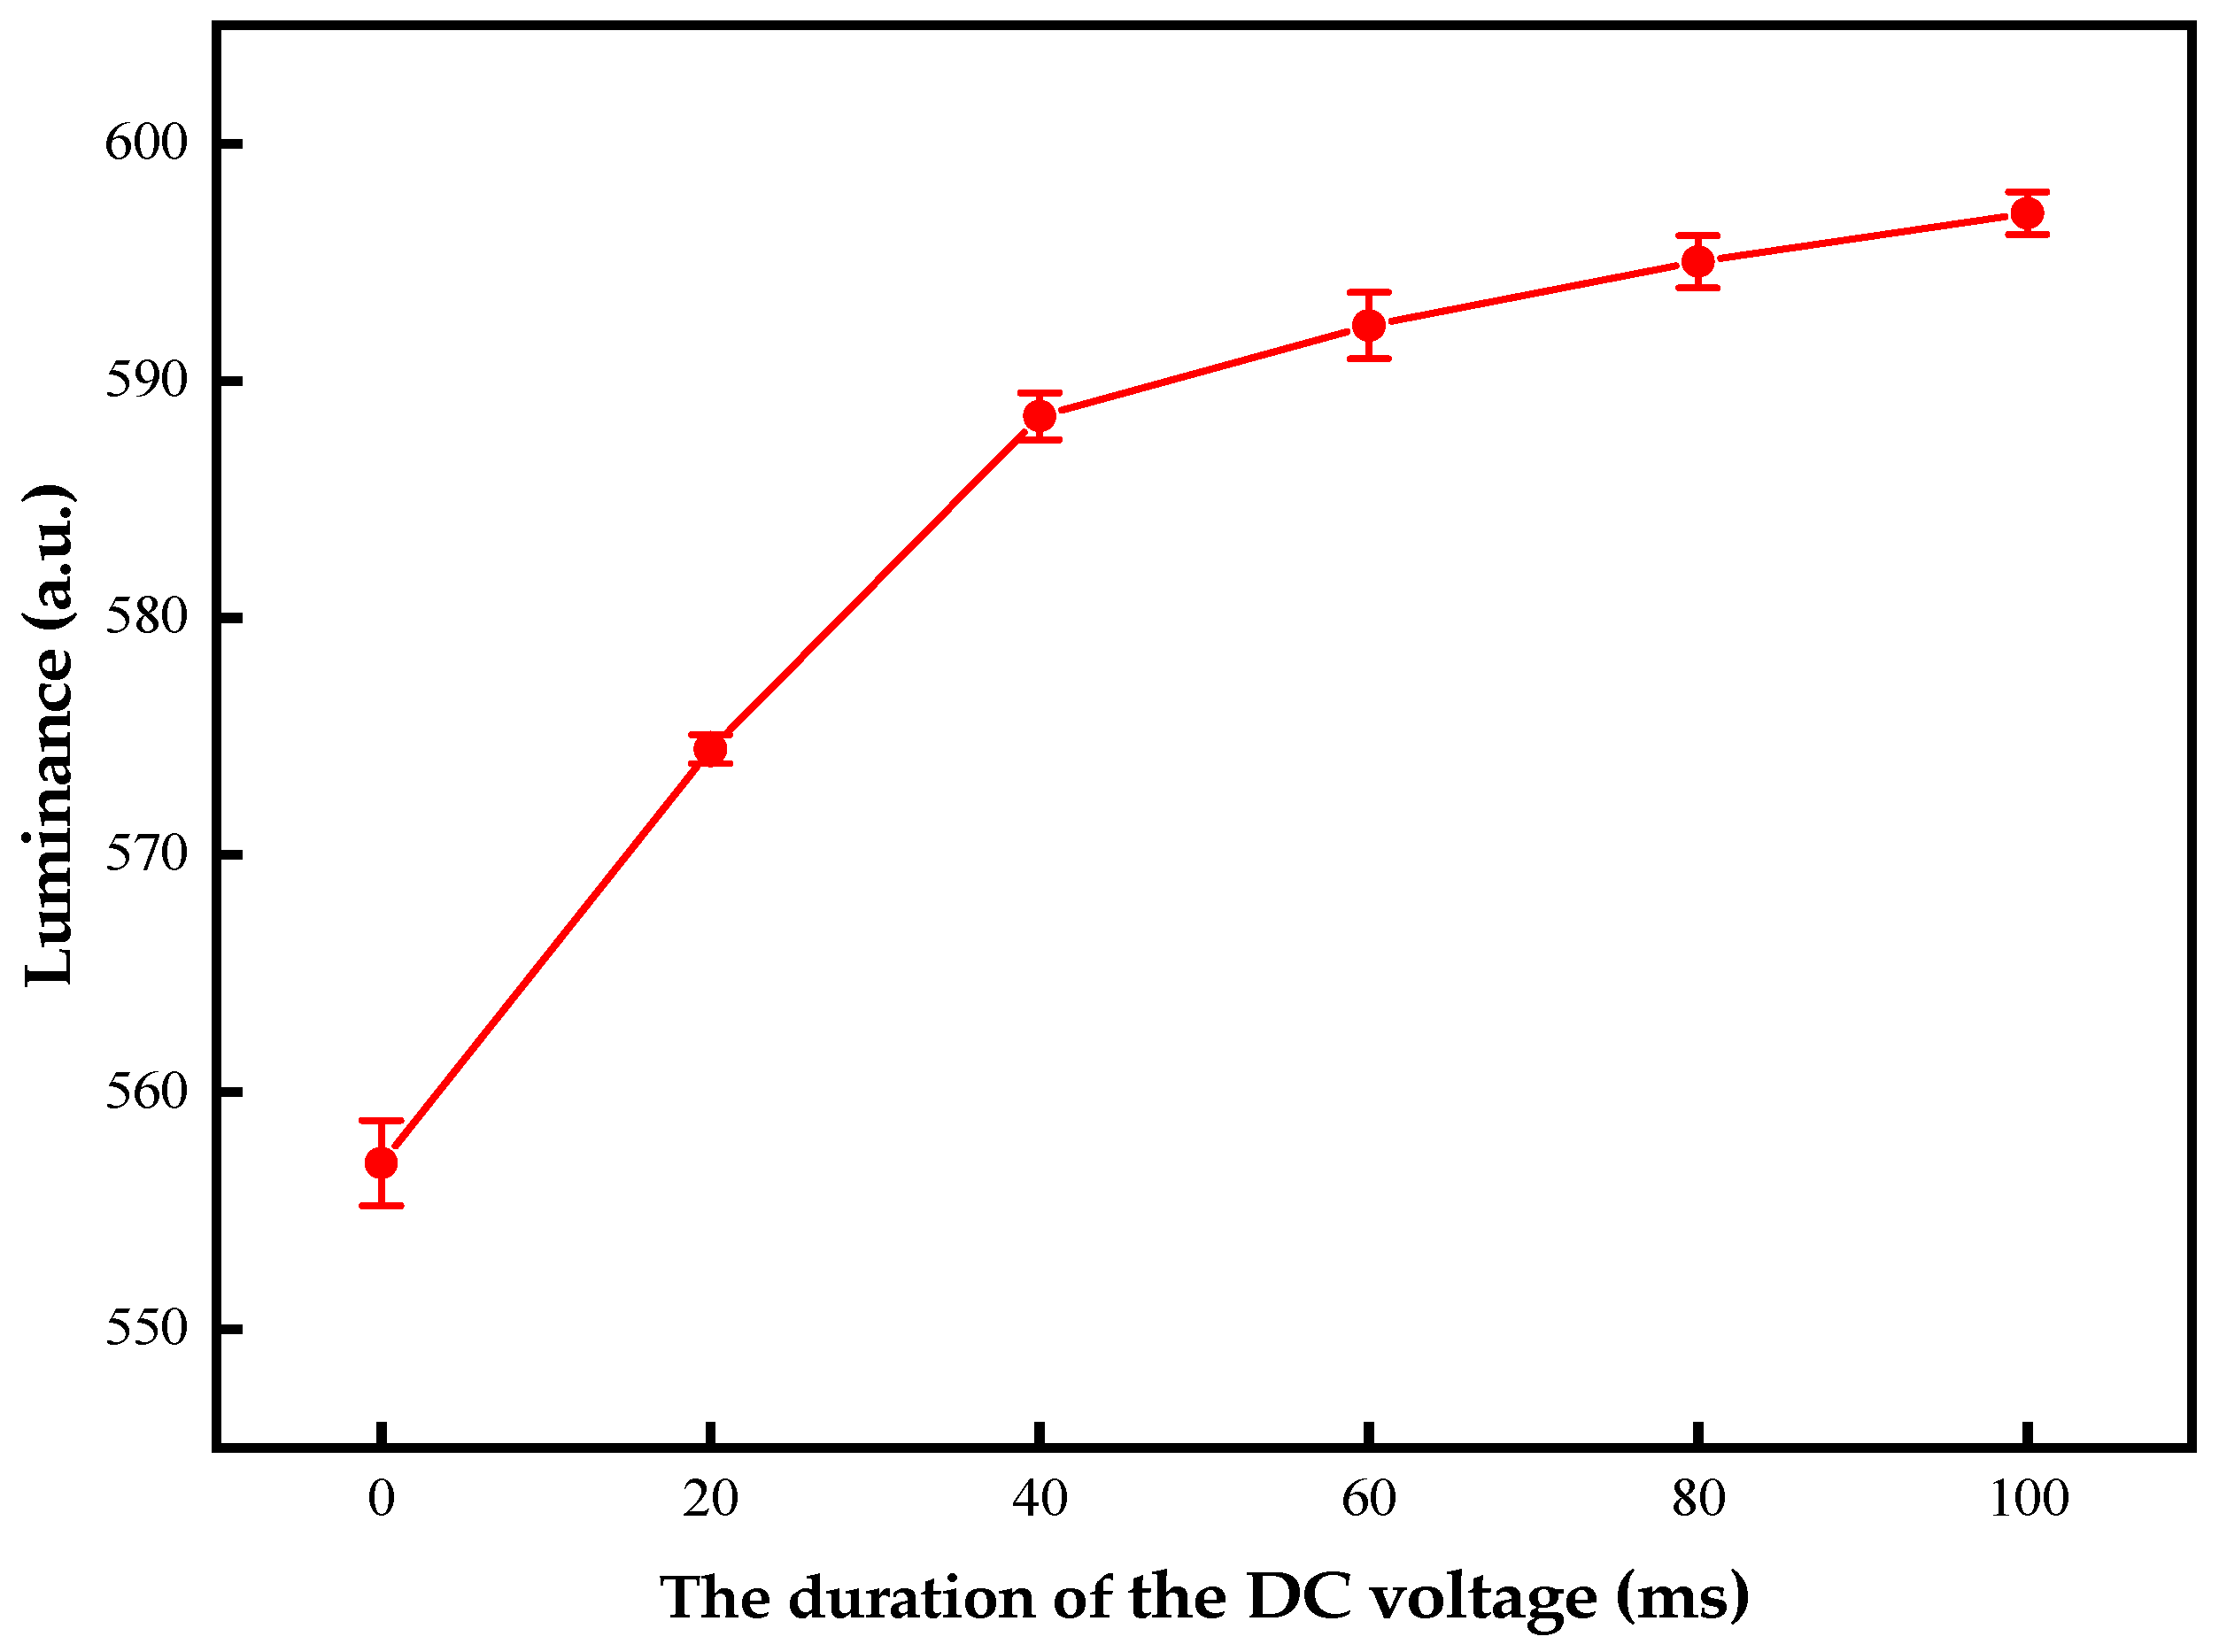
3.4. Optimization of DC Driving Stage

The DC driving stage was added after the oil splitting suppression stage since pixels could not be turned on efficiently by extending T s . T D could not be set too long due to the limitation of response time. It was set to 0 ms to 100 ms in this experiment. Figure 8 shows the relationship between luminance values and T D s. It can be clearly seen that the luminance value increased with the increase in T D . Oil could be driven effectively when T D was less than 40 ms. The increase in luminance value was so small that the human eye could not distinguish the difference when T D was greater than 40 ms. Therefore, the optimal T D was set to 40 ms.

3.5. Optimization of Oil Stabilization Stage

In order to obtain a stable grayscale after oil shrinkage, the voltage slope during this stage should be equal to the voltage slope of V G . Different voltage slopes were tested in the experiment. Voltage slopes were set to 0 mV/s, 25 mV/s, 50 mV/s, 75 mV/s and 100 mV/s, respectively. The test results are shown in Figure 9. The interval between each measurement is 110 ms. It can be seen that the luminance value increased rapidly when voltages were applied. Then, the luminance value decreased with time when slopes were 0 mV/s and 25 mV/s. This phenomenon proved that oil backflow was caused. The luminance value was increased when the slope was greater than 50 mV/s. This was because the voltage slope during this stage was greater than the voltage slope of V G . However, it was designed to stabilize oil at this stage, so an increase in luminance value should also be avoided. The luminance curve remained stable when the slope was 50 mV/s, so the voltage slope of this stage was set to 50 mV/s.

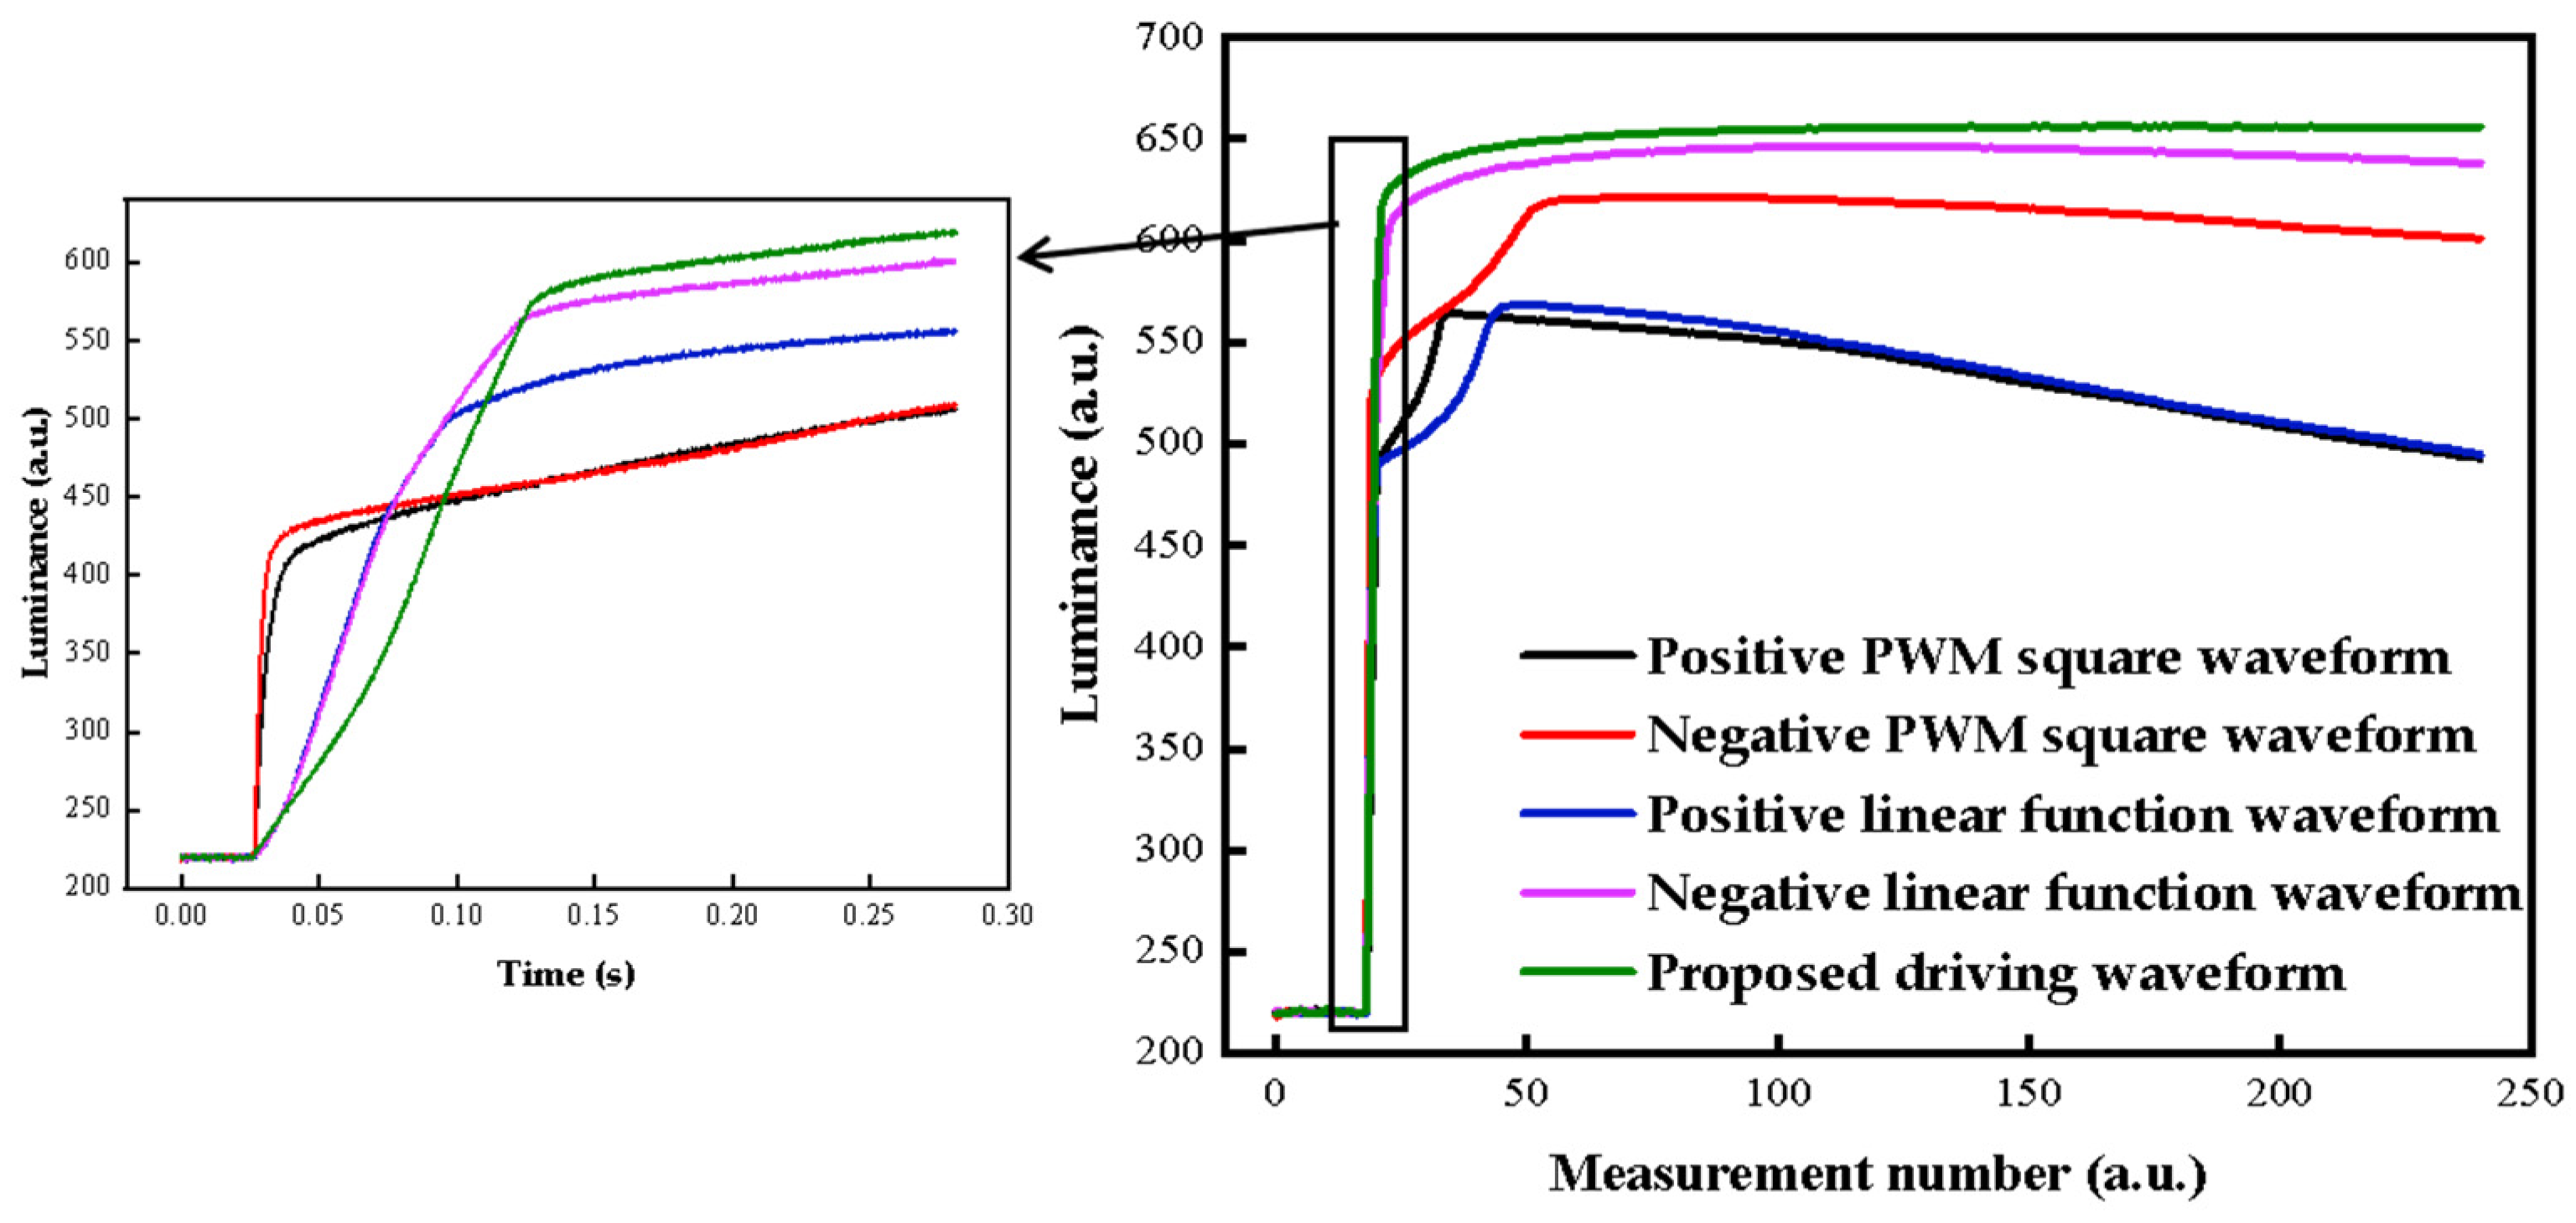
3.6. Performance Comparison of Driving Waveforms

Two conventional driving waveforms were used for comparison. As shown in Figure 10, the black curve was a PWM square waveform, and the red curve was a linear function waveform. Both of them were divided into an oil shrinking stage and a DC driving stage [17,24]. T S 1 and T D 1 are the durations of the oil shrinking stage and the DC driving stage. In order to compare the performance of driving waveforms, the effect of different slopes of linear function on performance was tested. T S 1 s were set to 20 ms, 40 ms, 60 ms, 80 ms, 100 ms and 120 ms, respectively. T D 1 was set to 30 s. V t h and V M were set to ±10 V and ±35 V, respectively. As shown in Figure 11, the luminance value increased rapidly and then slowly when T S 1 was set to 20 ms. As T S 1 increased, this secondary rise phenomenon was weakened. When T S 1 s were set to 100 ms and 120 ms, the luminance curves almost coincided and oil splitting was suppressed. Therefore, T S 1 was set to 100 ms for a short response time.
Conventional driving waveforms with negative voltages were also used for comparison. The PWM square waveform with a negative voltage was defined as a negative PWM square waveform, and the other three driving waveforms were defined in the same way.
Luminance curves corresponding to the different driving waveforms when the EWD was applied with these driving waveforms are shown in Figure 12. The black, red, blue, purple and green curves represent the positive PWM square waveform, the negative PWM square waveform, the positive linear function waveform, the negative linear function waveform and the proposed driving waveform, respectively. Obviously, the EWD could be driven to a higher luminance value with negative voltages compared to positive voltages. Therefore, only the performance of the negative PWM square waveform, the negative linear function waveform and the proposed driving waveform were compared by us. The luminance was increased most quickly at first when the EWD was driven by the negative PWM square waveform, but the lowest luminance was obtained. Its response time was 12 ms, and its saturation luminance value was 429.775. Furthermore, a secondary rise in luminance value occurred because the split oil was recombined. The luminance curve oscillated significantly, so the performance of the negative PWM square waveform was the worst. In addition, it can be seen from the purple and green curves that oil splitting was suppressed by the negative linear function waveform and the proposed driving waveform. The proposed driving waveform had a shorter response time and the maximum luminance value, which were 104 ms and 591.367, respectively. Compared with the negative PWM square waveform, the luminance value could be increased by 37.6%. Compared with the negative linear function waveform, the response time could be shortened by 16.1%, and the luminance value could be increased by 3.8%. In order to compare the performance directly, the parameters of these driving waveforms are shown in Figure 13. Moreover, luminance values of the PWM square waveform and the linear function waveform were decreased because the trapped charges were not released. The luminance value of the proposed driving waveform was perfectly stabilized at the saturation value.

4. Conclusions

In order to reduce oil splitting and stabilize grayscales of EWDs, a novel driving waveform was proposed in this paper. Firstly, it was proven that the response time could be reduced by a threshold voltage and a DC driving voltage. Then, it was found that a higher aperture ratio could be obtained by negative voltages compared with positive voltages in the process of measuring the threshold voltage. In addition, oil splitting and oil backflow could be effectively suppressed by a power function waveform and a linear waveform, respectively. A better driving effect could be obtained by the proposed driving waveform compared with conventional driving waveforms, which increases its potential application in the display field. Subsequently, we will develop a driver platform based on Field Programmable Gate Array (FPGA) to realize video playback function.

Author Contributions

L.T. designed this project. H.Z. and Z.Y. wrote the initial draft of the manuscript. B.Z. and R.Z. carried out most of the experiments and data analysis. G.Z. and J.G. revised the paper. All authors have read and agreed to the published version of the manuscript.

Funding

This research was funded by the National Key R&D Program of China (No. 2021YFB3600603), the National Natural Science Foundation of China (No.62105056), Science and Technology Program of Guangzhou (No. 2019050001), Program for Guangdong Innovative and Entrepreneurial Teams (No. 2019BT02C241), Program for Chang Jiang Scholars and Innovative Research Teams in Universities (No. IRT_17R40), Guangdong Provincial Key Laboratory of Optical Information Materials and Technology (No. 2017B030301007), Guangzhou Key Laboratory of Electronic Paper Displays Materials and Devices (No. 201705030007), MOE International Laboratory for Optical Information Technologies and the 111 Project.

Conflicts of Interest

The authors declare no conflict of interest.

References

  1. You, H.; Steckl, A.J. Three-color electrowetting display device for electronic paper. Appl. Phys. Lett. 2010, 97, 023514. [Google Scholar] [CrossRef] [Green Version]
  2. Shui, L.L.; Hayes, R.A.; Jin, M.L.; Zhang, X.; Bai, P.F.; van den Berg, A.; Zhou, G.F. Microfluidics for electronic paper-like displays. Lab Chip 2014, 14, 2374–2384. [Google Scholar] [CrossRef]
  3. Shen, S.T.; Gong, Y.G.; Jin, M.L.; Yan, Z.B.; Xu, C.; Yi, Z.C.; Zhou, G.F.; Shui, L.L. Improving Electrophoretic Particle Motion Control in Electrophoretic Displays by Eliminating the Fringing Effect via Driving Waveform Design. Micromachines 2018, 9, 143. [Google Scholar] [CrossRef] [PubMed] [Green Version]
  4. Luo, Z.; Luo, J.; Zhao, W.; Cao, Y.; Lin, W.; Zhou, G. A high-resolution and intelligent dead pixel detection scheme for an electrowetting display screen. Opt. Rev. 2017, 25, 18–26. [Google Scholar] [CrossRef]
  5. Li, D.D.; Lai, W.Y.; Zhang, Y.Z.; Huang, W. Printable Transparent Conductive Films for Flexible Electronics. Adv. Mater. 2018, 30, 1704738. [Google Scholar] [CrossRef]
  6. Bai, P.F.; Hayes, R.A.; Jin, M.L.; Shui, L.L.; Yi, Z.C.; Wang, L.; Zhang, X.; Zhou, G.F. Review of paper-like display technologies. Prog. Electromagn. Res. 2014, 147, 95–116. [Google Scholar] [CrossRef] [Green Version]
  7. Jin, M.L.; Shen, S.T.; Yi, Z.C.; Zhou, G.F.; Shui, L.L. Optofluid-Based Reflective Displays. Micromachines 2018, 9, 159. [Google Scholar] [CrossRef] [Green Version]
  8. Zhou, M.; Zhao, Q.; Tang, B.; Groenewold, J.; Hayes, R.A.; Zhou, G.F. Simplified dynamical model for optical response of electrofluidic displays. Displays 2017, 49, 26–34. [Google Scholar] [CrossRef]
  9. Liu, L.W.; Bai, P.F.; Yi, Z.C.; Zhou, G.F. A Separated Reset Waveform Design for Suppressing Oil Backflow in Active Matrix Electrowetting Displays. Micromachines 2021, 12, 491. [Google Scholar] [CrossRef]
  10. Hayes, R.; Feenstra, B. Video-speed electronic paper based on electrowetting. Nature 2003, 425, 383–385. [Google Scholar] [CrossRef]
  11. Li, W.; Wang, L.; Zhang, T.Y.; Lai, S.F.; Liu, L.W.; He, W.Y.; Zhou, G.F.; Yi, Z.C. Driving Waveform Design with Rising Gradient and Sawtooth Wave of Electrowetting Displays for Ultra-Low Power Consumption. Micromachines 2020, 11, 145. [Google Scholar] [CrossRef] [PubMed] [Green Version]
  12. Zhao, Q.; Tang, B.; Dong, B.Q.; Li, H.; Zhou, R.; Guo, Y.Y.; Dou, Y.Y.; Deng, Y. Electrowetting on dielectric: Experimental and model study of oil conductivity on rupture voltage. J. Phys. D Appl. Phys. 2018, 51, 195102. [Google Scholar] [CrossRef]
  13. Li, X.M.; Tian, H.M.; Shao, J.Y.; Ding, Y.C.; Chen, X.L.; Wang, L.; Lu, B.H. Decreasing the Saturated Contact Angle in Electrowetting-on-Dielectrics by Controlling the Charge Trapping at Liquid-Solid Interfaces. Adv. Funct. Mater. 2016, 26, 2994–3002. [Google Scholar] [CrossRef]
  14. Luo, Z.J.; Fan, J.J.; Xu, J.Z.; Zhou, G.F.; Liu, S.Y. A novel driving scheme for oil-splitting suppression in Electrowetting display. Opt. Rev. 2020, 27, 339–345. [Google Scholar] [CrossRef]
  15. Roques-Carmes, T.; Hayes, R.A.; Feenstra, B.J.; Schlangen, L.J.M. Liquid behavior inside a reflective display pixel based on electrowetting. J. Appl. Phys. 2004, 95, 4389–4396. [Google Scholar] [CrossRef]
  16. Blankenbach, K.; Schmoll, A.; Bitman, A.; Bartels, F.; Jerosch, D. Novel highly reflective and bistable electrowetting displays. J. Soc. Inf. Disp. 2008, 16, 237–244. [Google Scholar] [CrossRef]
  17. Annapragada, S.R.; Dash, S.; Garimella, S.V.; Murthy, J.Y. Dynamics of Droplet Motion under Electrowetting Actuation. Langmuir 2011, 27, 8198–8204. [Google Scholar] [CrossRef]
  18. Gao, J.; Mendel, N.; Dey, R.; Baratian, D.; Mugele, F. Contact angle hysteresis and oil film lubrication in electrowetting with two immiscible liquids. Appl. Phys. Lett. 2018, 112, 203703. [Google Scholar] [CrossRef] [Green Version]
  19. Roques-Carmes, T.; Hayes, R.A.; Schlangen, L.J.M. A physical model describing the electro-optic behavior of switchable optical elements based on electrowetting. J. Appl. Phys. 2004, 96, 6267–6271. [Google Scholar] [CrossRef]
  20. Wu, H.; Dey, R.; Siretanu, I.; van den Ende, D.; Shui, L.L.; Zhou, G.F.; Mugele, F. Electrically Controlled Localized Charge Trapping at Amorphous Fluoropolymer-Electrolyte Interfaces. Small 2020, 16, 1905726. [Google Scholar] [CrossRef]
  21. He, T.; Jin, M.; Eijkel, J.C.T.; Zhou, G.; Shui, L. Two-phase microfluidics in electrowetting displays and its effect on optical performance. Biomicrofluidics 2016, 10, 011908. [Google Scholar] [CrossRef] [PubMed] [Green Version]
  22. Lu, Y.; Tang, B.; Yang, G.S.; Guo, Y.Y.; Liu, L.W.; Henzen, A. Progress in Advanced Properties of Electrowetting Displays. Micromachines 2021, 12, 206. [Google Scholar] [CrossRef] [PubMed]
  23. Yi, Z.C.; Huang, Z.Y.; Lai, S.F.; He, W.Y.; Wang, L.; Chi, F.; Zhang, C.F.; Shui, L.L.; Zhou, G.F. Driving Waveform Design of Electrowetting Displays Based on an Exponential Function for a Stable Grayscale and a Short Driving Time. Micromachines 2020, 11, 313. [Google Scholar] [CrossRef] [Green Version]
  24. Yi, Z.C.; Feng, W.Y.; Wang, L.; Liu, L.M.; Lin, Y.; He, W.Y.; Shui, L.L.; Zhang, C.F.; Zhang, Z.; Zhou, G.F. Aperture Ratio Improvement by Optimizing the Voltage Slope and Reverse Pulse in the Driving Waveform for Electrowetting Displays. Micromachines 2019, 10, 862. [Google Scholar] [CrossRef] [PubMed] [Green Version]
  25. Yi, Z.C.; Feng, H.Q.; Zhou, X.F.; Shui, L.L. Design of an Open Electrowetting on Dielectric Device Based on Printed Circuit Board by Using a Parafilm M. Front. Phys. 2020, 8, 193. [Google Scholar] [CrossRef]
  26. Zhang, T.Y.; Deng, Y. Driving Waveform Design of Electrowetting Displays Based on a Reset Signal for Suppressing Charge Trapping Effect. Front. Phys. 2021, 9, 672541. [Google Scholar] [CrossRef]
  27. Chiu, Y.H.; Liang, C.C.; Chen, Y.C.; Lee, W.Y.; Chen, H.Y.; Wu, S.H. Accurate-gray-level and quick-response driving methods for high-performance electrowetting displays. J. Soc. Inf. Disp. 2011, 19, 741–748. [Google Scholar] [CrossRef]
  28. Liu, L.W.; Wu, Z.Y.; Wang, L.; Zhang, T.Y.; Li, W.; Lai, S.F.; Bai, P.F. Design of an AC Driving Waveform Based on Characteristics of Electrowetting Stability for Electrowetting Displays. Front. Phys. 2020, 8, 618752. [Google Scholar] [CrossRef]
  29. Tang, B.; Groenewold, J.; Zhou, M.; Hayes, R.A.; Zhou, G.F. Interfacial electrofluidics in confined systems. Sci. Rep. 2016, 6, 26593. [Google Scholar] [CrossRef] [Green Version]
  30. Li, F.; Mugele, F. How to make sticky surfaces slippery: Contact angle hysteresis in electrowetting with alternating voltage. Appl. Phys. Lett. 2008, 92, 244108. [Google Scholar] [CrossRef] [Green Version]
  31. Mugele, F.; Baret, J.C. Electrowetting: From basics to applications. J. Phys. 2005, 17, R705–R774. [Google Scholar] [CrossRef]
  32. Zhang, X.M.; Bai, P.F.; Hayes, R.A.; Shui, L.L.; Jin, M.L.; Tang, B.; Zhou, G.F. Novel Driving Methods for Manipulating Oil Motion in Electrofluidic Display Pixels. J. Disp. Technol. 2016, 12, 200–205. [Google Scholar] [CrossRef]
  33. Massard, R.; Mans, J.; Adityaputra, A.; Leguijt, R.; Staats, C.; Giraldo, A. Colored oil for electrowetting displays. J. Inf. Disp. 2013, 14, 1–6. [Google Scholar] [CrossRef]
Figure 1. Three-dimensional structure diagram of one pixel in EWD. Each pixel consists of a top plate, a substrate, two electrode plates, colored oil, NaCl aqueous solution, an insulator layer, pixel walls and an EPS.
Electronics 11 02081 g001
Figure 2. Two-dimensional structure diagram of one pixel in EWD. (a) The color of oil can be displayed when driving voltage is 0 V. (b) The color of the substrate can be displayed when driving voltage is greater than the threshold voltage.
Electronics 11 02081 g002
Figure 3. A schematic diagram of the proposed driving waveform for EWDs. S 1 is an oil splitting suppression stage, S 2 is a DC driving stage, and S 3 is an oil stabilization stage. V M is the voltage at which pixels can be driven to a target grayscale. V t h is the positive threshold voltage of EWDs. V v t h is the negative threshold voltage. T S , T D and T O are durations of the oil splitting suppression stage, the DC driving stage and the oil stabilization stage.
Electronics 11 02081 g003
Figure 4. An EWD and a pixel. The pictures were taken by a mobile phone and a microscope. The EWD was used in our experiments.
Electronics 11 02081 g004
Figure 5. The relationship curves of luminance values and different DC voltages. (a) The EWD was driven by a positive DC voltage, and its range was 0 V to 35 V. (b) The EWD was driven by a negative DC voltage, and its range was 0 V to −35 V.
Electronics 11 02081 g005
Figure 6. A schematic diagram of one cycle of the proposed driving waveform. It was optimized based on the threshold voltage of EWD.
Electronics 11 02081 g006
Figure 7. Luminance values when the EWD was driven by different a values and T s values. The maximum luminance value could be obtained when a was set to 3 and T s was set to 100 ms.
Electronics 11 02081 g007
Figure 8. The luminance curve when the EWD was driven by a DC voltage in the DC driving stage. The luminance value was proportional to the driving time. T D was set to 40 ms to shorten the response time.
Electronics 11 02081 g008
Figure 9. Luminance curves when the EWD was driven by voltages with different slopes in the oil stabilization stage. The luminance curve remained stable, and oil could be stabilized when the voltage slope was set to 50 mV/s.
Electronics 11 02081 g009
Figure 10. A schematic diagram of two conventional driving waveforms for EWDs. Both of them are composed of an oil shrinking stage and a DC driving stage. T S 1 and T D 1 are the durations of the oil shrinking stage and the DC driving stage.
Electronics 11 02081 g010
Figure 11. Luminance curves when the EWD was driven by voltages with different slopes of linear function. Oil splitting can be suppressed when T S 1 is set to 100 ms and 120 ms. T S 1 was set to 100 ms for a short response time.
Electronics 11 02081 g011
Figure 12. Performance comparison of driving waveforms. Luminance curves changed with time by conventional driving waveforms and the proposed driving waveform. The maximum luminance value could be obtained when the EWD was driven by the proposed driving waveform.
Electronics 11 02081 g012
Figure 13. Pixel images and luminance values when the EWD was driven by different driving waveforms. (a) The EWD was driven by the positive PWM square waveform. (b) The EWD was driven by the negative PWM square waveform. (c) The EWD was driven by the positive linear function waveform. (d) The EWD was driven by the negative linear function waveform. (e) The EWD was driven by the proposed driving waveform.
Electronics 11 02081 g013
Table 1. Parameters of experimental instruments.
NameModelBrandRegionCountry
Function generatorAFG3022CTektronixBeavertonUSA
Voltage amplifierATA-2022H AgitekXianChina
ColorimeterArges-45AdmesyIttervoortNetherlands
ComputerH430LenovoBeijingChina
MicroscopeSZ680CnoptecChongqingChina
Table 2. Luminance values when the EWD was driven by different a values and T s values.
a / T s 40 ms60 ms80 ms100 ms120 ms
0440.294446.657452.792458.785464.608
0.5437.85443.94457.044469.691480.899
1432.642441.537459.17509.923521.182
1.5425.089437.411450.145519.337530.381
2408.986427.506443.689531.848542.352
3421.623441.799457.414556.987558.095
4383.879414.123427.55535.412538.86
5338.916400.065416.199516.78534.414
6300.147369.065405.117501.701531.941
7287.367340.183380.038483.118537.67
8259.716325.923378.029449.279526.248
Publisher’s Note: MDPI stays neutral with regard to jurisdictional claims in published maps and institutional affiliations.

