Abstract
This paper presents a framework that can automatically analyze the images and comments in user-uploaded location databases. The proposed framework integrates image processing and natural language processing techniques to perform scene classification, data cleaning, and comment summarization so that the cluttered information in user-uploaded databases can be presented in an organized way to users. For scene classification, RGB image features, segmentation features, and the features of discriminative objects are fused with an attention module to improve classification accuracy. For data cleaning, incorrect images are detected using a multilevel feature extractor and a multiresolution distance calculation scheme. Finally, a comment summarization scheme is proposed to overcome the problems of unstructured sentences and the improper usage of punctuation marks, which are commonly found in customer reviews. To validate the proposed framework, a system that can classify and organize scenes and comments for hotels is implemented and evaluated. Comparisons with existing related studies are also performed. The experimental results validate the effectiveness and superiority of the proposed framework.
1. Introduction
Large-scale location databases have become very popular and convenient tools to share or search for information in daily life. Location databases, such as Google Places, Trip Advisor, and Booking.com, contain a large number of photos and reviews about various places. Before visiting a certain location, such as a shop, restaurant, or hotel, one may use a credible location database to check photos and customer reviews. These images and comments provide very important information for customers when choosing a restaurant or a hotel. To rapidly collect information and construct a large global database, these location database services allow registered users to freely upload their photos and comments. As such, location database services provide users a convenient medium to share images and opinions.
However, user-uploaded information is often cluttered and unorganized. Regarding photos, the images might not be categorized. Moreover, uploaded images are not verified for their correctness. Therefore, sometimes, erroneous images that do not belong to a specific place appear under the location label. Human inspection and verification of the photos are not practical due to the massive amount of data. Therefore, automatic data cleaning that can eliminate incorrect images is a very important process if we wish to use noisy data from user-uploaded databases. As for the customer reviews, many places have a large number of reviews or comments associated with them. It is not possible for a user to read through hundreds or thousands of reviews within a short time. People are not able to efficiently understand the advantages and disadvantages of such places. The advancement of artificial intelligence and machine learning provides influential tools to handle big data [1,2]. Therefore, in this study, we propose a system based on artificial intelligence techniques to analyze the images and comments in a user-uploaded database so that the information can be presented in an organized way to users. The proposed system can automatically perform scene classification, data cleaning, and comment summarization for large-scale location databases.
In the existing studies on image classification, ImageNet [3] is used for general object classification. To deal with images related to places, the research in [4] constructed a large-scale dataset called Places365 for scene recognition. Shuang Bai et al. [5] proposed that combining the features extracted using an object-based network and a scene-based network can improve the accuracy of scene classification. Luis Herranz et al. [6] found that adapting a feature extractor to each particular scale and carefully choosing multi-scale combinations of ImageNet-CNNs and Places-CNNs are helpful to improve the recognition rate. Xiaojuan Cheng et al. [7] decided to choose discriminative objects and represent image descriptors with the occurrence probabilities of discriminative objects in order to enhance inter-class discriminability. The method proposed by Alejandro et al. [8] mentioned that the features of semantic segmentation can also be helpful for scene classification.
To eliminate incorrect images, the system performs correctness verification to decide whether the images actually belong to their location label. Based on the observation that most users upload correct images of the same location, incorrect images should be regarded as outliers in an image set with the same location label. However, the images uploaded by different users for the same location may be taken from very different camera angles. A large variety of correct images makes it a very challenging task to identify outliers. A multilevel feature extractor and a multiresolution distance calculation mechanism are used to overcome the challenges of detecting incorrect images.
The third functionality of the purposed framework is performing comment summarization. The comment summarization mechanism in the proposed framework aims to use the natural language processing (NLP) technique to automatically analyze reviews and provide users with organized information that can be efficiently comprehended. In the existing literature of NLP, the purpose of article summarization or abstract generation is to extract important information from a long article and use it to produce more concise results. Abstract generation methods can be divided into two types, extractive and abstractive. An extractive abstract selects important sentences from an article and presents them in the abstract. However, an abstractive abstract includes additional sentences or words that are not found in the original article to make the abstract more coherent and fluent. T5 [9] is one of the state-of-the-art abstractive article summarization methods, and it is based on the transformer [10] architecture. It is trained in an end-to-end manner with text as input and modified text as its output. BART [11] is also based on the transformer architecture. It can learn the characteristics of an article and fine-tune the summarization task through a pretrained model to achieve the best results at the time.
Article summarization models, such as T5 [9] and BART [11], are trained on datasets, such as CNN/DailyMail [12] and XSum [13], which include news, journal, and other types of articles. Most of them have a specific paragraph format and contextual relationship between sentences [14]. However, customer reviews for places tend to be incohesive and unstructured without any paragraph organization. Sometimes, the comments are only phrases instead of complete sentences. Therefore, the previously mentioned summarization models are unsuitable when applied to customer reviews. To achieve the goal of comment summarization, we require that the boundaries of the comments are automatically detected. Moreover, keywords should be automatically extracted from customer reviews. Then, based on the extracted keywords, meaningful summaries could be generated.
As stated in the previous paragraphs, the proposed system framework integrates image processing and natural language processing techniques to achieve the goal of coordinating user-uploaded information in large-scale location databases. The main contributions of this work include the following:
- (1)
- This work proposes the concept of an automatic analysis of images and comments in large-scale location databases based on artificial intelligence techniques to provide organized and useful information to users.
- (2)
- RGB image features, segmentation features, and the features of discriminative objects are integrated with attention modules to improve scene classification.
- (3)
- An automatic image data cleaning mechanism with a multilevel feature extractor and a multiresolution distance calculation mechanism is integrated into the framework.
- (4)
- A comment summarization mechanism that can deal with unstructured comments is proposed. It can overcome the challenges of informal grammar and the improper usage of punctuation marks in comment data.
The remainder of this paper is organized as follows: The details of the scene classification method are described in Section 2. Section 3 explains the data cleaning method in the proposed framework. The details of the comment analysis and summarization procedures are elaborated in Section 4. The experimental results are demonstrated and explained in Section 5. Finally, conclusions are made in Section 6.
2. Scene Classification
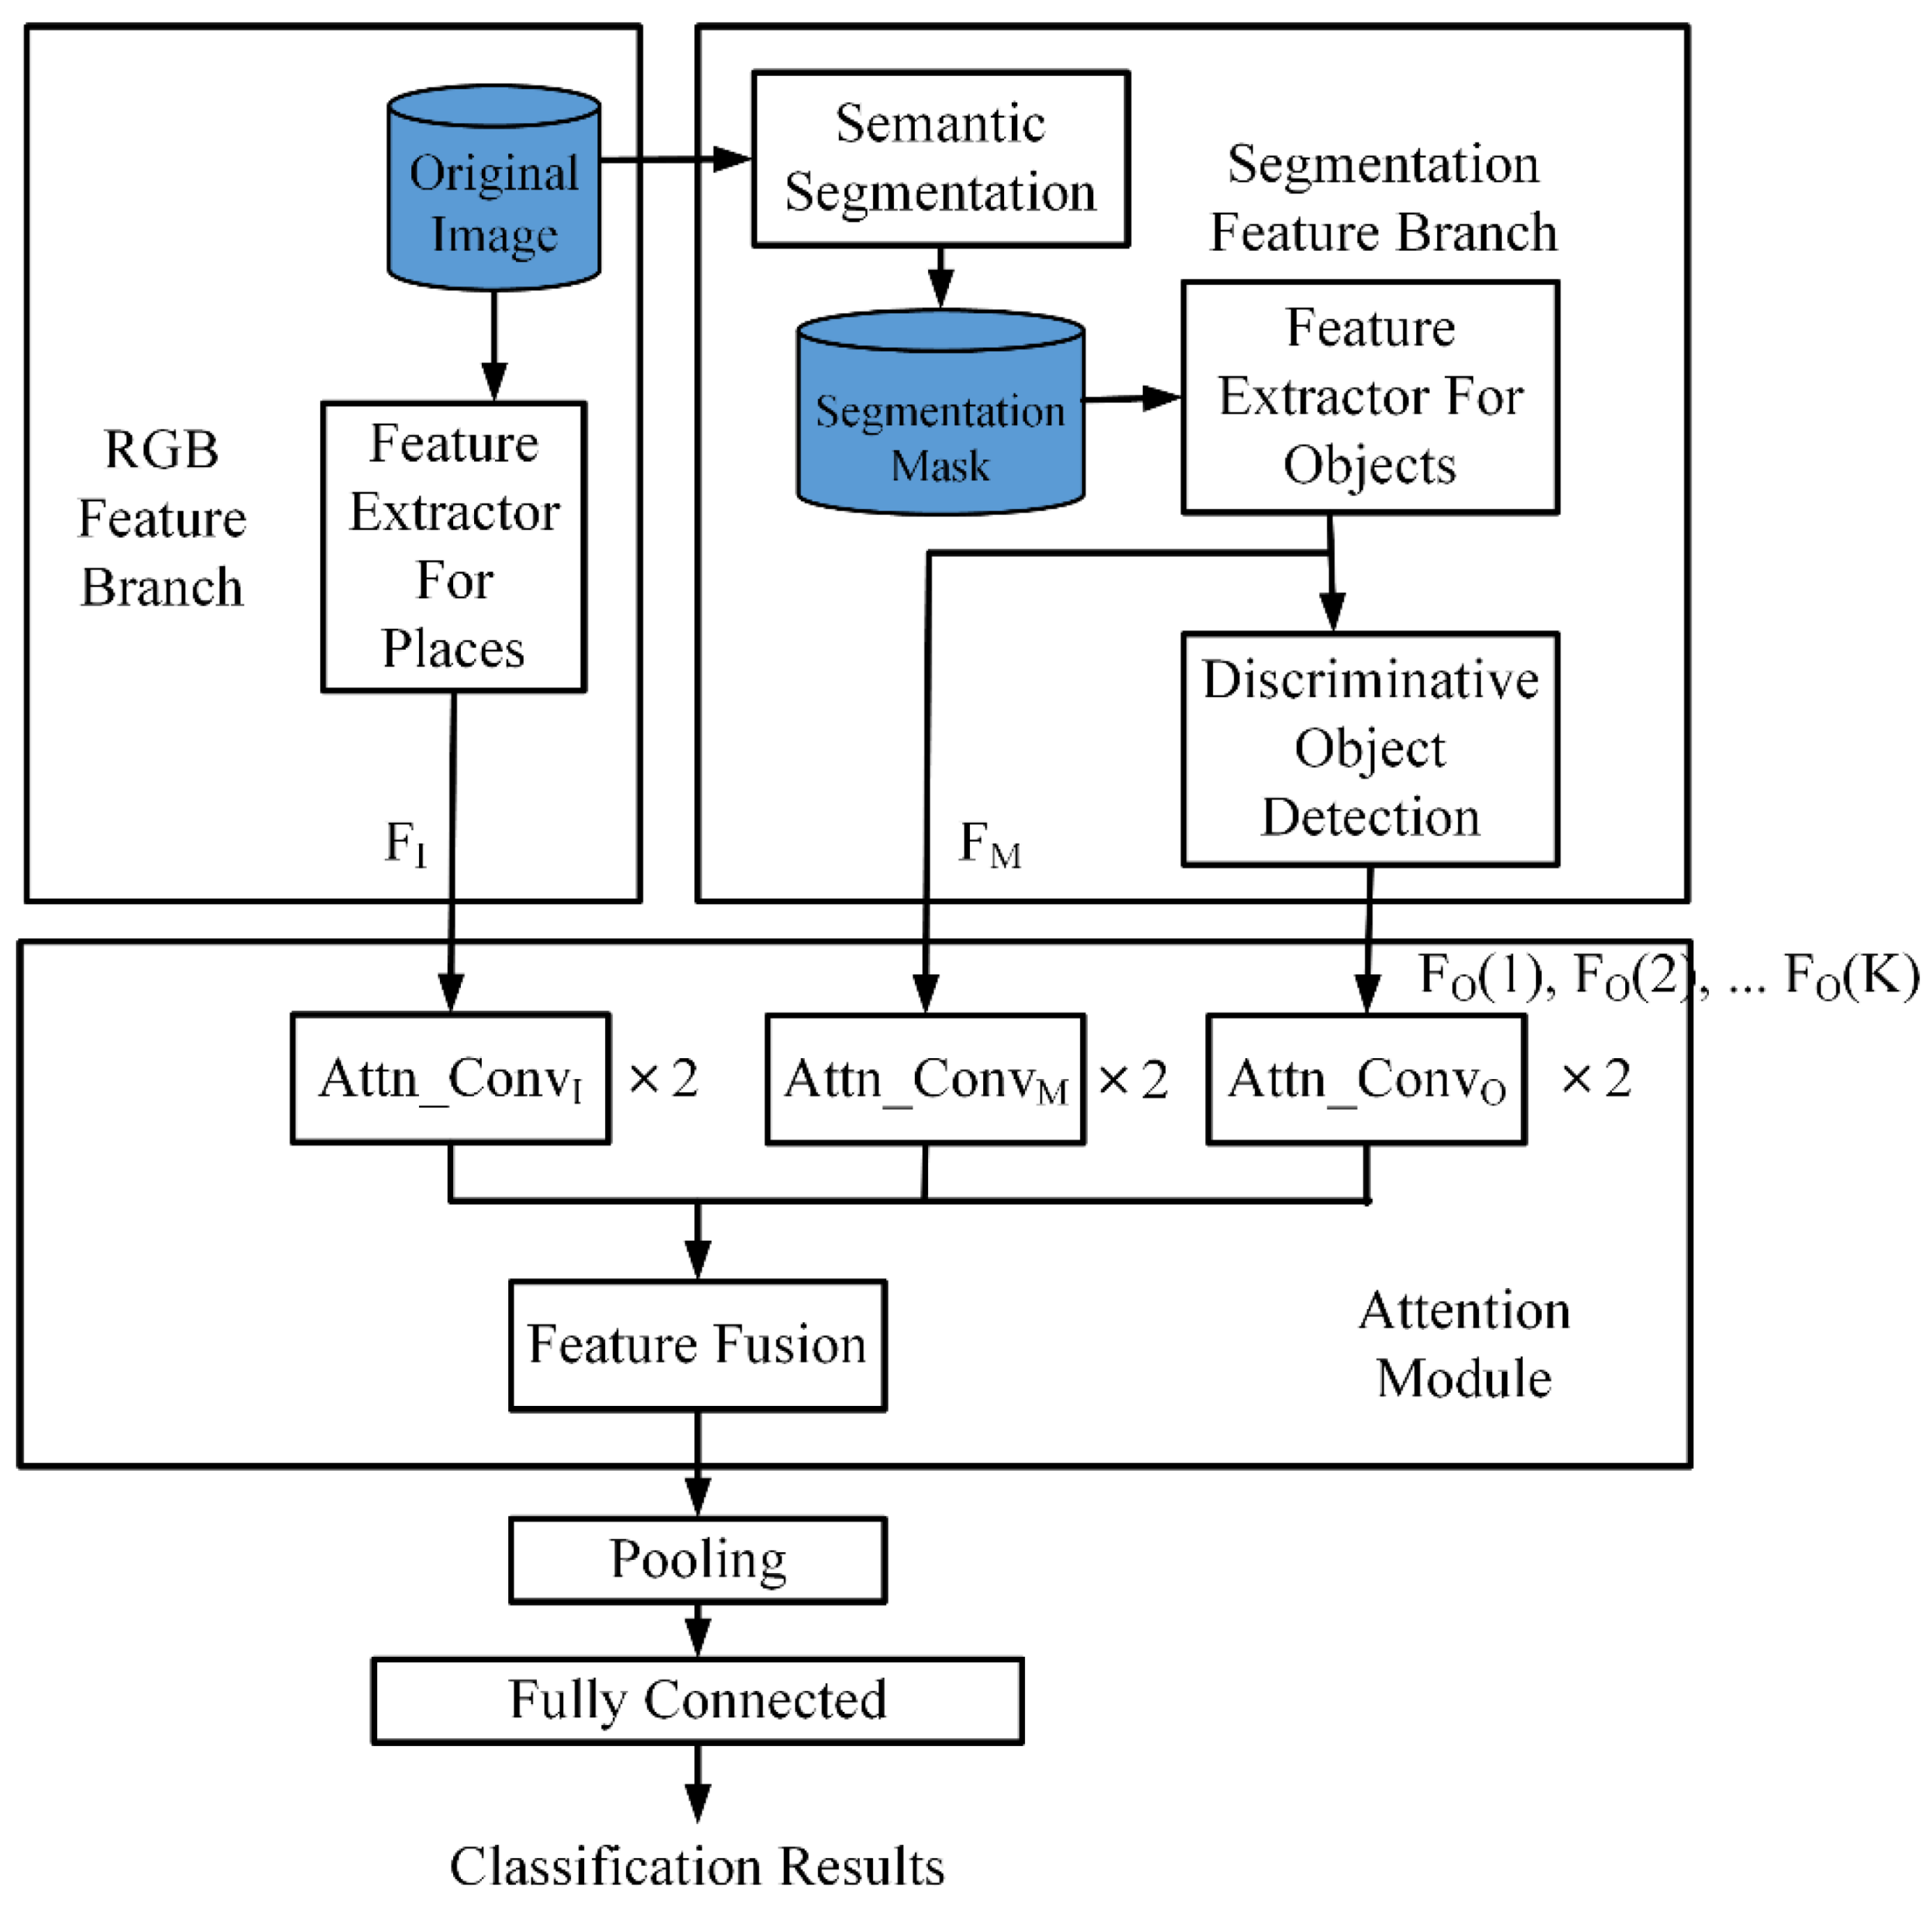
The architecture for scene classification is illustrated in Figure 1. There are two branches, the RGB feature branch and the segmentation feature branch, in the framework. For the RGB feature branch, the RGB feature extractor pretrained on Places [4] takes the original input image to generate an RGB image feature map.

Figure 1.
Scene classification procedure.
For semantic segmentation, Mask R-CNN [15], pretrained on the MS COCO dataset [16], is used. It can effectively segment the input image into 81 different types of objects. However, not all of the objects are important for scene classification. Many objects often appear in more than one class. For example, walls and clocks may appear in bedrooms, restaurants, lobbies, and gyms. These common objects are non-discriminative objects. On the contrary, some objects only appear in specific scenes. For example, treadmills and fitness bikes only appear in gyms. Sinks and toilets only appear in bathrooms. Objects that only appear frequently in some specific categories are called discriminative objects. Therefore, a discriminative object detection procedure is incorporated to process all the objects in a segmentation mask in order to determine a list of discriminative objects. The discriminative object detection procedure is described in Section 2.1.
As illustrated in Figure 1, RGB image features, segmentation features, and the features of discriminative objects are passed to the attention module. Then, feature fusion is performed. The details of the attention module and feature fusion are explained in Section 2.2. Finally, a fully connected layer after pooling is used to generate the classification results.
2.1. Discriminative Object Detection
The objects segmented from an image are fed into a feature extractor pretrained on ImageNet. For each object, we obtain a 1000-dimensional vector at the SoftMax layer. Each element of the vector represents the occurrence probability of a particular object class. We perform discriminative object detection according to [7]. An image with N objects would produce a set of vectors = {, …, , …, }, where is the vector of object i. Then, the sum is used to detect the occurrence of the objects belonging to an image x, as shown in Equation (1):
With all the object scores of an image, we can calculate the probability of all objects in a scene by taking the average of the of all images in a scene category c. The maximum likelihood probability of object o conditioned on scene category c is as follows:
where is the number of images in the image set from a scene category c. This can be regarded as the object multinomial distribution of c. Then, the posterior probability of a scene category given the object can be calculated through Equation (3). Note that is the prior scene category probability, which equals 1/C, supposing that there are total C scene categories.
Thus, we can obtain the posterior probability of scene classes given the observation of all objects using Equation (4):
Given an object , all the scene categories are ranked according to the posterior probabilities . Let r(k) be the ranking function, whose value is the posterior probability of the class with the kth largest probability. Because objects that appear in multiple scenes at the same time are not discriminative, the difference between the neighboring probabilities after ranking can be used to calculate the discriminative degree of an object.
The objects with the first KDO largest discriminative degrees are selected as the discriminative objects.
2.2. Attention Module and Feature Fusion
Feature fusion is an effective way to enrich feature representation and improve classification or detection accuracy. Popular fusion techniques include direct feature fusion and adaptive feature fusion [17]. Direct fusion is the simplest way to sum or concatenate feature maps. However, the contributions and importance of different feature maps are generally not the same. Therefore, combining features with equal weights might not be a good solution. Adaptive feature fusion gives different weights to individual feature maps. Adaptive feature fusion with an attention mechanism is an attractive option to perform fusion. An attention map can refine and highlight a feature map by performing element-wise multiplication with different weights. Therefore, attention modules allow for CNN to learn and focus on the information, which is more critical and important. In this subsection, we explain the attention module and feature fusion method in the proposed framework.
The feature map from the feature extractor in the RGB branch goes through two convolutional layers to generate as shown in Equation (6). In Equation (6), is a ReLU activation function. The feature map from the segmentation feature branch goes through two levels of convolutional blocks with the ReLU activation function. Then, a sigmoid activation function is used to generate , whose range is from 0 to 1 as shown in Equation (7). The purpose of restricting the range of is to perform multiplication when fusing and . For each discriminative object oi, the feature representation also goes through two convolutional layers with the ReLU activation function to generate as shown in Equation (8). In Equations (6)–(8), , , , , , and are the weights of the convolutional blocks, and , , , , , and are the biases of the convolutional blocks.
Multiplication is first performed to fuse and . Then, the feature is concatenated with of all the discriminative objects, i = 1, …, K, to form the final feature representation , which is shown in Equation (9).
3. Data Cleaning
Data cleaning is performed in the proposed system so that incorrect images that do not belong to a certain location are not presented to users. To detect incorrect images, we assume that most users would upload correct images and that only a very small portion of users would upload incorrect images to a specific place. Therefore, incorrect images should become isolated outliers in an image set with the same location label. We integrate the automatic incorrect scene detection method from [18] into the proposed framework to perform data cleaning. The data cleaning mechanism contains a multilevel feature extractor and a multiresolution distance calculation scheme for incorrect scene detection. The multilevel feature extractor uses ResNet50 as its backbone. It concatenates feature maps from different layers in the neural network to form the feature embedding of an input image i to include both high-level and low-level features. Instead of only using the highest level features from the images, the extracted feature vector includes all levels of features, including objects, shapes, colors, and textures.
For the multiresolution distance calculation, the images are divided into patches with different sizes. Each size represents a resolution r. The features of the patches are extracted from the multilevel feature extractor. The multiresolution distance considers both the global distances between the image features and the local distances between image patches of different sizes. Suppose that there are N local patches for image at resolution r and that their corresponding local features extracted by the multilevel feature extractor are . The terms and are similarly defined for image . The N2 pairwise similarities between patches and are calculated based on thresholding the distances . If is smaller than a threshold, is set to 1. Otherwise, is set to 0. The local similarity at resolution r counts the number of patch pairs that are similar enough between images i and j, as defined in Equation (10). Note that the value of ranges from 0 to 1. Therefore, the local dissimilarity can be obtained using 1 minus the local similarity. The multiresolution distance between images and is the summation of the global distance and local dissimilarities at all resolutions r.
To detect if an image is an outlier, the detection algorithm checks the k nearest images with and ignores images that are far from . The algorithm classifies an image as correct if all the k nearest images have dissimilarities smaller than a threshold . Otherwise, it is determined to be an incorrect image for the location. Note that these k nearest images must be uploaded by different users from . The reason for only considering the distances of the k nearest neighbors of is that the distances between correct scenes could have a very wide range. Despite this, a correct scene should be similar enough to at least k other images uploaded by different users. Although photos could be taken from different perspectives, the algorithm only focus on those that are similar enough. It can thus overcome the above-mentioned challenge. In practice, the value of k could depend on the number of existing scenes for a location.
4. Comment Analysis and Summarization
A flowchart of the comment analysis and summarization procedure is illustrated in Figure 2. First, comment boundaries are detected. Preprocessing is performed to remove unwanted information. Then, sentiment classification is used to classify the comments into positive and negative ones. Part-of-speech (POS) tagging [19] is performed to assign each token a label, such as nouns, verbs, adjectives, and adverbs. To deal with incohesive and unstructured review comments in user-uploaded location databases, the proposed system generates summaries based on the important keywords detected in the texts. Therefore, we design a keyword detection procedure that can discover unlabeled keywords based on a small set of predefined keywords in a specific domain. The dependency parsing algorithm in [20] is used to find the adjective describing the keywords. Based on the sentiment classification and dependency parsing results, the system can further provide the advantages and disadvantages associated with the keyword. Since reviews from different customers might contain a lot of very similar comments, clustering is performed based on the similarities among comments. To avoid generating a summary with similar sentences, only one comment is selected from each cluster when summarizing the reviews.
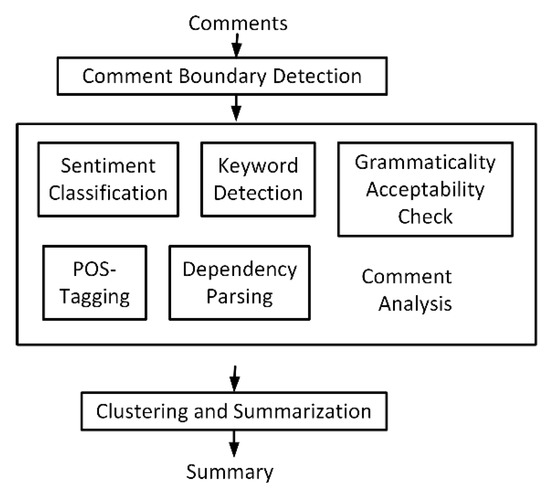
Figure 2.
Comment analysis and summarization procedure.
4.1. Comment Boundary Detection
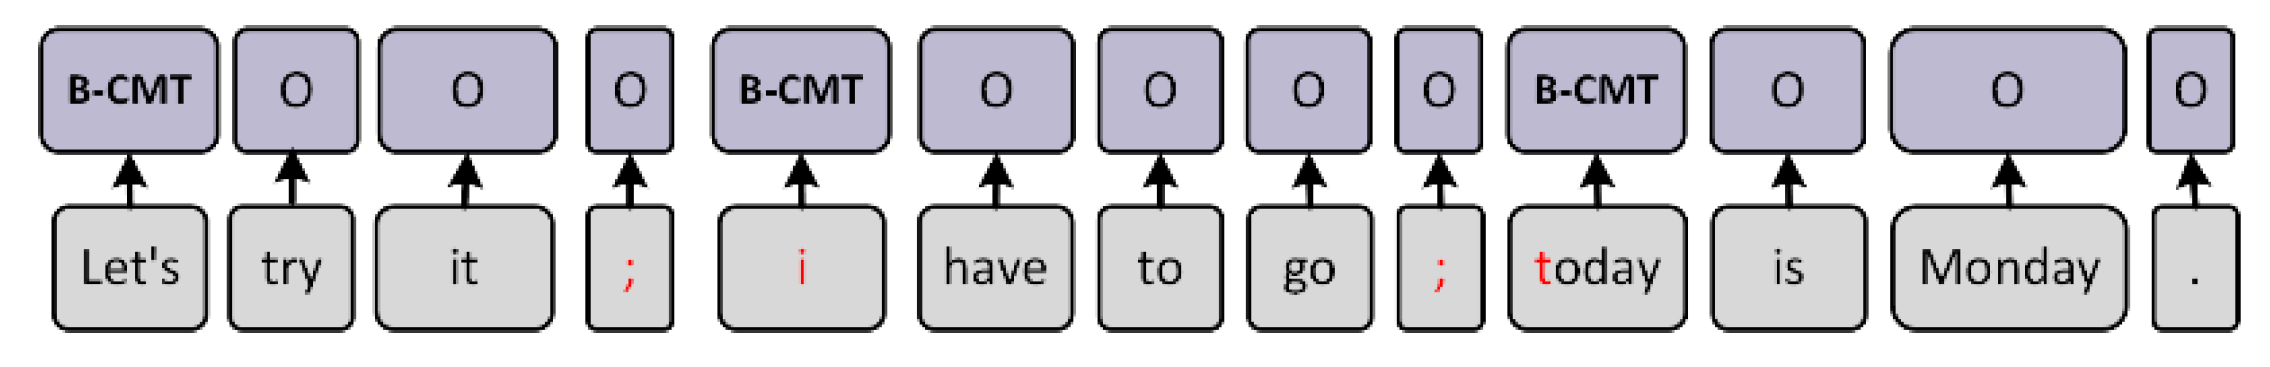
User-uploaded comments are often unstructured. Sometimes, users do not separate two sentences with a period. Moreover, positive and negative opinions can be mixed in the same comment. For example, a comment may be similar to the following statement: “Staff is very friendly, room is comfortable and spacious, poor location.” If we want to perform subsequent sentiment classification, we need to first properly separate the comments. It is not feasible to use traditional sentence boundary detection methods because user-uploaded comments have informal or non-rigorous formats. Therefore, we treat comment boundary detection as a sequence labeling task. As shown in Figure 3, we mark the beginning of the comment as the boundary using label B-CMT. The remainder are labeled O. Then, a model is trained to detect the comment boundary so that the system can overcome unstructured sentences and the improper usage of punctuation marks in user-uploaded comments.
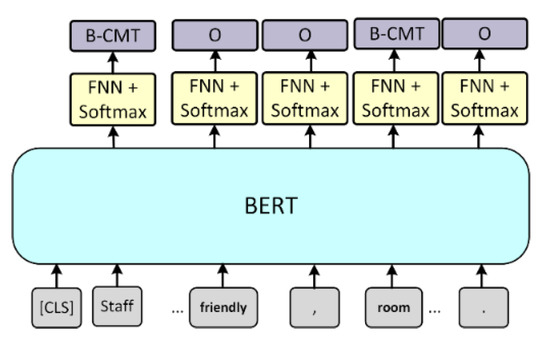
Figure 3.
Comment boundary detection model.
We use a pretrained BERT model and fine-tune it on our dataset for the sequence labeling task. The model is shown in Figure 3. The corresponding output of each word after passing through BERT is connected to a feedforward neural network followed by SoftMax. The sum of the probability of the final layer becomes 1, which is convenient for the classification task. The comment boundary detection process in our framework is to first use the method proposed by Kiss and Strunk [21] in order to make a preliminary judgment, separating sentences with correct grammar. Then, the system uses the proposed model for more detailed comment segmentation to deal with informal grammar and incorrect punctuation marks, which can be found in customer reviews.
4.2. Sentiment Classification
Determining the sentiment in user reviews is essential in a comment analysis [22]. The sentiment classification model is illustrated in Figure 4. A sentiment analysis is a sequence classification task. The output of the first special symbol [CLS] of BERT is used as the sentence feature, followed by a feedforward neural network and a SoftMax layer. The SoftMax layer ensures that the sum of the probability of the last layer equals 1 and facilitates the classification task.
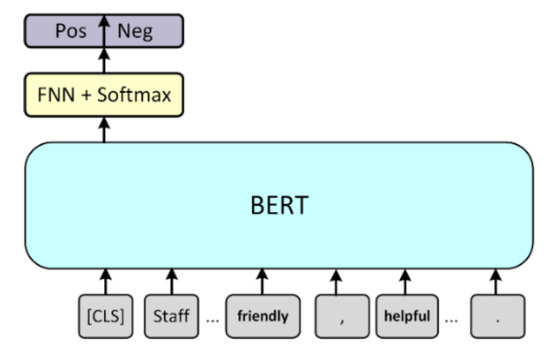
Figure 4.
Sentiment classification model.
4.3. Keyword Extraction
Traditional unsupervised keyword extraction methods, such as TF-IDF [23], TextRank [24], and YAKE [25], are based on the statistics of the position and frequency of words. These methods do not require additional labeled data or model training. However, applying the above-mentioned keyword extraction methods on customer reviews does not yield good results. For example, they often extract nouns that appear in large numbers but are not keywords. As a result, in the proposed framework, we aim to train a model that has the generalization ability to recognize other unlabeled keywords given only a small set of predefined domain-specific keywords. Since it is very time consuming to manually label a large number of comments, we select a small number of nouns identified as keywords and non-keywords. Examples of keywords and non-keywords in hotel comments are listed in Table 1. Then, ten thousand comments are automatically marked using the predefined keyword set to serve as the training data. A noun is marked as 1 if it is a keyword and 0 if it is a non-keyword. Other pronouns, verbs, adverbs, and adjectives in the sentence are also marked as 0.

Table 1.
Examples of keywords and non-keywords for hotel comments.
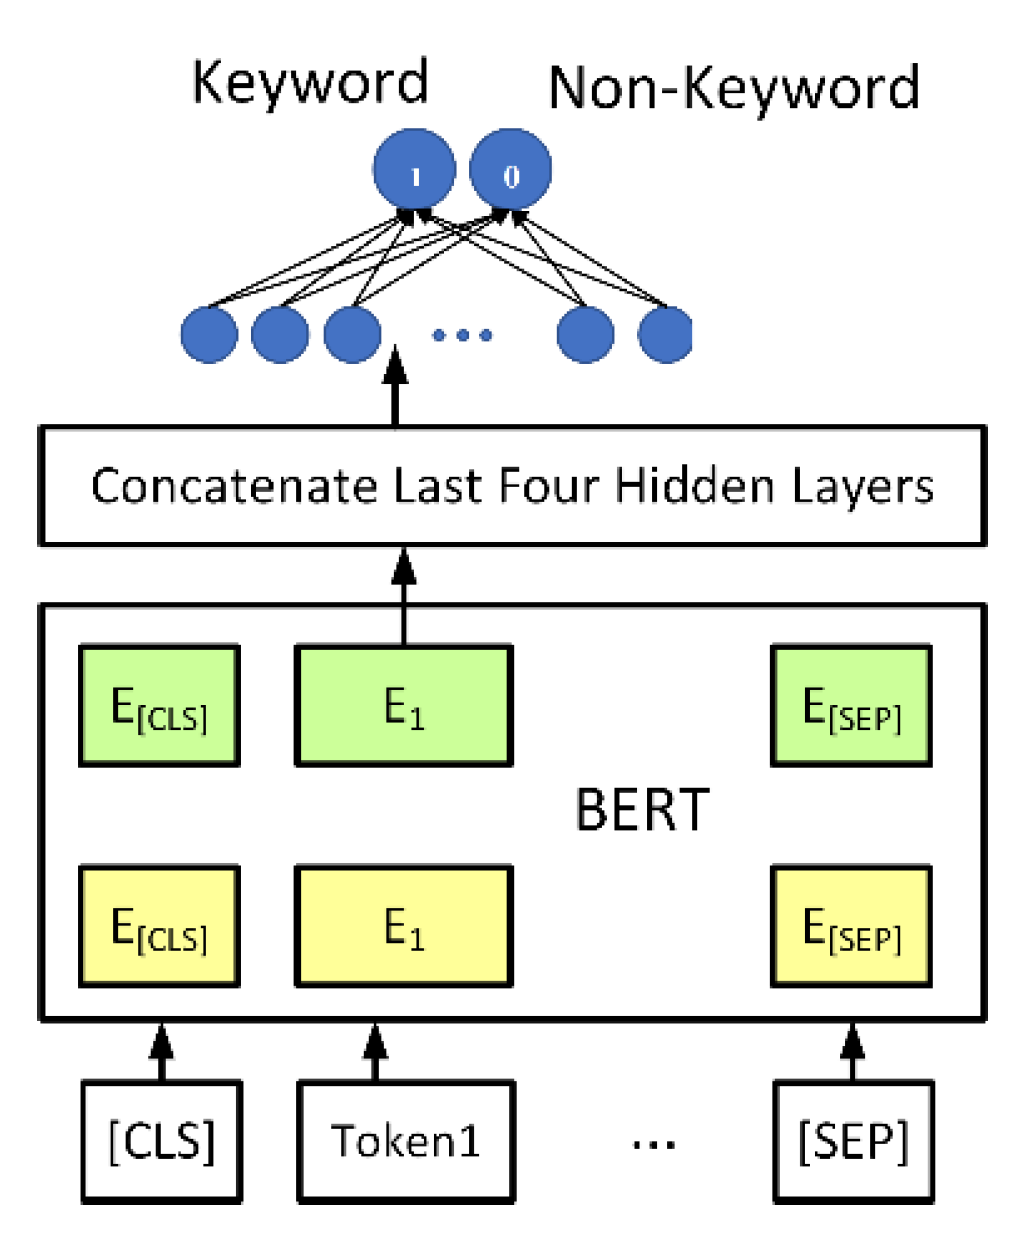
The proposed keyword detection model is illustrated in Figure 5. We use a pretrained BERT [5] model to treat the keyword extraction as a sequence labeling task. The input of the model is the tokenized comments. The output is the features of each token. The architecture of BERT has 12 layers of output. For each Token feature (E1~En), we concatenate the last four output layers of the model to form a feature vector. The feature vector is connected to a feedforward neural network, whose output is 1 (predicted to be a keyword) and 0 (predicted to be a non-keyword). Using the previously mentioned labeled comments as the training set, we let the model learn the characteristics of the marked keywords. After training, the model can predict keywords that have not been seen in the training set, as listed in the examples presented in Table 2. Therefore, the proposed keyword detection procedure is useful when we apply the framework to a new domain. Only a small set of predefined keywords in the new domain, rather than a large amount of new labeled training data, needs to be provided to train the model.

Figure 5.
Keyword detection model.
Table 2.
Examples of keyword detection.
4.4. Grammaticality Acceptability Check
In the preprocessing step, accents and emoji symbols are first removed from the comments. Afterward, the system filters out grammatically incorrect comments. The task of judging whether the grammar is correct is called grammaticality acceptability in natural language processing. A common dataset designated for this application is the Corpus of Linguistic Acceptability (COLA) [26]. The model used in the proposed system is T5 [1]. Only the comments that are judged to be grammatically correct are preserved. Comments that are grammatically incorrect are eliminated from the summary.
4.5. Comment Clustering and Summarization
To avoid generating repeated and redundant information in the summary, we perform comment clustering to group similar comments together. Only one sentence is selected from each group of similar reviews when generating the summary. Sentence similarity is necessary for clustering. Similarity is usually calculated using the cosine distance between two sentence embeddings or features. The method used to generate sentence features has a great influence on the correctness of the sentence similarity calculation. Previous studies have stated that the sentence embedding generated by BERT is not suitable for cosine similarity calculation since the model is trained to deal with the task of next sentence prediction [5,27]. The author of [27] used BERT to construct a Siamese network called SBERT. After fine-tuning, the features generated by SBERT were useful for similarity calculation with cosine distance. We apply SBERT to calculate sentence similarity in the proposed framework. Each review for a hotel is fed into SBERT to obtain its review features. Then, the cosine distance is calculated to measure the similarity between the review features. Finally, the system uses a hierarchical agglomerative clustering algorithm to group similar reviews together. The summarization process selects the longest sentence from a cluster as the representative comment. The representative comments from the first Kc largest clusters are organized as the summary. The number of Kc can be defined by users.
5. Experimental Results
To validate the proposed framework, we implement a system that can classify and organize scenes and comments for hotels. The system takes a user query and presents organized data from two international travel websites, TripAdvisor and Booking.com, to users. The major highlight of the datasets used in the experiments is that they comprise unprocessed images and review comments uploaded by real-life users. The details of the datasets used for scene classification, data cleaning, and comment summarization are described in the following three subsections, respectively. The environment used for the experiments is Ubuntu 16.04, with Intel® CoreTM i7-8700 CPU running at 3.20 GHz and Geforce GTX 1080 Ti. The optimizer used to perform training is Adam with a learning rate of 0.00001. Note that the proposed framework can be applied to other domains, such as restaurants and shops, by replacing the training data. The results of the three main functionalities in the framework are demonstrated and discussed in the following three subsections, respectively.
5.1. Scene Classification
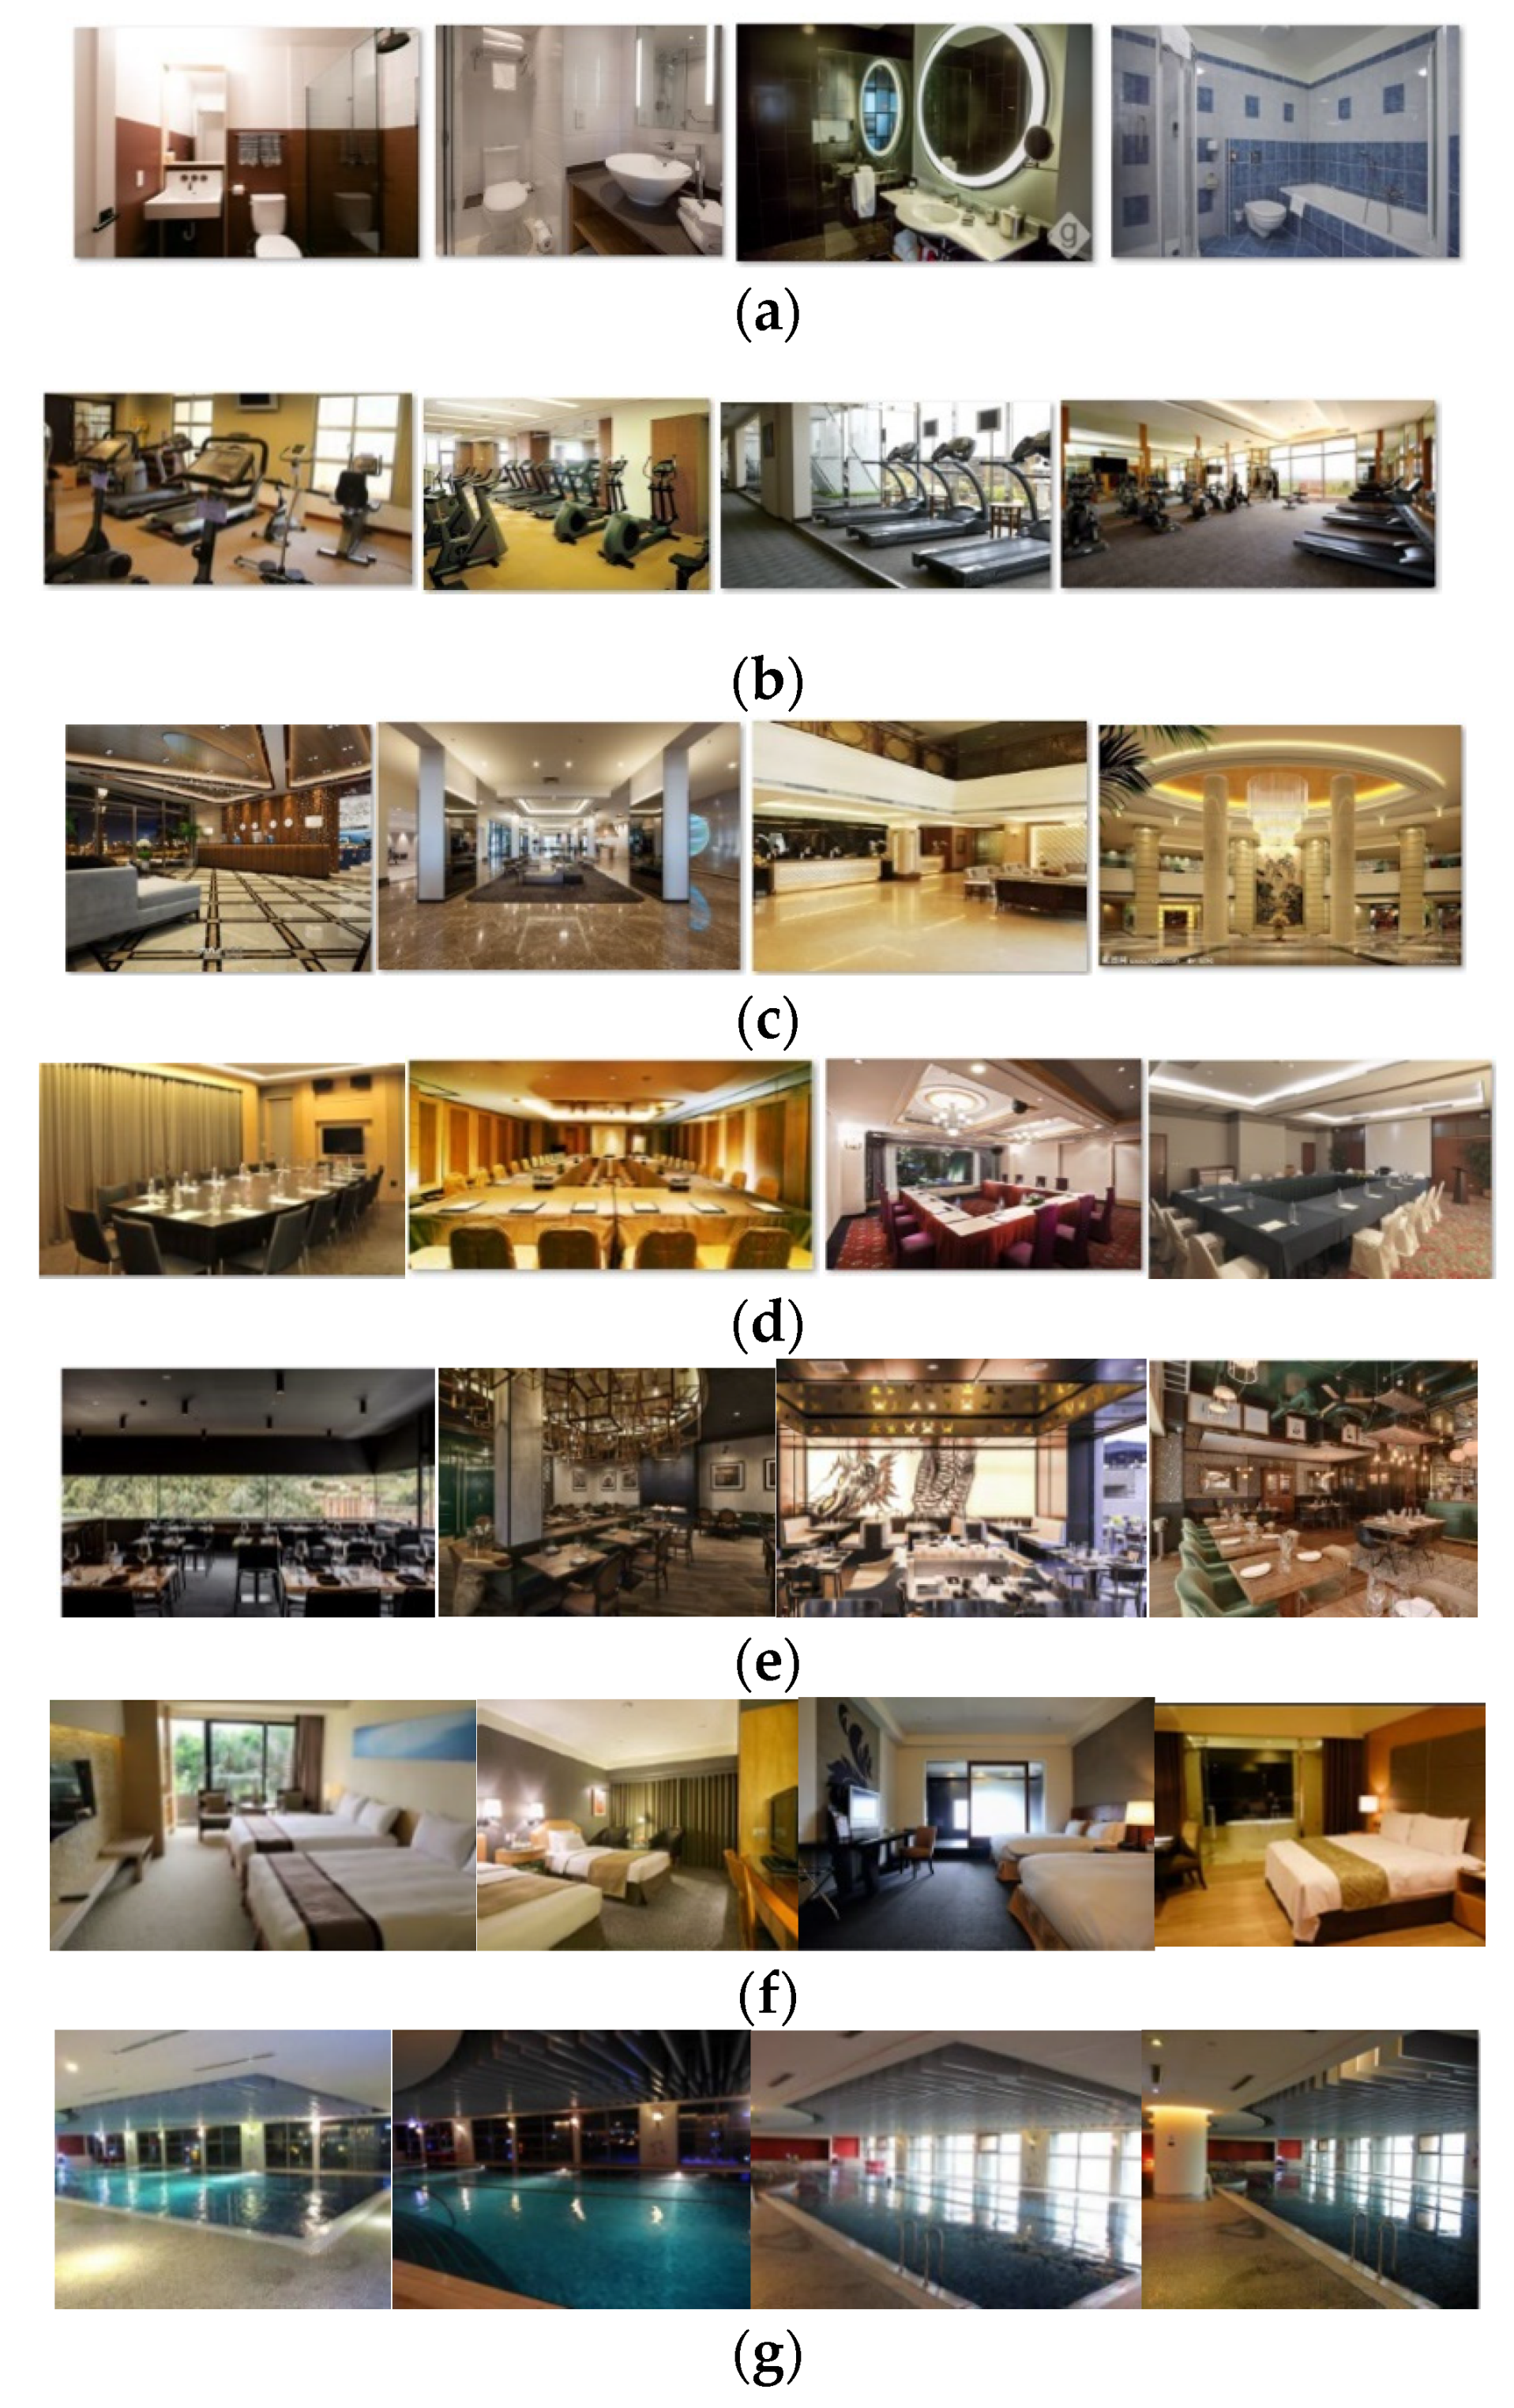
The training images for hotel scene classification are collected by a web crawler that downloaded images from TripAdvisor. The downloaded images are first classified into food, menu, indoor scenes, outdoor scenes, people, and others using the classification model proposed in [18]. Then, we classify the indoor scenes of hotels into seven categories, namely, bathroom, gym, lobby, meeting room, restaurant, room, and swimming pool, using the proposed scene classification scheme. For each category, 1200 images are used for training, and 800 images are used for testing. Examples of training images for hotel scene classification are shown in Figure 6.
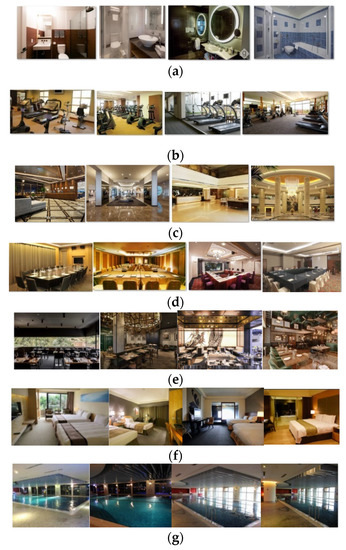
Figure 6.
Examples of training images for hotel scene classification: (a) bathroom; (b) gym; (c) lobby; (d) meeting room; (e) restaurant; (f) room; (g) swimming pool.
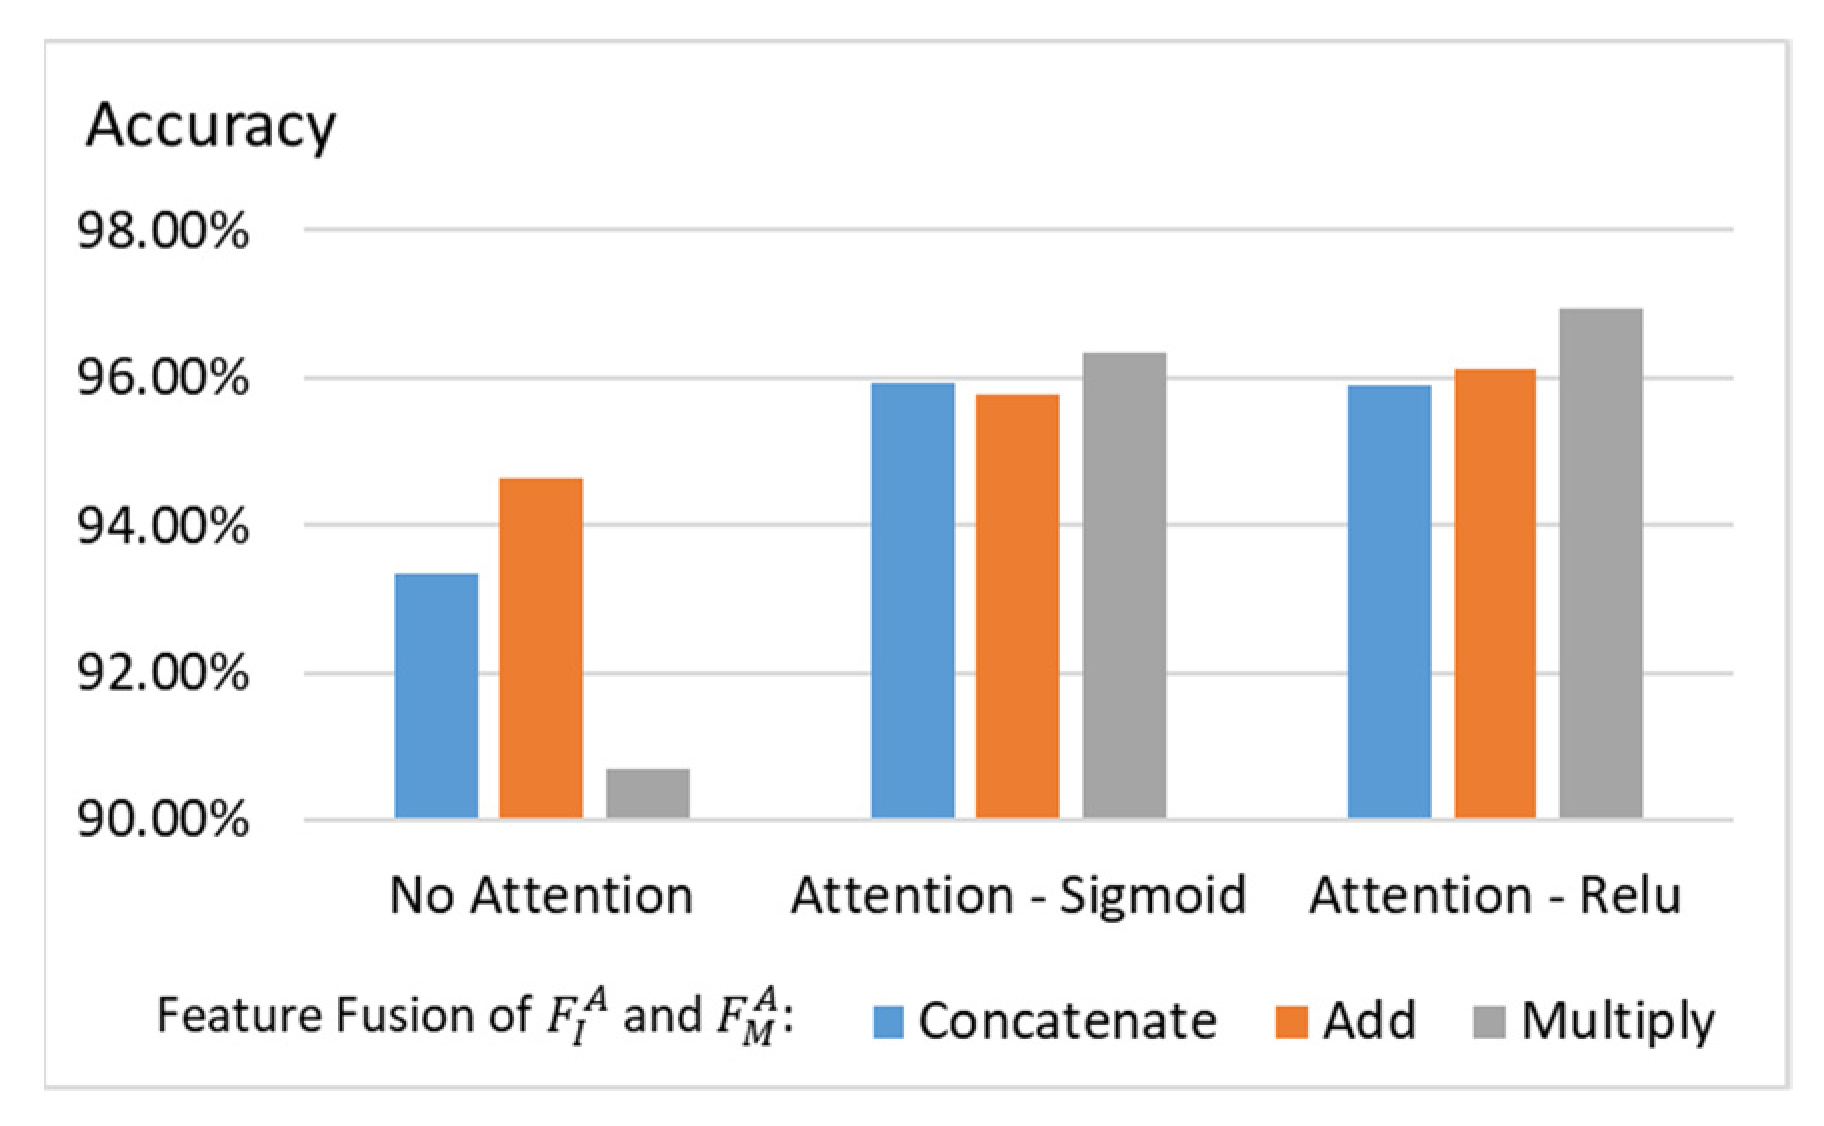
For the ablation study, Figure 7 plots the classification accuracy using different feature fusion strategies and attention modules. Since and have the same dimensionality, the possible fusion methods include concatenation, addition, and multiplication. From the experiments, we can see that performing multiplication with the attention module yields better results. Moreover, we can observe that using ReLU in the attention module as described in Equations (7)–(9) outperforms using sigmoid in the attention module.
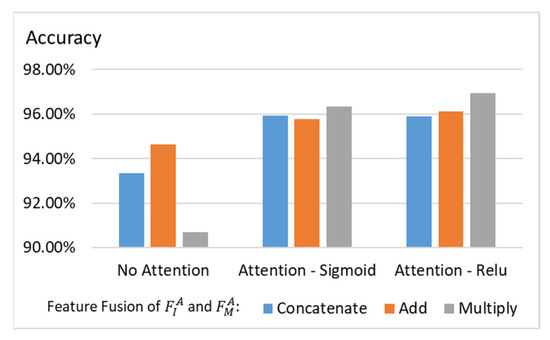
Figure 7.
Experiments on attention module and feature fusion.
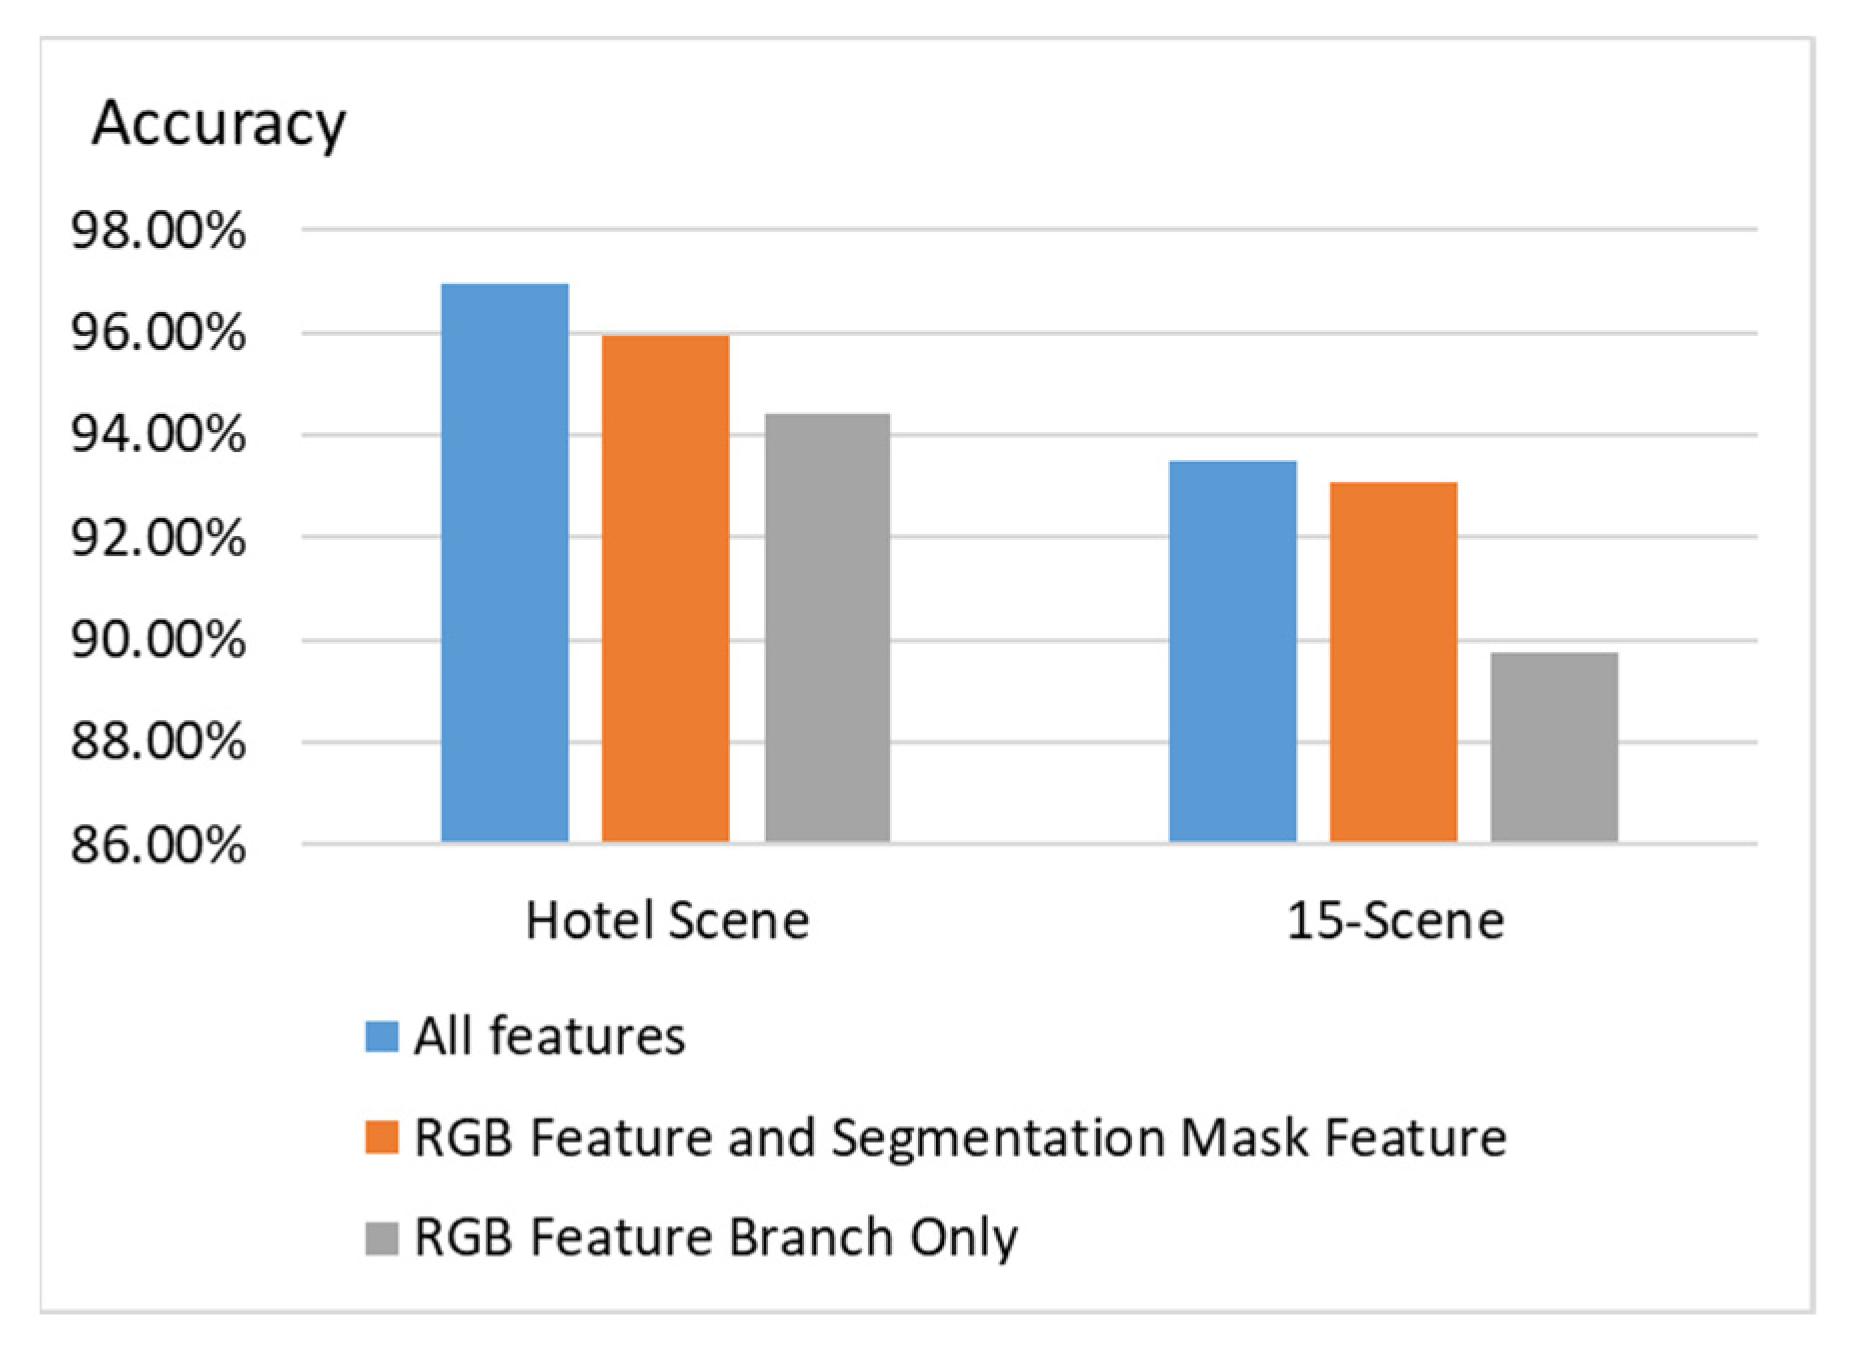
To compare the proposed scene classification method with existing methods, we use the open dataset 15-Scene to evaluation different methods. The methods that are compared are CMN [28], ObjectBank [29], Kernel descriptor [30], SPMSM [31], SR-LSR [29], EMFS [32], and Object-to-Class kernels [33], because they provide the classification accuracy of the 15-Scene dataset in their papers, and, thus, the statistics can be directly compared. We also compare the proposed method with that in [8] because they also considered segmentation masks and used attention modules in their work. However, they did not perform discriminative object detection. We can observe in Figure 8 that the proposed method outperforms the existing methods on the 15-Scene dataset for scene classification. Different feature combinations are compared in Figure 9. We can observe that using all features, including the RGB feature branch, segmentation mask features, and discriminative object features, yields the best classification accuracy on both the hotel scene dataset and 15-Scene dataset.
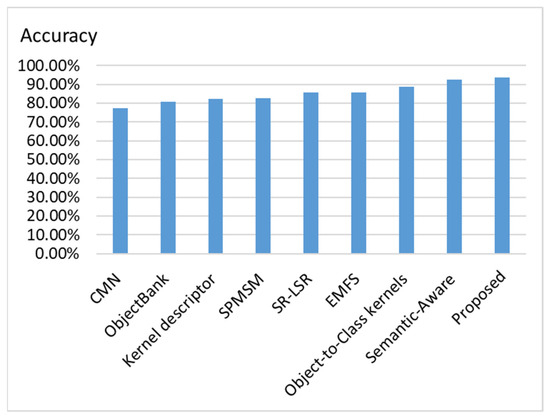
Figure 8.
Comparisons of existing scene classification methods on 15-Scene dataset.
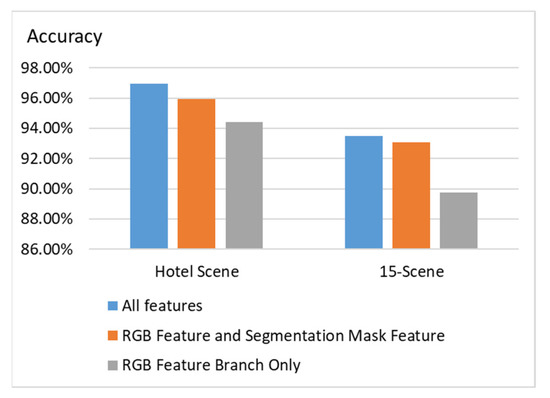
Figure 9.
Experiments on different feature combinations.
5.2. Data Cleaning
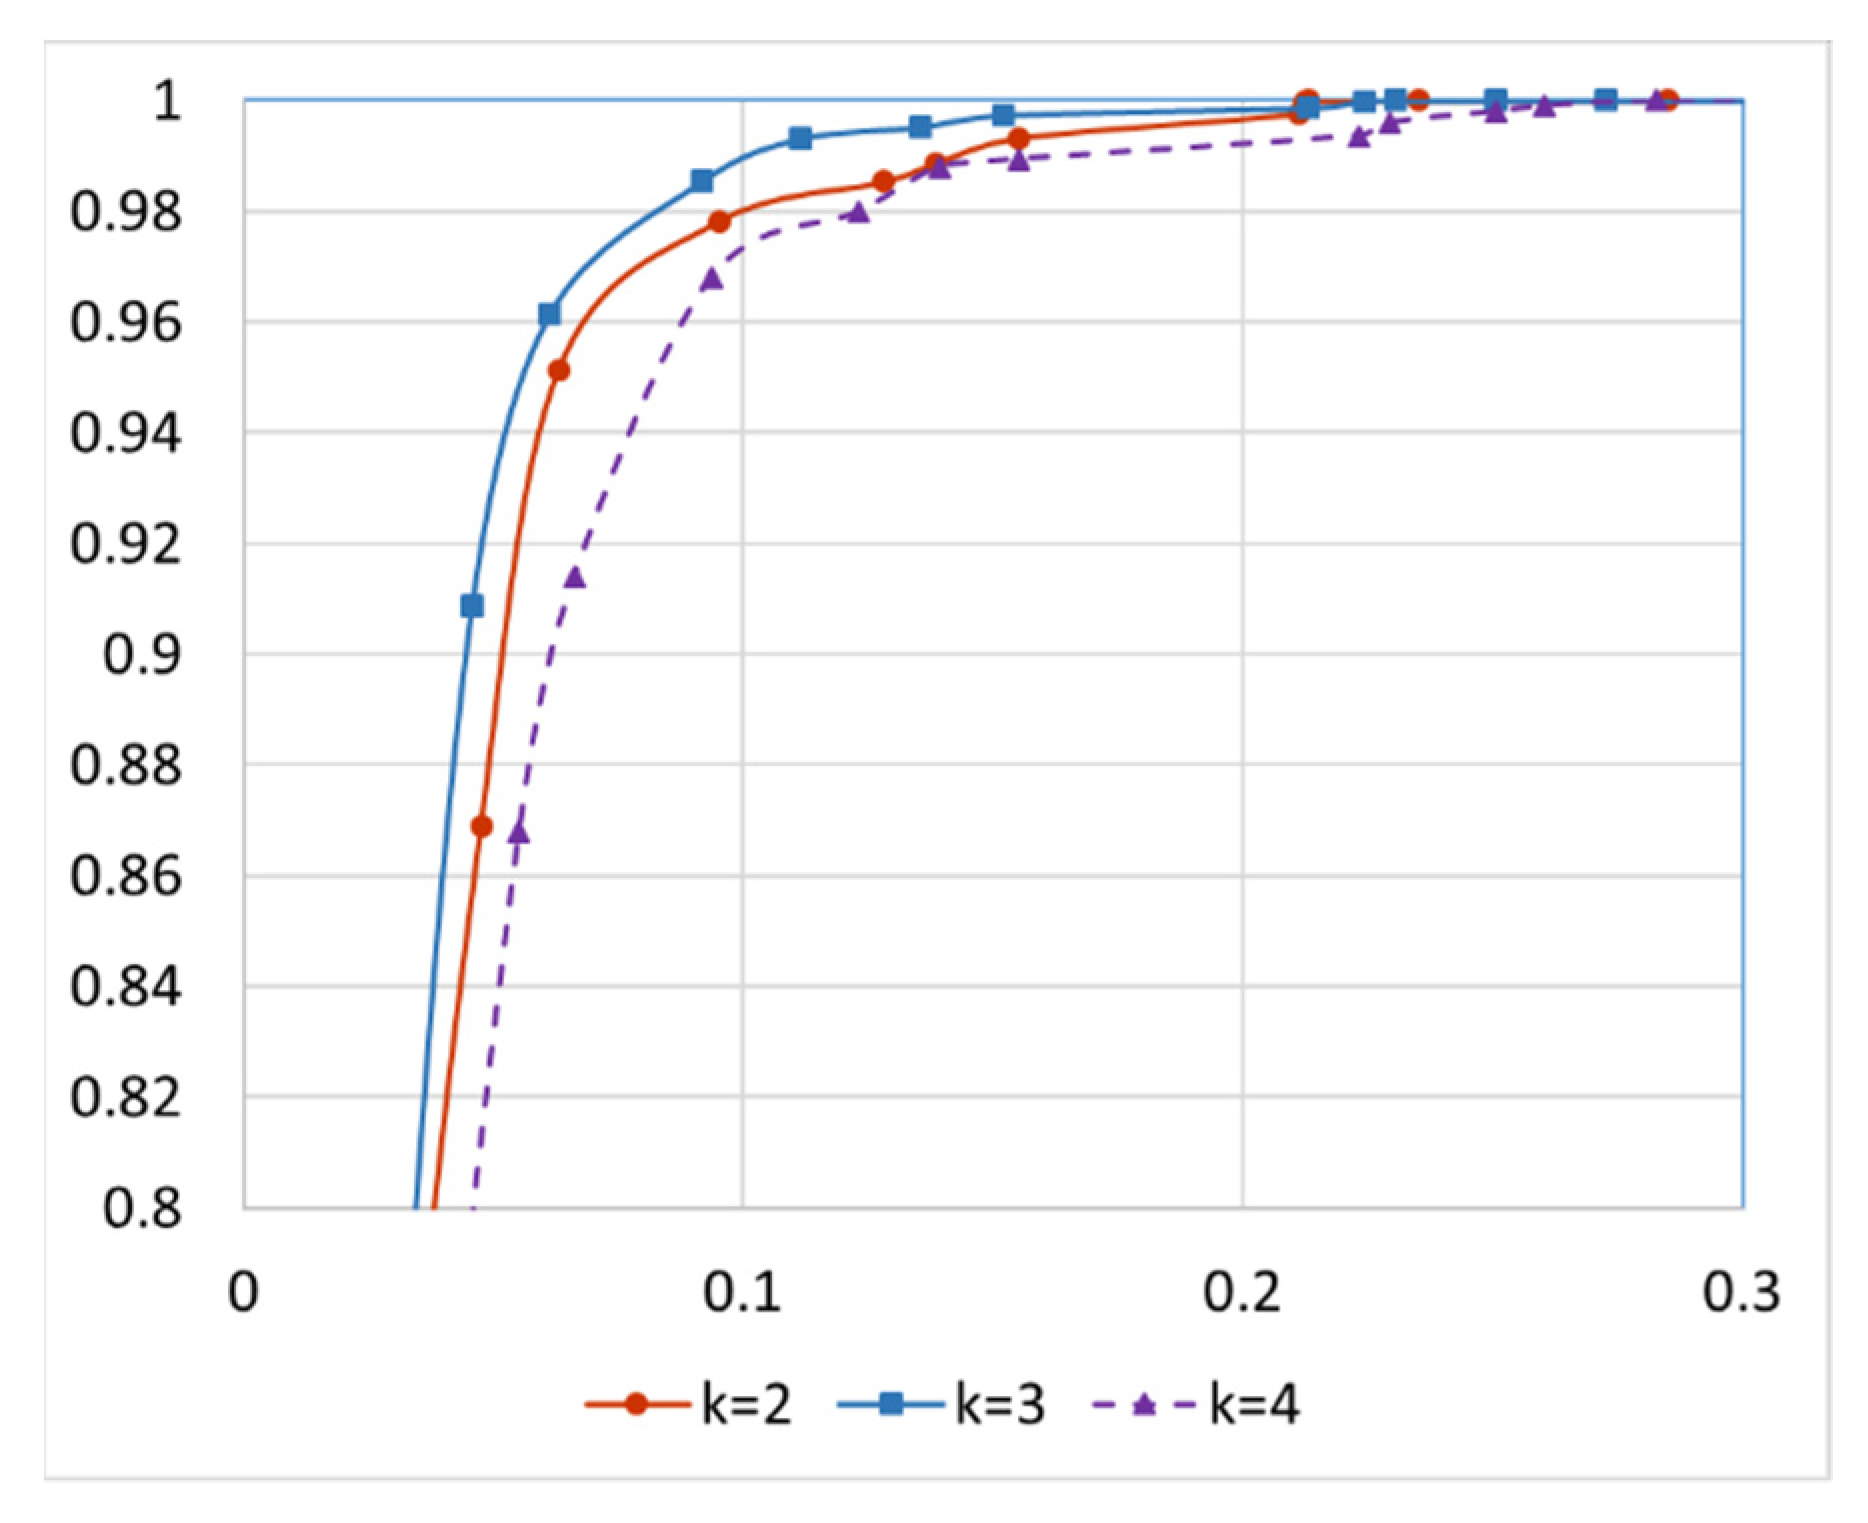
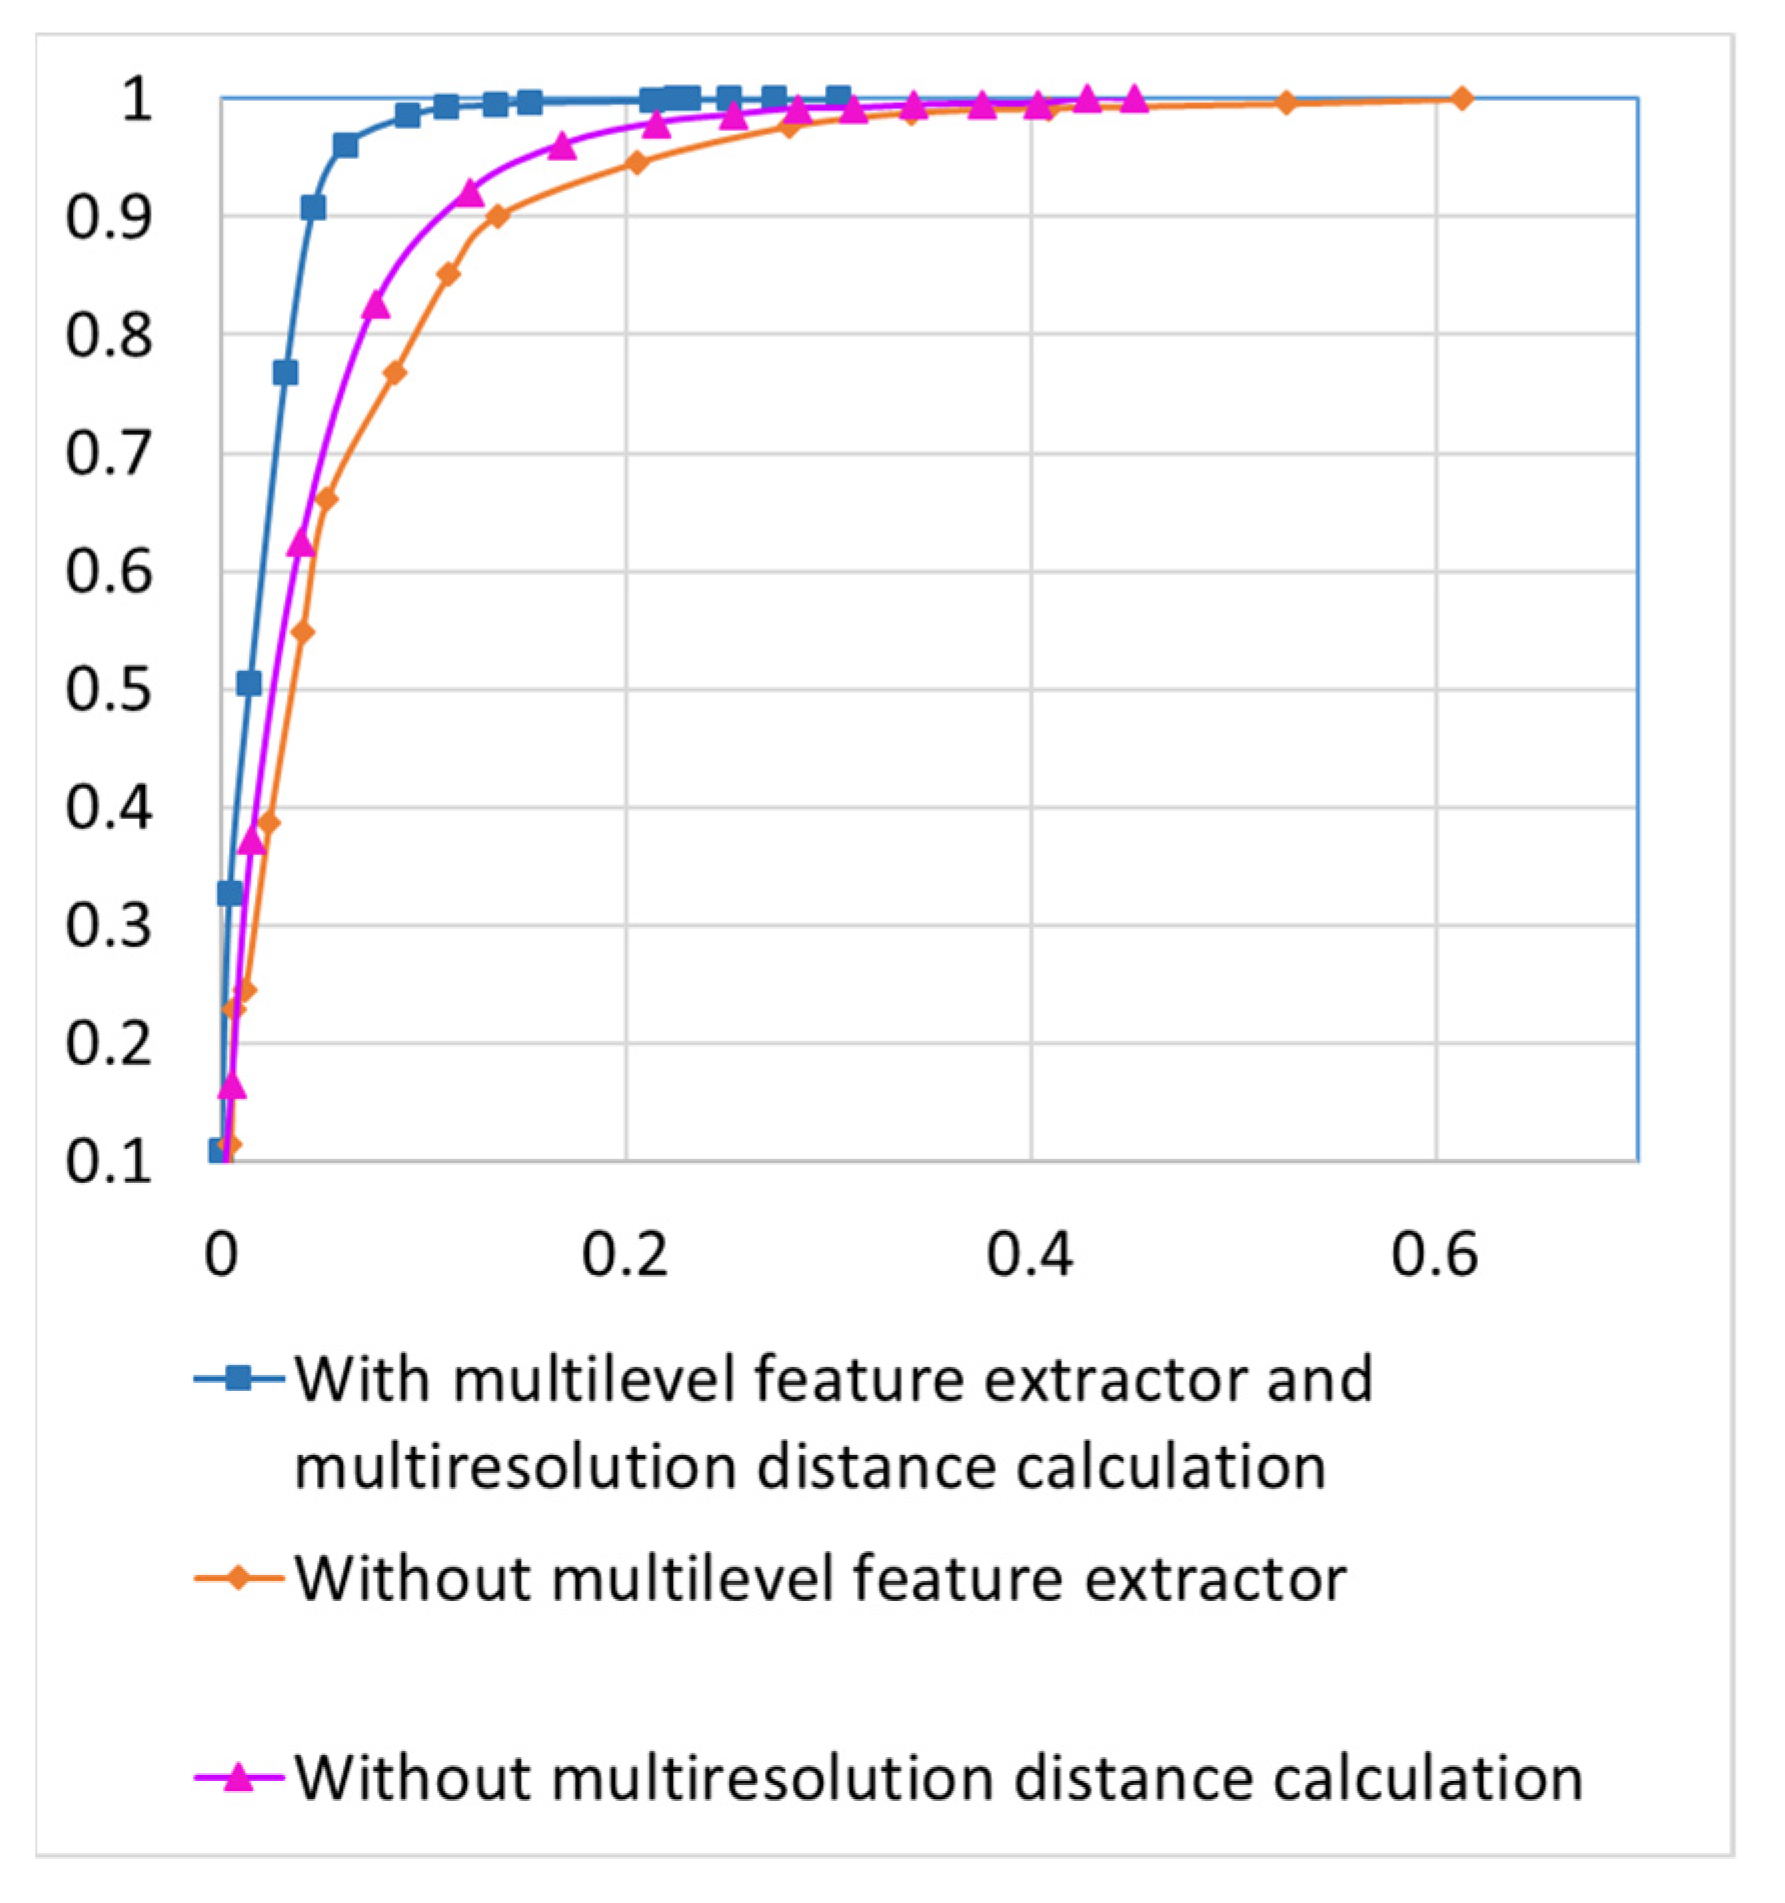
The images of indoor and outdoor scenes are sent to data cleaning modules to eliminate incorrect images. For incorrect scene detection, a dataset with ground truth is established by inspecting the images to identify scenes that do not belong to the hotel label. In reality, the number of incorrectly uploaded images is relatively small. Therefore, to test the robustness of the data cleaning scheme, we intentionally increase the percentage of incorrect scenes in the testing data by incorporating images from other locations. The number of incorrect scenes for each location is manually increased so that it reaches up to 15% of the correct scenes of that location. There are 500 different hotels and a total of 186,763 images in the dataset used to validate the performance of the incorrect-scene detection module in the proposed system. As stated in Section 3, the data cleaning scheme only considers the distances of the k nearest neighbors of an image when judging if it is an incorrect scene. Although distances between correct scenes could have a very wide range, a correct scene should be similar enough to at least k other images uploaded by different users. Figure 10 illustrates the Receiver Operating Characteristic (ROC) curves with different values of k. The x-axis is the false positive rate, and the y-axis is the true positive rate. Curves that are closer to the upper-left corner in the figure are better. A true positive corresponds to an incorrect scene successfully detected by the data cleaning scheme. Note that the smallest number of uploaded scenes for a hotel is 50 for the experiments in Figure 10. We can observe in Figure 10 that k = 3 yields the best results when the minimum number of scenes in the database for a location is 50. For the ablation study, Figure 11 plots the ROC curves of the incorrect scene detection without a multilevel feature extractor or without multiresolution distance calculation. We can observe the impact in Figure 11. It is validated that eliminating either module from the detection scheme would decrease the detection accuracy.
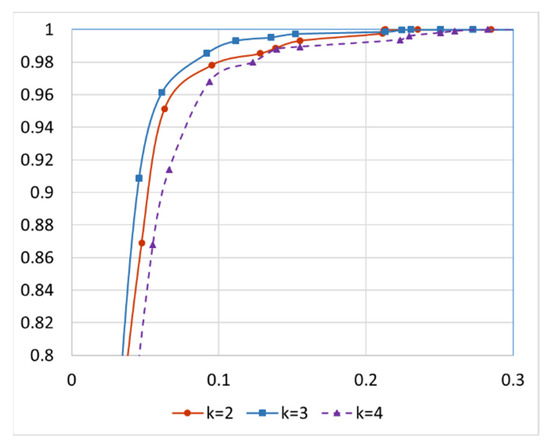
Figure 10.
ROC curve of incorrect scene detection using different number of nearest neighbors k.
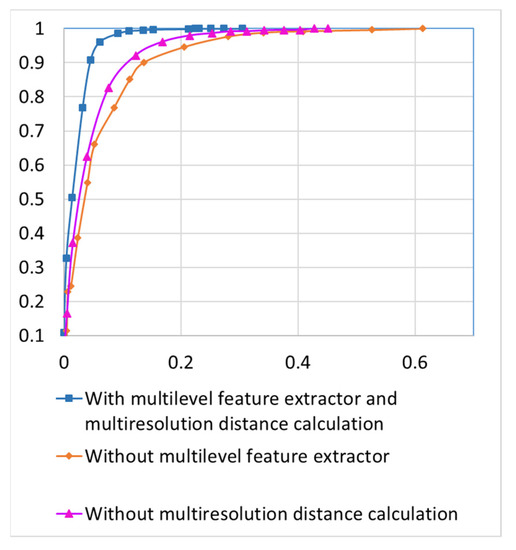
Figure 11.
Ablation study on incorrect scene detection.
5.3. Comment Analysis and Summarization
To generate labeled training data for comment boundary detection, we use the Tatoeba English corpus, which is a huge database of sentences. Almost all sentences in this corpus have correct punctuation and grammar. We randomly arrange and combine the sentences in this corpus to generate new sentences in order to simulate the unstructured format we encounter in the user-uploaded comments. By deleting or converting the punctuation marks and randomly changing the capitalization in the sentence, we can simulate some common cases of informal grammar and improper usage of punctuation marks that can be found in the comments. We have previously observed that comments often use “,” or “;” as a separator between different sentences. Moreover, the beginning of sentences is not often capitalized. As a result, we randomly change the beginning letter of the sentence to lowercase, or replace “.” with “,” or “;” to simulate these mistakes in our dataset. Since the new sentences are generated by combining the original sentences in the Tatoeba English corpus, the boundaries are known and can be automatically labeled. When the dataset is generated, the labeling system marks the beginning of each original sentence as B-CMT and the remainder as O. An example of labeled data for comment boundary detection is shown in Figure 12.
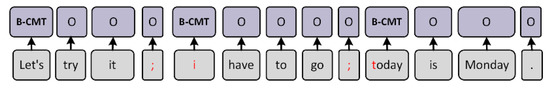
Figure 12.
Example of labeled data for comment boundary detection.
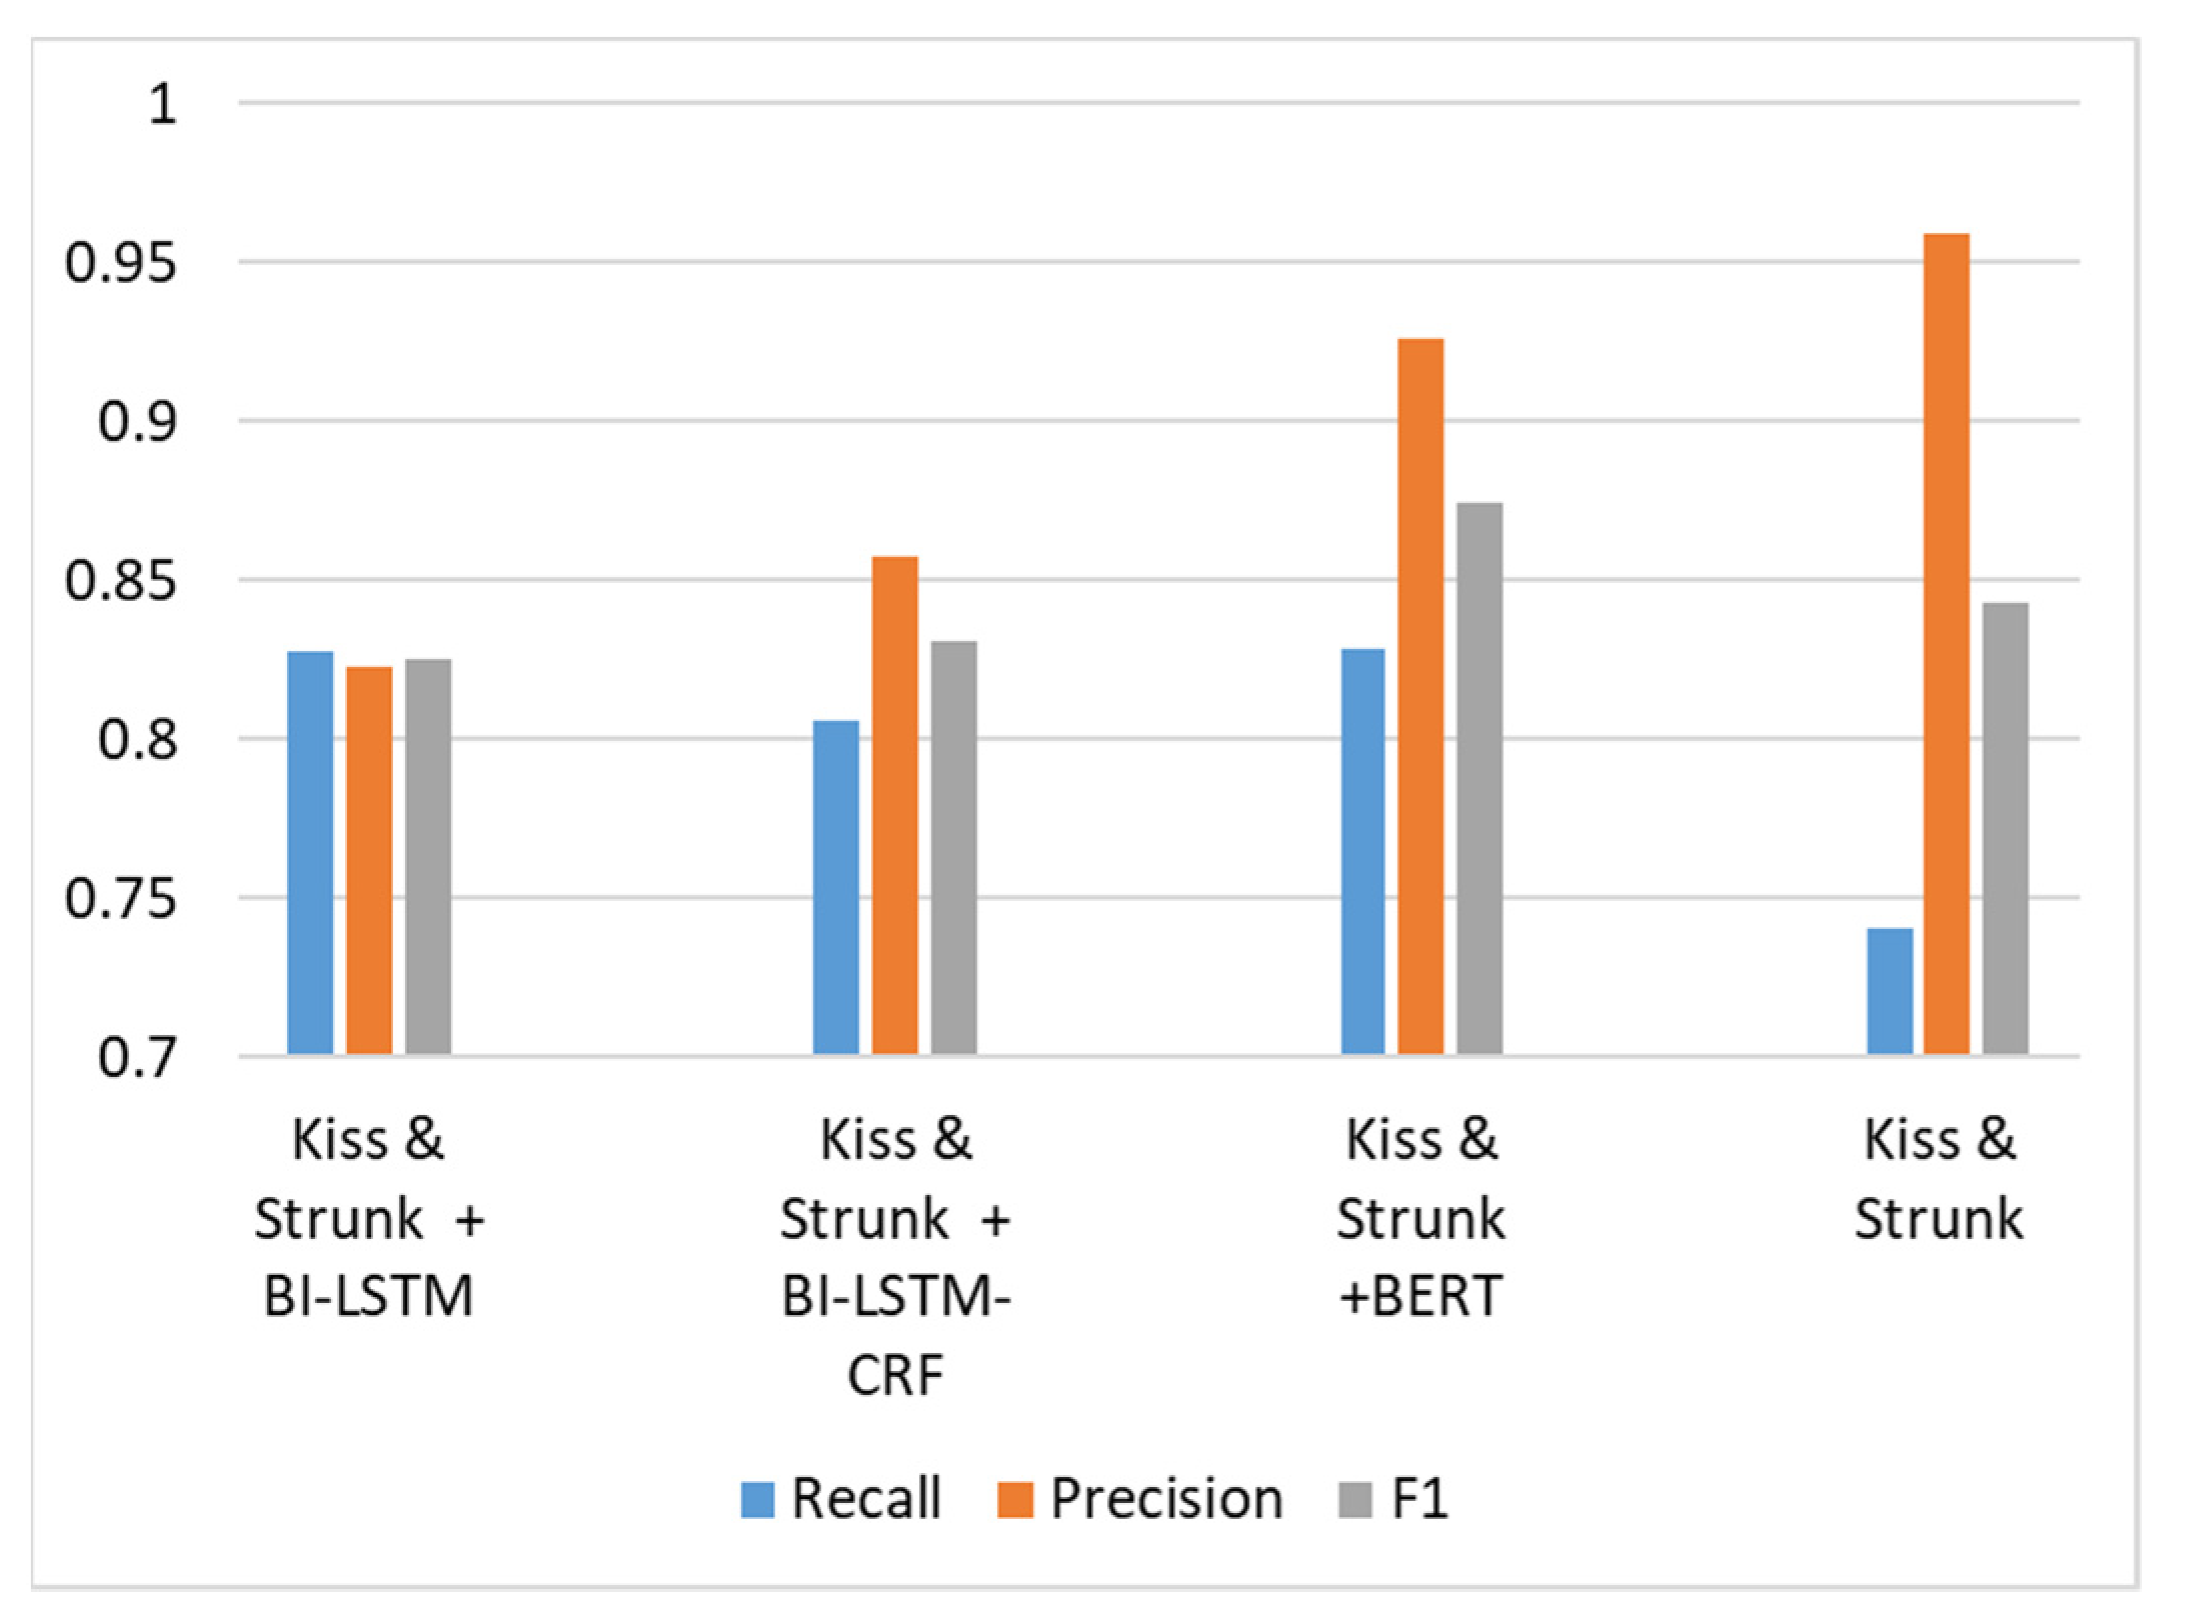
The accuracies of comment boundary detection using different methods are shown in Figure 13. The method proposed by Kiss and Strunk [20] is an unsupervised method. It has the highest precision. However, the recall rate is very low because it cannot detect comment boundaries that are separated by the punctuation marks “,” and “;”. In Figure 13, we can observe that adding supervised detection models to detect comment boundaries with informal grammar or incorrect punctuation marks would increase the recall rate but sacrifice the precision rate at the same time. Compared with BI-LSTM and BI-LSTM-CRF, using the BERT model as explained in the proposed method can better balance the tradeoff between increasing the recall rate and decreasing the precision rate. Therefore, the proposed method exhibits the best F1 score compared to that of all other models.
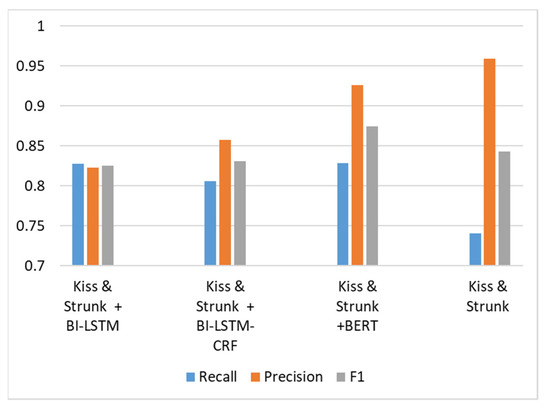
Figure 13.
Comment boundary detection results using different models.
The sentiment classification model is trained with data collected from Booking.com because they provide positive reviews and negative reviews separately. Examples of positive and negative comments for sentiment classification are displayed in Figure 14. We collect reviews from 1000 different hotels, with a total of 910,000 reviews. Among them, there are 490,000 positive reviews and 420,000 negative reviews. The accuracies of sentiment classification using different models are illustrated in Figure 15. We can observe that BERT outperforms BI-LSTM [34], ELMO-LSTM [35], and VADER [36] in the classification task.

Figure 14.
Examples of data collection for sentiment classification.
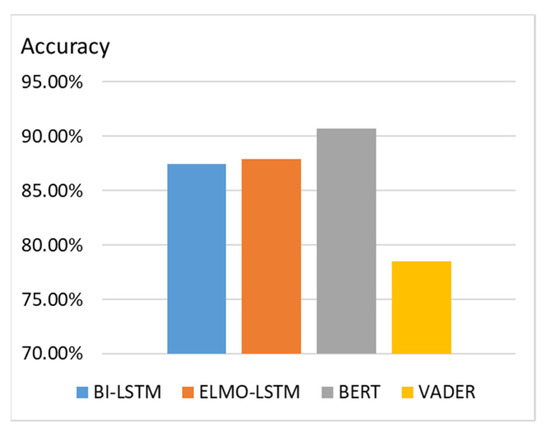
Figure 15.
Accuracy of sentiment classification using different models.
To train the proposed keyword extraction model, 10,000 comments are used as the training set and 6000 comments are used as the testing set. These comments are automatically annotated according to the keywords and non-keywords listed in Table 3.
Table 3.
Keywords and non-keywords in the training set.
Table 4 lists the detection accuracy for the selective testing of keywords and non-keywords. We can observe that the proposed model can effectively detect keywords that are not seen in the training process. Moreover, the false detection of non-keywords is rare.
Table 4.
Selective keyword detection accuracy for the testing set.
We apply three different keyword detection methods on the reviews of DoubleTree by Hilton Hotel New York Times Square West downloaded from Booking.com. The keywords detected by TextRank [24], YAKE [25], and the proposed method are listed in Table 5. We can observe that TextRank and YAKE detect terms that appear in high numbers in the reviews. However, some of these terms, such as “great”, “good”, “walking”, “wait”, and “time”, are not ideal keywords. The results extracted using the proposed methods are keywords that can better represent the core subjects described by the input sentences.
Table 5.
Comparison of different keyword detection methods.
Since there were no ground truth summaries of reviews to evaluate the quality of the summarization results, it was not suitable to use traditional metrics to obtain quantitative evaluation statistics. Therefore, we performed a subjective evaluation instead of an objective evaluation on review summarization. Thirty users were invited to evaluate the summaries generated by the proposed method, T5 [9], and BART [11]. Each user was asked to evaluate the generated review summaries of 100 hotels. The summaries generated by the different methods were presented to the users at the same time without letting them know which summary was generated by which method. Each user performed an evaluation by giving rankings to the results in terms of summary quality. Among all users, 91.3% of them preferred the proposed method over T5, and 89.6% of them preferred the proposed method over BART. The subjective evaluation shows that the proposed method can generate better review summaries.
6. Conclusions
In the proposed framework, three main functionalities are designed to organize the cluttered information in user-uploaded databases. The main functionalities are scene classification, data cleaning, and comment summarization. First, an improved scene classification scheme is proposed to integrate the RGB image features, segmentation features, and the features of discriminative objects with an attention module. A segmentation mask provides the semantic information of a scene, and discriminative objects are helpful in enhancing inter-class discriminability. Second, a data cleaning scheme that utilizes a multilevel feature extractor and a multiresolution distance calculation scheme is incorporated to detect and eliminate incorrect scenes. It can successfully detect isolated outliers in an image set with a large variety of images that are taken from different camera angles. Finally, a comment summarization scheme is proposed to organize the reviews. It can overcome the problems of unstructured sentences and the improper usage of punctuation marks, which are commonly found in user comments. A system that can classify and organize scenes and comments for hotels is implemented and evaluated to validate the effectiveness of the proposed framework. Ablation studies of the modules in the proposed framework and comparisons with existing related studies are also performed. The experimental results in the ablation studies validate the module design of the proposed framework. The comparisons with existing related studies also show the superiority of the proposed schemes.
Author Contributions
Conceptualization, H.-Y.C.; methodology, H.-Y.C.; validation, C.-C.Y.; formal analysis, H.-Y.C.; investigation, H.-Y.C.; resources, C.-C.Y.; data curation, H.-Y.C.; writing—original draft preparation, H.-Y.C.; writing, C.-C.Y.; supervision, H.-Y.C.; project administration, H.-Y.C.; funding acquisition, H.-Y.C. All authors have read and agreed to the published version of the manuscript.
Funding
This research was funded by Ministry of Science and Technology, grant number 110-2221-E-008-074-MY2.
Informed Consent Statement
Not applicable.
Data Availability Statement
Not applicable.
Conflicts of Interest
The authors declare no conflict of interest.
References
- Kolisetty, V.V.; Rajput, D.S. A review on the significance of machine learning for data analysis in big data. Jordanian J. Comput. Inf. Technol. 2020, 6, 155–171. [Google Scholar] [CrossRef]
- Basha, S.M.; Rajput, D.S. Survey on evaluating the performance of machine learning algorithms: Past contributions and future roadmap. In Deep Learning and Parallel Computing Environment for Bioengineering Systems; Academic Press: Cambridge, MA, USA, 2019; pp. 153–164. [Google Scholar]
- Deng, J.; Dong, W.; Socher, R.; Li, L.; Li, K.; Li, F.F. ImageNet: A large-scale hierarchical image database. In Proceedings of the IEEE Conference on Computer Vision and Pattern Recognition, Miami, FL, USA, 20–25 June 2009; pp. 248–255. [Google Scholar]
- Zhou, B.; Lapedriza, A.; Khosla, A.; Oliva, A.; Torralba, A. Places: A 10 million image database for scene recognition. IEEE Trans. Pattern Anal. Mach. Intell. 2018, 40, 1452–1464. [Google Scholar] [CrossRef] [PubMed] [Green Version]
- Bai, S.; Li, Z.; Hou, J. Learning two-pathway convolutional neural networks for categorizing scene images. Multimed. Tools Appl. 2017, 76, 16145–16162. [Google Scholar] [CrossRef]
- Herranz, L.; Jiang, S.; Li, X. Scene recognition with CNNs: Objects, scales and dataset bias. In Proceedings of the IEEE Conference on Computer Vision and Pattern Recognition (CVPR), Las Vegas, NV, USA, 27–30 June 2016; pp. 571–579. [Google Scholar]
- Cheng, X.; Lu, J.; Feng, J.; Yuan, B.; Zhou, J. Scene recognition with objectness. Pattern Recognit. 2018, 74, 474–487. [Google Scholar] [CrossRef]
- Lopez-Cifuentes, A.; Escudero-Vinolo, M.; Bescos, J.; Garcia-Martin, A. Semantic-Aware Scene Recognition. Pattern Recognit. 2020, 102, 107256. [Google Scholar] [CrossRef] [Green Version]
- Raffel, C.; Shazeer, N.; Roberts, A.; Lee, K.; Narang, S.; Matena, M.; Zhou, Y.; Li, W.; Liu, P.J. Exploring the limits of transfer learning with a unified text-to-text transformer. J. Mach. Learn. Res. 2020, 21, 1–67. [Google Scholar]
- Vaswani, A.; Shazeer, N.; Parmar, N.; Uszkoreit, J.; Jones, L.; Gomez, A.N.; Kaiser, L.; Polosukhin, I. Attention is all you need. Adv. Neural Inf. Process. Syst. 2017, 30, 1–11. [Google Scholar]
- Lewis, M.; Liu, Y.; Goyal, N.; Ghazvininejad, M.; Mohamed, A.; Levy, O.; Stoyanov, V.; Zettlemoyer, L. BART: Denoising sequence-to-sequence pre-training for natural language generation, translation, and comprehension. In Proceedings of the 58th Annual Meeting of the Association for Computational Linguistics, Seattle, WA, USA, 5–10 July 2020; pp. 7871–7880. [Google Scholar]
- Hermann, K.M.; Kočiský, T.; Grefenstette, E.; Espeholt, L.; Kay, W.; Suleyman, M.; Blunsom, P. Teaching machines to read and comprehend. In Proceedings of the 28th International Conference on Neural Information Processing Systems, Montreal, QC, Canada, 7–12 December 2015; Volume 1, pp. 1693–1701. [Google Scholar]
- Narayan, S.; Cohen, S.B.; Lapata, M. Don’t give me the details, just the summary! topic-aware convolutional neural networks for extreme summarization. In Proceedings of the Conference on Empirical Methods in Natural Language Processing, Brussels, Belgium, 31 October–4 November 2018; pp. 1797–1807. [Google Scholar]
- Liu, Y.; Lapata, M. Text summarization with pretrained encoders. In Proceedings of the Conference on Empirical Methods in Natural Language Processing, Hong Kong, China, 3–7 November 2019; pp. 3730–3740. [Google Scholar]
- He, K.; Gkioxari, G.; Dollár, P.; Girshick, R. Mask R-CNN. In Proceedings of the IEEE International Conference on Computer Vision, Venice, Italy, 22–29 October 2017; pp. 2980–2988. [Google Scholar]
- Lin, T.Y.; Maire, M.; Belongie, S.; Hays, J.; Perona, P.; Ramanan, D.; Dollar, P.; Zitnick, C.L. Microsoft coco: Common objects in context. In Proceedings of the European Conference on Computer Vision, Zurich, Switzerland, 6–12 September 2014; pp. 740–755. [Google Scholar]
- Deng, J.; Bei, S.; Shaojing, S.; Zhen, Z. Feature Fusion Methods in Deep-Learning Generic Object Detection: A Survey. In Proceedings of the 2020 IEEE 9th Joint International Information Technology and Artificial Intelligence Conference (ITAIC), Chongqing, China, 11–13 December 2020; pp. 431–437. [Google Scholar]
- Cheng, H.Y.; Yu, C.C. Automatic Data Cleaning System for Large-Scale Location Image Databases using a Multilevel Extractor and Multiresolution Dissimilarity Calculation. IEEE Intell. Syst. 2021, 36, 49–56. [Google Scholar] [CrossRef]
- Nguyen, D.Q.; Nguyen, D.Q.; Pham, D.D.; Pham, S.B. A Robust Transformation-Based Learning Approach Using Ripple Down Rules for Part-Of-Speech Tagging. AI Commun. 2016, 29, 409–422. [Google Scholar] [CrossRef] [Green Version]
- Honnibal, M.; Johnson, M. An Improved Non-monotonic Transition System for Dependency Parsing. In Proceedings of the Conference on Empirical Methods in Natural Language Processing, Lisbon, Portugal, 17–21 September 2015; pp. 1373–1378. [Google Scholar]
- Kiss, T.; Strunk, J. Unsupervised Multilingual Sentence Boundary Detection. Comput. Linguist. 2006, 32, 485–525. [Google Scholar] [CrossRef]
- Basha, S.M.; Rajput, D.S. A roadmap towards implementing parallel aspect level sentiment analysis. Multimed. Tools Appl. 2019, 78, 29463–29492. [Google Scholar] [CrossRef]
- Rajaraman, A.; Ullman, J.D. Data Mining. In Mining of Massive Datasets; Cambridge University Press: Cambridge, UK, 2011; pp. 1–17. [Google Scholar]
- Mihalcea, R.; Tarau, P. TextRank—Bringing order into texts. In Proceedings of the Conference on Empirical Methods in Natural Language Processing, Barcelona, Spain, 25–26 July 2004; pp. 404–411. [Google Scholar]
- Campos, R.; Mangaravite, V.; Pasquali, A.; Jorge, A.M.; Nunes, C.; Jatowt, A. Yake! collection-independent automatic keyword extractor. In Advances in Information Retrieval, Proceedings of the 40th European Conference on IR Research, ECIR 2018, Grenoble, France, 26–29 March 2018; Springer: Cham, Switzerland, 2018; pp. 806–810. [Google Scholar]
- Warstadt, A.; Singh, A.; Bowman, S.R. Neural network acceptability judgments. Trans. Assoc. Comput. Linguist. 2019, 7, 625–641. [Google Scholar] [CrossRef]
- Reimers, N.; Gurevych, I. Sentence-BERT: Sentence Embeddings using Siamese BERT-Networks. In Proceedings of the 2019 Conference on Empirical Methods in Natural Language Processing and the 9th International Joint Conference on Natural Language Processing, Hong Kong, China, 3–7 November 2019; pp. 3973–3983. [Google Scholar]
- Rasiwasia, N.; Vasconcelos, N. Holistic context models for visual recognition. IEEE Trans. Pattern Anal. Mach. Intell. 2012, 34, 902–917. [Google Scholar] [CrossRef] [PubMed] [Green Version]
- Li, L.J.; Su, H.; Lim, Y. Object bank: An object-level image representation for high-level visual recognition. Int. J. Comput. Vis. 2014, 107, 20–39. [Google Scholar] [CrossRef]
- Bo, L.; Ren, X.; Fox, D. Kernel descriptors for visual recognition. In Proceedings of the Conference on Neural Information Processing Systems, Vancouver, BC, Canada, 6–11 December 2010; pp. 244–252. [Google Scholar]
- Kwitt, R.; Vasconcelos, N.; Rasiwasia, N. Scene recognition on the semantic manifold. In Proceedings of the European Conference on Computer Vision, Florence, Italy, 7–13 October 2012; pp. 359–372. [Google Scholar]
- Song, H.O.; Girshick, R.; Zickler, S. Generalized sparselet models for real-time multiclass object recognition. IEEE Trans. Pattern Anal. Mach. Intell. 2015, 37, 1001–1012. [Google Scholar] [CrossRef] [PubMed]
- Zhang, L.; Zhen, X.; Shao, L. Learning object-to-class kernels for scene classification. IEEE Trans. Image Process. 2014, 23, 3241–3253. [Google Scholar] [CrossRef] [PubMed]
- Xu, G.; Meng, Y.; Qiu, X.; Yu, Z.; Wu, X. Sentiment Analysis of Comment Texts Based on BiLSTM. IEEE Access 2019, 7, 51522–51532. [Google Scholar] [CrossRef]
- Peters, M.; Neumann, M.; Iyyer, M.; Gardner, M.; Clark, C.; Lee, K.; Zettlemoyer, L. Deep contextualized word representations. In Proceedings of the Annual Conference of the North American Chapter of the Association for Computational Linguistics, New Orleans, LA, USA, 1–6 June 2018; pp. 2227–2237. [Google Scholar]
- Hutto, C.J.; Gilbert, E. VADER: A Parsimonious Rule-Based Model for Sentiment Analysis of Social Media Text. In Proceedings of the International AAAI Conference on Web and Social Media, Ann Arbor, MI, USA; 2014; Volume 8, pp. 216–225. [Google Scholar]


Publisher’s Note: MDPI stays neutral with regard to jurisdictional claims in published maps and institutional affiliations. |
© 2022 by the authors. Licensee MDPI, Basel, Switzerland. This article is an open access article distributed under the terms and conditions of the Creative Commons Attribution (CC BY) license (https://creativecommons.org/licenses/by/4.0/).