Article

An Endoscope Image Enhancement Algorithm Based on Image Decomposition

1
School of Integrated Circuits, Anhui University, Hefei 230601, China
2
Anhui Engineering Laboratory of Agro-Ecological Big Data, Hefei 230601, China
3
School of Humanities, Shanghai University of Finance and Economics, Shanghai 200433, China
*
Author to whom correspondence should be addressed.
Electronics 2022, 11(12), 1909; https://doi.org/10.3390/electronics11121909
Submission received: 5 June 2022 / Revised: 14 June 2022 / Accepted: 16 June 2022 / Published: 19 June 2022
(This article belongs to the Topic Computer Vision and Image Processing)

Abstract

:
The visual quality of endoscopic images is a significant factor in early lesion inspection and surgical procedures. However, due to the interference of light sources, hardware, and other configurations, the endoscopic images collected clinically have uneven illumination, blurred details, and contrast. This paper proposed a new endoscopic image enhancement algorithm. The image decomposes into a detail layer and a base layer based on noise suppression. The blood vessel information is stretched by channel in the detail layer, and adaptive brightness correction is performed in the base layer. Finally, Fusion obtained a new endoscopic image. This paper compares the algorithm with six other algorithms in the laboratory dataset. The algorithm is in the leading position in all five objective evaluation metrics, further indicating that the algorithm is ahead of other algorithms in contrast, structural similarity, and peak signal-to-noise ratio. It can effectively highlight the blood vessel information in endoscopic images while avoiding the influence of noise and highlight points. The proposed algorithm can well solve the existing problems of endoscopic images.

1. Introduction

Medical endoscopy is of great significance in early lesion screening and improving the success rate of surgical operations. Whether it is the tracking detection of wireless capsule endoscopy [1] or the high-precision surgical navigation of AR (Augmented Reality) [2], it is closely related to the endoscopic image. The visual quality of endoscopic imaging is often affected by the intricacies of the internal structure of the human body, plus factors such as light source interference [3] and hardware limitations during endoscopic image acquisition, while the cost of access to the underlying image processing side of the hardware is vast [4], so we can improve the results of conventional endoscopic imaging.
Under normal circumstances, uneven illumination and low contrast are the most critical factors affecting the clinical diagnosis of endoscopy [5]. At the same time, further lesion inspection and polyp diagnosis are inseparable from high-quality endoscopic images. To improve image quality, early researchers made a series of improvements based on gamma correction [6] and a single-scale retinex [7] algorithm. Huang et al. [8] proposed weighted adaptive gamma correction (AGCWD), which adaptively modifies the function curve by normalizing the gamma function to achieve the effect of adaptive correction of luminance. Jobson et al. [9] proposed Multi-Scale Retinex (MSRCR) with a color recovery function to solve the phenomenon of color distortion and saturation loss arising in the enhanced images. However, it is difficult to maintain the brightness and color fidelity of endoscopic images alone when these methods are applied to endoscopic images.
Image enhancement algorithms based on multi-exposure fusion are also widely used in image processing [10]. Hayat et al. [11] proposed a multi-exposure fusion technology based on multi-resolution fusion, which effectively solved the problem of image artifacts. Ying et al. [12] proposed an accurate image contrast enhancement algorithm to solve the problem of insufficient contrast in some areas of the image and excessive contrast in some areas, to use illumination estimation technology to design a fusion weight matrix, and to synthesize multi-exposure images through the camera response model.
Histogram equalization (HE) [13] is commonly used for image contrast enhancement due to the ease and straightforwardness of implementation. Still, its application to endoscopic images can lead to noise amplification and over-enhancement problems. To solve the defects of histogram equalization, researchers proposed some algorithms based on histogram equalization improvement. Zuiderveld et al. [14] proposed restricted contrast adaptive histogram equalization (CLAHE) using threshold clipping histogram to prevent over enhancement. Chang et al. [15] proposed quadruple histogram equalization by dividing the image into four sub-images through the mean and variance of the image histogram. However, these methods cannot handle the luminance error and have certain limitations.
More and more algorithms for medical image enhancement have been developed in recent years. Al-Ameen et al. [16] proposed a new algorithm to improve the low contrast of CT images by adjusting the single-scale Retinex and adding a normalized Sigmoid function to improve the contrast of CT images. Palanisamy et al. [17] proposed a framework for enhancing color fundus images by improving luminance using gamma correction and singular value decomposition and local contrast using contrast-limited adaptive histogram equalization (CLAHE), which adequately preserves detail while improving visual perception. Wang et al. [4] proposed an endoscopic image brightness enhancement technique based on the inverse square law of illumination and retinex to solve problems such as overexposure and color errors arising from endoscopic image brightness enhancement. An initial luminance weighting based on the inverse square law of illuminance is designed. A saturation-based model is proposed to finalize the luminance weighting, effectively reducing image degradation caused by bright spots. These algorithms cannot solve the defects of endoscopic images in a multifaceted way.
To ensure the outstanding effect of the underlying blood vessel details without color distortion, this paper proposes a new endoscopic image enhancement framework. Global enhancement with noise suppression, brightness correction by adaptive bilateral gamma function for the base layer separated by weighted least squares based, the separated detail layer is subjected to sub-channel selective adaptive stretching with high highlight suppression to achieve the effect of detail enhancement. The main contributions of this paper are as follows:
1. This paper proposes a novel framework for endoscopic image enhancement to avoid the interference of high brightness and noise in endoscopic imaging by separating the noise layer and high brightness mask.
2. According to the characteristics of endoscopic images, an adaptive brightness correction function based on bilateral gamma is proposed, which enhances the brightness of light and dark areas while preventing excessive enhancement of high-light areas.
3. According to the color characteristics of endoscopic images, this paper proposes a detail layer sub-channel processing method, which uses different image weights for each channel for scaling. Then, the detail layer enhancement factor was designed according to the connection before and after the base layer enhancement. It achieves the effect of detail enhancement while highlighting the color features of endoscopic images.

2. Dataset Introduction

We collected 200 endoscopic images jointly with Hefei Deming Electronics Co., Ltd. (Hefei, China) and the First Affiliated Hospital of Anhui Medical University. Create a dataset named LEI_D, as shown in Figure 1. The LEI_D dataset is used to carry out real minimally invasive surgeries in the relevant departments of the hospital through the CMOS image sensor dedicated to endoscopy and the endoscopy system developed by the company. The video is stored in MP4 format on the endoscopy device side to the mobile hard disk without communication through network encoding to ensure the video’s original quality.
The LEI_D dataset is collected from different departments such as urology, thoracic surgery, oncology, cardiovascular surgery, cardiovascular surgery, otolaryngology, nephrology, obstetrics and gynecology, and hepatobiliary and pancreatic surgery. The collected endoscopic images cover different organ tissues and lesions in the human body, including oral cavity, nostril, bladder, liver, intestine, gallbladder, uterine fibroids, urinary tumors, pituitary adenomas, recurrent maxillary sinus tumors, gastric cancer, rectal cancer, etc. In addition, the dataset also covers some animal tissue images, such as chicken guts, intestines, bronchial tubes, etc.

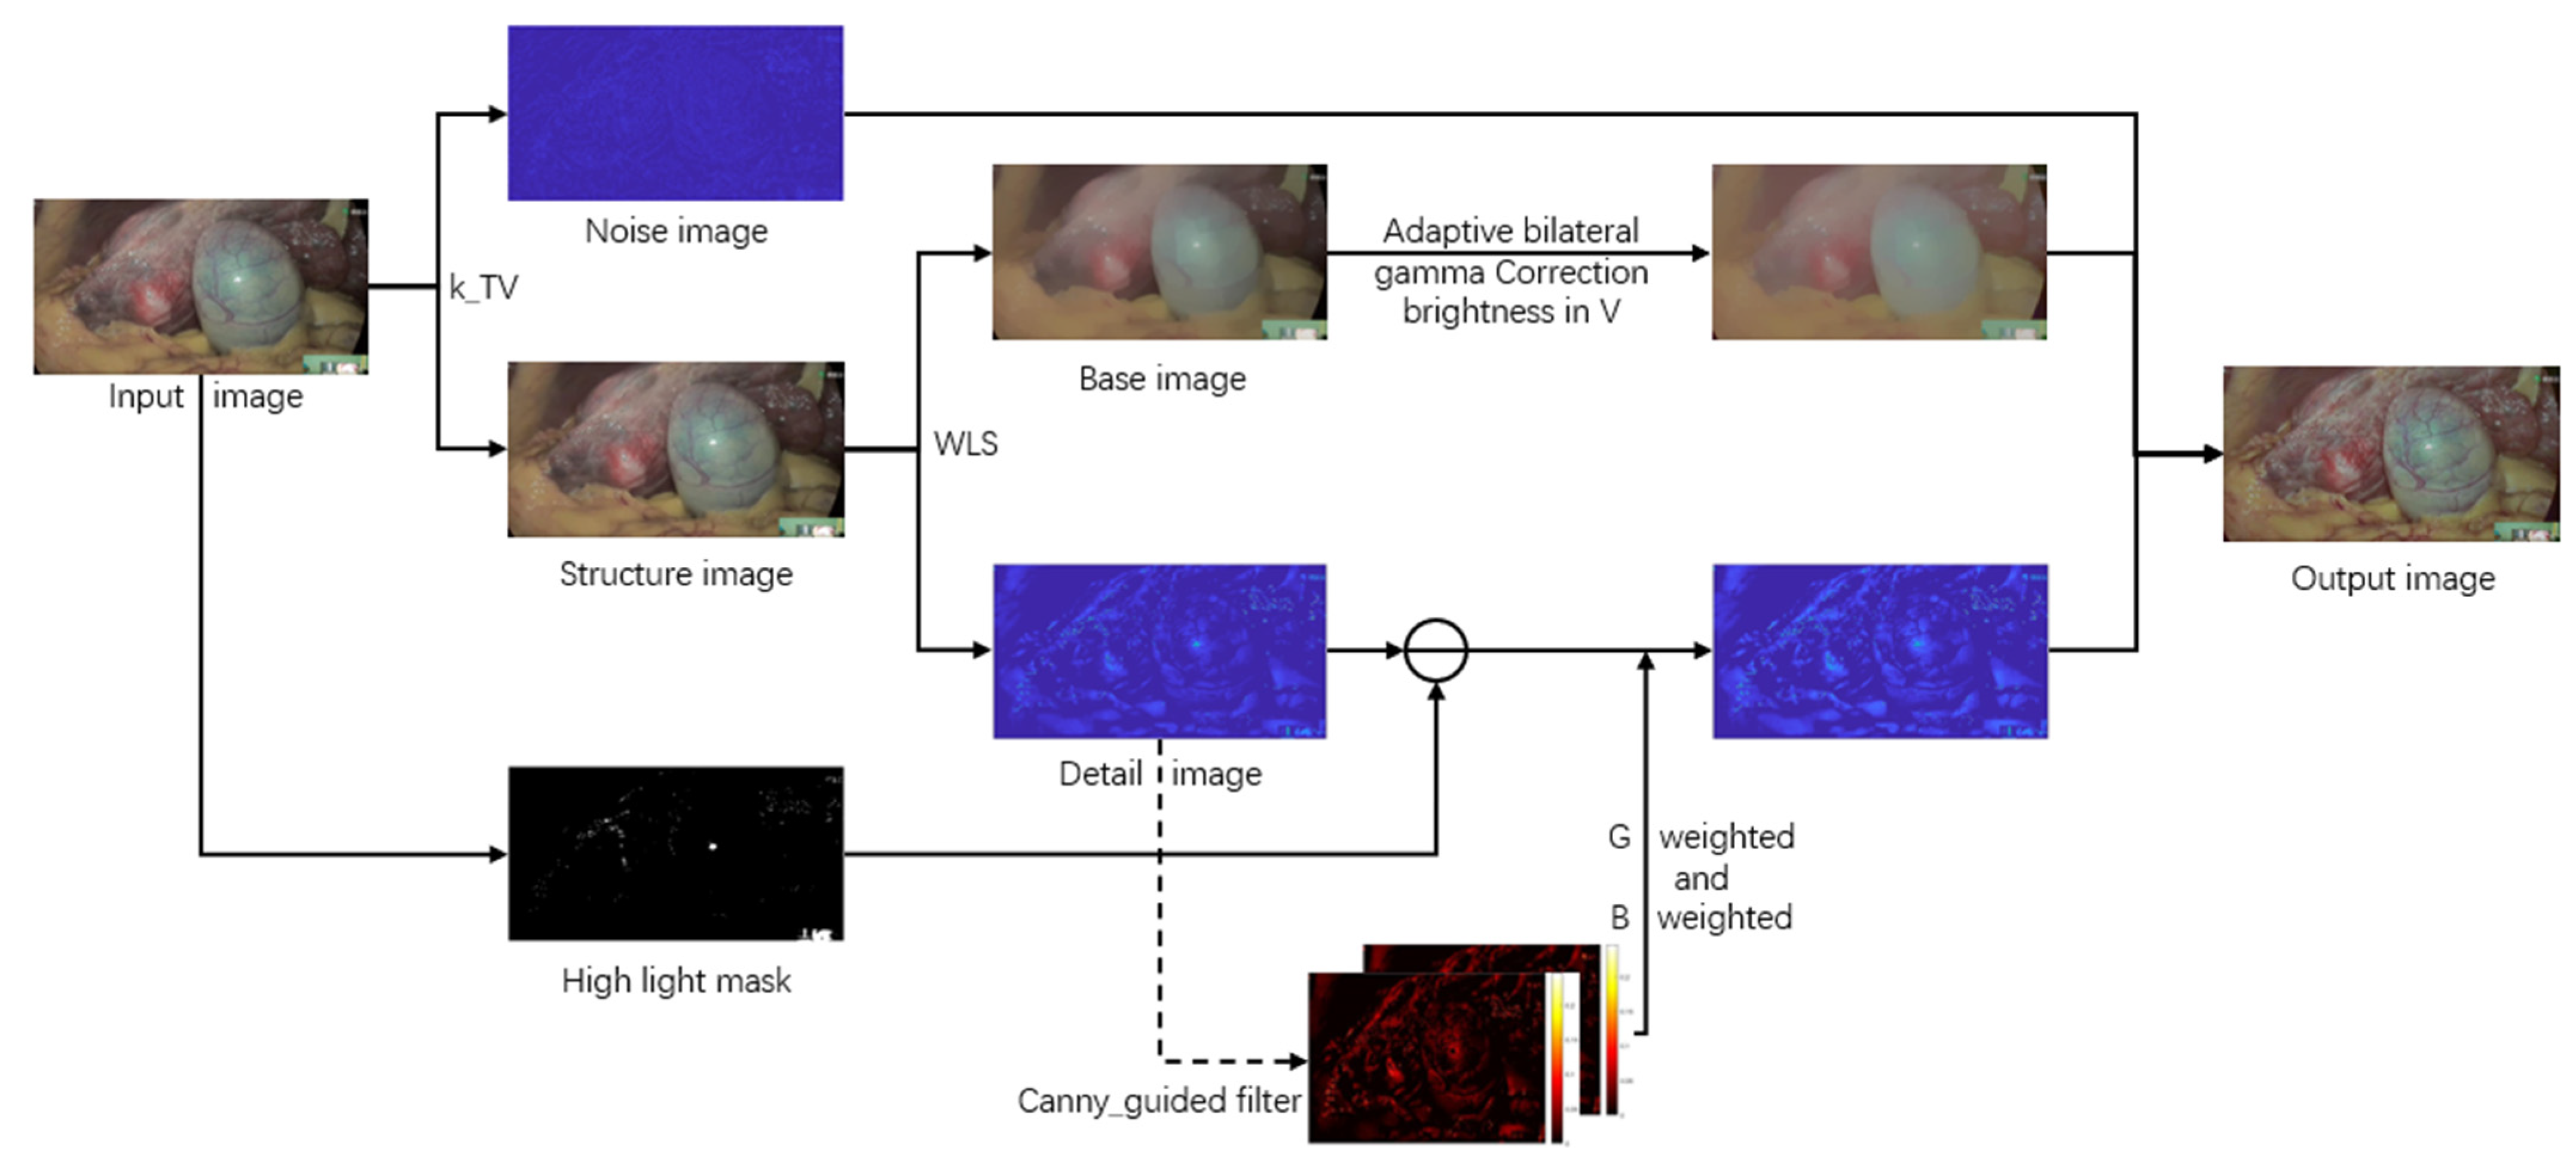
3. Proposed Algorithm

The framework flow of the algorithm is shown in Figure 2. which is inspired by the different absorption characteristics of human tissues for different spectra and the multipath processing mechanism. First, to prevent the effect of noise on microvascular imaging, the input map was decomposed into structural and noise layers according to a modified total-variation method for endoscopic image design and enhancement of structural layers with noise suppression. Secondly, to improve the image brightness and highlight local vascular information, the structural layer is divided into base and detail layers by the weighted least squares method. The main brightness information exists in the base layer, and the detail information such as blood vessels exists in the detail layer. In terms of brightness, the proposed adaptive bilateral gamma function is used to correct the brightness of the base layer; In terms of details, since the gain of the green and blue channels are more beneficial to highlight the detailed information of blood vessels and the highlighted area will affect the channel stretching effect, the three channels are selectively stretched on the premise of removing the highlight information. Finally, the improved base, detail, and noise layers are fused to obtain a result map with a better visual effect.

3.1. Modified Total-Variation to Extract the Noise Layer

In endoscopic images, there is usually some noise [18] that affects the image’s visual quality, the enhancement of the image will lead to noise amplification, and the removal of noise may cause the loss of information in particularly small blood vessels, so this paper adopts the method of noise suppression. Before the endoscopic image is enhanced, the corresponding noise layer is extracted by applying the improved global noise estimation of the endoscopic image to the total-variation method.
The image edge structure has strong second-order differential properties [19], so the image is sensitive to the noise statistics of the Laplace mask. We use a kernel consisting of two Laplacian masks to participate in the convolution operation (Equation (2)). Conventional noise estimates may contain vascular details since endoscopic images differ from conventional images. We add a noise suppression factor k to the arithmetic mean-based image noise estimation [20] algorithm to control the level of extracted noise. The set global noise parameter θ c is obtained from Equation (1).
θ c = ( π 2 1 6 ( W 2 ) ( H 2 ) ( x , y ) | ( I c N s ) ( x , y ) | ) ( 1 / k )
N S = ( 1 2 1 2 4 2 1 2 1 )
where represents the convolution operator, W and H represent the width and height of the image, Ic is the input image, and k is 40 in this paper (the value analysis of k is explained in the experimental analysis).
In the total-variation structure texture method [21], the input image consists of a superposition of a structural layer and a noise layer; The model is shown in Equation (3). Combined with TV (total variation) regularization, the structural layer is obtained by minimizing the objective function. This objective function (4) consists of two components. The first is a different term adapted to the texture components. The second is a regularization term based on the total amount of variation used to limit the details of the image.
I c ( x , y ) = I s t r u c t u r e c ( x , y ) + I n o i s e c ( x , y ) , c { R , G , B }
m i n ( x , y ) ( I s t r u c t u r e c ( x , y ) I c ( x , y ) ) 2 + λ c | I s t r u c t u r e c ( x , y ) |
where denotes the ladder segment operator and λ c is the parameter θ c obtained by the set endoscopic global noise estimation.

3.2. Weighted Least Squares Decomposition of Images

Perform the weighted least squares (WLS) [22] method on the structural layer to obtain the base layer, and then subtract the base layer from the structural layer to obtain the detail layer. The extraction of detail layers based on weighted least squares can extract good detail information while maintaining the original graph architecture. Compared to the artifacts that tend to appear with bilateral filtering and the complexity of bootstrap filtering to guide image selection, the weighted least squares method is applied to the endoscopic enhancement to smooth as much as possible in the areas with small gradients and keep as much as possible in the edge parts with strong gradients. After processing, we get a base layer with background brightness information of the subject and an avascular layer with minute detail information.
Decomposition Model:
I s t r u c t u r e c ( x , y ) = I b a s e c ( x , y ) + I d e t a i l c ( x , y ) , c { R , G , B }
WLS Model:
m i n I b a s e ( ( u p g p ) 2 + λ ( a x , p ( I s t r u c t u r e ) ( I b a s e x ) 2 + a y , p ( I b a s e I b a s e ) 2 ) )
where p represents the position of the pixel point, and ax and ay control the degree of smoothing at different positions. The first term represents that the input and output images are as similar as possible. The second term is a common term that smoothes the output image by minimizing the partial derivative. λ is used as a regularization parameter to balance the two weights.

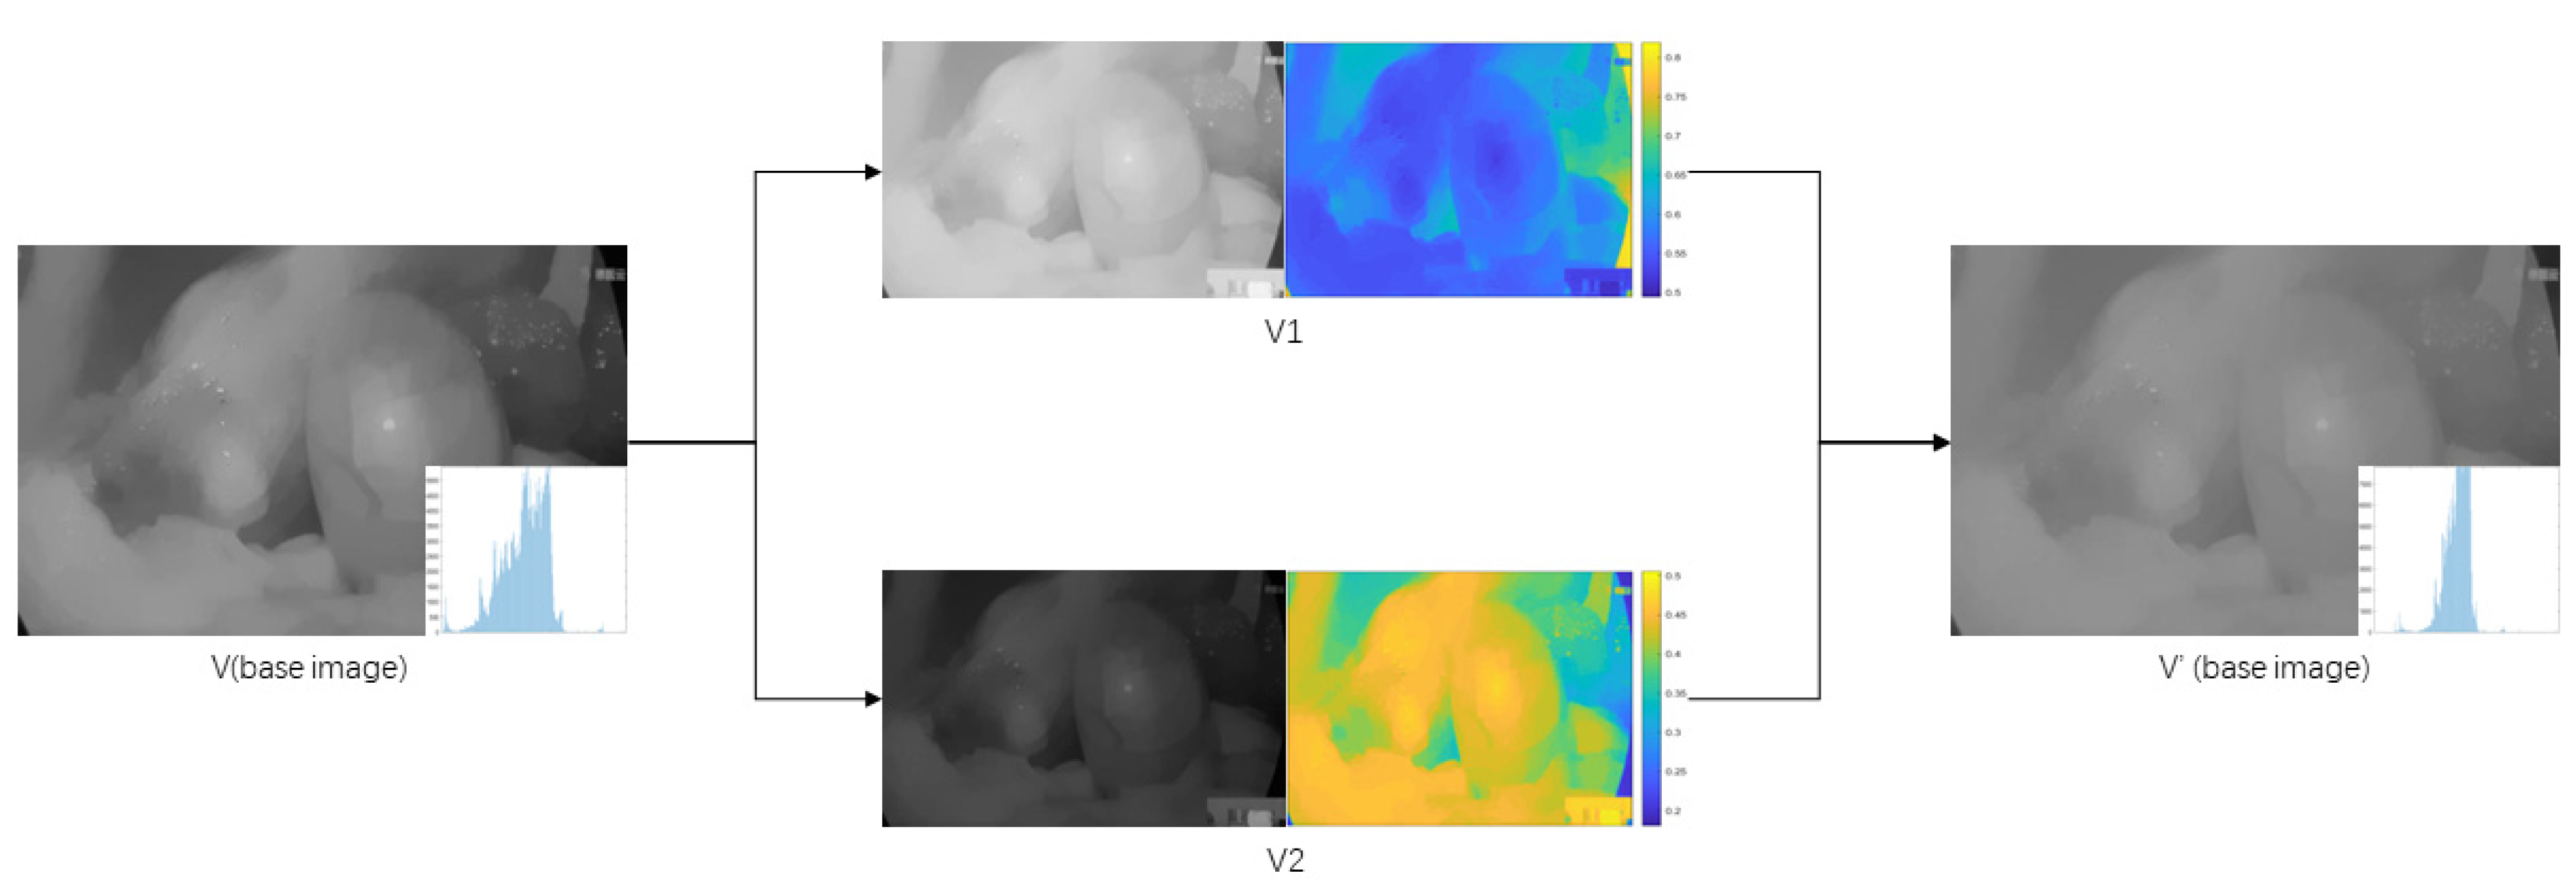
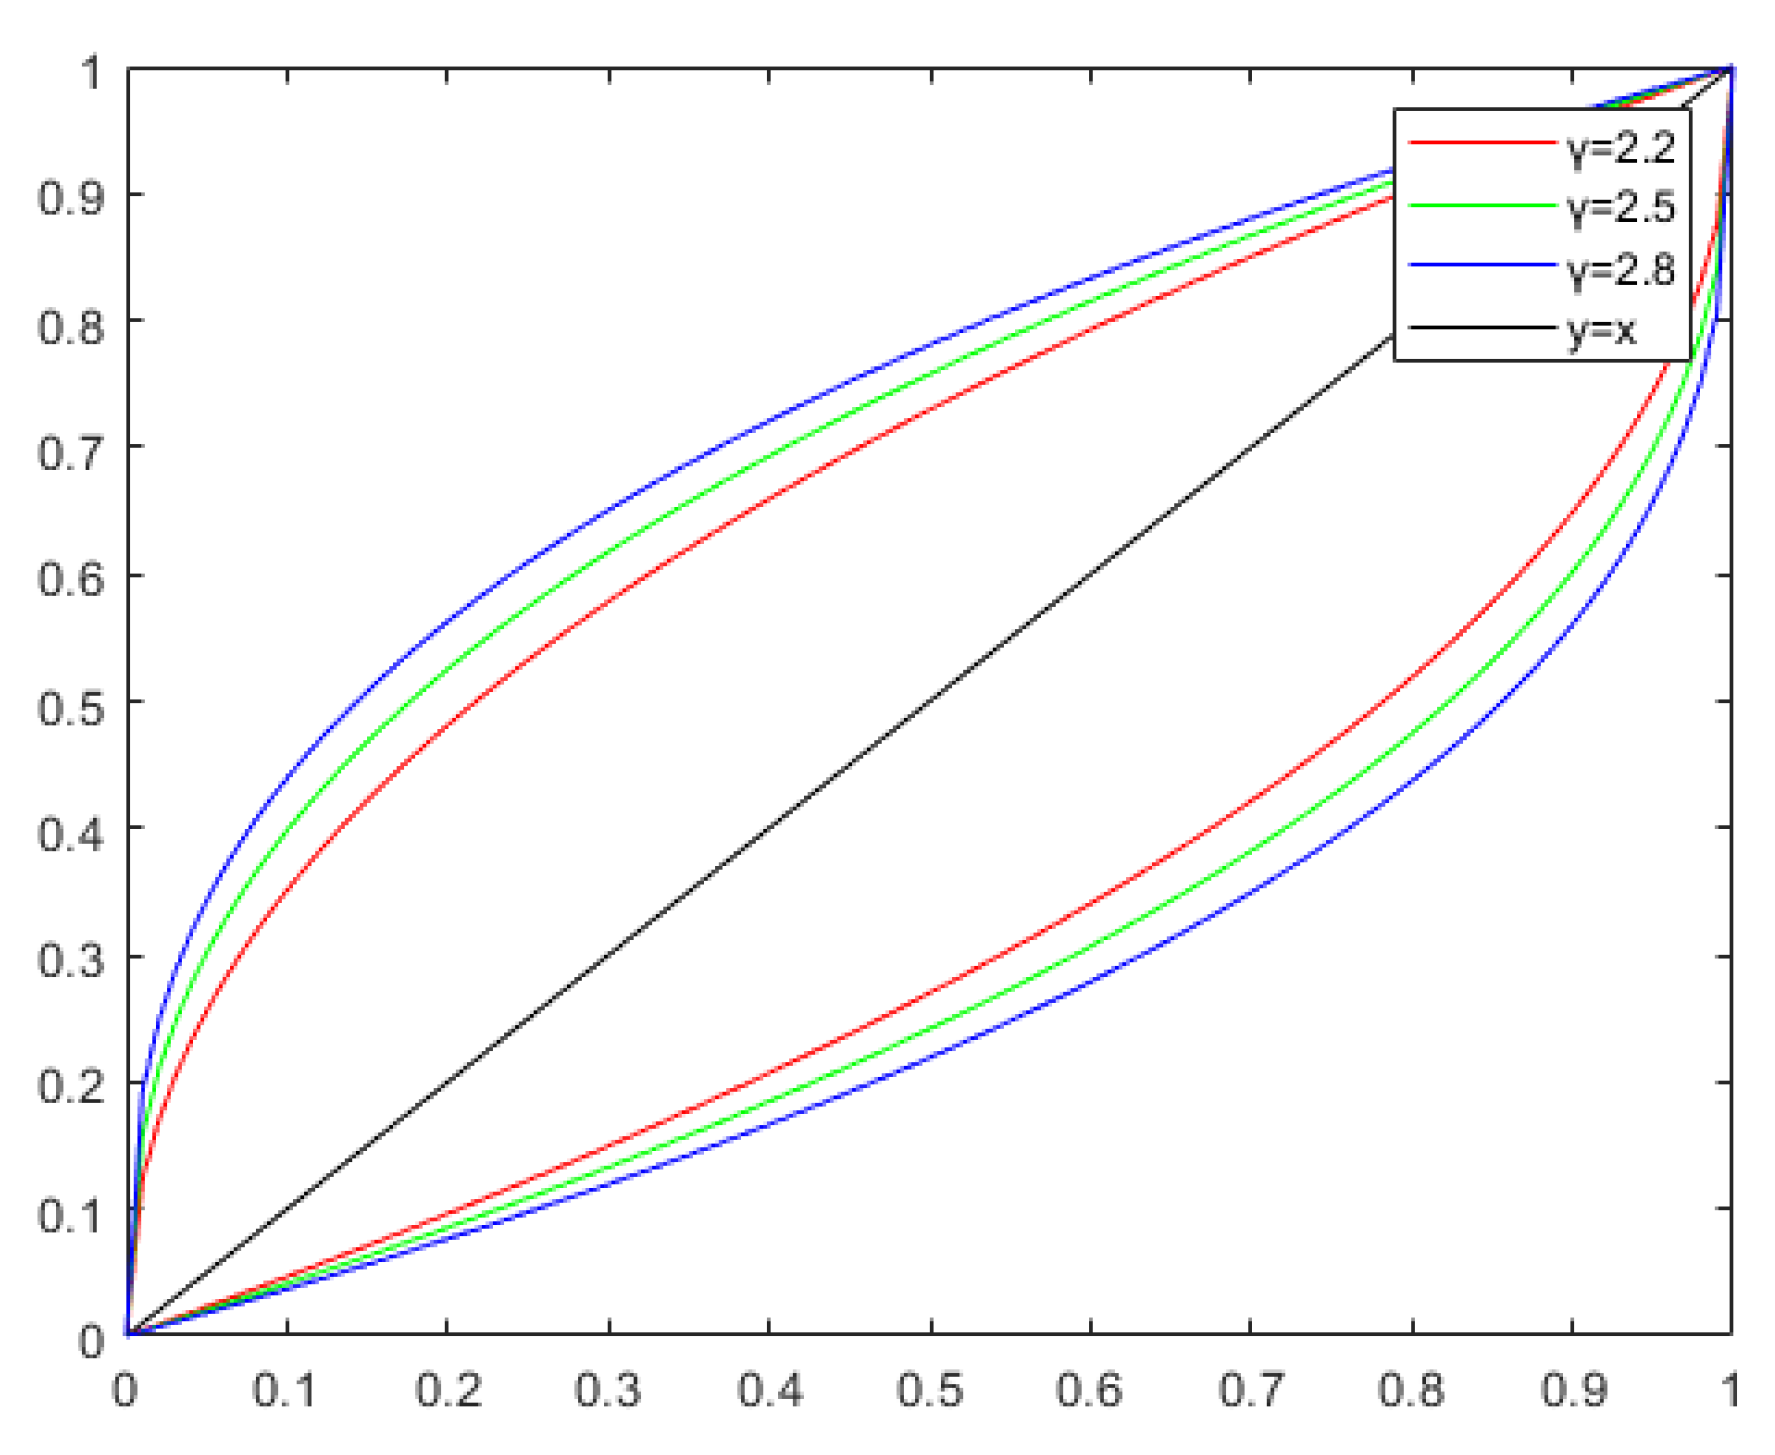
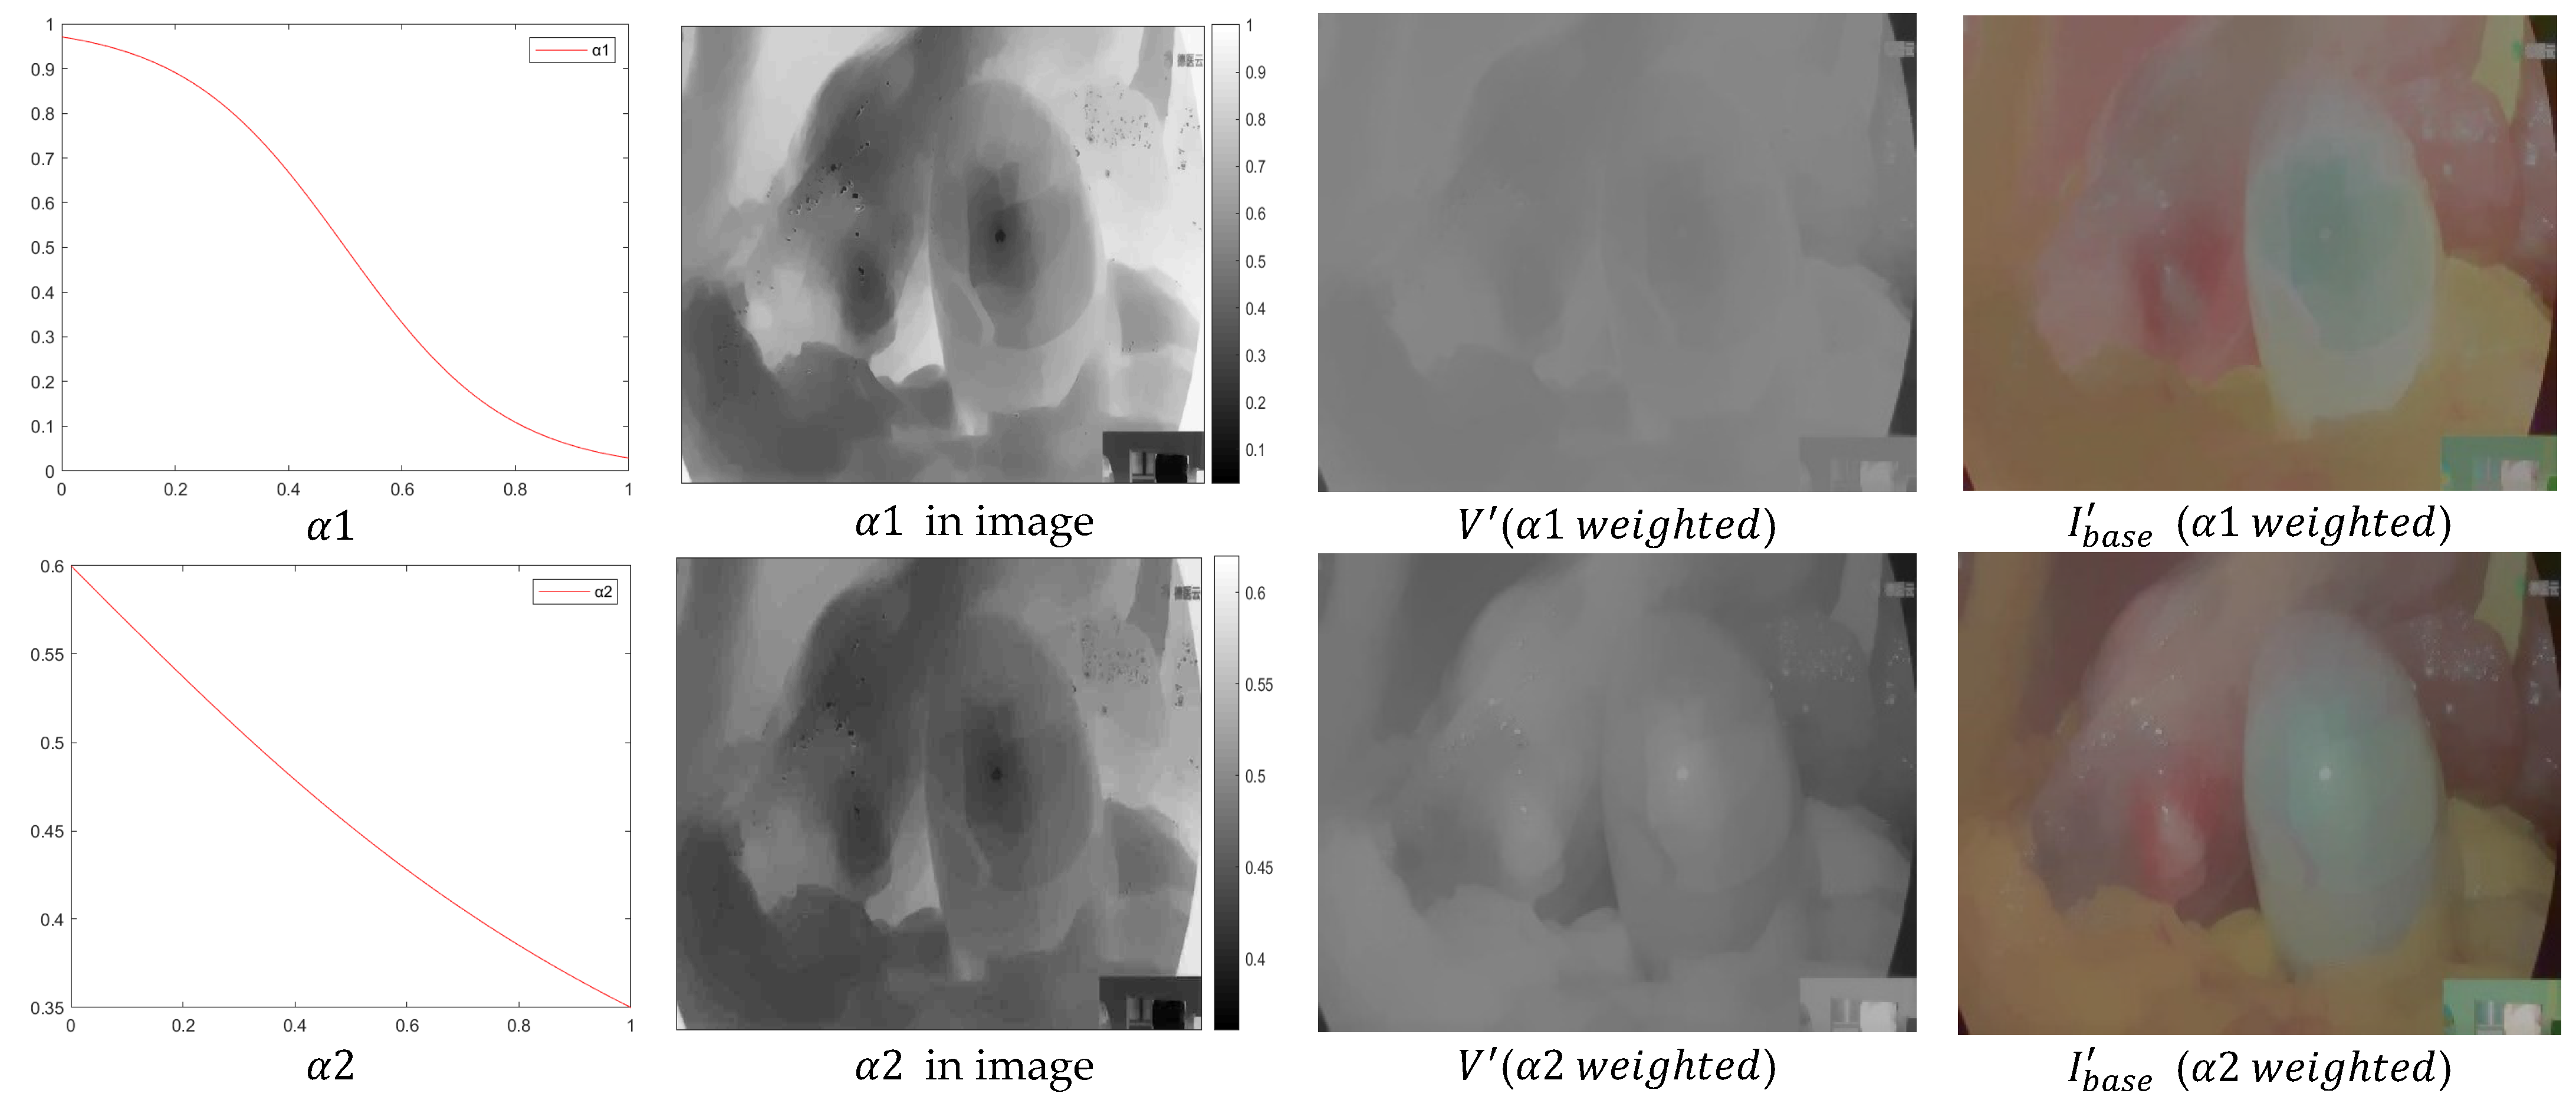
3.3. Adaptive Bilateral Gamma Correction Brightness

After observing a series of endoscopic images, it is found that there is a problem of uneven illumination in the endoscopic images, especially the dark area information cannot be well highlighted. To ensure that the brightness area is not over-enhanced and improve the brightness of the dark area without changing the color. In this paper, we use the bilateral gamma function to correct the luminance channel of the base layer and propose adaptive weighting of the image pixel positions. Figure 3 shows the flow chart of luminance correction.
Bilateral gamma functions:
V 1 ( l ) = l m a x ( l l m a x ) 1 / γ
V 2 ( l ) = l m a x l m a x ( 1 l l m a x ) 1 / γ
V ( l ) = α V 1 ( l ) + ( 1 α ) V 2 ( l )
where V is the base layer luminance channel in HSV color space, V is the corrected luminance channel. The internationally recommended γ value is 2.5.
As shown in Figure 4, Above y = x is the graph of V 1 with γ , and below y = x is the graph of V 2 with γ . As the value of γ increases, the function curve becomes steeper and steeper, indicating that the degree of change becomes more and more drastic. The images of V channels are corrected separately by bilateral gamma functions ( V 1   a n d   V 2 ) to get two images, V1 and V2. V1 is a brighter image by simple gamma correction and V2 is a darker image by negative gamma correction. So, when two images are fused, the brighter the region should have less weight, and the darker the region should have more weight. Combined with the curve change trend of the sigmoid function, this paper proposes adaptive weights α1.
α 1 = 1 1 ( 1 + e ( 7 ( 0.5 V ) ) )
The obtained functions, weights, and stretching effects are plotted in Figure 5. It can be seen that the brightness of the image deviates considerably, and the brightness is enhanced, but the enhancement is much more than the expected guesses. Some areas of the image appear too bright and too dark, which can blur the frame of the subject of the base layer. Therefore, functions of the sigmoid type are not suitable for stretching here, and α1 will be improved. Using the arctan curve transformation trend in the function, this paper proposes adaptive weights α2.
α 2 = φ ( 1 π ) arctan ( V )
By comparing the base layer obtained by the α2 function with the original base layer, it can be seen that this rendering has achieved a satisfactory result, and the brightness of the light and dark areas has been improved, while the brightness of the bright areas has not undergone excessive enhancement.
To reduce the algorithm’s complexity while optimizing its accuracy, the value of γ is obtained more precisely by the following steps.
Step1: m = 15 endoscopic images of different sites were selected (5 images each of bright, medium, and dark brightness) with γ ϵ (2.0–3.0).
Step2: Define a new comparison metric, which is a combination of two performance metrics (MSE (Mean Squared Error) [23] and SSIM (structural similarity index) [24]).
F = ( M S E / 10 ) 2 + ( S S I M ) 2 2
M S E = 1 M × N i = 1 M j = 1 N ( I b a s e I b a s e ) 2
Step3: The images are subjected to adaptive bilateral gamma correction according to the above method, and the indicator value F of each γ value is recorded when γ varies at a spacing of 0.1, and the average indicator F a v e corresponding to each γ value is calculated (i corresponds to the image serial number).
F a v e = i = 1 m F ( i ) / m
Step4: The optimal parameter of γ is selected after comparison.
The optimal parameter of γ is 2.2 when applied to the endoscopic image dataset, obtained by computational comparison.
It can be obtained from the above design process of this module. The adaptive bilateral gamma correction function we designed performs a reasonable scaling transformation of each pixel value of the base layer image by assigning corresponding weights to each pixel point for bilateral fusion. This method avoids the phenomenon of over-enhancement and over-compression in the local image area during the brightness correction process so that the problem of uneven brightness in endoscopic images is effectively solved.

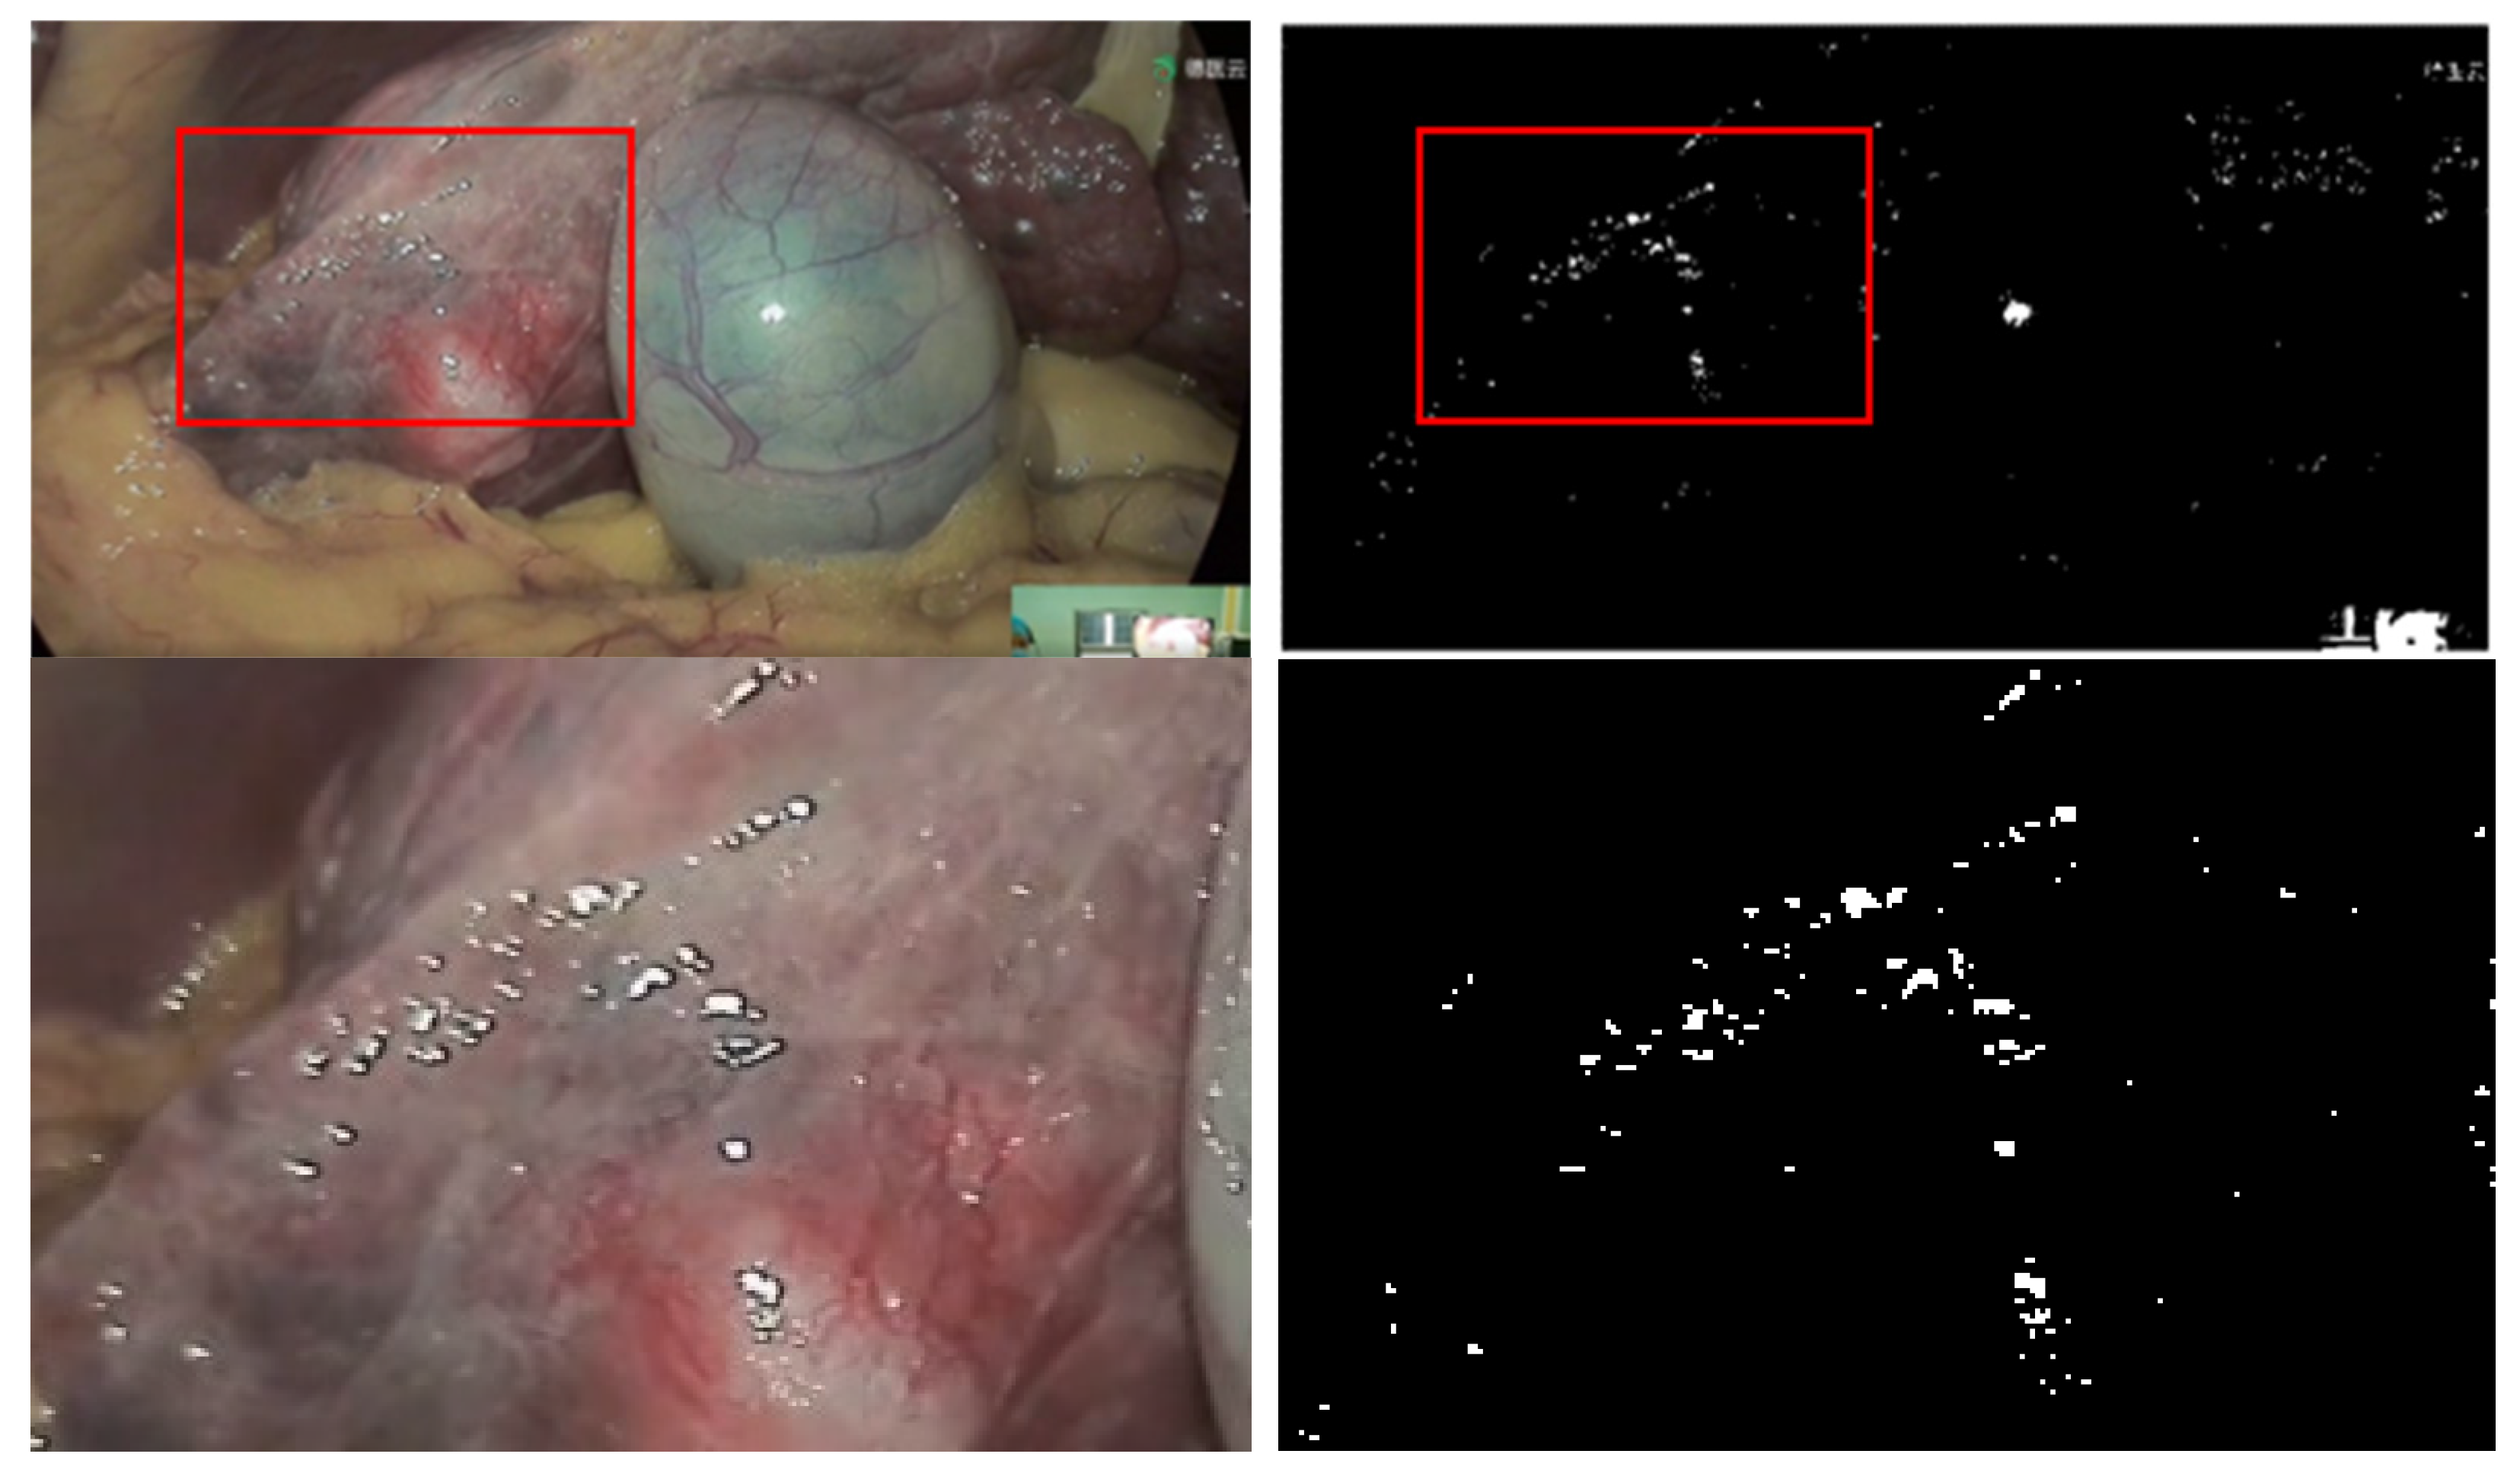
3.4. Highlight Detail Layer Information

To prevent the high bright spot area in the endoscopic image from contrast enhancement in the detail layer, we decided to bring up the high bright spot before the detail layer processing and restore the high bright spot area after the processing is completed. Before making a highlight mask, the original image is pre-processed for enhancement (16). The purpose of enhancement is to make the reflective areas more visible and reduce the associated interference factors. This paper adopts the theory [25] that the reflective pixel’s brightness Y (luminance) is greater than its color brightness y (chromatic luminance). Convert the image from RGB to CIE-XYZ space to get Y , and then find y according to the formula. The area where Y is greater than y is extracted as the highlighted area.
y = Y X + Y + Z
Pre-processing enhancement model.
( R G B ) = min ( R , G , B ) max ( R , G , B ) ( R G B )
As shown in Figure 6, the extracted mask is the high brightness areas of the image. If the high brightness mask does not separate these areas, they will be overly enlarged in the detail layer, thus blurring the edges and thus affecting the visual quality of the image.
For the endoscopic images, separation of the three-channel images shows that the R-channel has minor distinct vascular features and the G and B-channel planes have visible margins and lesion borders. Blue light is most suitable for enhancing superficial mucosal structures and detecting minor mucosal changes. Greenlight is relatively more suitable for enhancing thick blood vessels in the middle layer of the mucosa [26]. Therefore, the blue component and the green component are more advantageous for extracting endoscopic image information. To ensure the consistency of the image structure while highlighting the vascular details, a stretch factor w c   is set based on the connection between the enhanced base layer and the foundation layer. R channel remains unchanged, and the following stretching model enhances G and B channels.
I d e t a i l R ( x , y ) = I d e t a i l R ( x , y )
I d e t a i l c ( x , y ) = I d e t a i l c ( x , y ) + w c I d e t a i l c ( x , y ) Z ( x , y ) c , c { g , b }
w c = 1 ( n o r m ( s t d ( I b a s e c ) ) n o r m ( s t d ( I b a s e c ) ) ) 1 / 2 , c { g , b }
where n o r m is the normalization and s t d is the variance of the image, Z ( x , y ) is a weighted guided filter based on the improved canny operator.
Conventional filtering [27] in processing edge information will perform excessive smoothing operations for endoscopic images, i.e., the image’s texture and vascular detail information is lost. This paper proposes an improved weighted guided filter based on the canny operator. The main operation uses the edge (CWGIF) weight calculated by the canny operator to replace the local variance calculated by the window in the original weighted guided filter (WGIF).
Original edge weighting factor calculation formula:
Γ G ( p ) = 1 N p = 1 N σ G , 1 2 ( p ) + ε σ G , 1 2 ( p ) + ε
where σ G , 1 2 ( p ) is the variance of a 3 × 3 window with p as the center of radius 1, ε is a constant taking the value of ( 0.001 L ) 2 .
Canny operator improves the calculation of edge weight calculation factor:
Γ G ( p ) = 1 N p = 1 N C ( p ) + ε C ( p ) + ε
where C(p) is the value of the canny operator detection of pixel p.
The weighted bootstrap filtering model based on the canny operator is as follows.
Z ( i ) = a k G ( i ) + b k
where a k and b k are the parameters to be solved, and G ( i ) is the bootstrap image (corresponding to the G and B single-channel maps). According to the edge weights (Equation (22)), the cost function is as follows.
E ( a k , b k ) = i ϵ W k { ( a k G i + b k p i ) 2 + λ Γ G ( i ) a k 2 }
The parameters a k and b k can be calculated using the least-squares method on the Formula (24).
a k = 1 | w | i ϵ w k p i G i u k p k ¯ σ k 2 + λ Γ G ( i )
b k = p k ¯ a k u k
where u k and σ k 2 are the mean and variance are corresponding to the single-channel bootstrap image G within window W k . | w | is the total number of pixels within the window W k , p k ¯   is the grayscale mean of the input single-channel image p within the window W k .
As shown in Figure 7, both WGIF and CWFGIF smooth the gradient in the normal area (Standard tissue areas of the human body in the endoscope), but the blue line is closer to the red line in the areas with large gradients (Vascular and arterial texture areas in the endoscope). These indicate that CWGIF has better retention in this region.

4. Experimental Analysis

4.1. Experimental Environment

The experiment’s environment is as follows: the CPU is an 11th Gen Intel (R) Core (TM) i5-11400F @ 2.60 GHz 2.59 GHz, Windows 10 is the operating system, and Matlab R2019b is the test algorithm platform.

4.2. Parameter Setting

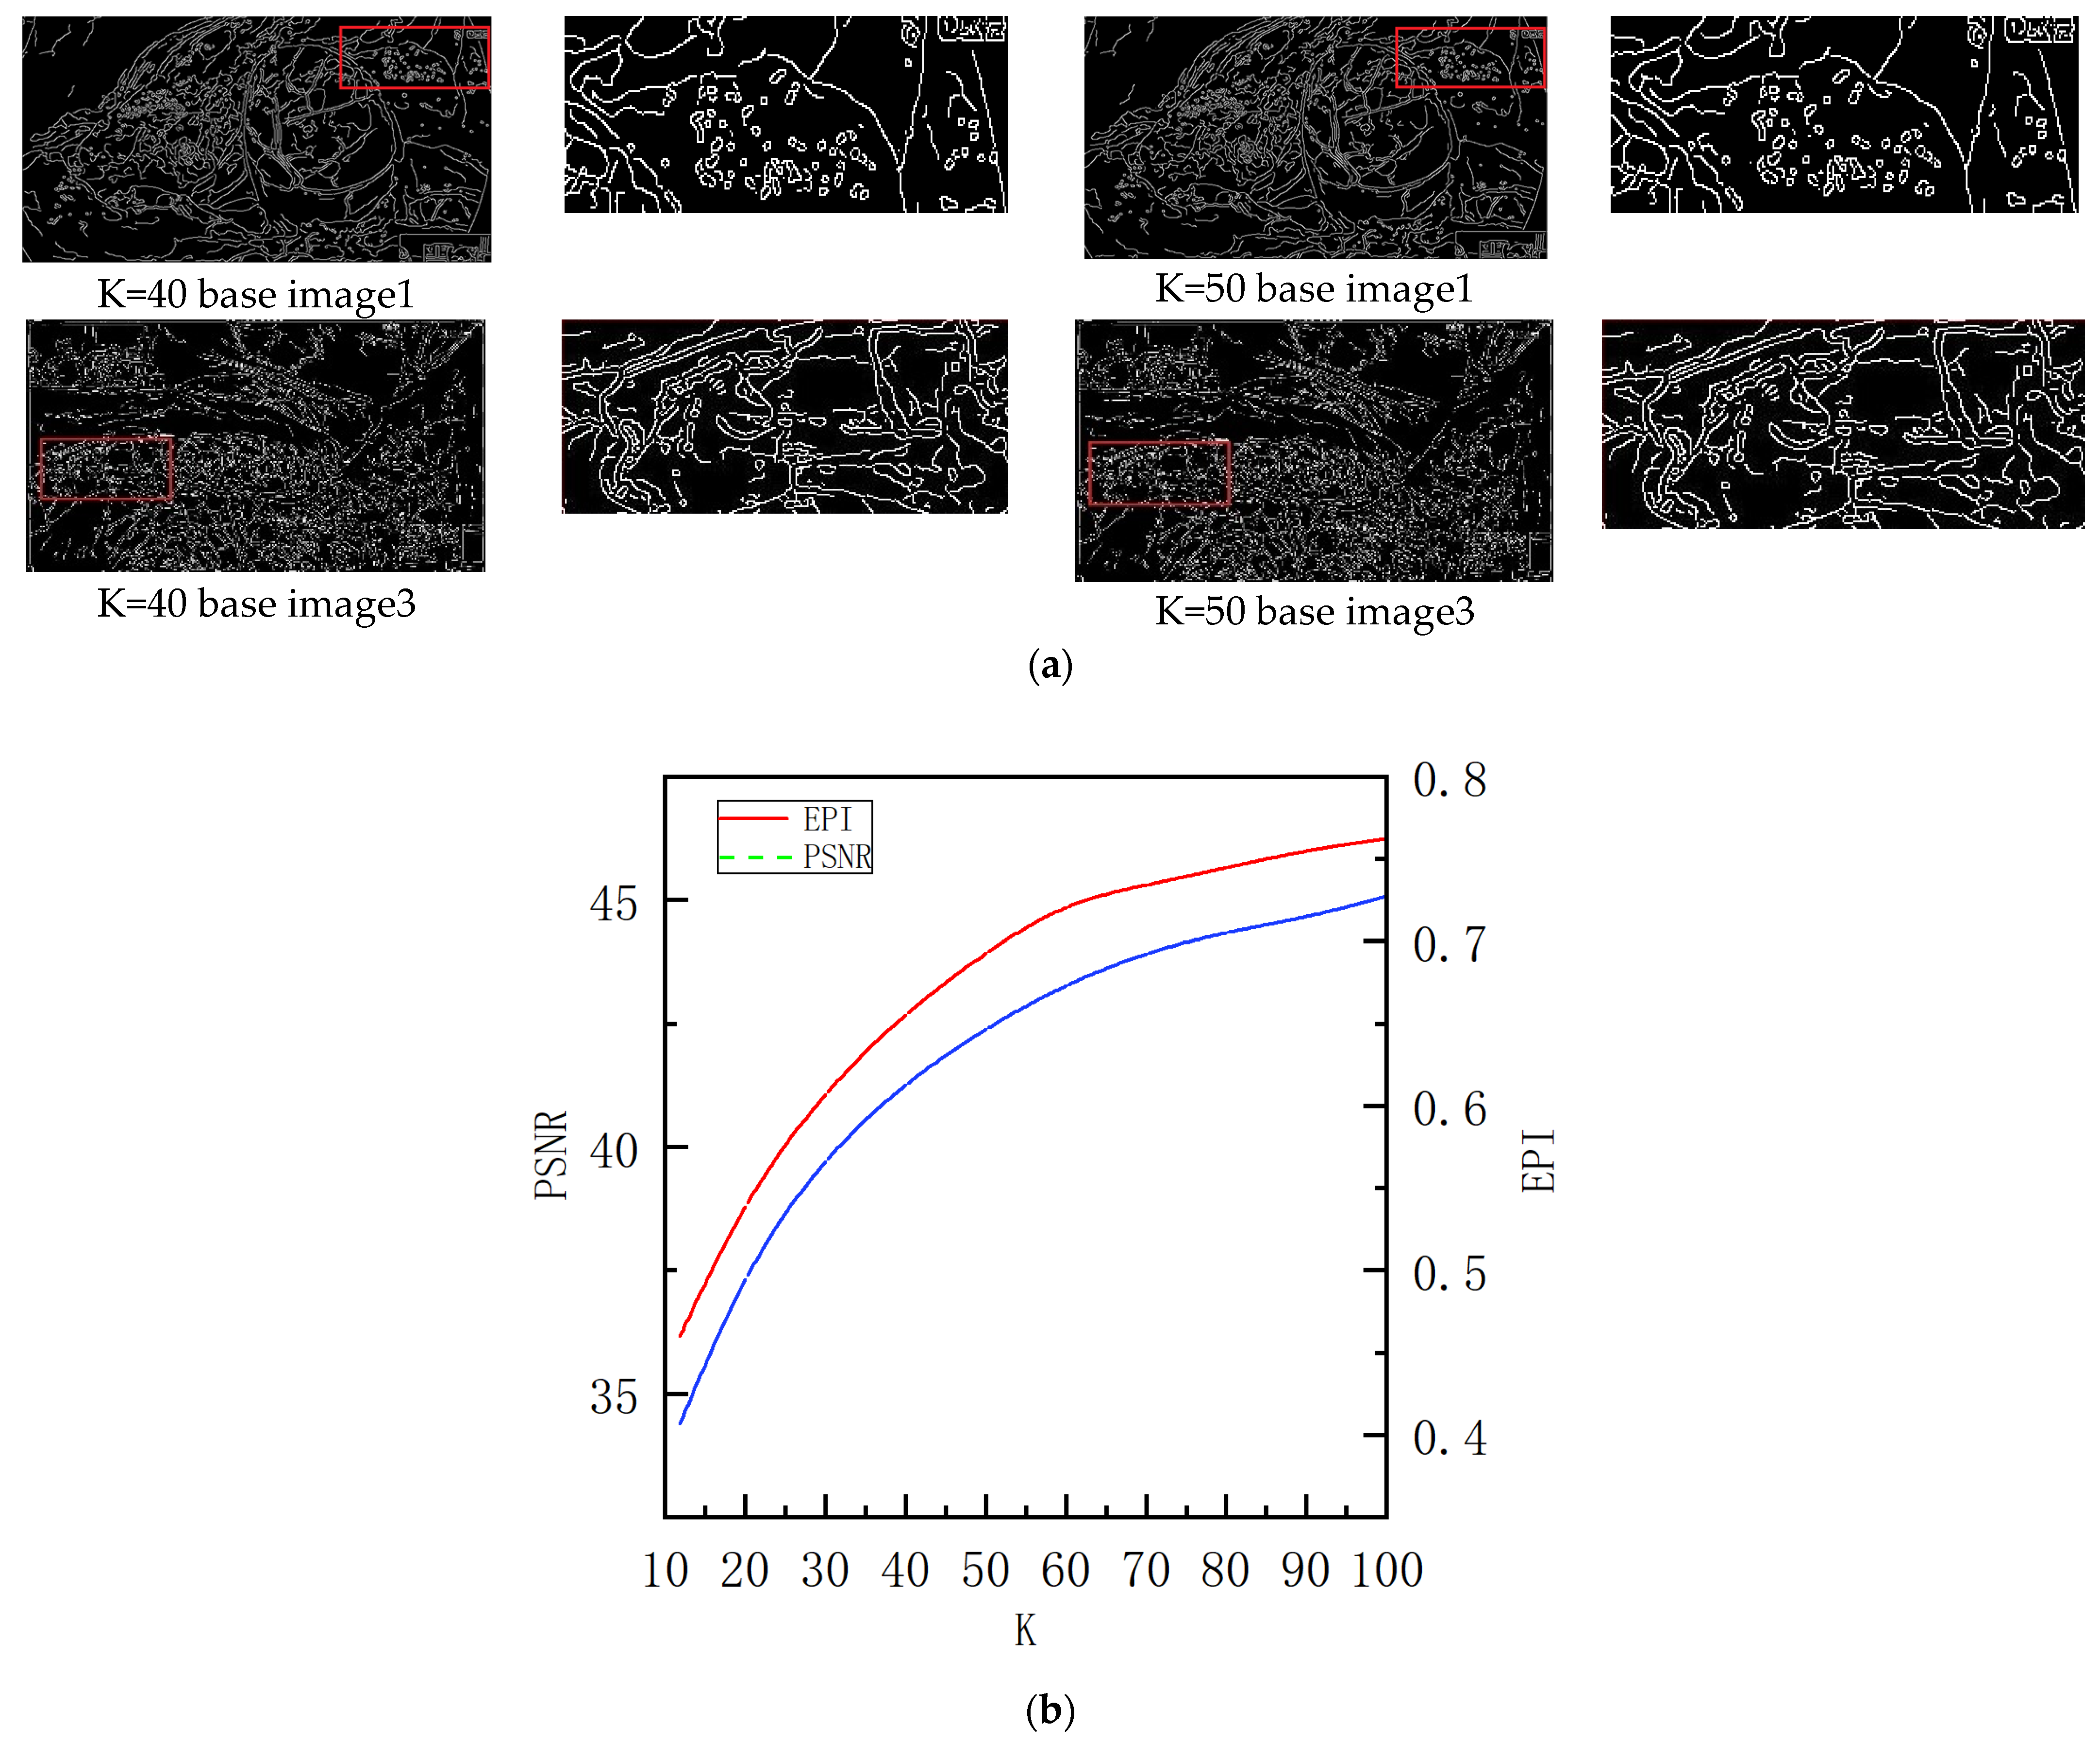
4.2.1. Noise Rejection Factor k

When a global noise estimation technique is applied to endoscopic images, vascular detail information can be wrongly treated as noise. Add a noise rejection factor k to maximize noise separation while protecting vascular detail information. Initially, we set k to ten. Based on the canny operator [28] and a combined examination of edge retention (EPI) [29] and peak signal-to-noise ratio (PSNR) [23]. Figure 8a shows the structure layer canny operator detection plots for image1 and image3 at k at 40 and 50, and Figure 8b represents the PSNR values of the structure layer and the EPI values of the structure layer relative to the original image (in the case of image1). As shown in Figure 8, the EPI and PSNR of the resulting structural layer and the original map gradually increase as k increases. Some noise and light patches are identified as pseudo-edges when k = 50. Multiple images were combined and analyzed, and the k value for the endoscopic images was set at 40.

4.2.2. Setting of Parameter φ in Brightness Correction

As shown in Figure 9, as the value of φ gradually increases, the image’s average brightness grows larger and larger, and the image’s histogram concentration value grows closer and closer to the high pixel value region. Setting the brightness enhancement to 0.6 makes it easier for human eyes to notice and judge.

4.3. Subjective and Objective Analysis

On a laboratory-built dataset (LEI D), we compare our algorithm to many existing image enhancement algorithms in this section. Algorithms for comparison include AGCWD, MSRCR, Al-Ameen et al., Palanisamy et al., Ying et al., and Wang et al. The increased effect images were evaluated objectively using five evaluation metrics: PCQI(patch-based contrast quality index) [30], SSIM(structural similarity index) [24], PSNR(Peak Signal-to-Noise Ratio) [23], C_II(contrast improvement index) [31], and Tenengrad gradient [32].

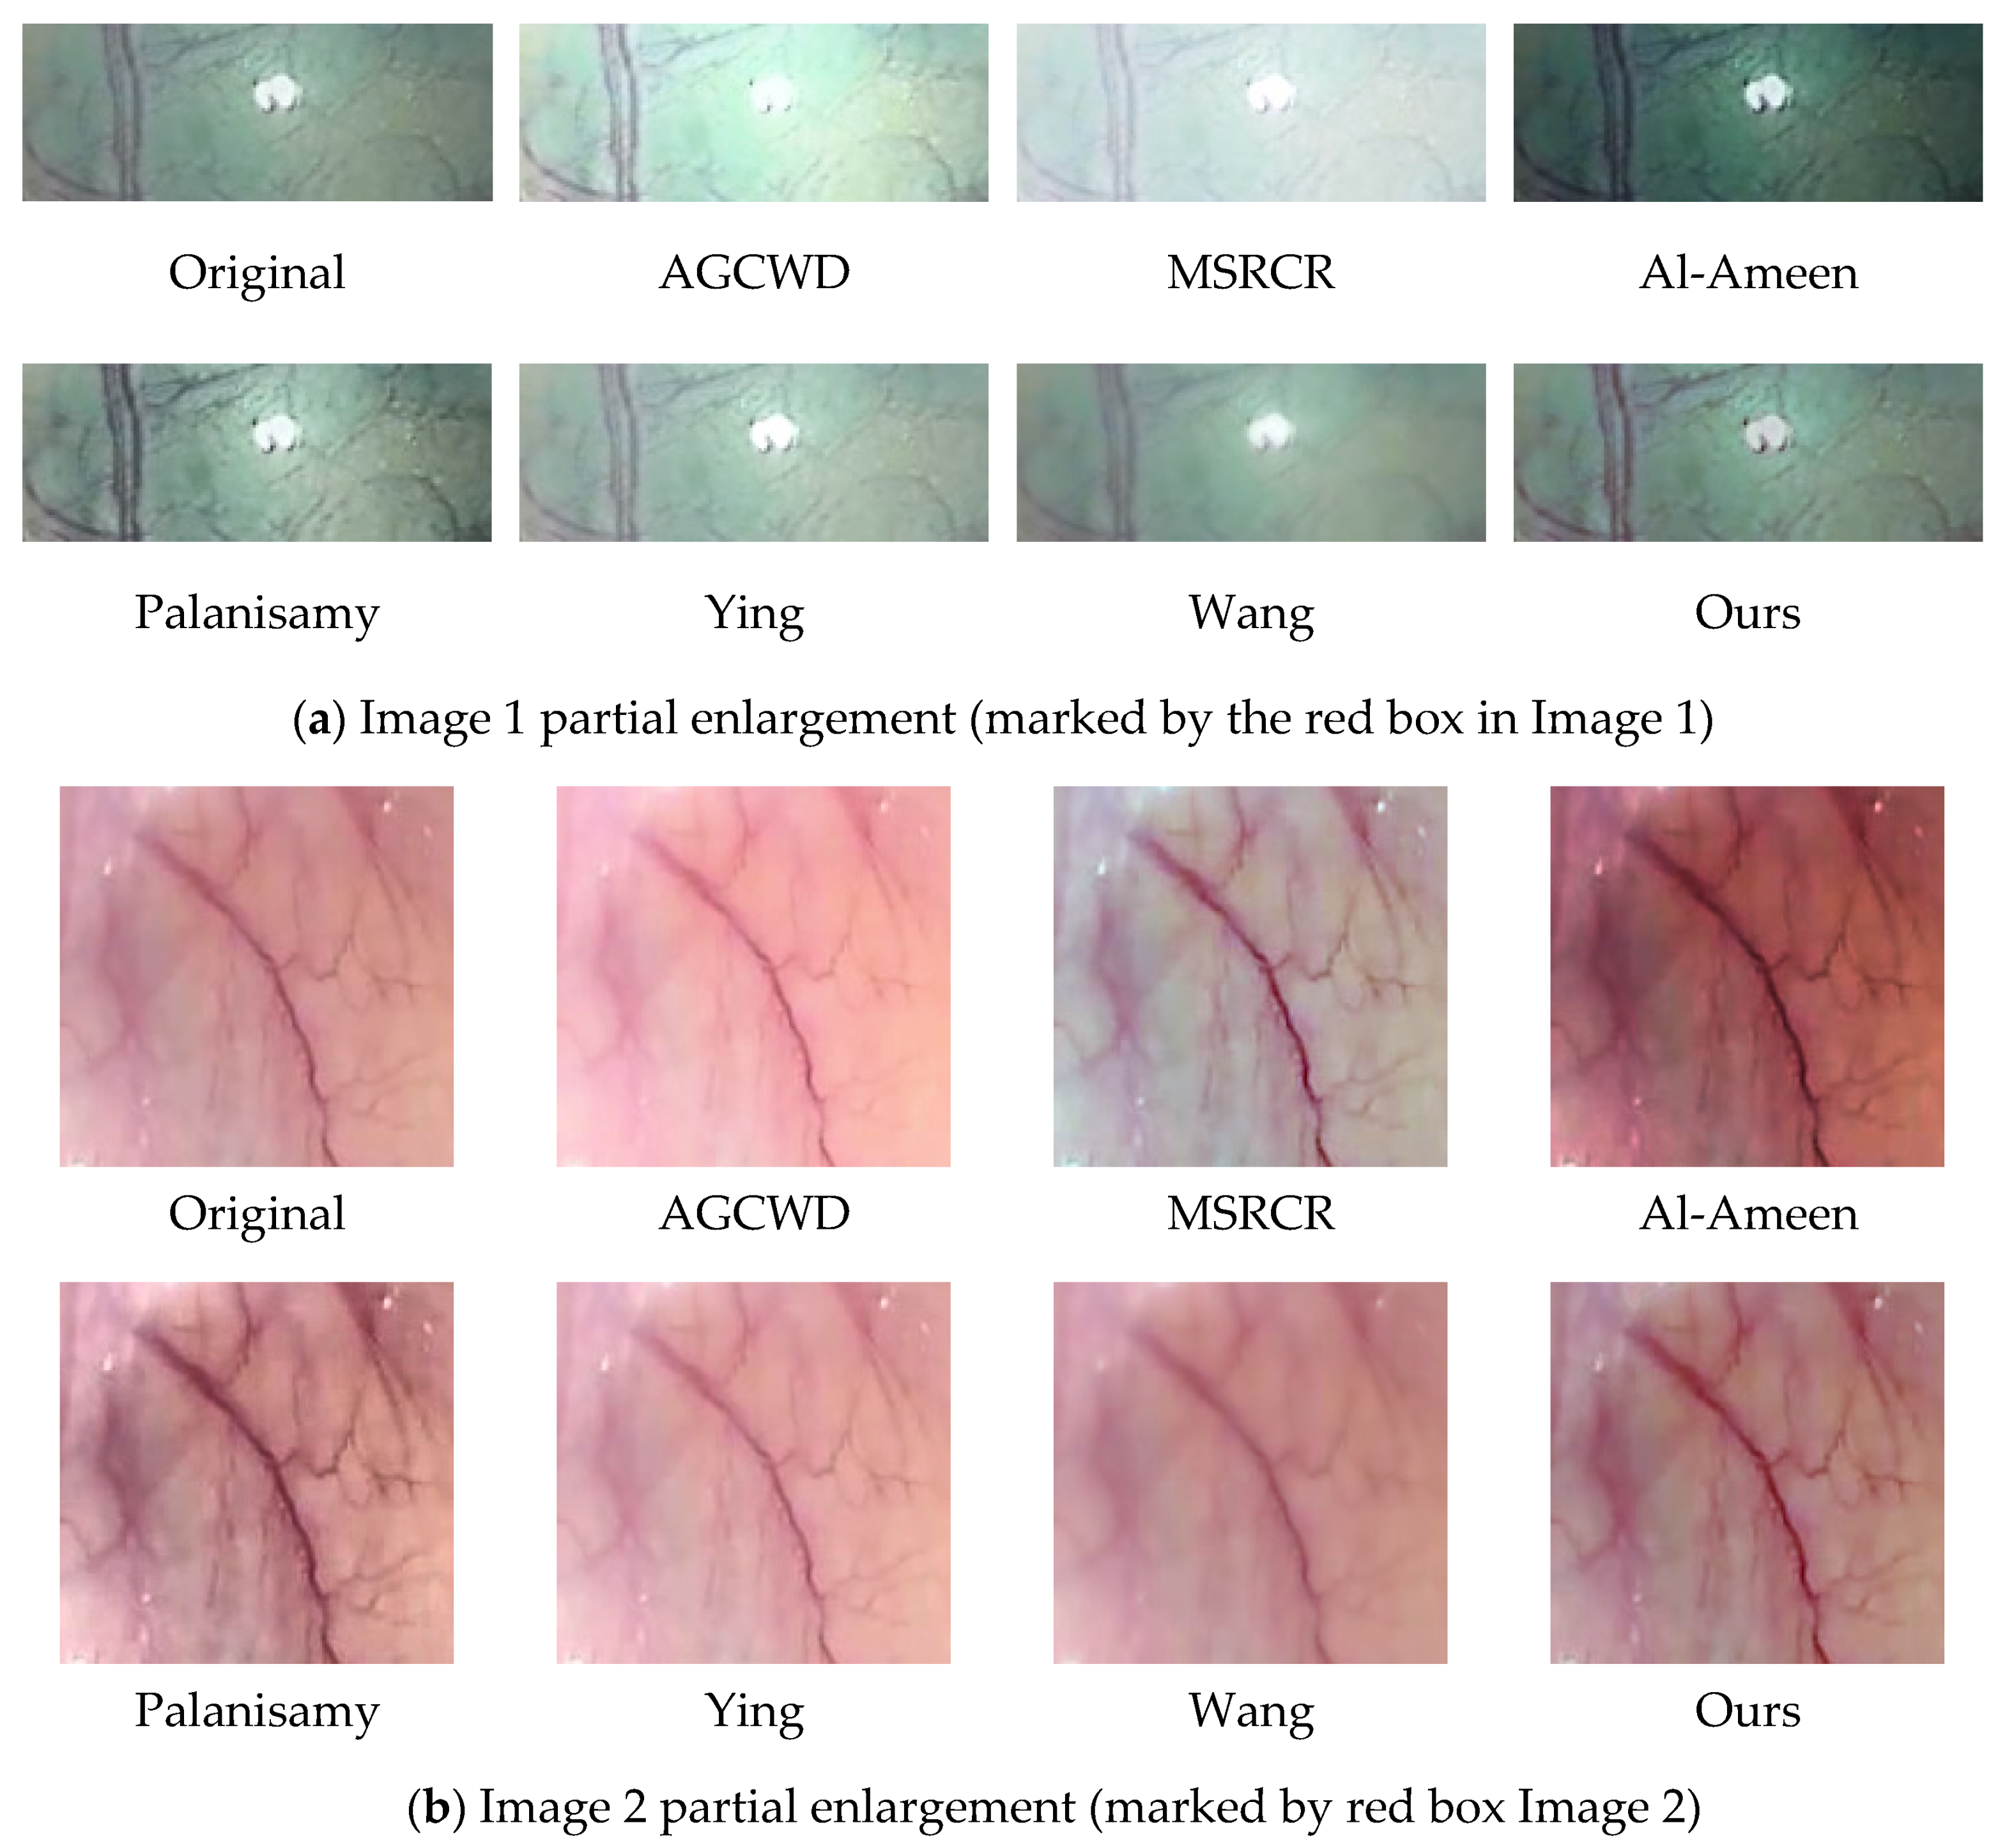
4.3.1. Subjective Analysis

Endoscopic images are mainly used by physicians to analyze and judge the images of blood vessels and organ tissues collected from patients to identify abnormal areas. As a result, the enhanced image should keep the image’s brightness, color, and naturalness while emphasizing the details of lesions and blood vessels to meet the typical observation range of the human eye. Consider the following photographs of different human tissues as examples.
AGCWD over-enhanced localized areas when enhancing endoscopic images. The high bright spot area in Figure 10a is over-enhanced, and the vascular features around the bright spot are nearly unnoticeable. These phenomena are better illustrated in Figure 11a.
MSRCR captures information at several scales before completing color recovery, which frequently results in color distortion in the recovered endoscopic images, as shown in Figure 10a,c. It is possible that the extraction scale is not exact enough, or that the color recovery technique produces bias, and that when used to endoscopic pictures, the algorithm produces judgment errors.
Al-Ameen et al.’s algorithm would have greatly increased contrast in some regions, but the image as a whole is excessively dark, impairing human eye visual observation.
Palanisamy et al.’s algorithm delivers good contrast results, which are considerably more reasonable than the prior algorithms, and accomplishes the basic goal of endoscopic image enhancement. On the negative side, magnifying Figure 10c reveals a tendency for the blood vessels in the endoscopic image to darken, affecting the physician’s assessment of the lesion.
Ying et al.’s algorithm provides a significant increase in brightness, and the enhanced image is clearly visible; however, there appears to be a decrease in contrast as the brightness is increased, and part of the subject architecture is blurred, resulting in the loss of some information in the enhanced endoscopic image. This defect is highlighted more clearly in Figure 11b.
Wang et al.’s algorithm improves brightness and contrast more effectively; nevertheless, the brightness of the light and dark areas is overly boosted in some photos, obscuring the information in the dark areas. As seen in the lower-left corner of Figure 10e.
We zoomed in on a localized section of the individual technique effect figure in the preceding figure to observe. The high brightness area of the map obtained by AGCWD is unduly magnified, as seen in the zoomed-in view of the local area in image 1, which hampers normal observation. The contrast intensity of the plot obtained by Palanisamy et al. was excessively high, making the trend of the blood vessel color change from red to black more evident. Wang et al.’s algorithm is brightened, but the accompanying detail information is not well synchronized, and some tiny blood vessel details are blurred.
Our algorithm improves the brightness, contrast, and naturalness of blood vessels in general. The image’s contrast is improved in the normal brightness area, while the intricacies of blood vessels in the dark area are highlighted, avoiding the artifacts, over-enhancing, and color distortion that can occur with traditional image enhancement.

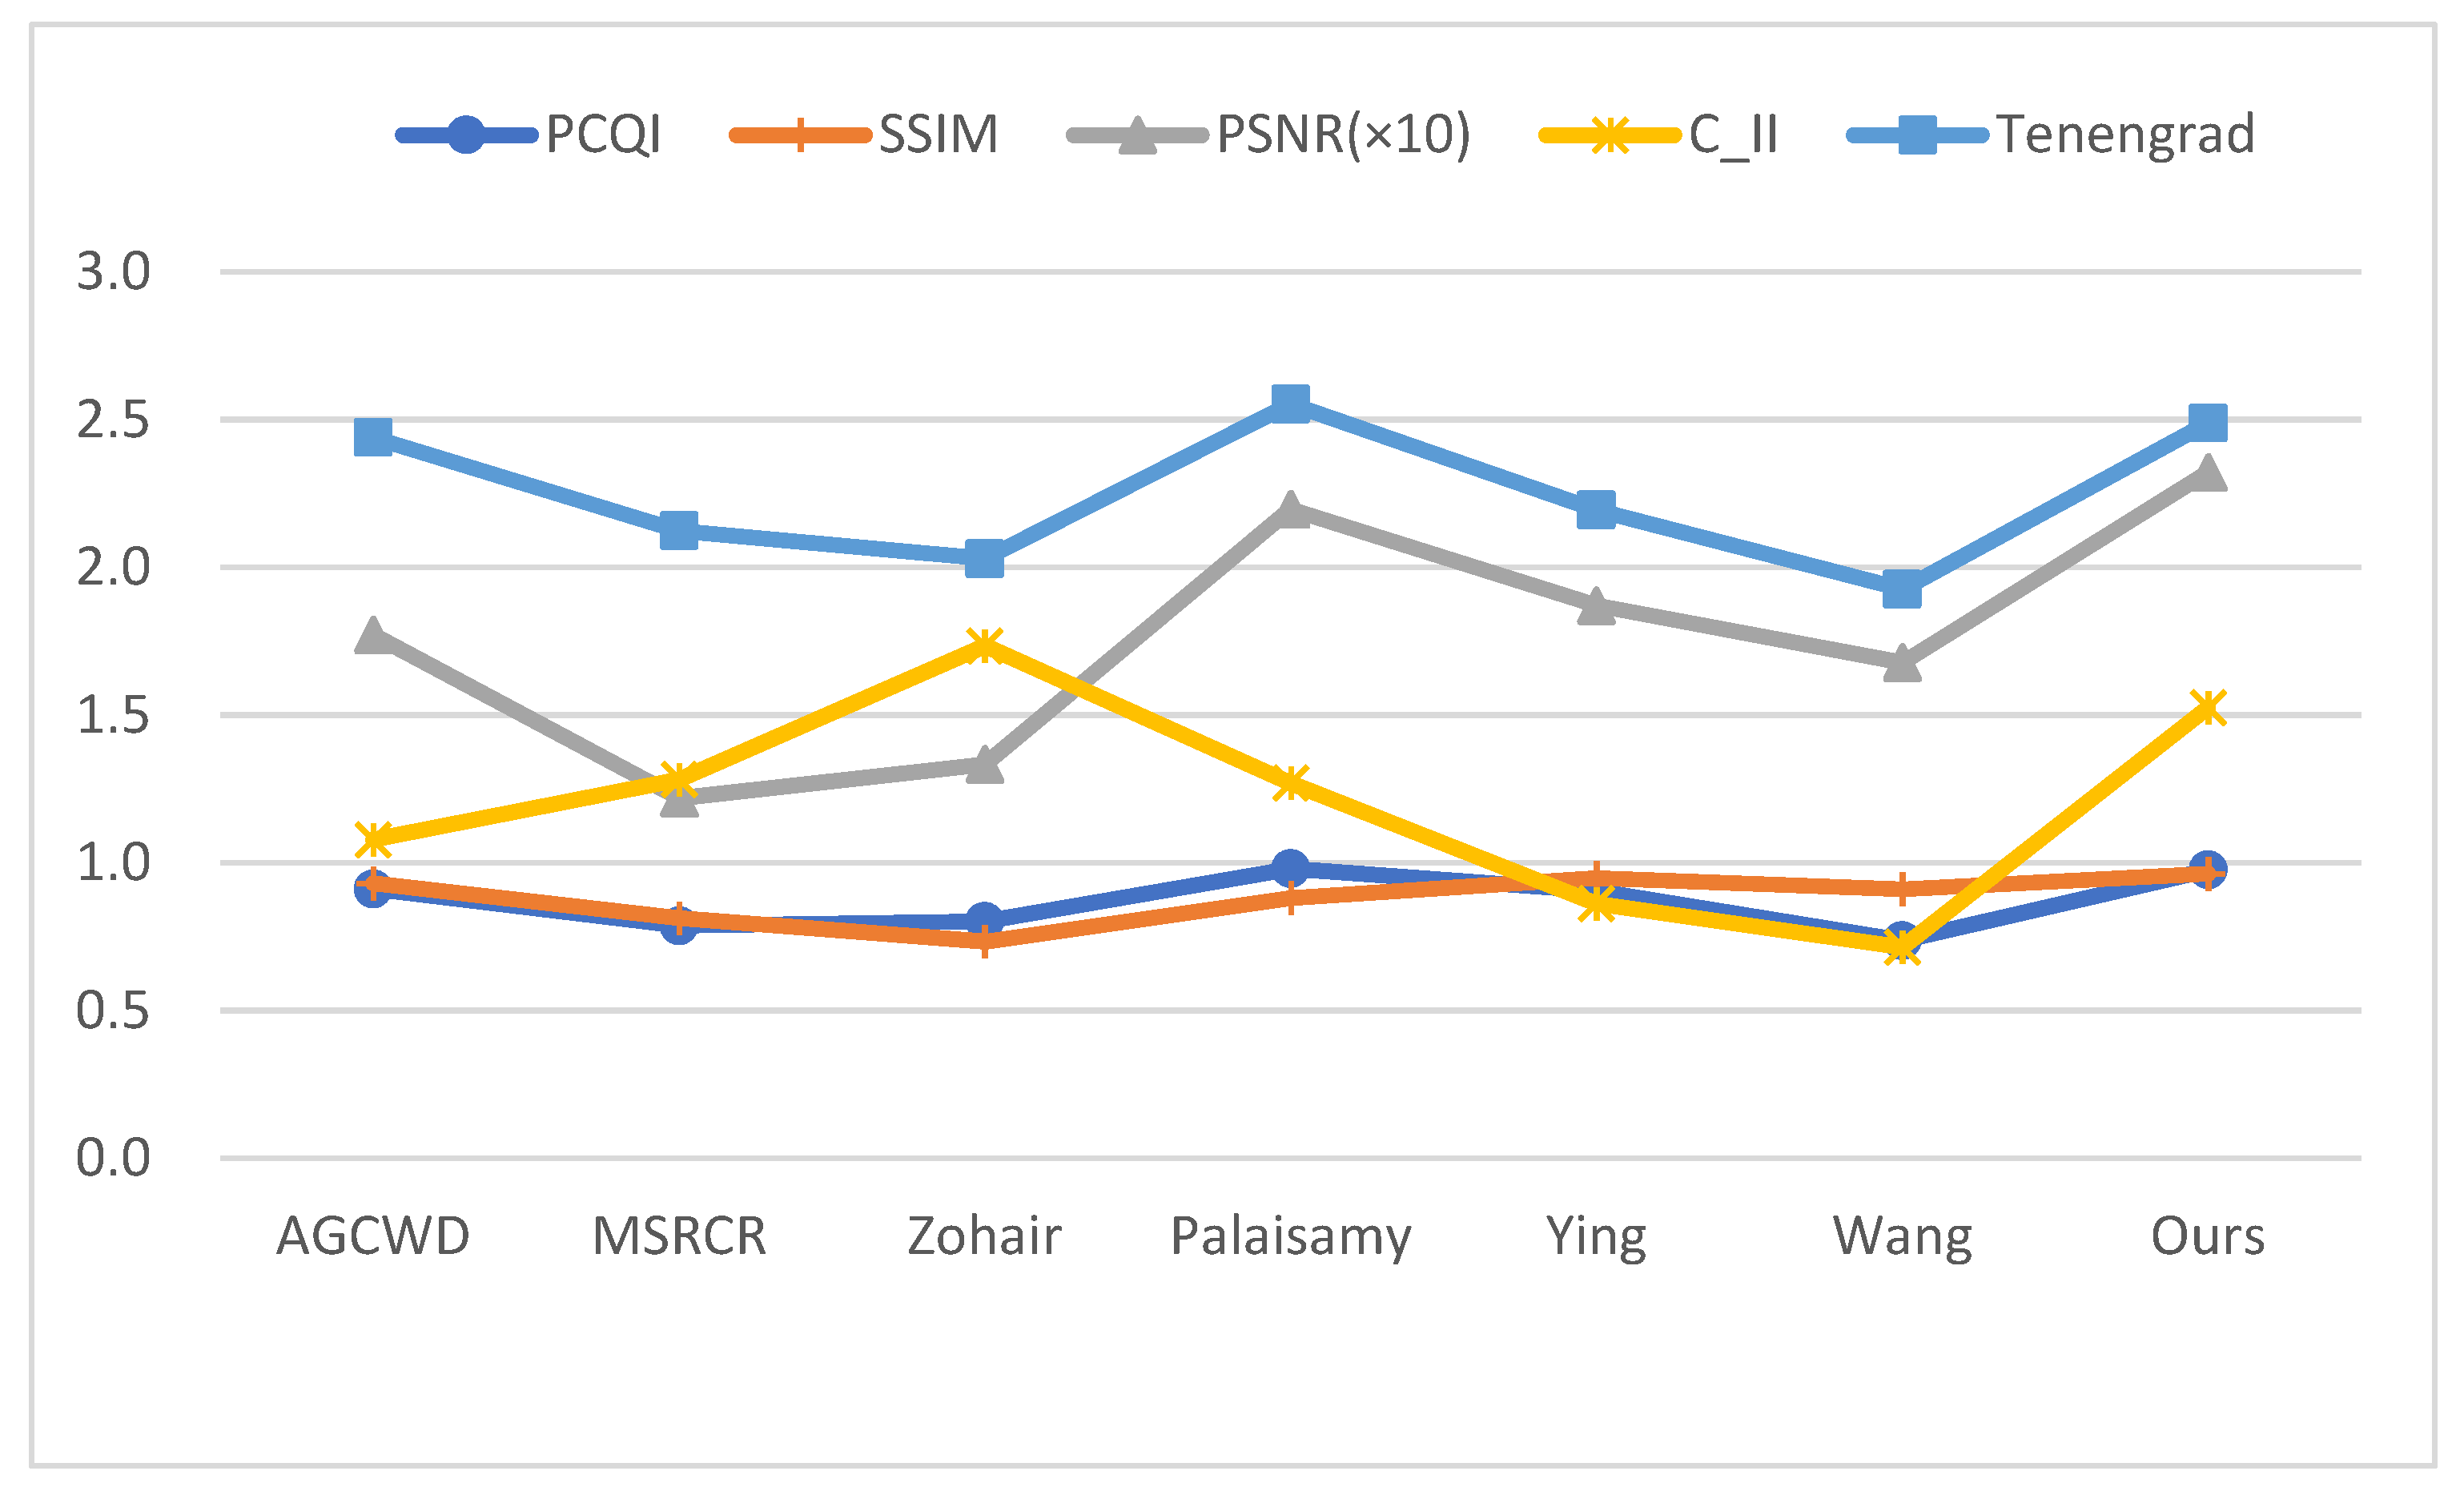
4.3.2. Objective Analysis

This research uses five indexes to conduct an objective examination of the good and bad images.
PCQI index [30] (patch-based contrast quality index) was developed as an adaptable representation based on local block structure to forecast contrast variation. Each block calculates the average intensity, signal strength, and signal structure. Images with higher PCQI values have better contrast.
SSIM index [24] (structural similarity index) compares three sample and outcome variables (luminance, contrast, and structure) to determine how similar the improved image and the original image are.
S S I M ( x , y ) = [ l ( x , y ) ] α × [ c ( x , y ) ] β × [ s ( x , y ) ] γ
where l ( x , y ) , c ( x , y ) , and s ( x , y ) represent the image’s brightness, contrast, and structure, respectively.
The peak signal-to-noise ratio (PSNR [23]) indicator is used to assess noise performance. When reconstructing enhanced images, a greater PSNR suggests that the rebuilt enhanced images are of higher quality.
M S E = 1 m n i = 0 m 1 j = 0 n 1 [ I ( i , j ) K ( i , j ) ] 2
P S N R = 10 · l o g 10 ( M A X I 2 M S E )
where I and K represent the improved and original pictures, M A X I represents the image’s maximum pixel value, and M S E represents the image’s mean square error.
C I I [31] is a contrast evaluation index for medical pictures that is calculated by dividing the average value of local contrast of images before and after processing by the ratio, with a larger ratio value indicating more contrast.
C I I = C p r o c e s s e d C o r i g i n a l
C l o c a l = m a x m i n m a x + m i n
where m a x and m i n are the maximum and minimum pixel intensity values in a window. C o r i g i n a l and C p r o c e s s e d are the average of the local contrast of the image before and after processing, respectively. The window size of the conventional image is set to 3 × 3 pixels. Here, considering the larger proportion of details such as blood vessels in endoscopic images, and referring to the window size set by other medical image calculations, the window size was set to 50 × 50 pixels for a more accurate evaluation of the endoscopic pictures [33].
The Tenengrad [26] gradient is utilized as an image sharpness evaluation index, and the Sobel operator is used to extract the gradient values of the picture’s horizontal and vertical directions, respectively. The image becomes sharper and more suited for human eye observation as the Tenengrad gradient value increases.
As shown in Table 1, we present both the metric results for the three sets of a, b, and c images in Figure 10 and the mean values of the 50 image metrics in the dataset. In the table, Im1, Im2, and Im3 correspond to the three groups of a, b, and c images in Figure 10, and “Ave” represents the average of the 50 image metrics.
In terms of contrast. The algorithm in this paper is ahead of the mean value of the algorithm proposed by Palanisamy by 0.01 (0.98 and 0.99) in PCQI. It is second only to the algorithm proposed by Al-Ameen in terms of C_II index. Taken combined, the algorithm in this paper improves contrast significantly.
The SSIM value of this algorithm is the best in terms of similarity, ahead of the other six evaluated algorithms, demonstrating that the image enhancement of this algorithm does not lose the picture’s significant topic information, which is critical for medical image processing.
In terms of picture quality, this algorithm’s PSNR values are higher than those of other algorithms, implying that the reconstructed images are of higher quality. In terms of Tenengrad gradient index, the approach given in this study is pretty near to both the algorithm proposed by Palanisamy et al. and the algorithm value of adaptive gamma correction, showing that the clarity aspect is also ensured.
When image contrast, image quality, and information preservation are all considered, as can be seen from Figure 12, our algorithm is excellent for processing endoscopic images.

5. Discussion

This work demonstrates a study on enhancing the visibility of endoscopic images to achieve accuracy in machine-assisted physician diagnosis [34]. During endoscopic imaging, organ substructures or surroundings are hidden in the obtained endoscopic images due to the complexity of the internal structures of the human body and the limitations of hardware devices for imaging. Based on the imaging characteristics of endoscopy, this work introduces the image decomposition architecture to address these defects.

5.1. Effectiveness

The architecture of image decomposition can obtain multiple image layers with different features. Further processing corresponding to each image layer can effectively highlight the contrast of blood vessels and tissues in the endoscope while maintaining the architecture of the image subject. From the experimental analysis comparing the enhancement effect plots of various algorithms, we can see that most of the enhancement algorithms cannot be well applied to endoscopic images. The reason is that they do not consider the imaging characteristics of endoscopic images and the importance of the detailed information of tiny blood vessels, and all perform image enhancement from the image as a whole. They [4,5,6,7,8,9,10,11,12,13,14] changed the three-channel pixel values, resulting in the blurring or loss of the underlying detail information of endoscopic images. The image decomposition model uses various forms of filtering to decompose the figure into structural, noise, and detail layers for separate processing, which effectively solves the problems of biased noise estimation, uneven brightness, and inconspicuous detail information in endoscopic images. The algorithm in this paper is not affected by external factors during the experiment. It can be applied to images of any tissue inside a human or animal, and of course, the framework idea of the algorithm can be used in any image enhancement.

5.2. Limitations

Although the algorithm outperforms other existing algorithms in solving existing problems for endoscopic images, it still has some potential limitations or open issues. First, the algorithm analysis is performed on an existing set of images. However, the images that physicians are exposed to in some extreme cases may be more complex, and individual extremely specific images could be collected for experiments in subsequent studies to ensure that the generalizability of the algorithm is maximized. Secondly, compared with other algorithms, it may be designed to set some parameters in different algorithms or set parameters in the evaluation index. We need to study these parameters further to obtain more accurate results. Finally, the algorithm can currently run well on the Matlab R2019b. In the next step, we consider multi-threaded programming and hardware device enhancement to achieve synchronization and setting in the physician’s surgical system to highlight the significance of practicality further.

6. Conclusions

This paper provides an image decomposition-based endoscopic image enhancement algorithm that effectively avoids the interference of high bright spots and noise in endoscopic pictures. Adaptive enhancements were applied to the brightness of the base layer pictures, as well as stretching of the detail layer vascular lesions and other information in sub-channels suited for endoscopic image characteristics. Traditional image enhancement difficulties such as color distortion, hazy disappearance of vascular features, and excessive local brightness augmentation are efficiently solved by this algorithm. The algorithm produces good visual results and assessment indications through subjective and objective examination. It was demonstrated that this algorithm outperforms numerous other conventional algorithms for processing endoscopic images. Due to the limitations of traditional algorithms in image processing, in future work, we will consider applying the image decomposition ideas used in this algorithm to neural networks to design a suitable image quality loss to optimize the network model.

Author Contributions

Conceptualization, W.T.; methodology, W.T.; software, C.X.; validation, Z.A., D.W. and Q.F.; data curation, K.Q. and J.H.; writing—original draft preparation, W.T. and F.L.; writing—review and editing, W.T. and B.F.; visualization, W.T.; supervision, C.X.; project administration, C.X.; funding acquisition, C.X. All authors have read and agreed to the published version of the manuscript.

Funding

This research was funded by the National Key Research and Development Program of China (No. 2019YFC0117800).

Conflicts of Interest

The authors declare no conflict of interest.

References

  1. Nguyen, K.T.; Hoang, M.C.; Choi, E.; Kang, B.; Park, J.-O.; Kim, C.-S. Medical microrobot—A drug delivery capsule endoscope with active locomotion and drug release mechanism: Proof of concept. Int. J. Control Autom. Syst. 2020, 18, 65–75. [Google Scholar] [CrossRef]
  2. Lee, S.; Lee, H.; Choi, H.; Jeon, S.; Hong, J.J. Effective calibration of an endoscope to an optical tracking system for medical augmented reality. Cogent Eng. 2017, 4, 1359955. [Google Scholar] [CrossRef]
  3. Monkam, P.; Wu, J.; Lu, W.; Shan, W.; Chen, H.; Zhai, Y.J. EasySpec: Automatic Specular Reflection Detection and Suppression from Endoscopic Images. IEEE Trans. Comput. Imaging 2021, 7, 1031–1043. [Google Scholar] [CrossRef]
  4. Wang, L.; Wu, B.; Wang, X.; Zhu, Q.; Xu, K.J.T. Endoscopic image luminance enhancement based on the inverse square law for illuminance and retinex. Int. J. Med. Robot. Comput. Assist. Surg. 2022, e2396. [Google Scholar] [CrossRef] [PubMed]
  5. Sato, T.J. TXI: Texture and color enhancement imaging for endoscopic image enhancement. J. Healthc. Eng. 2021, 2021, 5518948. [Google Scholar] [CrossRef]
  6. Yao, M.; Zhu, C. Study and comparison on histogram-based local image enhancement methods. In Proceedings of the 2017 2nd International Conference on Image, Vision and Computing (ICIVC), Chengdu, China, 2–4 June 2017; pp. 309–314. [Google Scholar]
  7. Meylan, L.; Susstrunk, S.J. High dynamic range image rendering with a retinex-based adaptive filter. IEEE Trans. Image Processing 2006, 15, 2820–2830. [Google Scholar] [CrossRef] [Green Version]
  8. Huang, S.-C.; Cheng, F.-C.; Chiu, Y.-S.J. Efficient contrast enhancement using adaptive gamma correction with weighting distribution. IEEE Trans. Image Processing 2012, 22, 1032–1041. [Google Scholar] [CrossRef]
  9. Jobson, D.J.; Rahman, Z.-U.; Woodell, G.A.J. A multiscale retinex for bridging the gap between color images and the human observation of scenes. IEEE Trans. Image Processing 1997, 6, 965–976. [Google Scholar] [CrossRef] [Green Version]
  10. Xu, F.; Liu, J.; Song, Y.; Sun, H.; Wang, X.J. Multi-Exposure Image Fusion Techniques: A Comprehensive Review. Remote Sens. 2022, 14, 771. [Google Scholar] [CrossRef]
  11. Hayat, N.; Imran, M.J. Multi-exposure image fusion technique using multi-resolution blending. IET Image Process. 2019, 13, 2554–2561. [Google Scholar] [CrossRef]
  12. Ying, Z.; Li, G.; Ren, Y.; Wang, R.; Wang, W. A new image contrast enhancement algorithm using exposure fusion framework. In Proceedings of the International Conference on Computer Analysis of Images and Patterns, Ystad, Sweden, 22–24 August 2017; pp. 36–46. [Google Scholar]
  13. Kaur, M.; Kaur, J.; Kaur, J.J. Applications. Survey of contrast enhancement techniques based on histogram equalization. Int. J. Adv. Comput. Sci. Appl. 2011, 2, 137–141. [Google Scholar]
  14. Zuiderveld, K. Contrast limited adaptive histogram equalization. In Graphics Gems IV; Academic Press: Cambridge, MA, USA, 1994; pp. 474–485. [Google Scholar]
  15. Chang, Y.T.; Wang, J.T.; Yang, W.H.; Chen, X.W. Contrast enhancement in palm bone image using quad-histogram equalization. In Proceedings of the 2014 International Symposium on Computer, Consumer and Control, Taichung, Taiwan, 10–12 June 2014; pp. 1091–1094. [Google Scholar]
  16. Al-Ameen, Z.; Sulong, G.J. A new algorithm for improving the low contrast of computed tomography images using tuned brightness controlled single-scale Retinex. Scanning 2015, 37, 116–125. [Google Scholar] [CrossRef] [PubMed]
  17. Palanisamy, G.; Ponnusamy, P.; Gopi, V.P. An improved luminosity and contrast enhancement framework for feature preservation in color fundus images. Signal Image Video Process. 2019, 13, 719–726. [Google Scholar] [CrossRef]
  18. Obukhova, N.; Motyko, A.; Pozdeev, A.; Timofeev, B. Review of Noise Reduction Methods and Estimation of their Effectiveness for Medical Endoscopic Images Processing. In Proceedings of the 2018 22nd Conference of Open Innovations Association (FRUCT), Jyväskylä, Finland, 15–18 May 2018; pp. 204–210. [Google Scholar]
  19. Tai, S.-C.; Yang, S.-M. A fast method for image noise estimation using laplacian operator and adaptive edge detection. In Proceedings of the 2008 3rd International Symposium on Communications, Control and Signal Processing, St Julian’s, Malta, 12–14 March 2008; pp. 1077–1081. [Google Scholar]
  20. Immerkaer, J. Fast noise variance estimation. Comput. Vis. Image Underst. 1996, 64, 300–302. [Google Scholar] [CrossRef]
  21. Aujol, J.-F.; Gilboa, G.; Chan, T.; Osher, S.J. Structure-texture image decomposition—Modeling, algorithms, and parameter selection. Int. J. Comput. Vis. 2006, 67, 111–136. [Google Scholar] [CrossRef]
  22. Farbman, Z.; Fattal, R.; Lischinski, D.; Szeliski, R.J.A. Edge-preserving decompositions for multi-scale tone and detail manipulation. ACM Trans. Graph. 2008, 27, 1–10. [Google Scholar] [CrossRef]
  23. Rezazadeh, S.; Coulombe, S. A novel discrete wavelet transform framework for full reference image quality assessment. Signal Image Video Process. 2013, 7, 559–573. [Google Scholar] [CrossRef]
  24. Wang, Z.; Bovik, A.C.; Sheikh, H.R.; Simoncelli, E.P.J.I. Image quality assessment: From error visibility to structural similarity. IEEE Trans. Image Process. 2004, 13, 600–612. [Google Scholar] [CrossRef] [Green Version]
  25. El Meslouhi, O.; Kardouchi, M.; Allali, H.; Gadi, T.; Benkaddour, Y.A.J. Automatic detection and inpainting of specular reflections for colposcopic images. Cent. Eur. J. Comput. Sci. 2011, 1, 341–354. [Google Scholar] [CrossRef]
  26. Hongpeng, J.; Kejian, Z.; Bo, Y.; Liqiang, W.J. A vascular enhancement algorithm for endoscope image. Opto-Electron. Eng. 2019, 46, 180167-1–180167-9. [Google Scholar]
  27. Duch, W. Filter methods. In Feature Extraction; Springer: Berlin/Heidelberg, Germany, 2006; pp. 89–117. [Google Scholar]
  28. Canny, J. A computational approach to edge detection. IEEE Trans. Pattern Anal. Mach. Intell. 1986, 6, 679–698. [Google Scholar] [CrossRef]
  29. Joseph, J.; Jayaraman, S.; Periyasamy, R.; V. Renuka, S. An edge preservation index for evaluating nonlinear spatial restoration in MR images. Curr. Med. Imaging 2017, 13, 58–65. [Google Scholar] [CrossRef]
  30. Wang, S.; Ma, K.; Yeganeh, H.; Wang, Z.; Lin, W.J. A patch-structure representation method for quality assessment of contrast changed images. IEEE Signal Process. Lett. 2015, 22, 2387–2390. [Google Scholar] [CrossRef]
  31. Shin, J.; Park, R.-H.J. Histogram-based locality-preserving contrast enhancement. IEEE Signal Process. Lett. 2015, 22, 1293–1296. [Google Scholar] [CrossRef]
  32. Huang, W.; Jing, Z.J. Evaluation of focus measures in multi-focus image fusion. Pattern Recognit. Lett. 2007, 28, 493–500. [Google Scholar] [CrossRef]
  33. Xiong, L.; Li, H.; Xu, L.J. An enhancement method for color retinal images based on image formation model. Comput. Methods Programs Biomed. 2017, 143, 137–150. [Google Scholar] [CrossRef]
  34. Tang, C.-P.; Hsieh, C.-H.; Lin, T.-L.J. Computer-Aided Image Enhanced Endoscopy Automated System to Boost Polyp and Adenoma Detection Accuracy. Diagnostics 2022, 12, 968. [Google Scholar] [CrossRef]
Figure 1. Dataset overview diagram (a) Correlation diagram of human tissue (b) Correlation diagram of animal tissue.
Electronics 11 01909 g001
Figure 2. Framework Flowchart, k_TV stands for total variation method based on noise suppression factor, WLS stands for weighted least squares method, and canny_guided filter is the abbreviation for weighted guided filtering based on the improvement of the canny operator.
Electronics 11 01909 g002
Figure 3. Brightness Correction Flowchart.
Electronics 11 01909 g003
Figure 4. The function curves for γ values of 2.2, 2.5, and 2.8. The curve above y = x is V1 transformed with γ, and the curve below y = x is V2 transformed with γ. The red curve represents a γ value of 2.2, the green curve represents a γ value of 2.5, and the blue curve represents a γ value of 2.8.
Electronics 11 01909 g004
Figure 5. α1 and α2 function plots, weighting plots, and stretching effect plots. φ was set to 0.6 in the endoscopic images (see experimental analysis).
Electronics 11 01909 g005
Figure 6. Highlight mask and corresponding original images.
Electronics 11 01909 g006
Figure 7. (a) input and WGIF and CWGIF image, (b) The image is obtained by outputting any row in a two-dimensional coordinate system. Where red is the input image, green is the resulting map of the WGIF method, and blue is the resulting map of the CWGIF method.
Electronics 11 01909 g007
Figure 8. (a) The canny operator discovers the structure layer as the value of k changes. (b) PSNR of the structure layer and EPI value of the structure layer relative to the original image.
Electronics 11 01909 g008
Figure 9. Histogram of the image’s V-channel corresponding to various values of φ .
Electronics 11 01909 g009
Figure 10. Comparison image of different algorithms. Five images (ae) of different parts (including internal tissue maps of humans and chicks) were selected and the images were enhanced by classical image enhancement algorithms and novel medical image enhancement algorithms, and then shown in subjective comparison with the algorithms in this paper.
Electronics 11 01909 g010aElectronics 11 01909 g010b
Figure 11. Partial enlargement. (a) shows a magnified view of the enhanced high bright spot region in image 1, (b) shows a magnified view of the enhanced tissue vascular region in image 2.
Electronics 11 01909 g011
Figure 12. Average index comparison chart, each algorithm corresponds to the average of the five metrics (50 images), and the specific value magnitudes are described in the Ave column of Table 1.
Electronics 11 01909 g012
Table 1. Comparison chart of five evaluation indexes.
MethodsImagePCQISSIMPSNRC_IITenengrad
AGCWDIm10.980.8714.061.183.37
Im20.880.9618.941.031.06
Im30.940.9418.491.072.89
Ave0.910.9317.721.082.44
MSRCRIm10.630.727.830.712.37
Im21.010.8817.142.161.70
Im30.680.8311.060.912.29
Ave0.790.8112.201.282.12
Al-AmeenIm10.750.7114.011.822.43
Im20.810.7512.732.061.20
Im30.780.7512.971.582.45
Ave0.800.7313.341.742.03
PalanisamyIm11.100.8923.101.264.15
Im21.100.9020.931.561.70
Im30.610.7812.480.752.70
Ave0.990.8821.971.272.55
YingIm10.900.9317.230.832.87
Im20.890.9518.420.831.06
Im30.940.9722.030.902.65
Ave0.910.9518.710.862.19
WangIm10.750.8914.810.692.60
Im20.750.9418.100.720.95
Im30.710.9016.140.742.15
Ave0.740.9116.780.721.93
OursIm11.010.9627.651.433.02
Im20.940.9620.901.581.24
Im31.010.9622.841.463.11
Ave0.980.9623.231.532.49
Publisher’s Note: MDPI stays neutral with regard to jurisdictional claims in published maps and institutional affiliations.

