Article

Comparison of the Effectiveness of Selected Vibration Signal Analysis Methods in the Rotor Unbalance Detection of PMSM Drive System

1
Department of Electrical Machines, Drives and Measurements, Wroclaw University of Science and Technology, 50-370 Wroclaw, Poland
2
Independent Researcher, 50-353 Wroclaw, Poland
*
Author to whom correspondence should be addressed.
Electronics 2022, 11(11), 1748; https://doi.org/10.3390/electronics11111748
Submission received: 31 March 2022 / Revised: 17 May 2022 / Accepted: 27 May 2022 / Published: 31 May 2022

Abstract

:
Mechanical unbalance is a phenomenon that concerns rotating elements, including rotors in electrical machines. An unbalanced rotor generates vibration, which is transferred to the machine body. The vibration contributes to reducing drive system reliability and, as a consequence, leads to frequent downtime. Therefore, from an economic point of view, monitoring the unbalance of rotating elements is justified. In this paper, the rotor unbalance of a drive system with a permanent magnet synchronous motor (PMSM) was physically modelled using a specially developed shield, with five test masses fixed at the motor shaft. The analysed diagnostic signal was mechanical vibration. Unbalance was detected using selected signal analysis methods, such as frequency-domain methods (classical spectrum analysis FFT and a higher-order bispectrum method) and two methods applied in technical diagnostics (order analysis and orbit method). The efficiency of unbalance symptom detection using these four methods was compared for the frequency controlled PMSM. The properties of the analysed diagnostic methods were assessed and compared in terms of their usefulness in rotor unbalance diagnosis, and the basic features characterizing the usefulness of these methods were determined depending on the operating conditions of the drive. This work could have a significant impact on the process of designing diagnostic systems for PMSM drives.

1. Introduction

Permanent magnet synchronous motors (PMSM) are used, in lifts, aviation, electrical drives for ships and in the automotive industry due to their compact structure, high power/mass ratio, high performance and dynamics, as well as simple construction [1]. Despite safety-related issues, PMSMs are immensely valued for use in industrial sectors for the reliability of the drive systems they employ. Owing to economic reasons, considerable emphasis is placed on the early detection of basic electrical faults (including inter-turn short circuits, single-phase and inter-phase short circuits, breaking phases, earthing errors and incorrect motor winding connections), mechanical faults (including bearing faults, eccentricity, misalignment, rotor unbalance, mechanical magnet faults, shaft bending and screw loosening) and magnet-related faults [1,2,3]. Demagnetisation of permanent magnets may result from high motor temperatures in, high load and/or short-circuit currents, magnet aging and mechanical damage to the magnets [4]. The latter could be the reason for the rotor unbalance in PMSMs. Even a small degree of unbalance can lead to serious damage to the drive due to the induced vibration advancing the mechanical failure of the permanent magnets. Therefore, unbalance of PMSM rotors should be detected at an early stage so as not to cause downtime of the drive system [5].
Mechanical vibration is mostly used for mechanical failure detection, as this signal contains a considerable amount of information that can facilitate assessment of the condition of the examined machine and detect fault type and degree [6,7,8,9,10]. The analysis of vibration signals in the monitoring and diagnostics of rotating machinery damage has its advantages and disadvantages. A limitation of vibration analysis is the significant share of disturbances in the vibration signal (including random noise), as well as the correctness of vibration sensor mounting [6]. Therefore, from the point of view of the effectiveness of diagnostics, it is important to select a suitable method of vibration signal processing, taking into account the operating condition of the drive system.
In general, the main methods of signal analysis can be divided into time-domain analysis, frequency-domain analysis and time-frequency analysis. Time-domain analysis deals directly with the time course of the signal itself by applying filters or extracting characteristics such as simple statistics (mean, standard deviation, etc.) or higher-order statistics (root mean square, skewness, etc.). Frequency-domain analysis is used when the data are in the frequency domain. A commonly used traditional method in this group is spectral analysis based on fast Fourier transform (FFT). Information that is difficult to observe in the time domain can be more strongly fragmented in the frequency domain, which facilitates monitoring and fault diagnosis. In classical frequency analysis, the main harmonic frequency amplitudes (1×, 2×, 3×, etc.) are extracted and used to diagnose the condition of rotating machines. Frequency-domain analysis, except classical FFT, consists of cepstrum, envelope and higher-order spectral (HOS) analyses (bispectrum (BS), trispectrum (TS)). On the other hand, time-frequency analysis is a combined concept of time and frequency domains. Popular methods are short-time Fourier transform (STFT), Hilbert–Huang transform (HHT), Wigner–Ville distribution (WVD), wavelet transform (WT) and power spectral density (PSD) analysis. These methods are used to handle non-stationary wave signals or to verify information about trends over time [11,12].
Bispectrum (BS) analysis a frequently applied frequency-domain method of mechanical vibration signal analysis and has been successfully used for diagnosis of various mechanical faults. In [13,14], BS analysis was used to investigate gear vibration. In [13], the authors searched for an efficient signal processing method of mechanical vibration to distinguish between vibrations related to gears and those originating from other drive elements. BS analysis was combined with neural networks for the purpose of automatic detection and fault identification. On the other hand, in [15], experimental research encompassed the simulation of faults, such as misalignment and a broken or seized shaft. The results of FFT, BS and TS analyses were presented, proving the superiority of the TS and BS methods in terms of fault detection under a wide range of rotor rotational speeds. In [16], the authors performed BS analysis of experimental stator current signals, demonstrating the superiority of BS for the accurate detection of broken rotor bars in an induction motor (IM). In [17], the BS method was used in combination with empirical mode decomposition (EMD) to monitor rolling bearing faults based on vibration signals.
Order analysis is also relatively popular for technical diagnosis of mechanical faults in rotating machines. Full-spectrum (FS) transform was proposed and implemented in technical equipment by Bently Nevada in 1993 [18,19]. By using two perpendicular signals measuring the mechanical vibrations of the machine and collecting information on the rotational speed of the rotor, it is possible to detect damage such as unbalance, misalignment, rotor cracks, partial friction, loose parts, rotational stalls or a fluid-induced vortex [18,20]. Despite the extensive capabilities of FS analysis, over the last 20 years, the number of papers referring to its use for diagnosis of electrical machines has not been significant. In [21,22], FS analysis was used to detect rotor misalignment. The tests encompassed the influence of parallel and angular misalignment on the results of FS analysis for a few subharmonic speeds. The authors of these works indicated symptoms and their characteristic behaviour, enabling differentiation between misalignment and, e.g., a cracked motor shaft, as these faults exhibit similar characteristics in the full spectrum. A combination of an FS algorithm with a fuzzy system was implemented in [23], wherein the unbalance and misalignment faults of a mechanical system were examined by the authors. The amplitudes of characteristic FS components in the case of a given fault, as well as information on the RMS value for mechanical vibration signals, were used as input data in the fuzzy logic system, which was applied to classify and assess the degree of damage.
Another technical method sometimes used to classify mechanical faults in rotating machines is orbit shape analysis (OS) of rotor displacement. It is an easy method to implement and is not time-consuming. Most frequently, this analysis method is used to detect misalignment. In [24], the experimental research results for orbit shape analysis and FS of a mechanical system with parallel and angular misalignment were presented. However, the authors discussed only the orbit shapes of the analysed misalignments and did not include details about the analysed fault. In [25], the authors focused on the automation of the process of mechanical fault detection on the basis of orbit shape. They used a convolutional neural network to classify faults by attributing orbit shapes from one of five categories connected with unbalance and misalignment.
In the literature on diagnosis of mechanical damage to rotating machines, relatively few studies have been conducted on mechanical unbalance detection of PMSM drives, as opposed to drives with IM. Recently, several studies have been conducted in which the possibility of PMSM rotor unbalance detection using various signal processing methods were presented. In [26], FFT analysis of mechanical vibrations was used to detect rotor unbalance. Experimental studies were performed on a motor with modelled demagnetisation and dynamic eccentricity to confirm the effectiveness of the proposed method. Park transform analysis of the stator current signal using discrete wavelet transform (DWT) was discussed in [27,28]. Simulation and experimental studies conducted under non-stationary conditions confirmed the effectiveness of the method in detecting unbalance. In [29], the stator current was analysed. In [29], the unbalance fault was analysed using two combined techniques: CWT and a distance approach for stator current signals. However, only simulation studies for light loads under non-stationary conditions are presented. Unbalance detection in permanent magnet synchronous generators (PMSGs) was discussed in [30,31]. In [30], the stator current was analysed. The effect of the unbalance mass and the radius of its mounting on the level of unbalance failure was studied under stationary conditions. The authors used the Bayesian method, which, based on the amplitude of the current, allowed for estimation of the degree of unbalance. In [31], the unbalance fault of marine current turbines was discussed. In this specific application, plankton or biofouling that attach the turbine blades may cause unbalance. The authors presented the advantages and disadvantages of different diagnostic methods for marine current turbines. The paper was focused on methods based on external sensors (e.g., accelerometers, cameras, temperature sensors, etc.) and phase current sensors embedded in the generator. In [32], mathematical models of PMSM rotor unbalance and magnetic asymmetry were presented, and their correctness was confirmed by experimental tests. The authors took into account the vibration signal and its frequency analysis. In [33], the effect of unbalance mass and rotational speed on the change in amplitudes of characteristic symptoms obtained from FFT, bispectrum and full spectrum analysis of the vibration acceleration signal was investigated. The authors performed a study of five test masses, starting from the smallest one equal 14.99 g. An analysis of the available literature revealed that there is a lack of articles that compare the effectiveness of different methods for detecting rotor unbalance of a PMSM drive system in the first phase of its occurrence. Therefore, in this paper, we focus on a comparative analysis of four signal processing methods in the case of very low test mass in the range of 1.07–2.36 g.
The goal of the present study was to compare the effectiveness of mechanical unbalance detection in a PMSM drive using vibration signal and bispectrum analysis with other methods. The results obtained with this HOS method were compared with those of other frequency-domain methods, including the most popular classical FFT, order analysis and the simple orbit method, which are popular in mechanical fault detection for machinery applications.
The unbalance of the drive motor rotor was physically modelled using a specially made shield, on which five different tests masses were mounted. The tests were conducted for six power-supply frequencies (rotational speeds) of the PMSM drive system to determine the range of possible applications of the compared methods.
This paper consists of seven sections. After the Introduction, in the second section, some general remarks on rotor unbalance of the rotating machines are presented. The next section contains a brief description of the signal analysis methods used in the presented research for unbalance detection in a PMSM drive system. In this section, we also discuss the advisability of testing unbalance detection in its early stage using the HOS method. In the fourth section, we describe the laboratory stand used in the tests and present an example of the recorded vibration signals for various degrees of rotor unbalance in the tested PMSM drive. In the next section, we present the results of the analysis of vibration signals performed with the use of the four analysed methods. In the sixth section, an indicator of the effectiveness of the analysis method for emerging damage is proposed, which made it possible to compare the effectiveness of the signal processing methods in terms of their suitability for detection of incipient unbalance and in terms of the drive’s operating conditions. We conclude the article with a brief summary of the obtained results.

2. Rotor Unbalance in Electrical Machine

The phenomenon of unbalance arises as a result of rotation unbalanced masses. Any unbalanced mass on the rotating element is a generator of centrifugal force. The value of this force acting on the mass of the unbalance depends on the square of the angular velocity. Therefore, elements with high rotational speeds deserve special attention. This force causes mechanical vibrations, which are transferred first to the rotor bearings, then to the machine body and, next, to other parts of the machine or other devices. Exceeding the permissible unbalance levels causes faster wear of the machine and, in particular, contributes significantly to bearing damage [21]. Rotor unbalancing is the internal fault of an electric machine whereby the mass centre line does not coincide with the geometric centre. Mass unbalanced rotor fault can be classified into three categories:
  • Static unbalance occurs shaft rotational axis and weight distribution axis of the rotor are parallel but there is an offset. Static unbalance occurs more frequently in disk-shaped rotors due to uneven distribution of mass or in rotors with internal faults (e.g., broken rotor bars of a squirrel-cage motor or damaged permanent magnets of PMSM).
  • Coupled unbalance occurs when two equal unbalances are 180 degrees out-of-phase. Under this condition, the shaft rotational axis and weight distribution axis of the rotor intersect at the centre of the rotor.
  • Dynamic unbalance occurs when the shaft rotational axis and weight distribution axis of the rotor do not coincide.
In general, it is possible to detect mechanical unbalance during the rotation of the rotor. Unbalanced forces arising in an unbalanced rotor are transferred to the machine frame via the bearings. The unbalanced mass is located on the rotor, so it is an integral part of it and it rotates at the speed equal to the rotor angular speed. Therefore, identification of the unbalance takes place by analysing the fundamental rotational frequency, fr (fr = n/60, where n is the rotational speed in rpm), also referred to as 1fr, 1X [20,21]. However, the first rotational frequency is also associated with other mechanical damage, such as misalignment, eccentricity or mechanical backlash, which makes it difficult to detect unbalance [1,2,3,4,5,21,22]. According to literature analysis results, limited research has been conducted on unbalanced rotor fault detection of PMSM drives [26,27,28,29,30,31,32,33].

3. Short Description of Selected Signal Analysis Methods

3.1. Fast Fourier Transform Analysis

The basic method of signal processing used for diagnosis of drive systems is the fast Fourier transform (FFT), which transforms the signal from the time domain to the frequency domain. The main disadvantage of FFT is the loss of information about the time of occurrence of the event (e.g., failure), so it is used to analyse stationary and periodic signals. For discrete signals, x(n), of finite length, N, discrete Fourier transform (DFT) X(k) (k = 0, ..., N/2) takes the following form [34]:
X ( k ) = n = 0 N 1 x ( n ) e j 2 π n k N .
After the DFT transformation, the results are presented in the form of a frequency spectrum of the signal, which is calculated according to the following relation [34]:
| X ( k ) | = ( Re { X ( k ) } ) 2 + ( Im { X ( k ) } ) 2 .
To scale the spectrum in frequency units, each sample, |X(k)|, is assigned a frequency, f(k), calculated according to the following relation [34]:
f ( k ) = k f p N ,
where fp is the sampling frequency, and N is the total number of signal samples.

3.2. Bispectrum Analysis

Bispectrum transform (BS) is the third-order spectrum, which shows coupling effects between signals at different frequencies. BS is the most frequently used HOS in the analysis of various signals. It is calculated on the basis of the statistics of the third-order cumulant (n = 3). For Gaussian signals, the transform equals zero. As a consequence, it improves the ratio between the signal deviating from the normal distribution and the noise level. An overview of the theory of HOS can be found in [35,36].
This tool has already demonstrated its efficiency in many detection applications, including machinery diagnosis for various mechanical faults.
For a stationary, discrete signal {x(k)} (where k = 0, ±1, ±2, ..., it is the sample number), BS is described by the third-order cumulant of a function of two variables, τ1, τ2 [35,36]:
c 3 , x ( τ 1 , τ 2 ) = E { x ( k ) , x ( k + τ 1 ) , x ( k + τ 2 ) } ,
where E{•} is the expected mean operator or, equivalently, the average over a statistical set [37].
The transfer to the frequency domain is obtained by calculating the double discrete Fourier transform from the third-order cumulant of signal {x(k)}. The calculated BS is a function dependent on two new variables, ω1 and ω2:
B ( ω 1 , ω 2 ) = τ 1 = τ 2 = c 3 , x ( τ 1 , τ 2 ) exp ( j ( ω 1 τ 1 + ω 2 τ 2 ) ) ,
assuming that:
| ω 1 | π ,   | ω 2 | π ,   | ω 1 + ω 2 | π .
Finally, BS can be expressed as the product of the Fourier transforms of a function of one variable [38]:
B ( ω 1 , ω 2 ) = E { X ( ω 1 ) X ( ω 2 ) X * ( ω 1 + ω 2 ) } ,
where X* denotes the complex conjugate of X; X(ω) is the Fourier transform of the discrete signal, x(k); and E{•} is an average over an ensemble of realizations of a random signal.
In computing the BS transform, the symmetry properties of third-order cumulants can be used, which imply that [35,38]:
C 3 ( ω 1 , ω 2 ) = C 3 ( ω 2 , ω 1 ) = C 3 ( ω 2 , ω 1 ) = C 3 ( ω 1 , ω 1 ω 2 ) = C 3 ( ω 1 ω 2 , ω 2 ) = C 3 ( ω 1 ω 2 , ω 1 ) = C 3 ( ω 2 , ω 1 ω 2 )
The implication of the basic symmetry properties given in (8), together with (6), are illustrated in Figure 1, which shows the BS domains for discretely sampled data. It should be noted that for real-time series, {x(k)}, it is enough to compute only region I, called the principal domain, marked in this figure. All other regions can be calculated from region I [20].

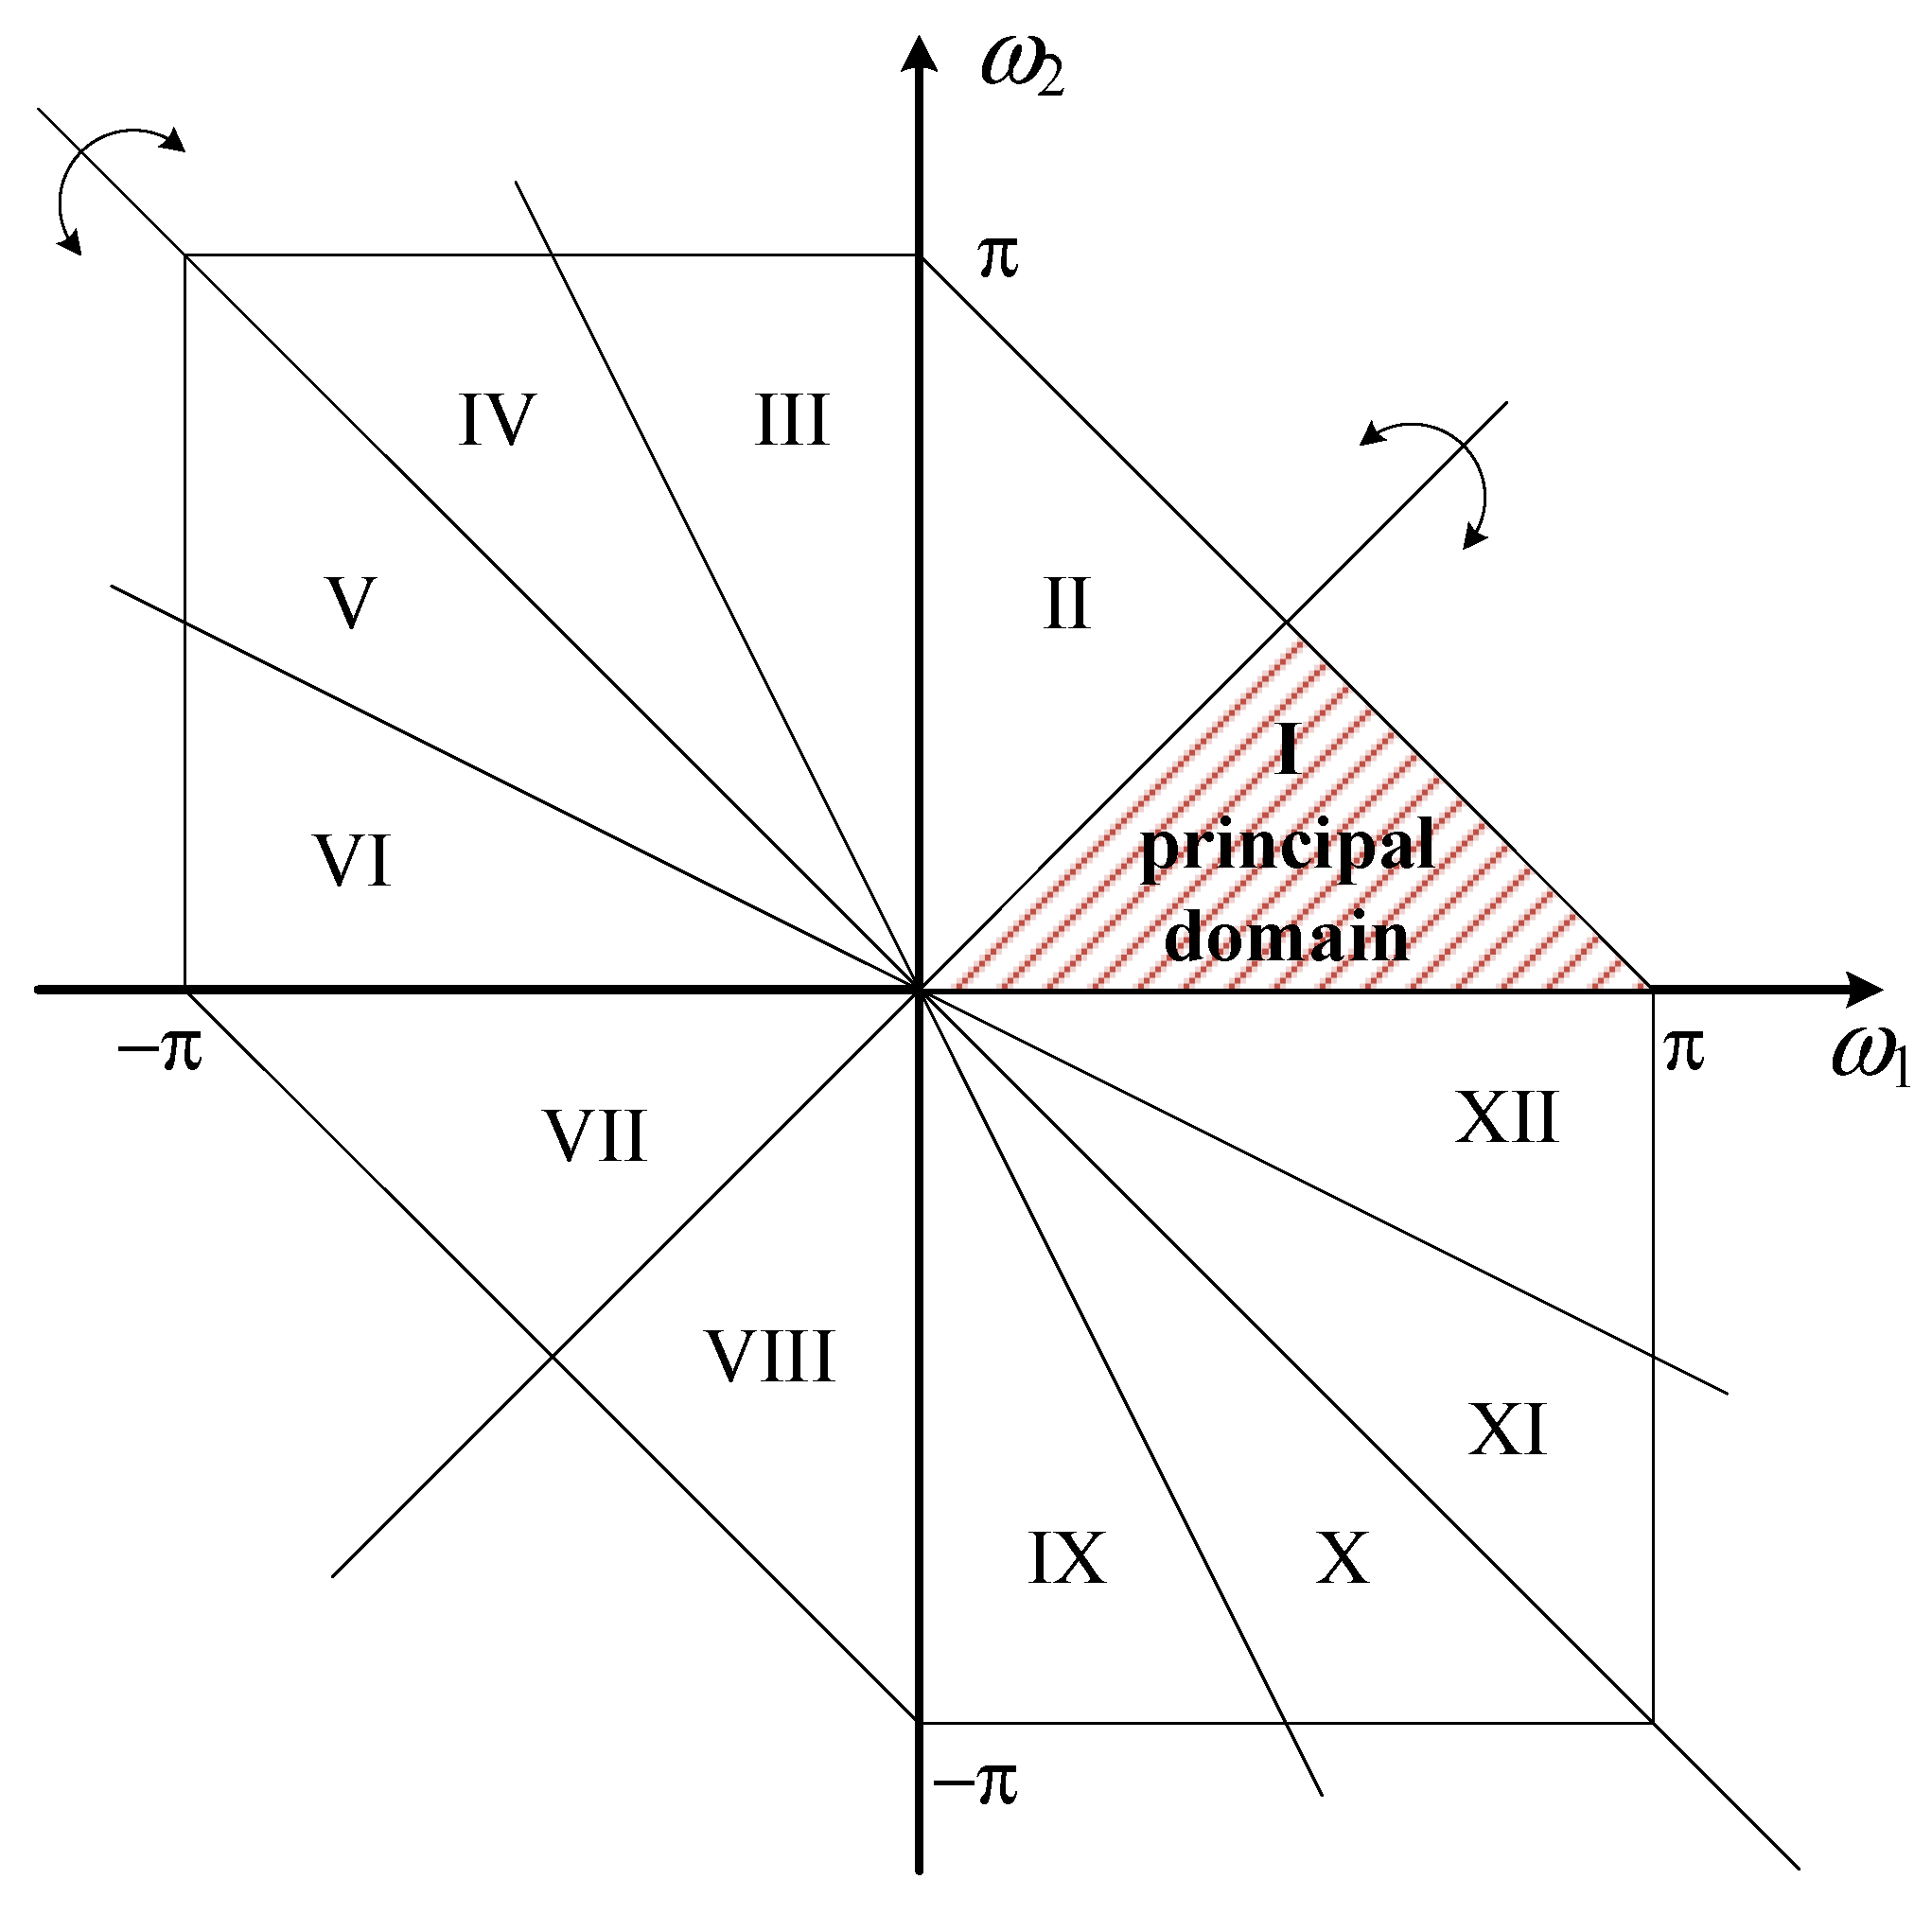
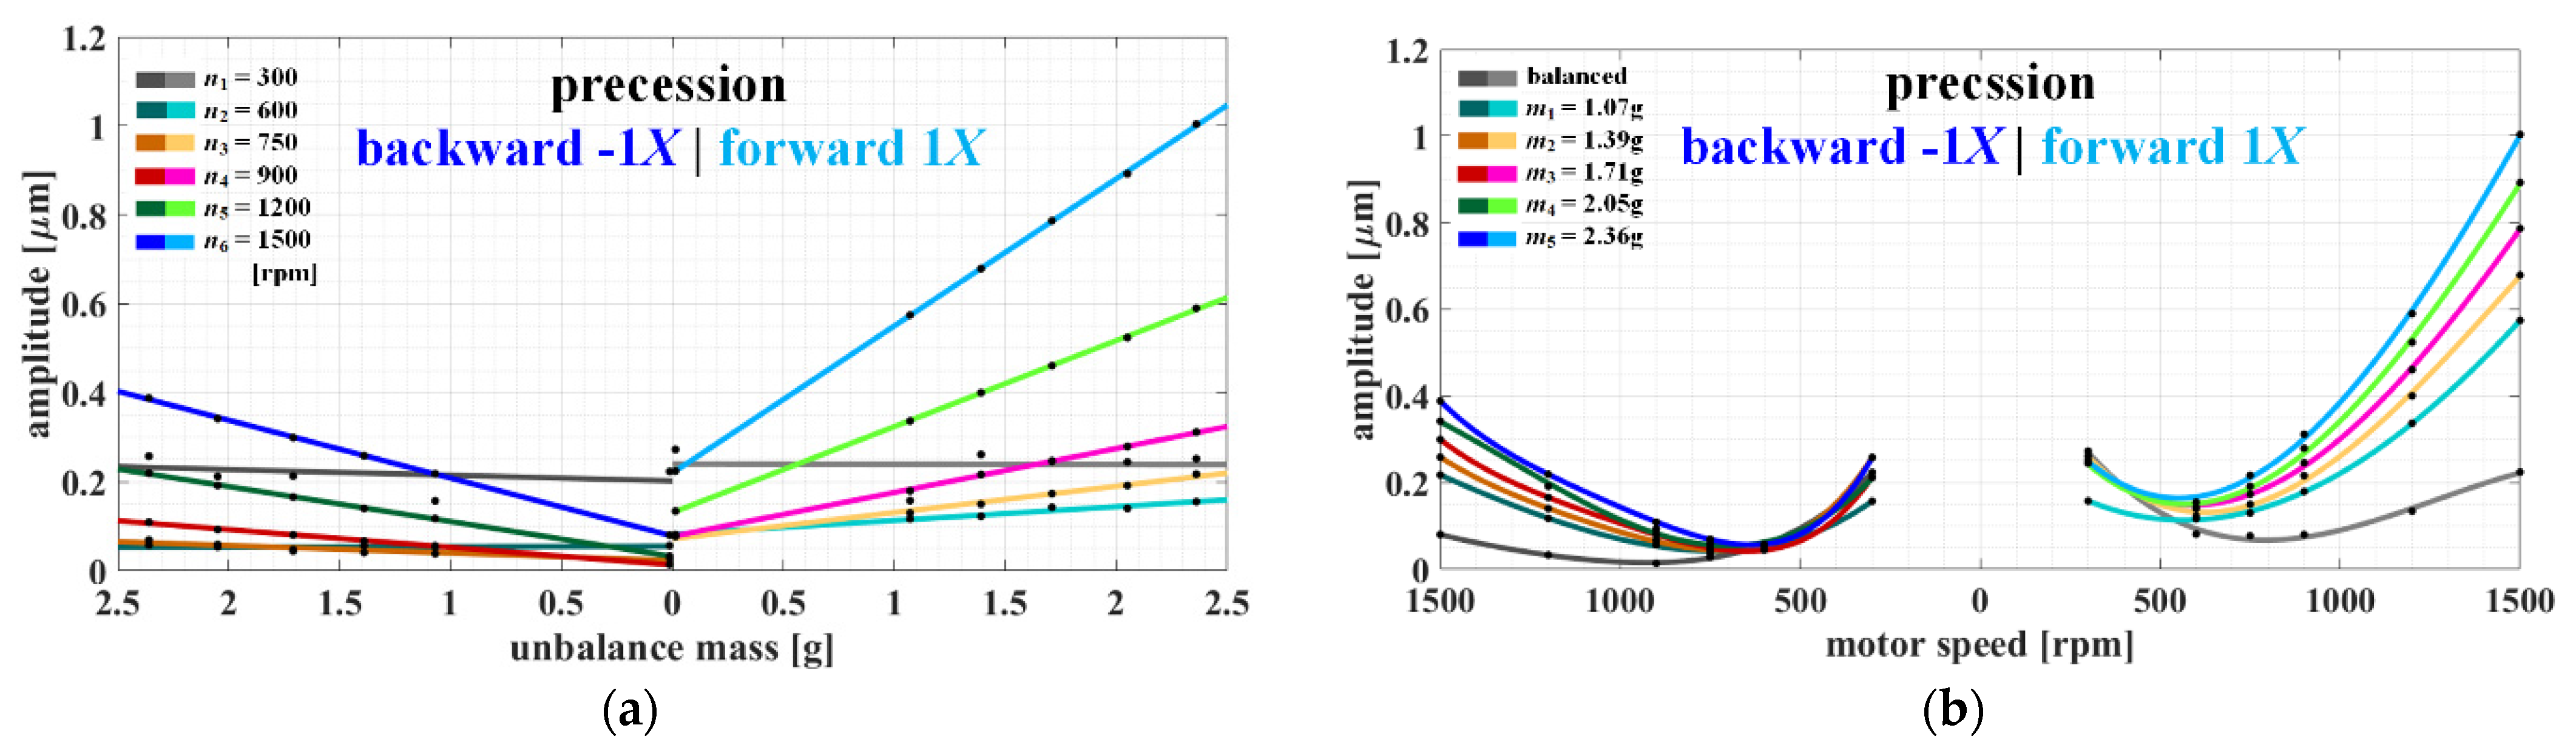
3.3. Full-Spectrum Analysis

Order analysis is a technique allowing for analysis of non-stationary signals and is frequently applied in the case of PMSM drives under speed control. Signals from mechanical vibration are related to the rotational speed, not with time. Order analysis allows for transition from the time domain to the rotational speed domain and for effective calculation of stationary signals, e.g., using FFT analysis. An unbalance symptom in the vibration signal is the first rotational frequency, which is directly related to the rotational speed. Hence, the changes observed in the harmonic amplitude of the first order (1X) correspond to changes in the rotor unbalance.
Full-spectrum (FS) analysis, contrary to half-spectrum analysis, contains information on the correlation sensor signals in axes X (horizontal) and Y (vertical), as well as the precession direction. Therefore, FS can be used as the basis for mapping the orbit shape (without its orientation because the there is no information about the phase). Another advantage of FS advantage is its independence of orientation change and the rotation of sensors measuring mechanical vibration [18].
FS is calculated on the basis of FFT of two vibration signals on the horizontal and vertical axes and then converted into two new spectra, which are represented by precession frequencies. The rotor precessive movement generally draws an ellipse. This ellipse can be represented as a sum of two circular orbits: one is the locus of the vector rotating in the direction of rotation (forward), and the other is the locus of the vector rotating in the opposite direction (reverse). Both vectors rotate at the same frequency as the filtered orbit (Figure 2). Therefore, one spectrum is converted for a precession with motion from the sensor along the X axis to the sensor along the Y axis, and the other spectrum for the precession in the opposite direction (from the sensor along the Y axis to the sensor along the X axis). Information on the direction of the motor shaft rotation is necessary to determine the direction of precession. Phase marker information is used to determine which spectrum represents the forward precession and which represents the backward precession [18,19].
Figure 2 presents the model of the FS construction and the relation between the orbit and the full spectrum. It is an example of a filtered orbit composed of forward and backward orbits with a radius of R ω n f and R ω n b , respectively; rotational speed, ωn; and phases αn and βn, in which n denotes the filtered speed. The filtered angular speed, ω, can be equal to the rotor angular speed, (ω = ) and n = 1 (1X) for ω = 2, n = 2 (2X), etc.
In summary, the vectors of both component orbits, as well as the amplitudes of the FS lines, are obtained as follows [19]:
  • Amplitude of forward precession:
R ω n f = X n 2 + Y n 2 + 2 X n Y n sin ( α n β n ) ,
  • Amplitude of backward precession:
R ω n b = X n 2 + Y n 2 2 X n Y n sin ( α n β n ) ,
where Xn, αn, Yn, and βn are the amplitude and phase of the signal from the sensor along the X axis and Y axis, respectively, after FFT calculation; and ωn is filtered speed.
The full-spectrum plot allows for determination of whether the rotor orbit is forward or backward in relation to the direction of rotor rotation. This information, which is characteristic of specific machinery malfunctions, makes the FS plot a powerful tool for interpreting the vibration signals of rotating machinery [19]. In the case of rotor unbalance, this plot contains two spectral lines of the order of ±1X. A spectral line with a positive order of +1X denotes forward precession, whereas a spectral line of the order of −1X denotes backward precession. A line with a dominant amplitude determines precession direction. A spectrum in which only one spectral line is visible, +1X or −1X, corresponds with the rotor balance condition. In such a case, the line reaches its maximum amplitude value. The calculation process of the full spectrum is shown in Figure 3 [18].

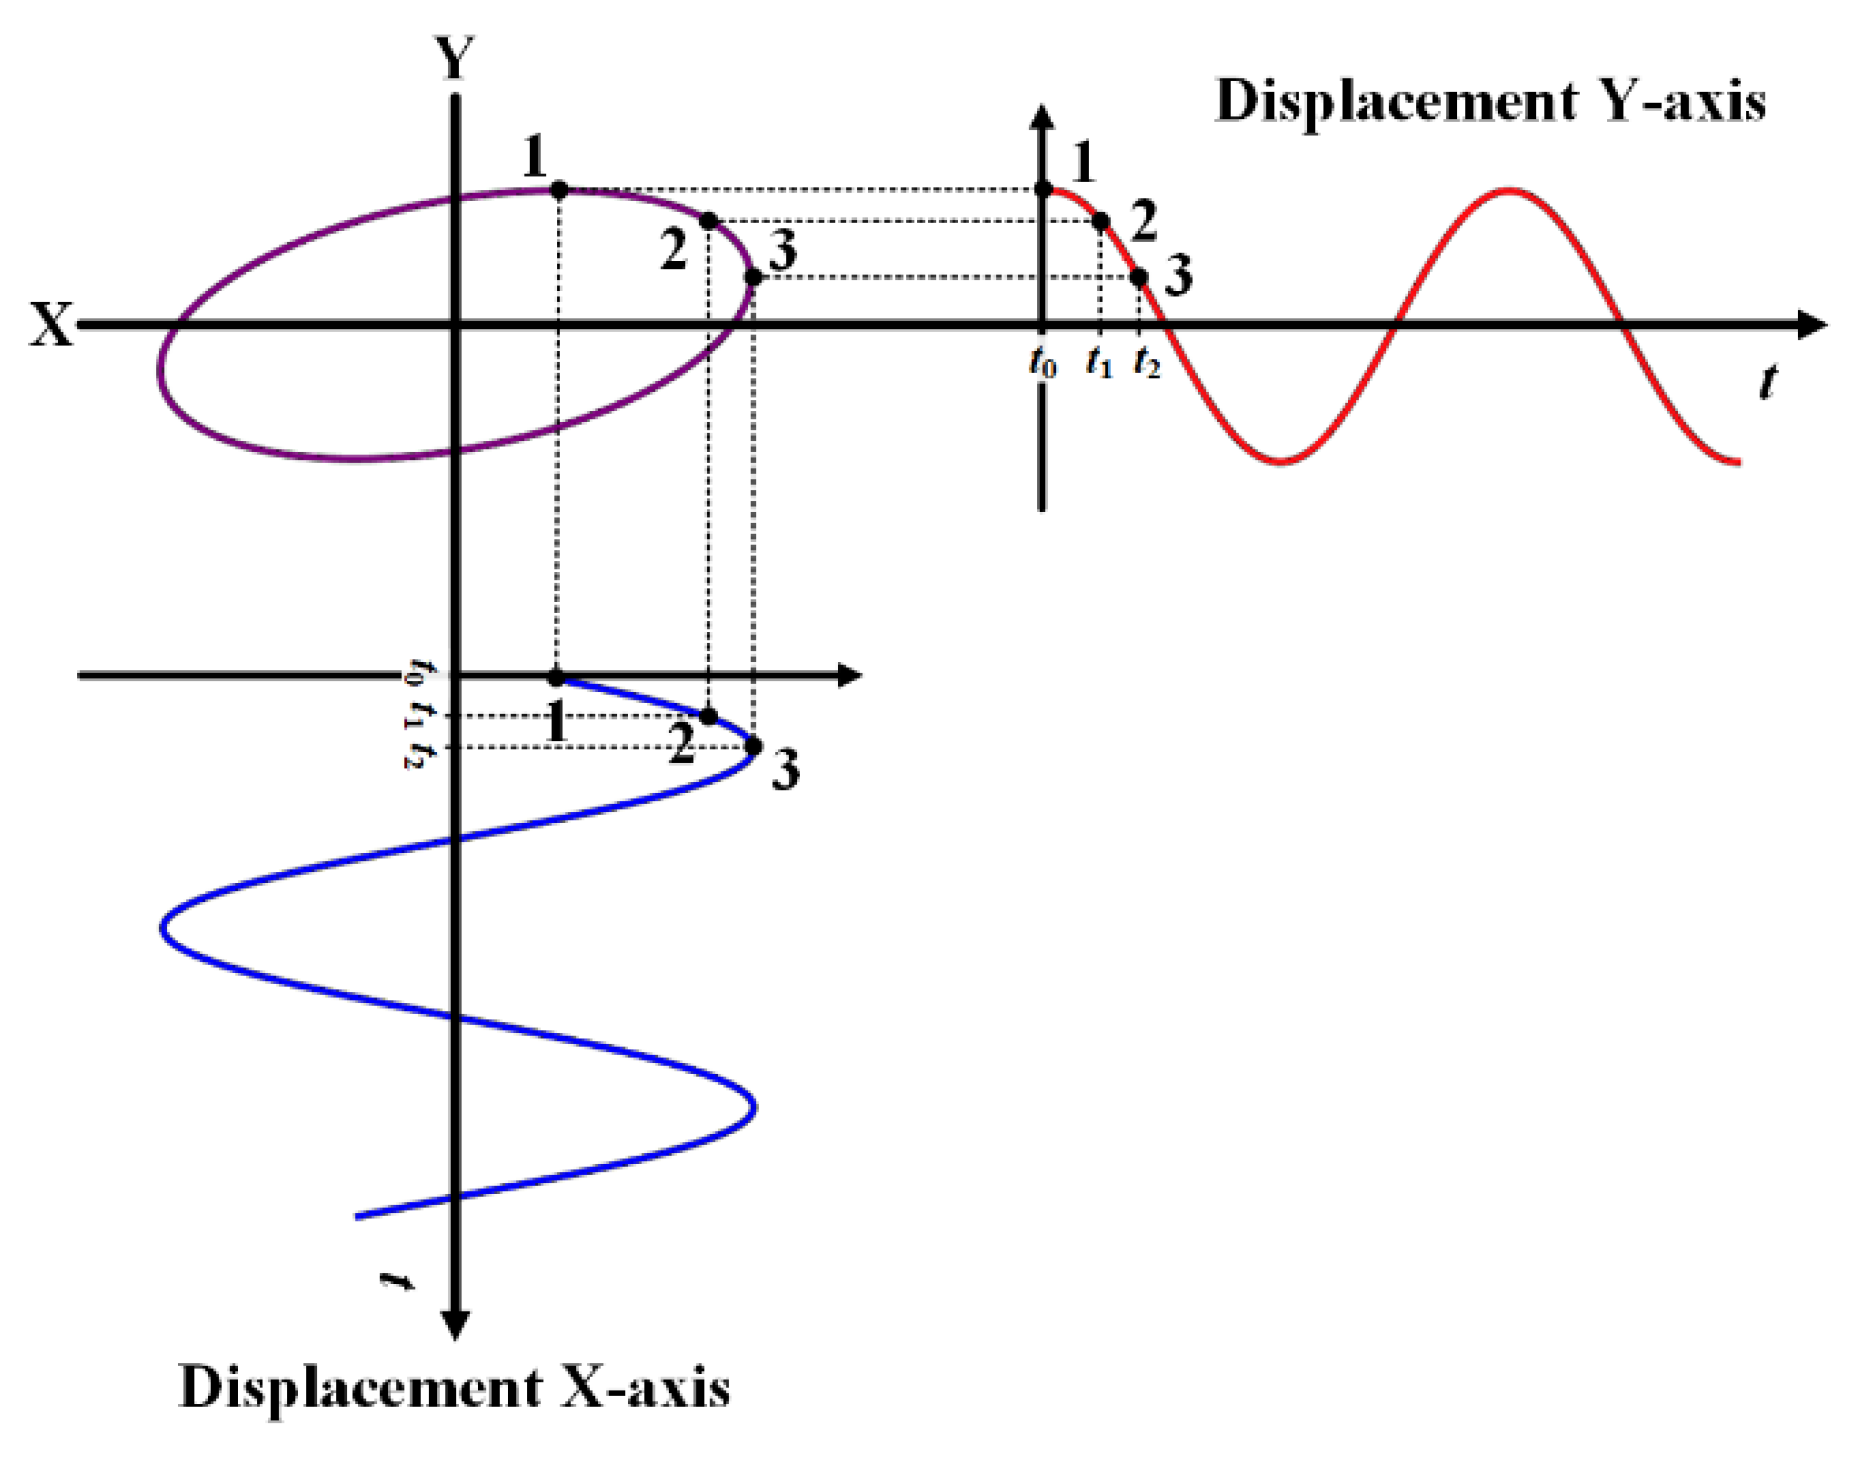
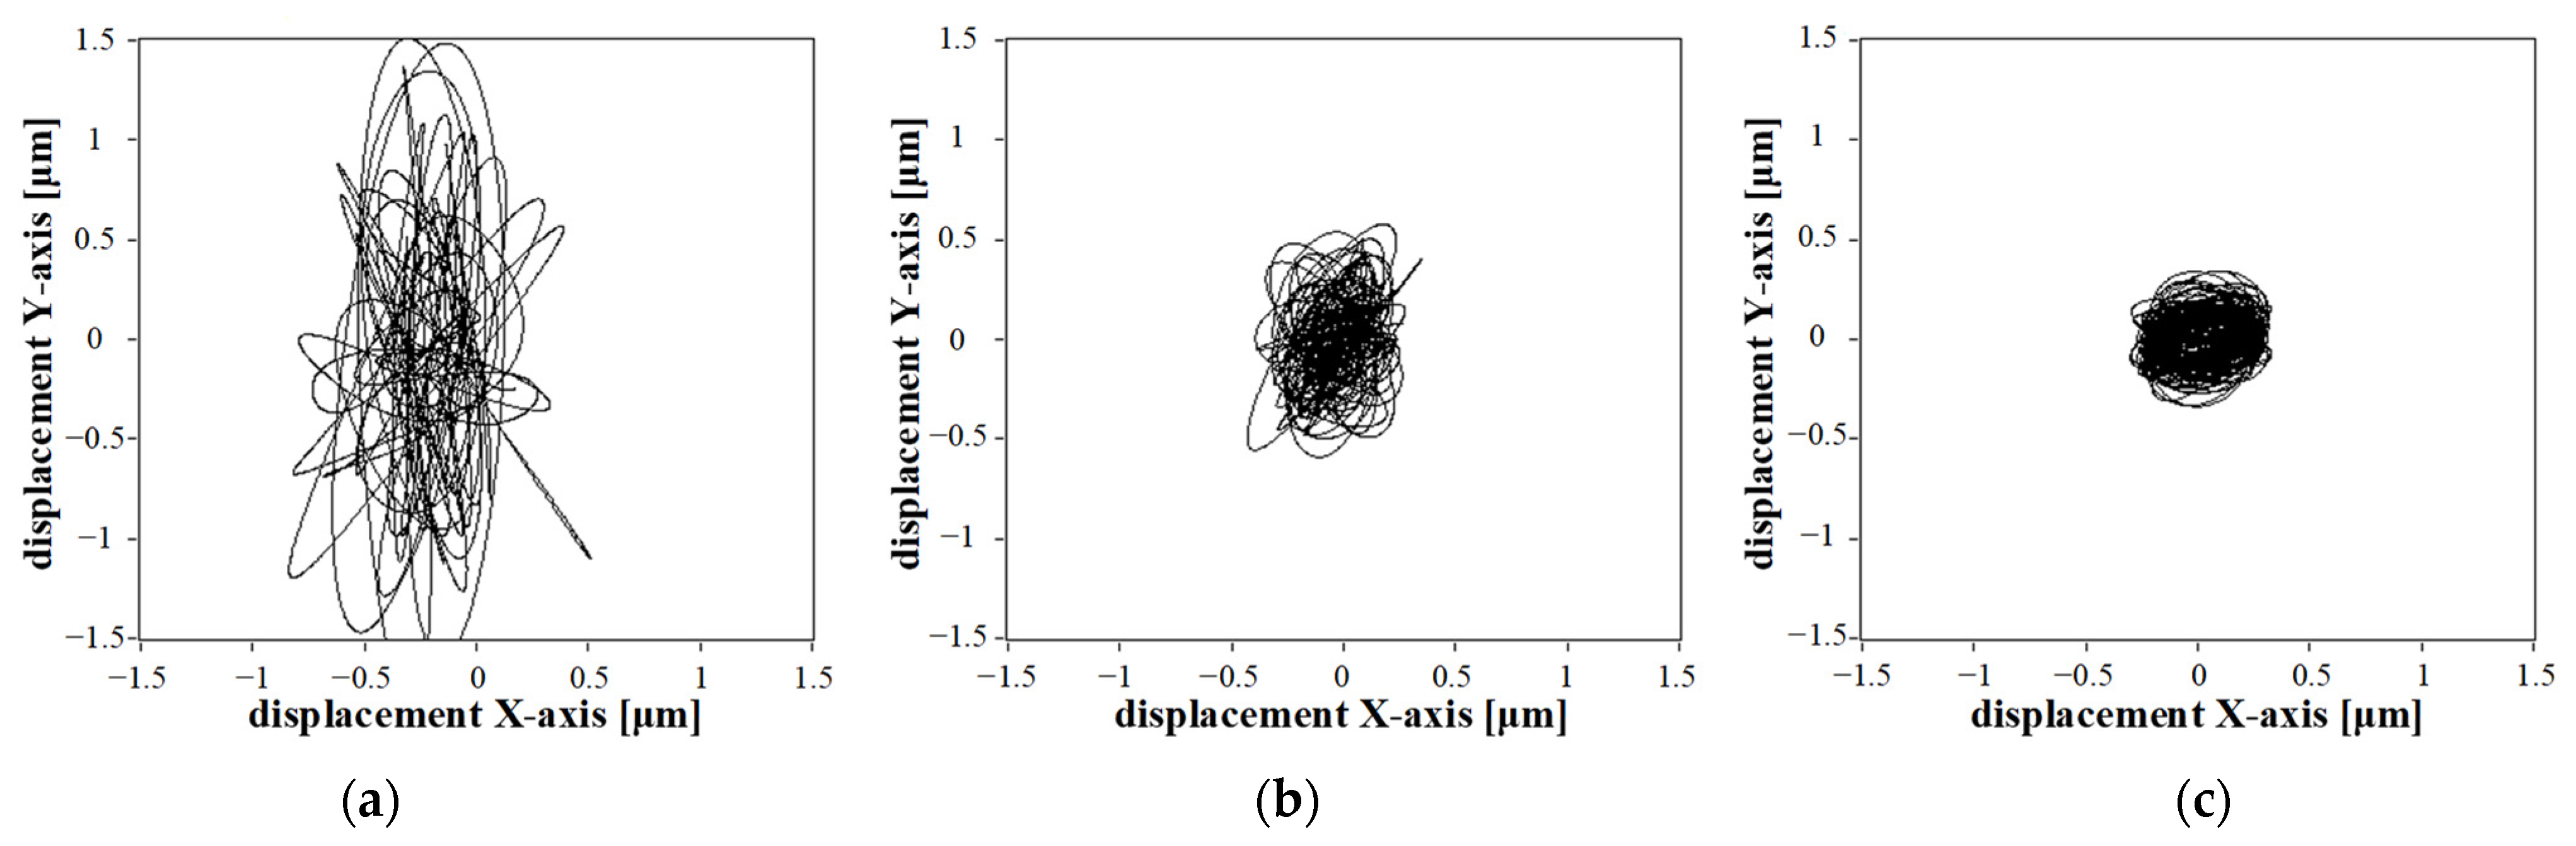
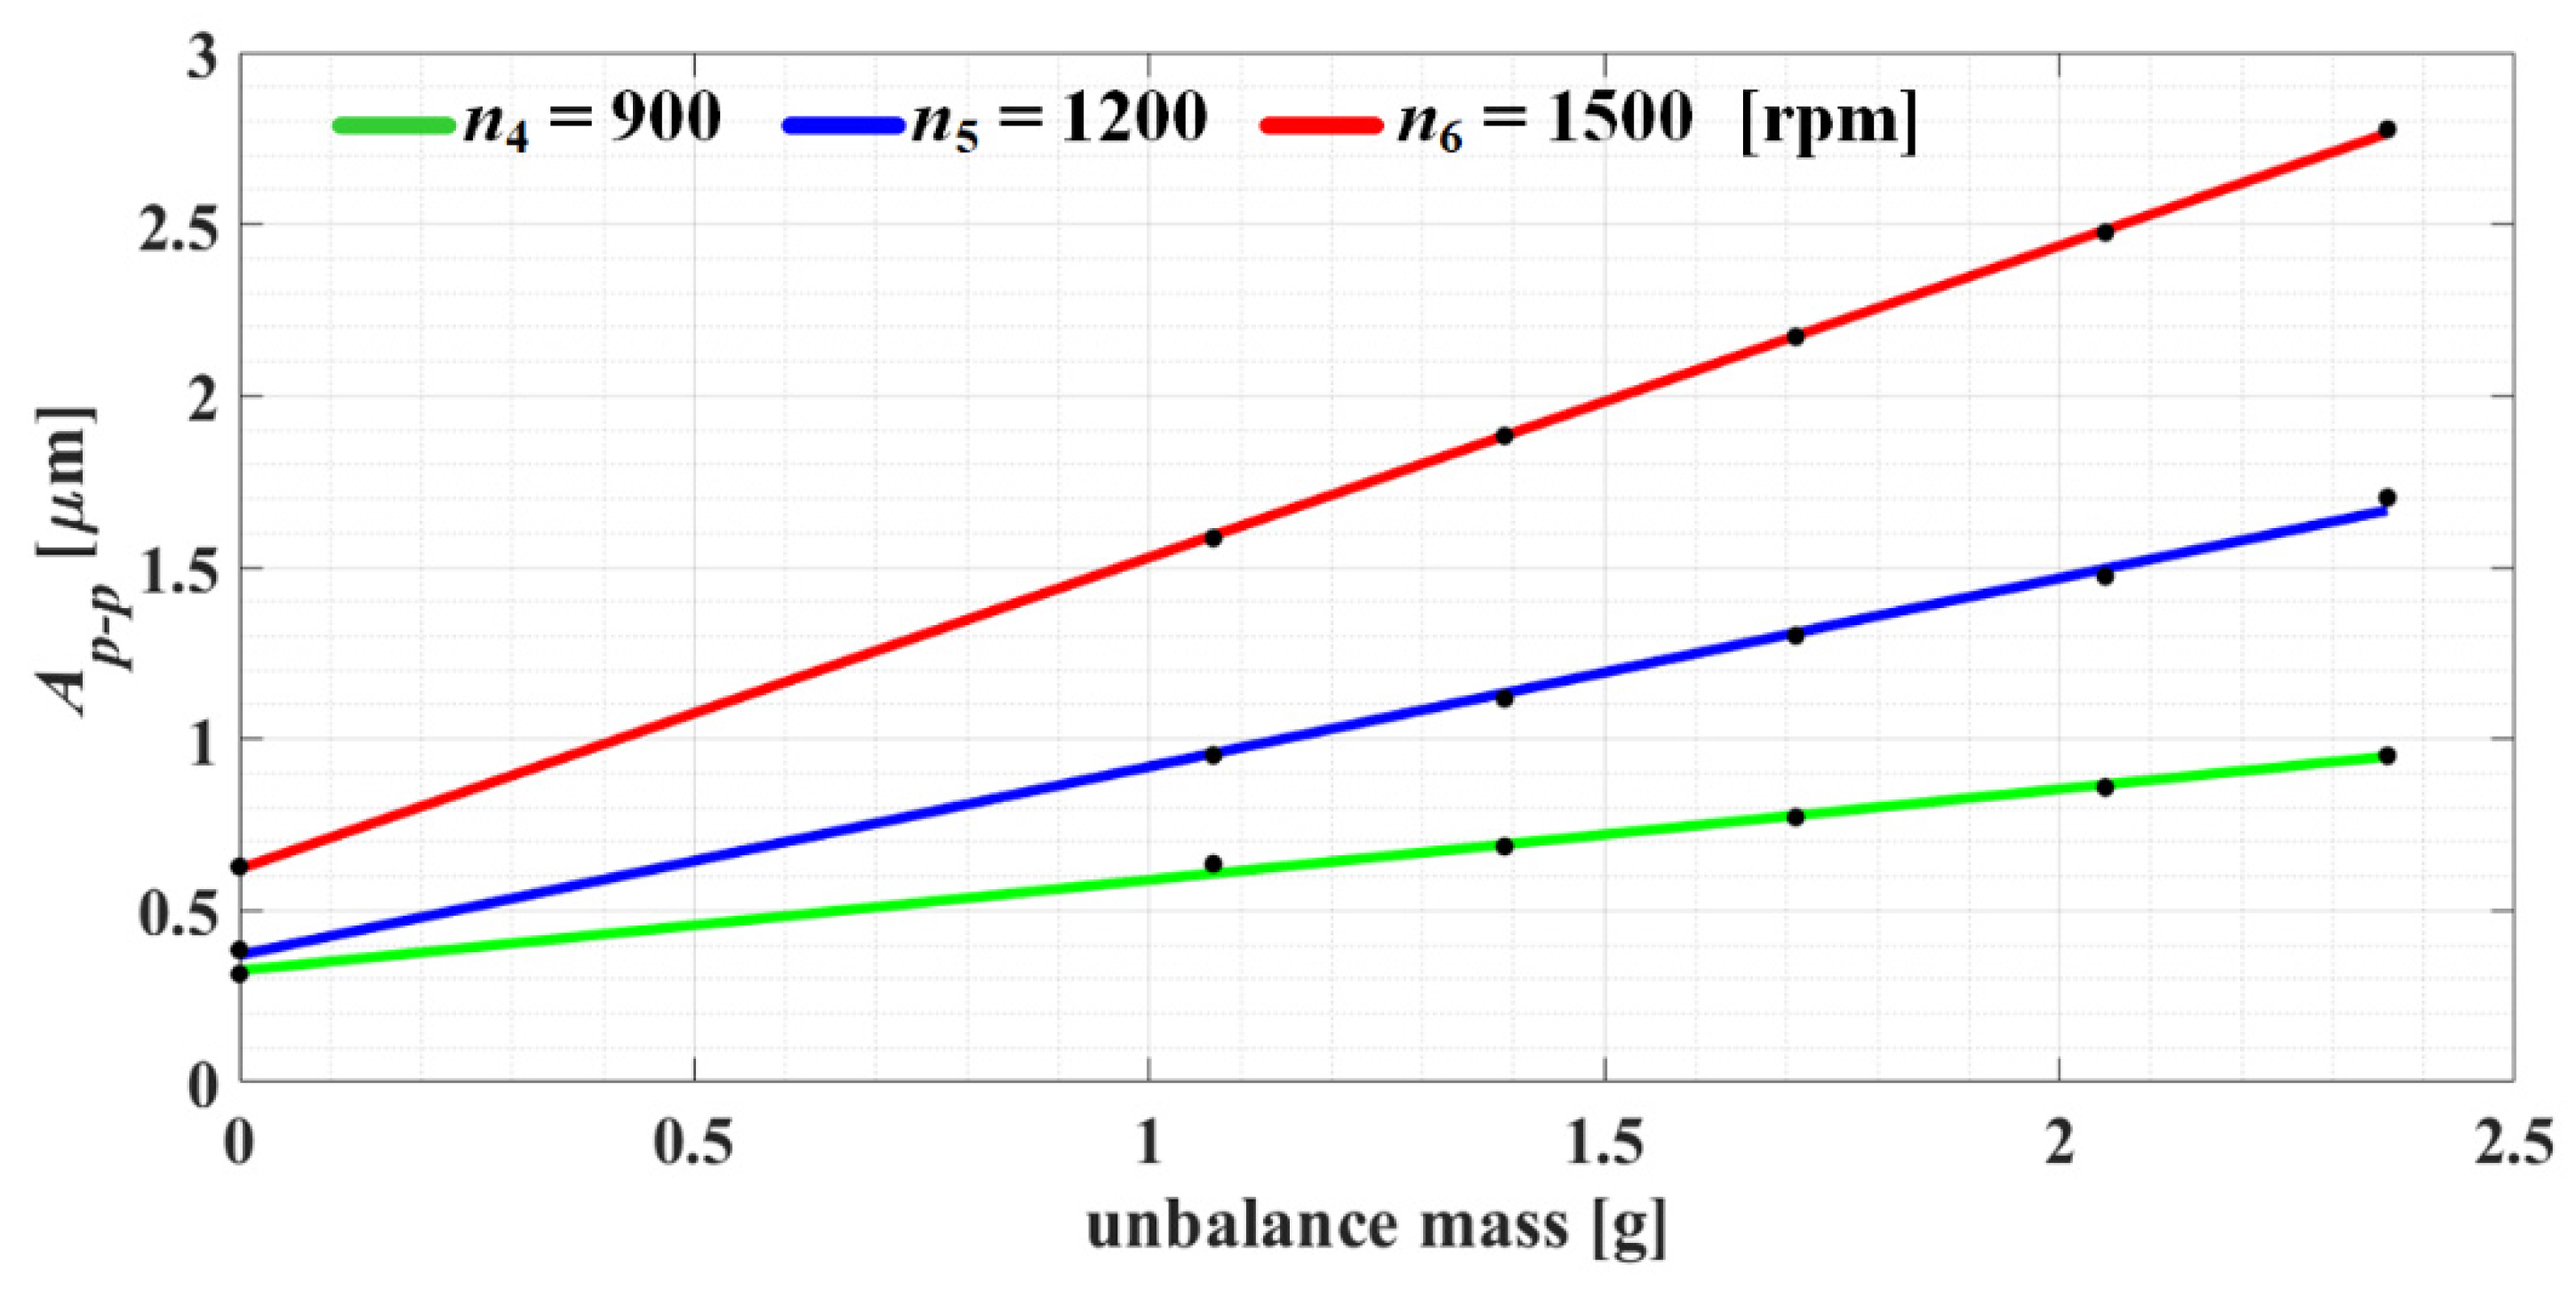
3.4. Orbit Shape Analysis

Measurement of mechanical vibration and signal analysis using one sensor provides useful information on the technical condition of the tested machine. If the focus is on time waveforms and a particular frequency to be filtered, a sinusoidal signal is obtained [18]. Single-sensor measurement (one-dimensional space of rotor motion) does not offer complete information on rotor motion. When two mechanical vibration sensors are fixed perpendicular to one another on one plane perpendicular to the rotor axis, it is possible to observe the rotor motion in two dimensions. Plotting two filtered time waveforms in the common XY coordinate system allows for observation of the full motion of the rotor. The purple curve presented in Figure 4 shows the motion trajectory of the rotor axis (orbit) in the transverse plane [18,20].
Orbit construction employs the basic property of harmonic vibration, which can be presented as the sum of harmonic signals with the same frequency and random amplitudes and phases:
y ( t ) = A sin ( ω t + φ ) = A ( sin ( ω t ) cos ( φ ) + cos ( ω t ) sin ( φ ) ) .
The geometric orbit plot is shown in Figure 4. The blue colour marks the filtered signal of mechanical vibration at the sensor measuring vibration in the horizontal direction. The signal at the sensor measuring vibration in the vertical direction is marked with red colour. The orbit trajectory is obtained by registering the amplitudes of both signals at the same time instant. Point 1 in the orbit is determined at moment t0, when the value of the amplitudes of both signals were measured. These values are the co-ordinates of point 1 in the orbit. The procedure is replicated until the complete motion trajectory of the rotor axis motion is obtained. In the non-fault state, the orbit shape is a circle with relatively small inter-peak values of displacement. The occurrence of a mechanical fault results in a deviation from this rule. In the case of unbalance, the orbit has an elliptical shape, as shown in Figure 4.

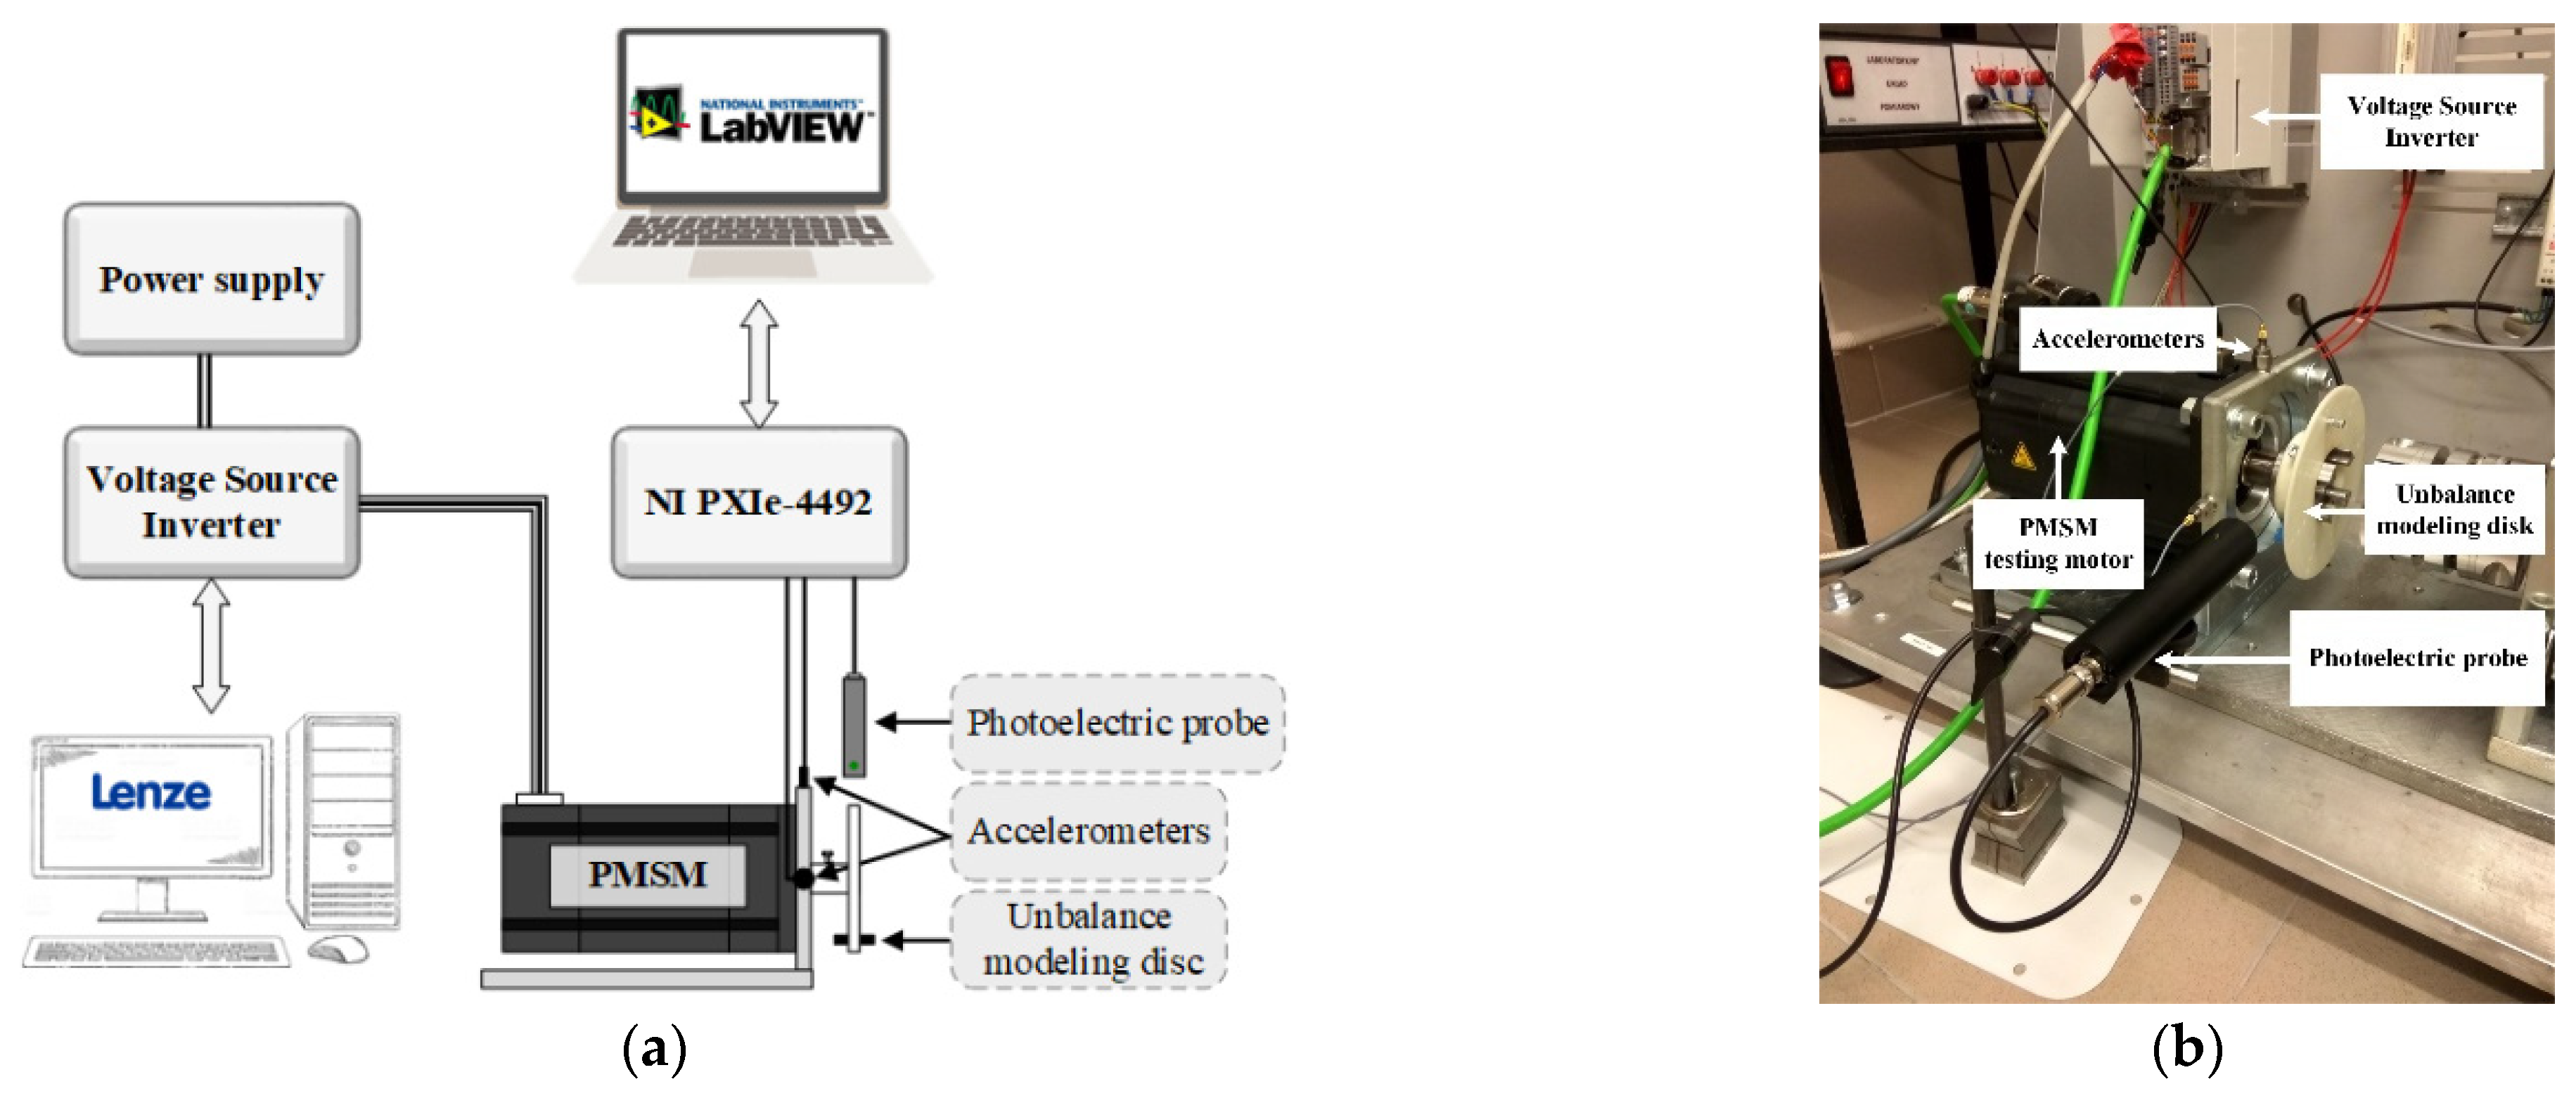
4. Experimental Setup and Test Scenario

The present study was realized for a PMSM drive system (MCS 14H15 type, Lenze, 2.5 kW) supplied by an industrial variable frequency drive (8400 TopLine C, Lenze). Figure 5 presents the measurement system scheme and a photograph of the laboratory setup for modelling PMSM rotor unbalance. The tested motor had four pairs of poles, and its nominal frequency was 100 Hz. The analysis encompassed mechanical vibration signals measured with piezoelectric accelerometers (Brüel&Kjær): two 4514-type single-axis accelerometers mounted at an angle of 90° relative to one another. The shaft position was determined using a photoelectric probe for speed measurement (Brüel&Kjær). The shield used to model rotor unbalance was fixed on the drive side. During the experimental research, five different unbalance masses were used: m1 = 1.07 g, m2 = 1.39 g, m3 = 1.71 g, m4 = 2.05 g and m5 = 2.36 g, which were fixed at a radius of 65 mm. Measurements were performed for six speed references of the drive, e.g., motor supply frequency values: 20 Hz, 40 Hz, 50 Hz, 60 Hz, 80 Hz and 100 Hz. An industrial computer (National Instruments) equipped with an NI PXIe-4492 measurement card was applied for the acquisition and processing of the measured signals of vibration acceleration. Because the analysis of mechanical vibration signals was conducted in the low-frequency band, the sampling frequency was set at 2 kHz. The signal was recorded for 10 s.
Samples of the acquired vibration signals are presented in Figure 6 for two different motor speeds. In this figure, zoomed-in images are also presented to show details of the vibration acceleration for a balanced and unbalanced drive, for low and nominal speeds, and for minimal and maximal tested unbalance masses. The RMS value of the vibration signal is also presented, with similar values for all tested cases; therefore, RMS cannot be used as a fault symptom. It is clearly visible in Figure 6 that measured vibration signals contain some random noise, and simple time-domain analysis is not suitable for unbalance detection.
Section 5 includes the results of the applied analyses, as well as discussion of FFT analysis of the vibration acceleration (Section 5.1), bispectrum analysis (Section 5.2), full-spectrum analysis (Section 5.3) and orbit shape analysis (Section 5.4). Comprehensive comparison of the effectiveness of the tested methods in unbalance detection is presented in Section 6.

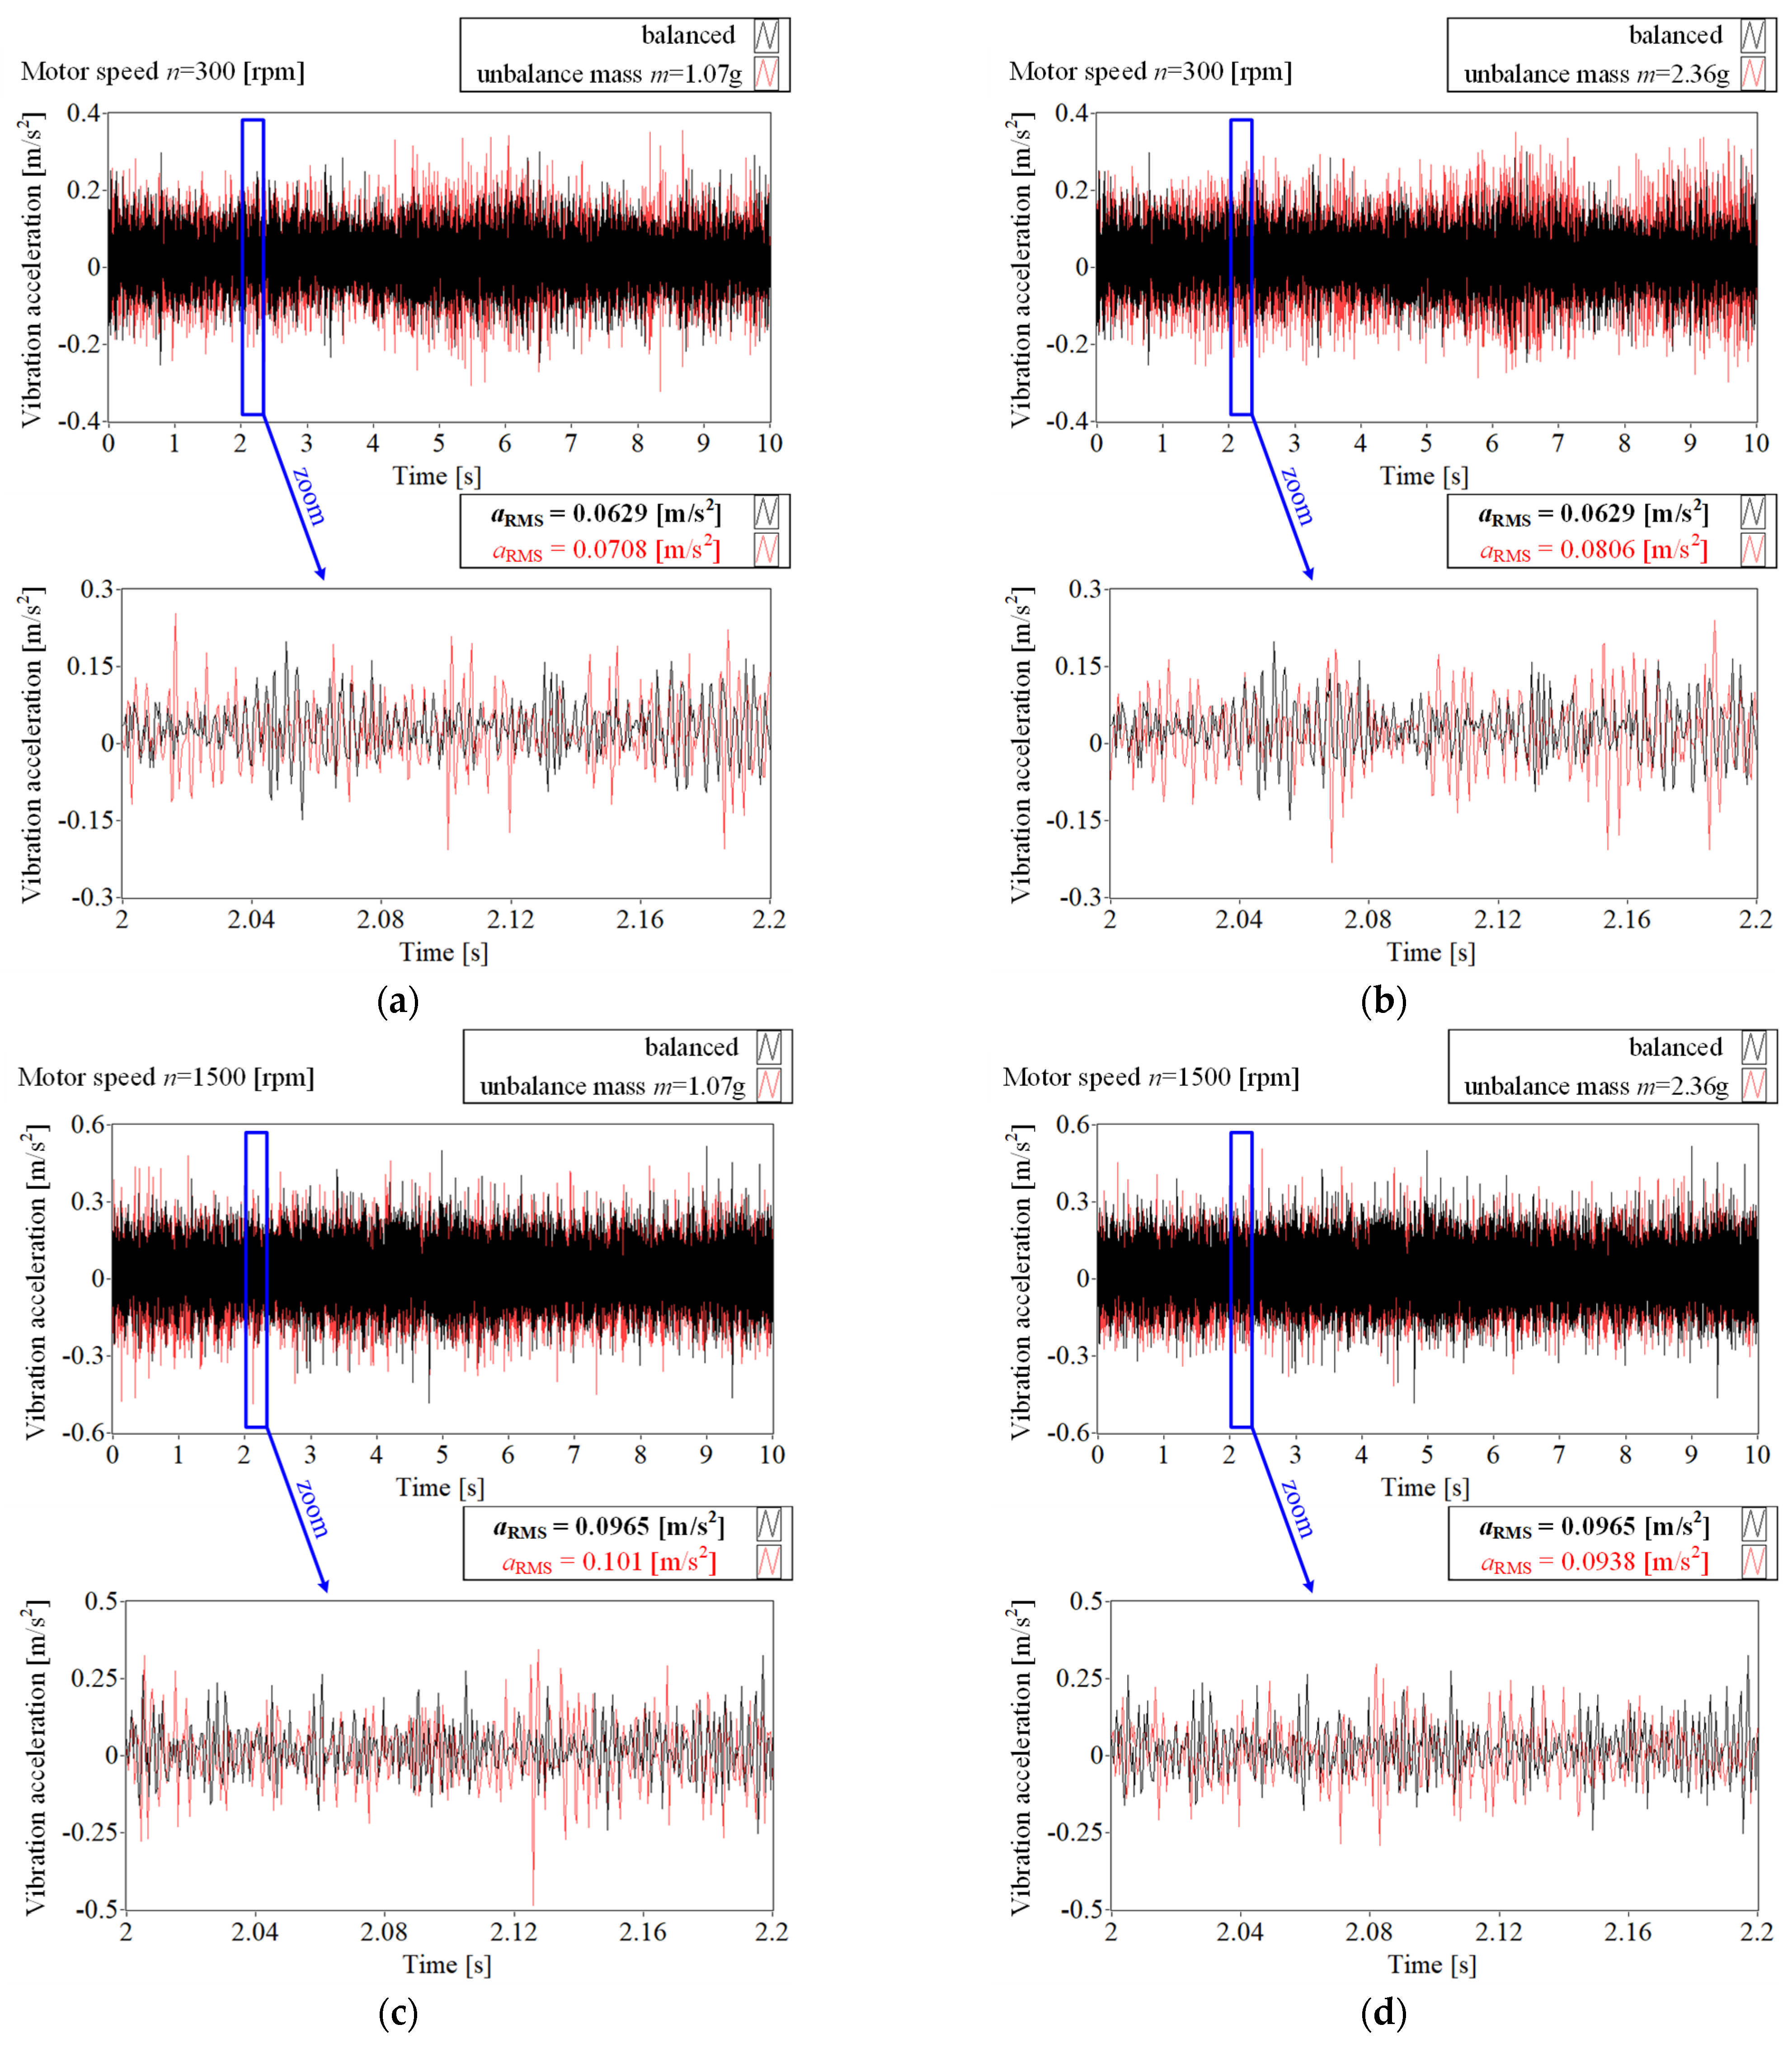
5. Analysis of Experimental Research Results

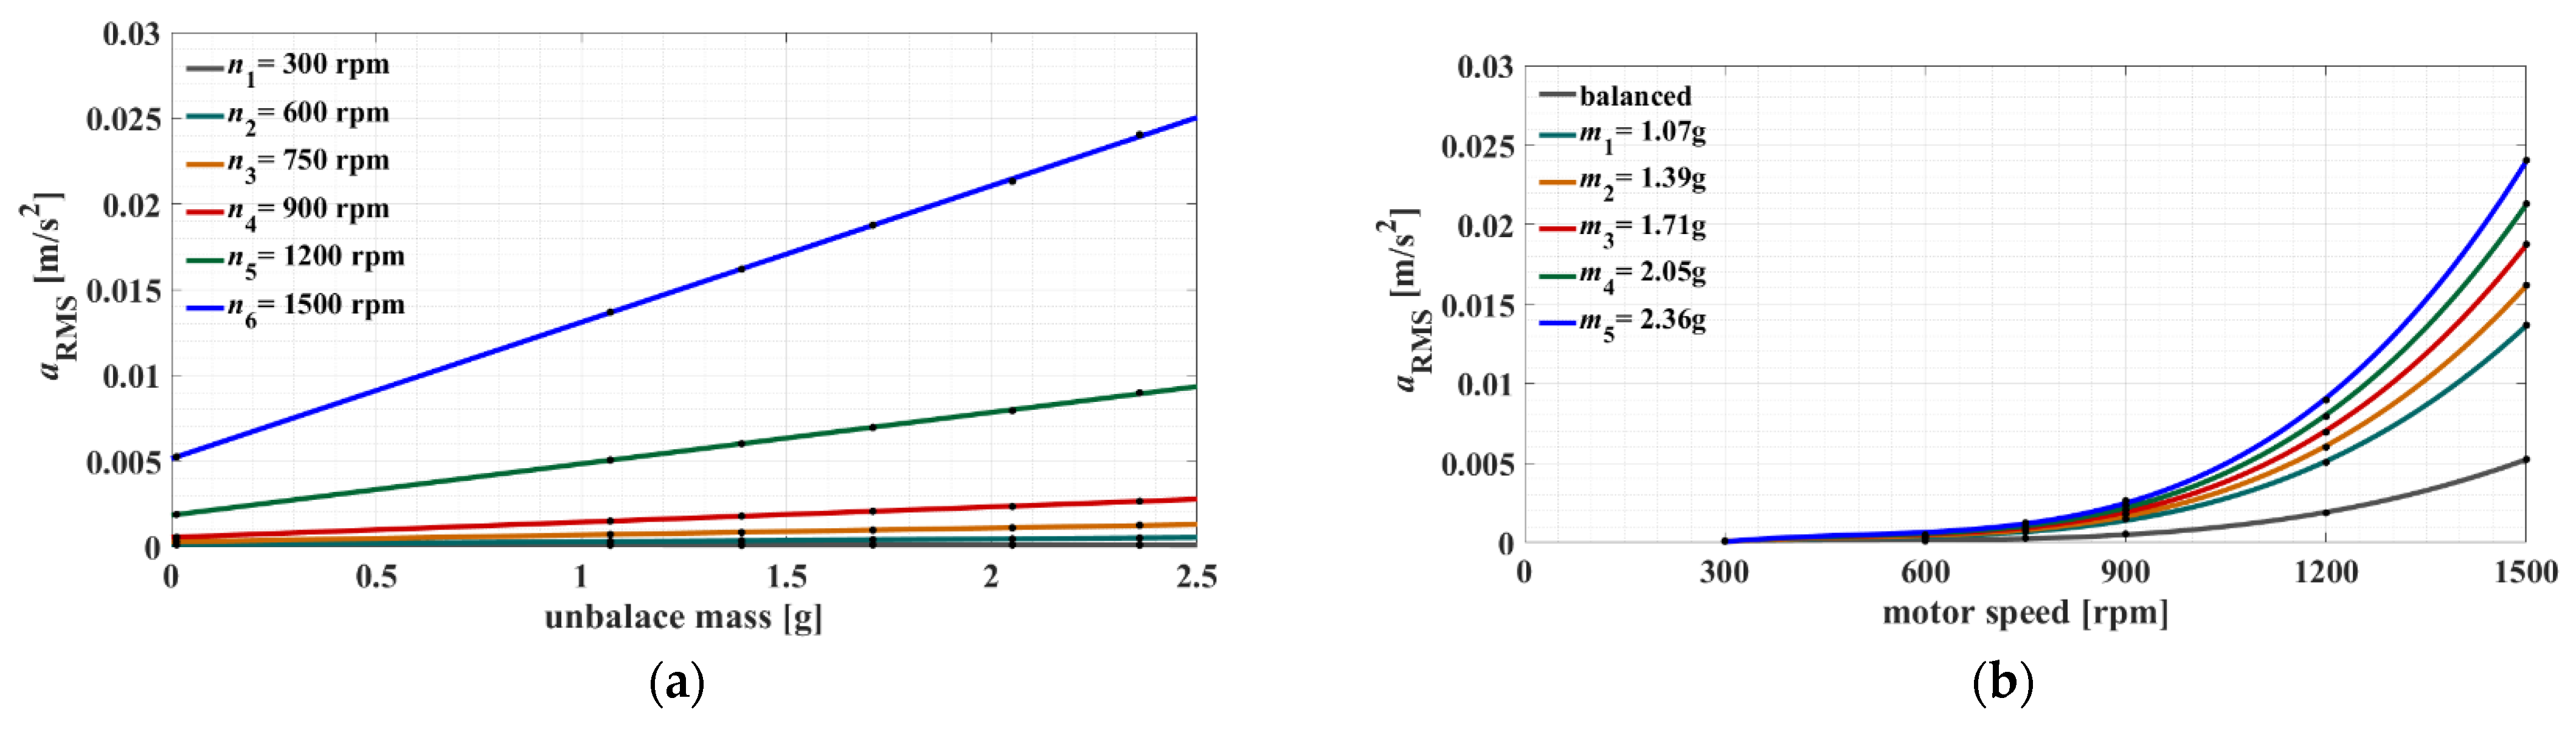
5.1. Fast Fourier Transform Analysis

FFT analysis was conducted using the Hann window, which is a compromise between the dynamics (accuracy of amplitude mapping) and spectrum resolution. Rotor unbalance influences the change in the value of the harmonic amplitude with a frequency of 1fr (fault symptom). Figure 7 presents the mechanical vibration spectra in a radial direction. The analysed frequency, 1fr, is clearly visible, even at low rotational speeds. No additional vibration frequency components around the analysed frequency, 1fr, influence either the correct identification of fault symptom frequency or the correct readout of its amplitude, which increases assessment efficiency of the machine condition.
The analysis of changes of the symptom amplitude, 1fr, both as a function of unbalance mass, mn, and rotational speed, n, is presented in Figure 8. A change in mass results in a linear increase in the harmonic amplitude with the frequency, 1fr (Figure 8a), whereas rotor speed change leads to an approximately exponential increase in the amplitude of the fault symptom, 1fr (Figure 8b).

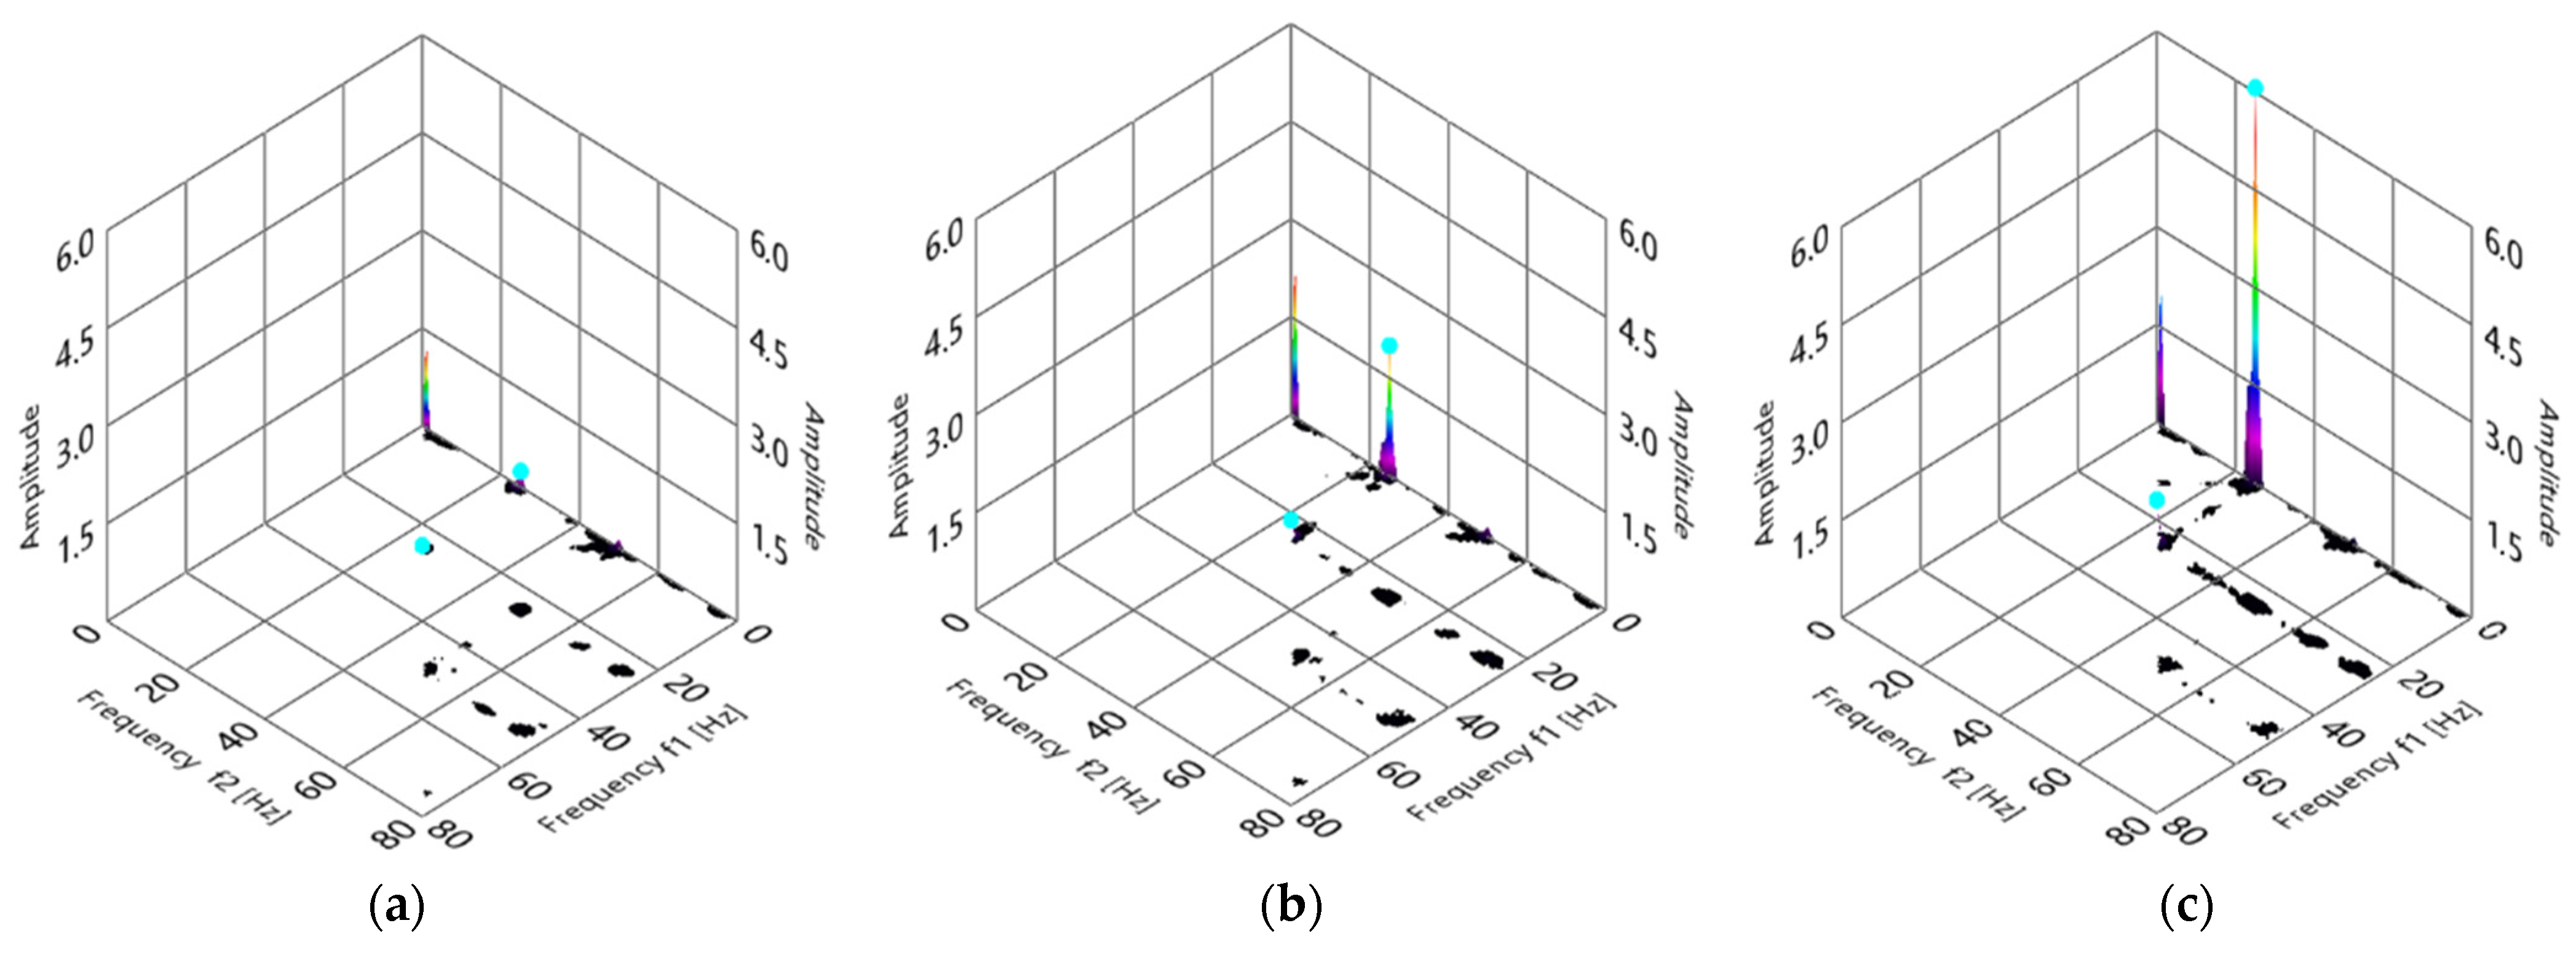
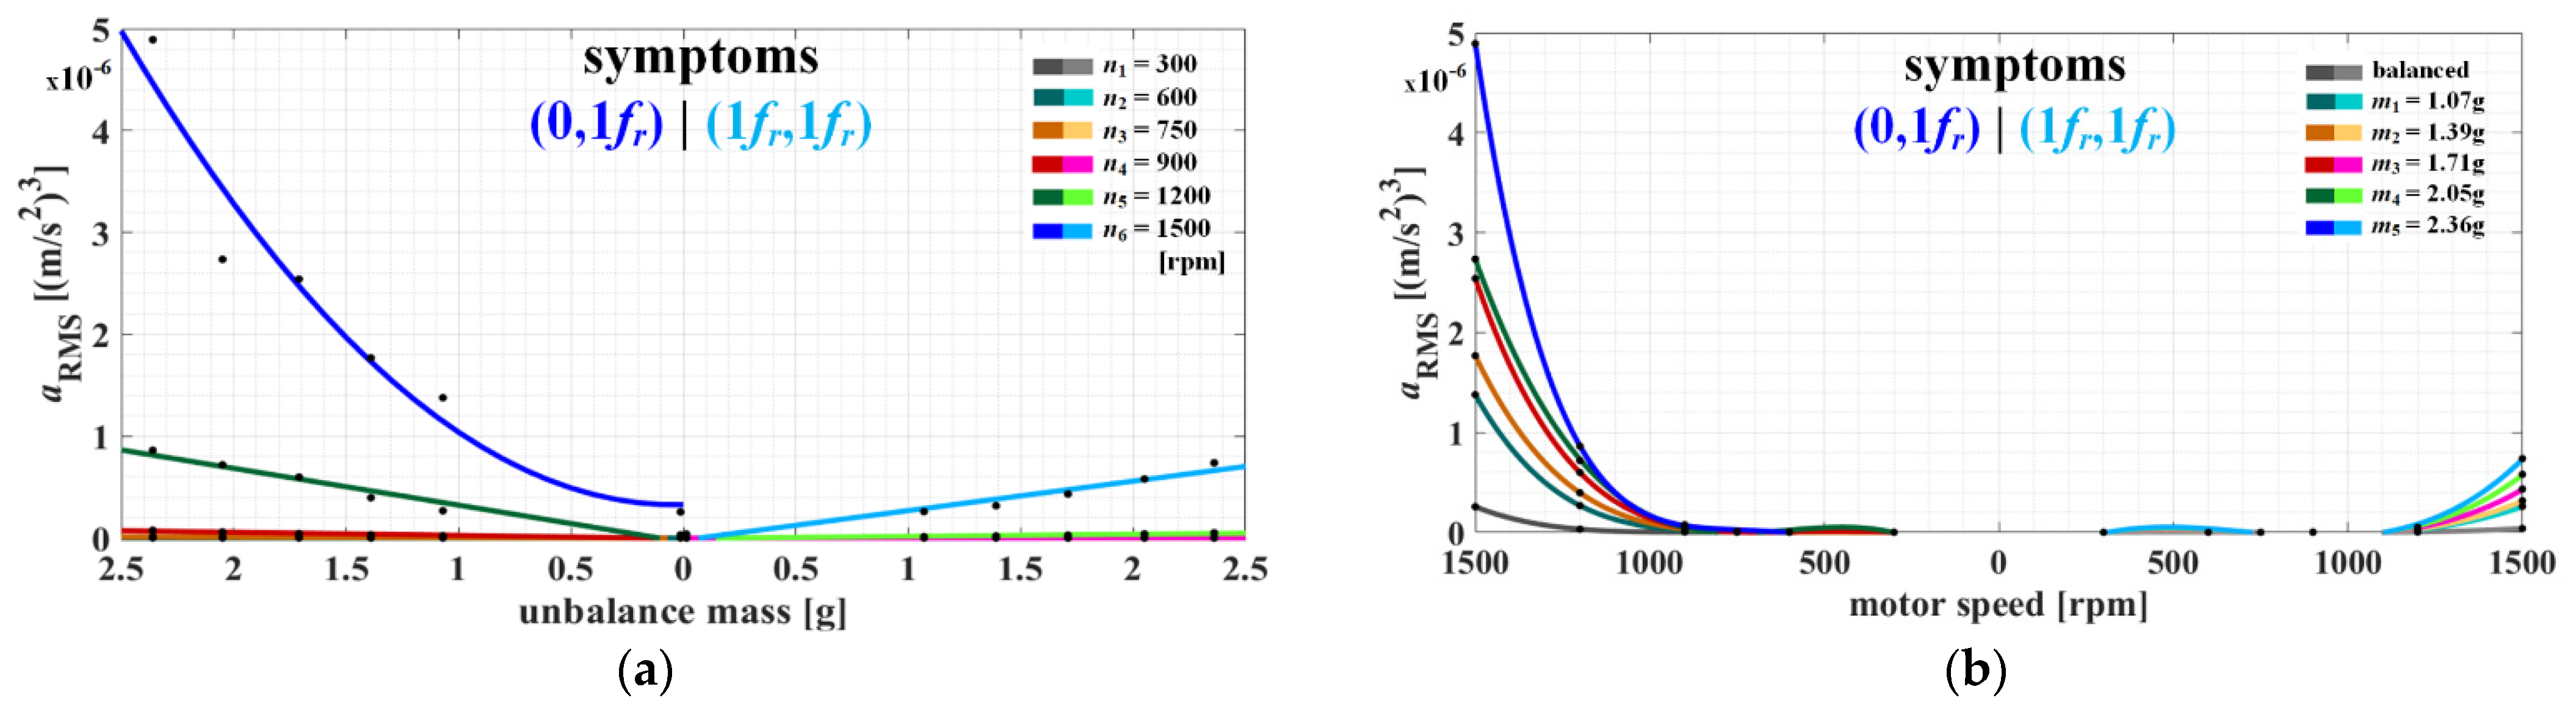
5.2. Bispectrum Analysis

The unbalance symptom in a PMSM drive is the harmonic with the first rotational speed (1fr). This is why two components, (0,1fr) and (1fr,1fr), are analysed in the BS spectrum, and a change in the order of arguments does not influence the result of BS analysis. This is also related to the possibility of limiting the BS analysis to the principal domain (see Figure 1).
Figure 9 presents the three-dimensional BS spectra for the changes of tested unbalance mass, mn. The unbalance symptoms are marked with a blue dot in the spectra. For the nominal speed, these are frequency pairs of (0,25) Hz and (25,25) Hz. The BS spectra are demonstrated in a linear scale, where the amplitude value unit is (m/s2)3, and the obtained results should be multiplied by 10−6. In the comparison of the spectra at a speed of n6 = 1500 rpm, a large change of unbalance symptom amplitudes can be observed. Even in the case of the first unbalance mass, m1 = 1.07 g (Figure 9b), a significant increase in symptom amplitude (0,1fr) is clearly visible. The presented BS spectra are characterised by a very low noise level and a lack of other frequencies, which could influence the analysed unbalance symptoms. As a result, the analysed spectrum quality is not reduced, even at low rotational speeds.
A detailed analysis is shown in Figure 10, where the values of symptom amplitudes (0,1fr) are represented by darker shades (left) and (1fr,1fr) are represented by lighter shades (right) for the measurement of mechanical vibration in the radial direction. The unbalance mass change leads to a linear increase in unbalance symptoms; however, one exception is observed for the nominal speed, in which the character of symptom (0,1fr) change is exponential (Figure 10a). A change in rotational speed, n, results in an exponential increase in amplitude values for each tested unbalance mass. The increase is visible from a speed of approximately 1000 rpm.

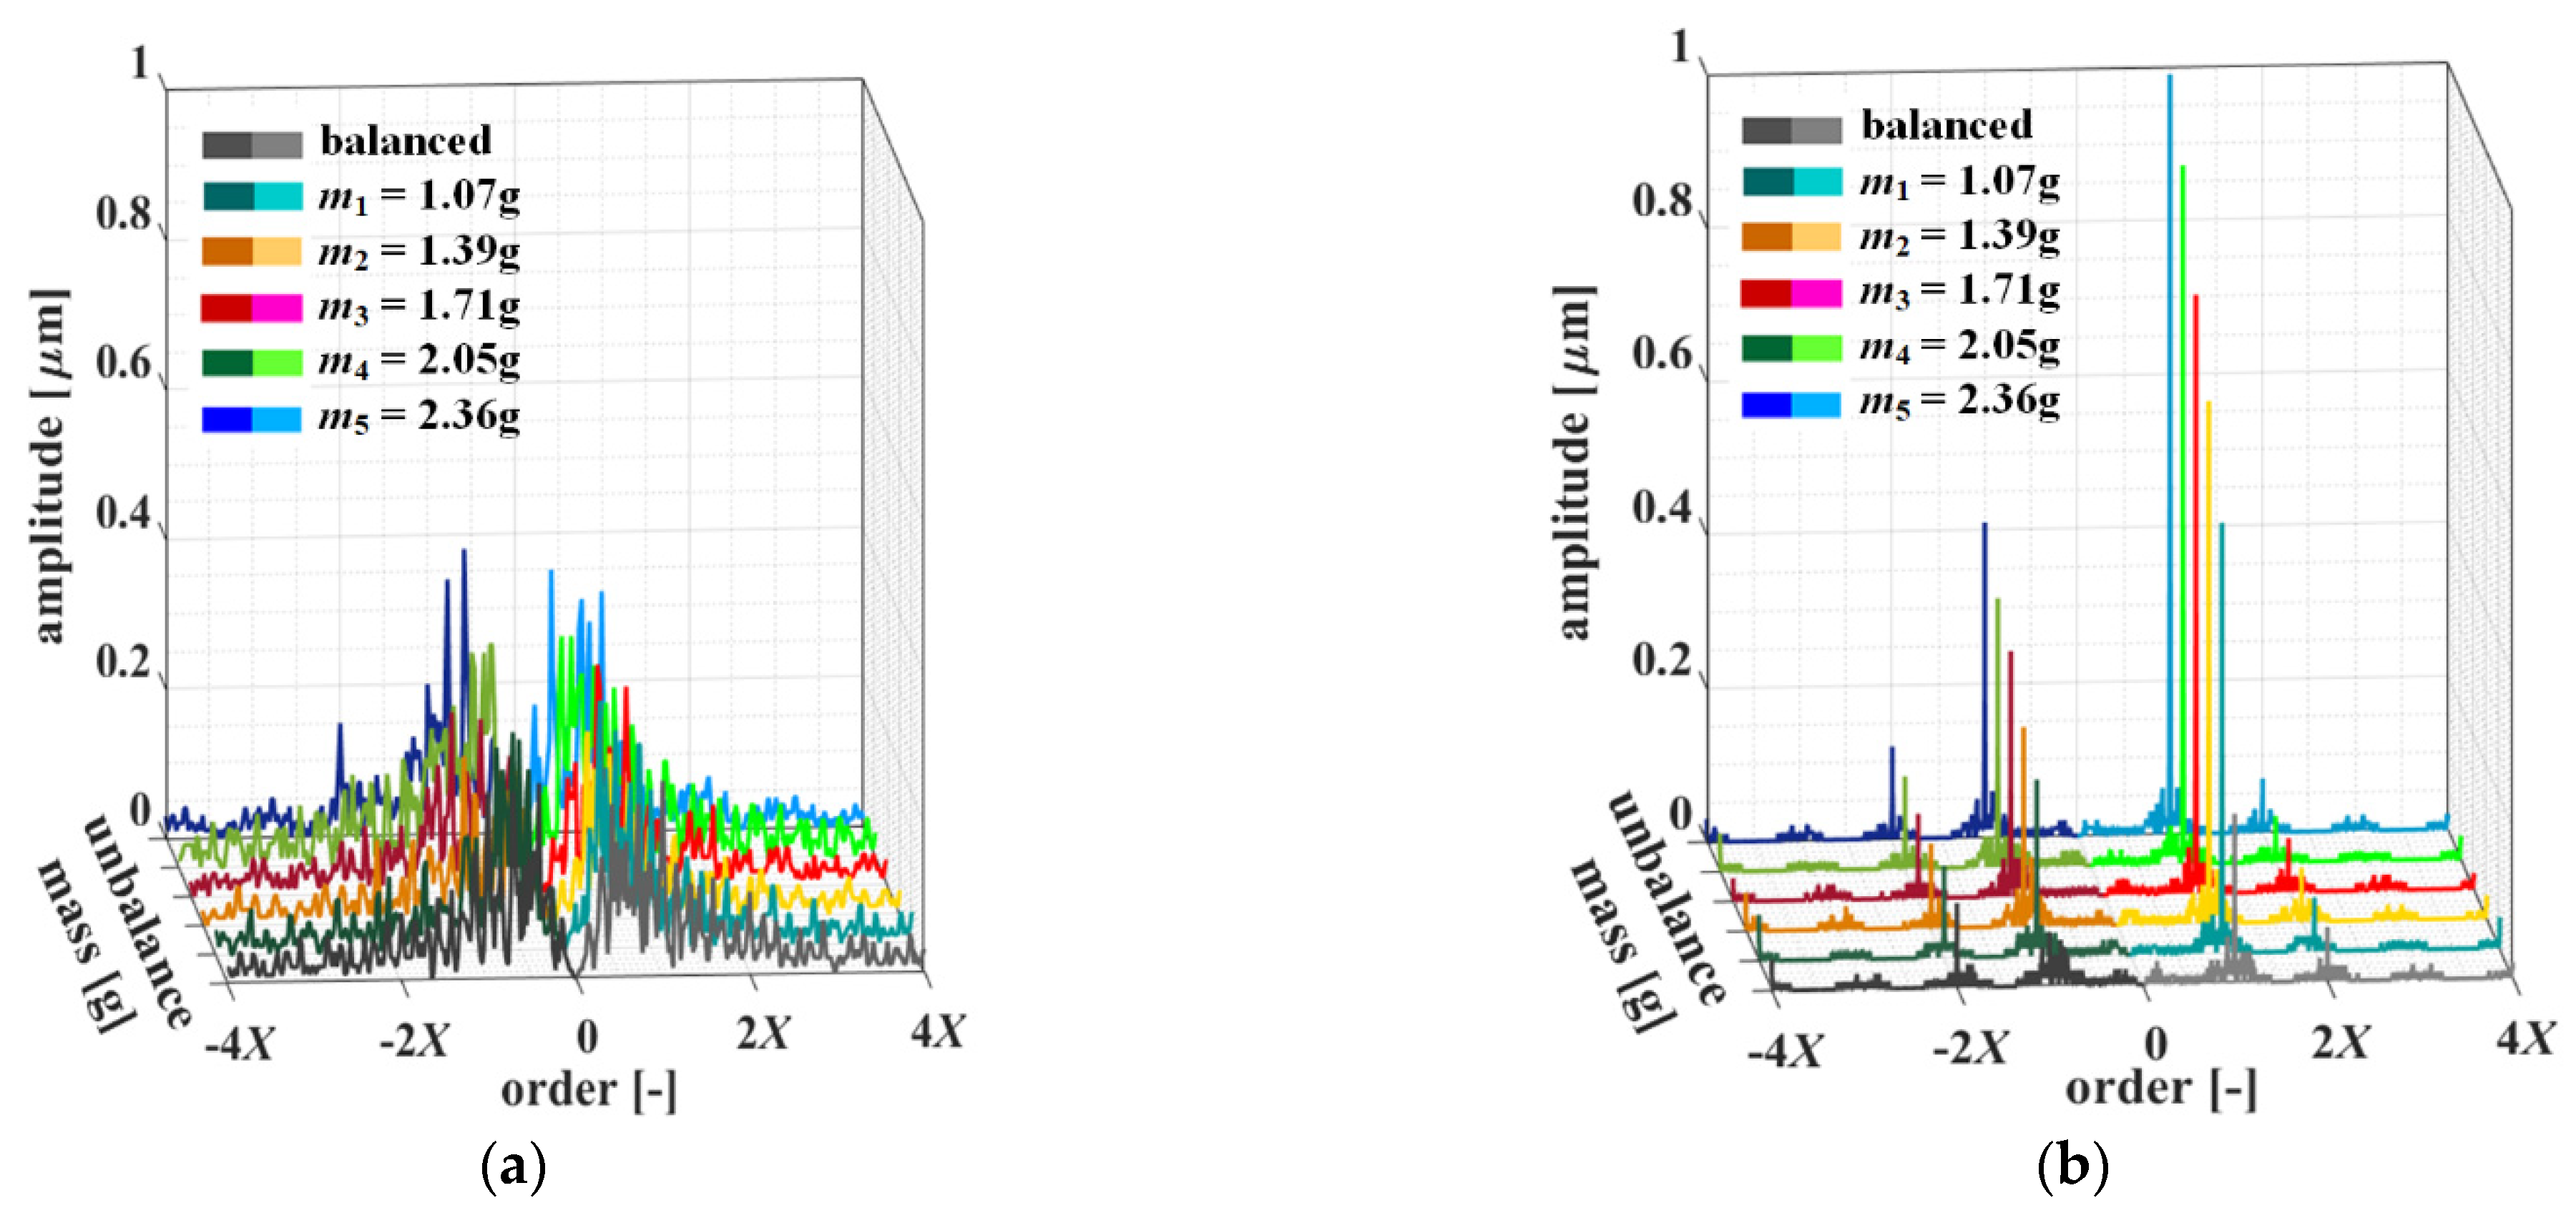
5.3. Full-Spectrum Analysis

The FS analysis spectra are presented for two rotational speeds in Figure 11. The spectrum for the speed n6 = 1500 rpm (Figure 11b) is characterised by a resolution of Δn = 0.04[−]. This value ensures good visibility of speed order lines. In the case of a lower rotational speed, e.g., n1 = 300 rpm (Figure 11a), spectrum resolution is at a level of Δn = 0.2[−]. This resolution value is too low to correctly map spectral lines occurring in the spectrum. Additionally, such a low rotational speed generates small centrifugal force interacting with the unbalance mass, and as a consequence, the unbalance effect is not visible in the spectrum for the order 1X. In the case of speed n6 (Figure 11b), two components of the order of −1X and 1X in are clearly visible in the spectrum. Further analysis was focused on these two components corresponding with backward (−1X) and forward (1X) precession of the rotor rotation direction.
A detailed analysis of the amplitude changes of components −1X and 1X is presented in Figure 12. In this figure, the amplitude values for the component −1X are marked with darker shades (left) and those for component +1X are marked with lighter shades (right). Mass changes lead to a linear increase in the unbalance symptom amplitudes (Figure 12a), whereas speed changes result in an approximately exponential increase in their amplitudes (Figure 12b).

5.4. Orbit Shape Analysis

In this analysis, the inter-peak values, Ap-p, of mechanical vibration displacement were measured [22]. The results of the experimental research showed that for rotational speeds of 750 rpm or lower, analysis of orbit shape is impossible (Figure 13). Strong orbit deformations can be observed in the figures as a result of the mechanical vibration signals recorded for the discussed rotational speeds characterised by low resolution and high noise content, as well as vibration in the low-frequency band. As a consequence of the fact that the orbits for low rotational speeds of the rotor are deformed, measurement of the inter-peak value of displacement does not reflect the actual state; hence, a detailed analysis was performed for higher values of rotational speed (Figure 13).
The orbits for the rotor rotational speeds of 900—1500 rpm with various unbalance masses are presented in Figure 14. The balanced state of the motor is marked in black, unbalance with mass m1 is marked in green and unbalance with mass m5 is marked in blue. Rotor unbalance caused orbit deformations along the X axis. The higher the unbalance value, the larger the orbit deformation. A change in rotational speed influences both the orbit size and its thickness. For a speed of 900 rpm (Figure 14a), the orbit diameter is smaller and its thickness is higher in comparison with the orbits plotted for a speed of 1500 rpm (Figure 14c). The orbits for a speed of 1200 rpm (Figure 14b) confirm this change trend.
A detailed analysis of the changes in the inter-peak value of displacement, Ap-p, of the rotor axis is shown in Figure 15. The changes of the unbalance mass result in a linear increase in index Ap-p; the changes are larger for higher rotor rotational speeds. The average rate of change of the discussed symptom Ap-p, with regard to the unbalance mass, is 15% for a speed of 1500 rpm and 10% for a speed of 900 rpm.

6. Comprehensive Comparison of the Effectiveness of the Tested Methods in Unbalance Detection

For the purpose of comparing the results obtained on the basis of the analyses presented in Section 5, an effectiveness factor, S, was introduced. This effectiveness was defined as the ratio of the symptom amplitude for the case of an unbalanced system (suitable additional mass fixed on the shield) to the amplitude of this symptom in the balanced system:
S = A s U A s B ,
where S is the symptom of effectiveness for a given analysis, ASu is the symptom amplitude of the unbalanced system and AsB is the symptom amplitude of the balanced system.
The comparative results for all four analysed methods are presented in Figure 16. The BS analysis shows the greatest effectiveness with respect to failure occurrence, as the observed S factor value increases from 6 to 24 for the tested range of the unbalance mass. It should be noted that both symptoms, (0,1fr) and (1fr,1fr), show similar effectiveness for the nominal speed (Figure 16b), as well as for the lower rotational speed of 900 rpm (Figure 16a). Attention should be paid to the exponential increase in the effectiveness factor with increased degree of unbalance for this method. The effectiveness of the remaining analyses is much less satisfactory, and for lower motor speeds, these values change almost linearly in the range from 2 to 4. Although the values of symptoms Ap-p and 1X related to mechanical vibration displacement are small, taking into account the fact that the range of variation of the unbalance mass was very small (from 1.07 to 2.36 g), in some cases, these symptoms can be also used to detect unbalance. The general features of the methods discussed in this paper are presented in the Table 1.

7. Summary

In this paper, we present and compare the efficiency of four mechanical vibration signal processing methods applied for the diagnosis of rotor unbalance in a PMSM drive system. In the case of stationary signal analysis and the possibility of using more advanced computational equipment, the higher-order frequency method (bispectrum) is recommended. It should be also highlighted that the measurement period required for unbalance level detection using BS analysis is much shorter than, e.g., in the case of FFT analysis.
When a triple-axis sensor is mounted at an appropriate place on the motor, two directions of mechanical vibration can be analysed simultaneously, resulting in four symptoms indicating the occurrence of unbalance. However, if the calculation algorithm is supposed to be fast, simple and easy to implement, orbit analysis can be used. However, it must be noted that it is necessary to mount two single-axis sensors fixed on a machine body at an angle of 90° relative to one another. In a situation when the rotational speed of the PMSM drive is to be continuously changed and the analysis is to be carried out in real time, the best solution seems to be the order analysis method. However, full-spectrum analysis is limited in its application in the case of low-speed drives.
In summary, the selection of the best monitoring method for PMSM rotor unbalance detection depends on the operating conditions of the drive system, as well as available equipment. The information presented in Table 1 can be used as a starting point for choosing the best of the four analysed diagnostic methods.
Future research will be focused on the automation of the unbalance diagnostic procedure using the bispectral amplitudes or properly processed images as inputs of neural networks.

Author Contributions

Conceptualization, P.E., C.T.K. and M.J.; methodology, P.E., C.T.K. and M.J.; software, M.J.; validation, P.E. and C.T.K.; formal analysis, P.E., C.T.K. and M.J.; investigation, P.E. and M.J.; data curation, P.E. and M.J.; writing—original draft, M.J.; writing—review and editing, P.E. and C.T.K.; visualization, P.E., C.T.K. and M.J.; supervision, C.T.K.; project administration, C.T.K.; founding acquisition, C.T.K. All authors have read and agreed to the published version of the manuscript.

Funding

This research was supported by the National Science Centre of Poland under grant number 2017/27/B/ST7/00816.

Data Availability Statement

Not applicable.

Conflicts of Interest

The authors declare no conflict of interest.

Nomenclature

List of Abbreviation.
BSBispectrum
EMDEmpirical mode decomposition
FFTFast Fourier transform
FSFull spectrum
FSTFull-spectrum transform
HHTHilbert–Huang transform
HOSHigher-order spectra
IMInduction motor
OSOrbit shape
PMSMPermanent magnet synchronous motor
PSDPower spectral density
RMSRoot mean square
STFTShort-time Fourier transform
TSTrispectrum
WTWavelet transform
WVDWigner–Ville distribution

References

  1. Wang, Z.; Yang, J.; Ye, H.; Zhou, W. A Review of Permanent Magnet Synchronous Motor Fault Diagnosis. In Proceedings of the 2014 IEEE Conference and Expo Transportation Electrification Asia-Pacific (ITEC Asia-Pacific), Beijing, China, 31 August–3 September 2014. [Google Scholar] [CrossRef]
  2. Krichen, M.; Ben hadj, N.; Chaeib, M.; Neji, R. Fault Detection and Diagnosis Methods in Permanent Magnet Synchronous Machines: A Review. In Proceedings of the International Conference on Recent Advances in Electrical Systems, Hammamet, Tunisia, 22–24 December 2017. [Google Scholar]
  3. Chen, Y.; Liang, S.; Li, W.; Liang, H.; Wang, C. Faults and Diagnosis Methods of Permanent Magnet Synchronous Motors: A Review. Appl. Sci. 2019, 9, 2116. [Google Scholar] [CrossRef] [Green Version]
  4. Moosavi Anchehpoli, S.S. Analysis and Diagnosis of Faults in the PMSM Drivetrains for Series Hybrid Electrical Vehicles (SHEVs); Electric power; Université de Technologie de Belfort-Montbeliard: Sevenans, France, 2013. [Google Scholar]
  5. Gomaa, F.R.; Khader, K.M.; Eissa, M.A. Fault Diagnosis of Rotating Machinery based on vibration analysis. Int. J. Adv. Eng. Glob. Technol. 2016, 4, 1571–1586. [Google Scholar]
  6. Faiz, J.; Takbash, A.M.; Mazaheri-Tehrani, E. A Review of Application of Signal Processing Techniques for Fault Diagnosis of Induction Motors—Part I. AUT J. Electr. Eng. 2017, 49, 109–122. [Google Scholar] [CrossRef]
  7. Ribeiro Junior, R.F.; de Almeida, F.A.; Gomes, G.F. Fault classification in three-phase motors based on vibration signal analysis and artificial neural networks. Neural. Comput. Applic. 2020, 32, 15171–15189. [Google Scholar] [CrossRef]
  8. Liang, H.; Chen, Y.; Liang, S.; Wang, C. Fault Detection of Stator Inter-Turn Short-Circuit in PMSM on Stator Current and Vibration Signal. Appl. Sci. 2018, 8, 1677. [Google Scholar] [CrossRef] [Green Version]
  9. Lipus, J.; Jankovych, R.; Hammer, M.; Lipus, T. Vibration and related diagnostics of motors and generators. MM Sci. J. 2016, 2016, 1639–1642. [Google Scholar] [CrossRef]
  10. Czmochowski, J.; Moczko, P.; Odyjas, P.; Pietrusiak, D. Tests of rotary machines vibrations in steady and unsteady states on the basis of large diameter centrifugal fans. Eksploat. Niezawodn.—Maint. Reliab. 2014, 16, 211–216. [Google Scholar]
  11. Ghazali, M.H.M.; Rahiman, W. Vibration Analysis for Machine Monitoring and Diagnosis: A Systematic Review. Shock. Vib. 2021, 2021, 9469318. [Google Scholar] [CrossRef]
  12. Jardine, A.K.; Lin, D.; Banjevic, D. A review on machinery diagnostics and prognostics implementing condition-based maintenance. Mech. Syst. Signal Process. 2006, 20, 1483–1510. [Google Scholar] [CrossRef]
  13. Li, Z.; Yan, X.; Yuan, C.; Zhao, J.; Peng, Z. Fault detection and diagnosis of a gearbox in marine propulsion systems using bispectrum analysis and artificial neural networks. J. Mar. Sci. Appl. 2011, 10, 17–24. [Google Scholar] [CrossRef] [Green Version]
  14. Guoji, S.; McLaughlin, S.; Yongcheng, X.; White, P. Theoretical and experimental analysis of bispectrum of vibration signals for fault diagnosis of gears. Mech. Syst. Signal Process. 2014, 43, 76–89. [Google Scholar] [CrossRef]
  15. Yunusa-Kaltungo, A.; Sinha, J.K. Combined bispectrum and trispectrum for faults diagnosis in rotating machines. Proc. Inst. Mech. Eng. Part O J. Risk Reliab. 2014, 228, 419–428. [Google Scholar] [CrossRef]
  16. Saidi, L.; Fnaiech, F.; Henao, H.; Capolino, G.-A.; Cirrincione, G. Diagnosis of broken-bars fault in induction machines using higher order spectral analysis. ISA Trans. 2013, 52, 140–148. [Google Scholar] [CrossRef] [PubMed]
  17. Saidi, L.; Ali, J.B.; Fnaiech, F. Bi-spectrum based-EMD applied to the non-stationary vibration signals for bearing faults diagnosis. ISA Trans. 2014, 53, 1650–1660. [Google Scholar] [CrossRef]
  18. Bently, D.; Hatch, C. Fundamentals of Rotating Machinery Diagnostics; Bently Pressurized Bearing Company: Minden, NV, USA, 2002. [Google Scholar]
  19. Goldman, P.; Muszynska, A. Application of Full Spectrum to Rotating Machinery Diagnostics. Orbit 1999, 20, 17–21. [Google Scholar]
  20. Muszynska, A. Rotordynamics, 1st ed.; Taylor & Francis Group, CRC Press: Boca Raton, FL, USA, 2005. [Google Scholar] [CrossRef]
  21. Patel, T.H.; Darpe, A.K. Experimental investigations on vibration response of misaligned rotors. Mech. Syst. Signal Process. 2009, 23, 2236–2252. [Google Scholar] [CrossRef]
  22. Patel, T.H.; Darpe, A.K. Vibration response of misaligned rotors. J. Sound Vib. 2009, 325, 609–628. [Google Scholar] [CrossRef]
  23. Silva, R.R.; Costa, E.S.; Oliveira, R.; Mesquita, A. Fault diagnosis in rotating machine using full spectrum of vibration and fuzzy logic. J. Eng. Sci. Technol. 2017, 12, 2952–2964. [Google Scholar]
  24. Monte, M.; Verbelen, F.; Vervisch, B. The Use of Orbitals and Full Spectra to Identify Misalignment. In Structural Health Monitoring; Springer International Publishing: Cham, Switzerland, 2014; pp. 215–222. [Google Scholar] [CrossRef] [Green Version]
  25. Jeong, H.; Park, S.; Woo, S.; Lee, S. Rotating Machinery Diagnostics Using Deep Learning on Orbit Plot Images. Procedia Manuf. 2016, 5, 1107–1118. [Google Scholar] [CrossRef] [Green Version]
  26. Rafaq, M.S.S.; Lee, H.; Park, Y.; Lee, S.B.; Fernandez, D.; Diaz-Reigosa, D.; Briz, F. A Simple Method for Identifying Mass Unbalance using Vibration Measurement in Permanent Magnet Synchronous Motors. IEEE Trans. Ind. Electron. 2021, 69, 6441–6444. [Google Scholar] [CrossRef]
  27. Zhang, J.; Hang, J.; Cheng, M. Diagnosis of mechanical unbalance fault in permanent magnet synchronous machine drives. Electr. Power Comp. Syst. 2016, 44, 1408–1417. [Google Scholar] [CrossRef]
  28. Hang, J.; Zhang, J.; Cheng, M.; Wang, Z. Fault diagnosis of mechanical unbalance for permanent magnet synchronous motor drive system under nonstationary condition. In Proceedings of the 2013 IEEE Energy Conversion Congress and Exposition, Denver, CO, USA, 15–19 September 2013; pp. 3556–3562. [Google Scholar] [CrossRef]
  29. Park, C.H.; Lee, J.; Ahn, G.; Youn, M.; Youn, B.D. Fault detection of PMSM under non-stationary conditions based on wavelet transformation combined with distance approach. In Proceedings of the 2019 IEEE 12th International Symposium on Diagnostics for Electric Machines, Power Electronics and Drives (SDEMPED), Toulouse, France, 27–30 August 2019; pp. 88–93. [Google Scholar] [CrossRef]
  30. Corbalan, P.; Chiang, L.E. Rotor Unbalance Fault Diagnosis in Wind Turbine by Markov Chain Monte Carlo Method. Res. Sq. Platf. 2021; preprint. [Google Scholar] [CrossRef]
  31. Xie, T.; Wang, T.; He, Q.; Diallo, D.; Claramunt, C. A review of current issues of marine current turbine blade fault detection. Ocean. Eng. 2020, 218, 108194. [Google Scholar] [CrossRef]
  32. Yinquan, Y. Fault Diagnosis of Permanent Magnet Synchronous Motor Based on Mechanical and Magnetic Characteristic Analysis. Ph.D. Thesis, Department of Electrical and Computer Engineering, National University of Singapore, Singapore, 2014. [Google Scholar]
  33. Ewert, P.; Jaworski, M. Application of selected higher-order methods to detect rotor unbalance of drive system with PMSM. In Proceedings of the 2021 IEEE 19th International Power Electronics and Motion Control Conference (PEMC), Gliwice, Poland, 25–29 April 2021; pp. 874–879. [Google Scholar] [CrossRef]
  34. Smith, S.W. Digital Signal Processing: A Practical Guide for Engineers and Scientists; Elsevier Science: Burlington, VT, USA, 2002. [Google Scholar] [CrossRef]
  35. Mendel, J.M. Tutorial on Higher-Order Statistic (Spectra) in Signal Processing and System Theory: Theoretical Results and Some Applications. Proc. IEEE 1991, 79, 278–305. [Google Scholar] [CrossRef]
  36. Nikias, C.L.; Petropulu, A. Higher-Order Spectra Analysis: A Nonlinear Signal Processing Framework; Prentice-Hall: Hoboken, NJ, USA, 1993. [Google Scholar]
  37. Piñeyro, J.; Klempnow, A.; Lescano, J. Effectiveness of new spectral tools in the anomaly detection of rolling element bearings. J. Alloy. Compd. 2000, 310, 276–279. [Google Scholar] [CrossRef]
  38. Matsuoka, T.; Ulrych, T.J. Phase estimation using the bispectrum. Proc. IEEE 1984, 72, 1403–1411. [Google Scholar] [CrossRef]
Figure 1. Regions of symmetry of BS transform (region I area—principal domain).
Electronics 11 01748 g001
Figure 2. Full-spectrum construction model.
Electronics 11 01748 g002
Figure 3. Schematic presentation of full-spectrum calculation.
Electronics 11 01748 g003
Figure 4. Orbit construction.
Electronics 11 01748 g004
Figure 5. Scheme of PMSM rotor unbalance tests (a) photo of the experimental setup (b).
Electronics 11 01748 g005
Figure 6. Samples of experimental measurements of mechanical vibrations for tested the PMSM drive at different motor speeds and unbalance masses: (a,c) m1 = 1.07 g; (b,d) m5 = 2.36 g; (a,b) n = 300 rpm; (c,d) n = 1500 rpm.
Electronics 11 01748 g006
Figure 7. Spectra of mechanical vibration acceleration as a function of rotational speed change, n, for unbalance mass, m5.
Electronics 11 01748 g007
Figure 8. Symptom 1fr of mechanical vibration acceleration in the radial direction as a function of changes in unbalance mass, mn, (a) and rotational speed, n (b).
Electronics 11 01748 g008
Figure 9. Mechanical vibration BS spectra for a rotational speed of n6 = 1500 rpm with unbalance mass changes: balanced drive (a); m1 = 1.07 g (b); m5 = 2.36 g (c) (amplitude should be multiplied by 10−6).
Electronics 11 01748 g009
Figure 10. Symptoms (0,1fr) and (1fr,1fr) of mechanical vibration acceleration in bispectrum analysis as a function of unbalance mass changes, mn (a), and rotational speed, n (b).
Electronics 11 01748 g010
Figure 11. Spectra of FS analysis as a function of unbalance mass, mn, for speeds n1 = 300 rpm (a) and n6 = 1500 rpm (b).
Electronics 11 01748 g011
Figure 12. Backward (−1X) and forward (+1X) precession symptoms of rotor axis displacement as a function of changes of unbalance mass, mn (a), and rotational speed, n (b).
Electronics 11 01748 g012
Figure 13. Sample orbits recorded for an unbalance mass of m4 = 2.05 g and for a speed of 300 rpm (a), 600 rpm (b) and 750 rpm (c).
Electronics 11 01748 g013
Figure 14. Sample orbits recorded for speeds of 900 rpm (a), 1200 rpm (b) and 1500 rpm (c) with changing unbalance mass.
Electronics 11 01748 g014
Figure 15. Changes of inter-peak value, Ap-p, of vibration displacement as a function of unbalance mass for various rotor rotational speeds.
Electronics 11 01748 g015
Figure 16. Effectiveness symptom as a function of unbalance mass changes: speed n4 = 900 rpm (a); speed n6 = 1500 rpm (b).
Electronics 11 01748 g016
Table 1. Comparison of properties of methods used for diagnosis of PMSM unbalance.
FeatureMethod
FFTBSOSFS
Symptom1fr(0,1fr); (1fr,1fr)Ap–p1X
Effectiveness2.5 ÷ 4.56 ÷ 202.5 ÷ 42.5 ÷ 4.5
Computational complexityLowHighLowHigh
Total number of signals1123
ProcessStationaryStationaryStationaryNon-stationary
Signal recording time10 s1 s1 revolution1 revolution
Constraintn > 900 rpmn > 750 rpm
Publisher’s Note: MDPI stays neutral with regard to jurisdictional claims in published maps and institutional affiliations.

