Article

High-Reliability Underwater Acoustic Communication Using an M-ary Cyclic Spread Spectrum

Department of Radio Communication Engineering, Korea Maritime and Ocean University, 727 Taejong-ro, Yeongdo-gu, Busan 49112, Korea
*
Author to whom correspondence should be addressed.
Electronics 2022, 11(11), 1698; https://doi.org/10.3390/electronics11111698
Submission received: 11 April 2022 / Revised: 25 May 2022 / Accepted: 25 May 2022 / Published: 26 May 2022

Abstract

:
Multipath propagation, frequency selective fading, low-propagation velocity, and narrow bandwidth are all characteristics of underwater acoustic channels. Doppler shifts and diffusions can occur as a result of the low transmission speed of an acoustic signal, which can be caused by the movement of ocean currents or the transceiver. Furthermore, frequency selective fading and excessive noise interference can disrupt underwater acoustic communication on a continual basis. Because of its high anti-interference ability and high confidentiality, spread spectrum technology is commonly adopted in underwater acoustic communications. Although the direct sequence spread spectrum method has a low data rate, it is advantageous in a multipath propagation channel environment or an environment with a low signal-to-noise ratio (SNR). This advantage is suitable for long-distance transmission or LPD (Low Probability of Detection) communication, and the direct sequence spread spectrum method is applied. In this paper, we propose a highly reliable M-ary cyclic spread spectrum technique by superimposing the M-ary spread spectrum, an extension of the direct sequence spread spectrum technique, and cyclic shift keying. Furthermore, by estimating the Doppler frequency using M-ary spread spectrum codes and performing synchronization correction of the ensuing symbol based on the estimation results, higher performance can be attained. Simulations and experiments showed that the M-ary cyclic spread spectrum method can reduce Doppler estimation and synchronization error accumulation while maintaining a high data rate. Furthermore, the MCSS method had a lower bit error rate than the standard spread spectrum method.

1. Introduction

Underwater acoustic (UWA) communication is a critical tool for gathering data for marine environmental monitoring and scientific research as well as for military purposes [1]. UWA communication technology has been the sole technique used to achieve long-distance underwater communication until now. Underwater radio transmission, on the other hand, is more complicated and challenging than terrestrial radio transmission. Multipath propagation, frequency selective fading, low-propagation velocity, and restricted bandwidth are all characteristic of underwater acoustic channels [2]. The low-propagation velocity of the acoustic signal, as well as the movement of the transceiver and ocean currents, can cause Doppler shifts and spread. Furthermore, frequency selective fading and excessive noise interference can continuously disrupt underwater acoustic communication. Spread spectrum communication was first used for military purposes and is a method of spreading and transmitting a broadband signal to generate a robust signal in an environment with a low signal-to-noise ratio (SNR) [3,4]. Direct sequence, time hopping, and frequency hopping are examples of communication systems that use the spread spectrum methodology [5,6,7]. The direct sequence spread spectrum (DSSS) method, in particular, hides the signal in background noise, inhibits eavesdropping, and can help with multipath transmission issues. Long-range underwater communication was carried out utilizing a single carrier in DSSS transmission [8,9,10,11,12,13], and sea trials were carried out using a multicarrier spread spectrum [14].
However, because of the spreading process, the transmission speed is decreased, and the packet length is increased; as a result, Doppler spreading can have a significant impact. Because considerable information can be carried in a symbol, conventional cyclic shift keying (CSK) is suitable for a channel with a short coherence time at a high transmission rate to compensate for the decrease in the transmission rate [15,16]. Jing et al. proposed a method combining orthogonal frequency division multiplexing (OFDM) and CSK for underwater acoustic communication and exhibited its performance through a simulation based on a representative study linked to the CSK method for underwater acoustic communication [17]. The sequence overlapped and demodulated through the position of the peak and was demonstrated through sea trials, in addition to the method of creating orthogonality of codes by cyclic shifting [18,19]. The M-ary spread spectrum (MSS) approach, which enhances transmission efficiency by using multiple orthogonal sequences instead of cycling a sequence such as the CSK method, is another method that can improve transmission efficiency [20,21]. In addition, by combining these two methods, there is an M-ary cyclic shift keying (MCSK) method, which is a method for putting additional information into one symbol by the cyclic shifting of a sequence having orthogonality in common. The MCSK transmission scheme combines the orthogonality of MSS and CSK to transmit more information in one symbol. Therefore, it is possible to minimize the time that a communication signal occupies a channel and is less affected by an underwater channel having a short coherence time. [20].
This paper proposes an M-ary cyclic spread spectrum (MCSS) method that combines MSS and MCSK. The MSS method has the advantage of tracking Doppler per symbol [22], and the CSK method has an advantage in the underwater communication channel with a short coherence time by transmitting more information in one symbol [18,19,23]. An MSS system-based receiver processing method for tracking the Doppler factor for each symbol as well as a method for reducing the amount of computation are presented. Because using a Doppler bank requires a significant amount of computation, the maximum range of Doppler is calculated using the peak position of the MSS correlation characteristic and CSK’s shifted correlation characteristic to save computation time and improve accuracy. We recommend employing a Doppler bank within the maximum range of the Doppler to compensate for detailed Doppler. An artificial Doppler shift was generated, and a simulation was implemented to compare the performance. The doppler frequency was estimated in the passband per symbol for MSS and MCSS signals. In the case of the CSK and MCSK signals, the Doppler frequency was measured at the preamble part and then the phase was compensated in the baseband using a phase-locked loop (PLL) [24].
Section 2 explains the principle of the proposed method and the Doppler compensation mechanism in the receiver. Section 3 replicates the proposed and existing approaches and compares the results using SNR. The proposed method’s performance in sea trials is described in Section 4, and the results are shown. Section 5 provides the conclusion.

2. Proposed Method

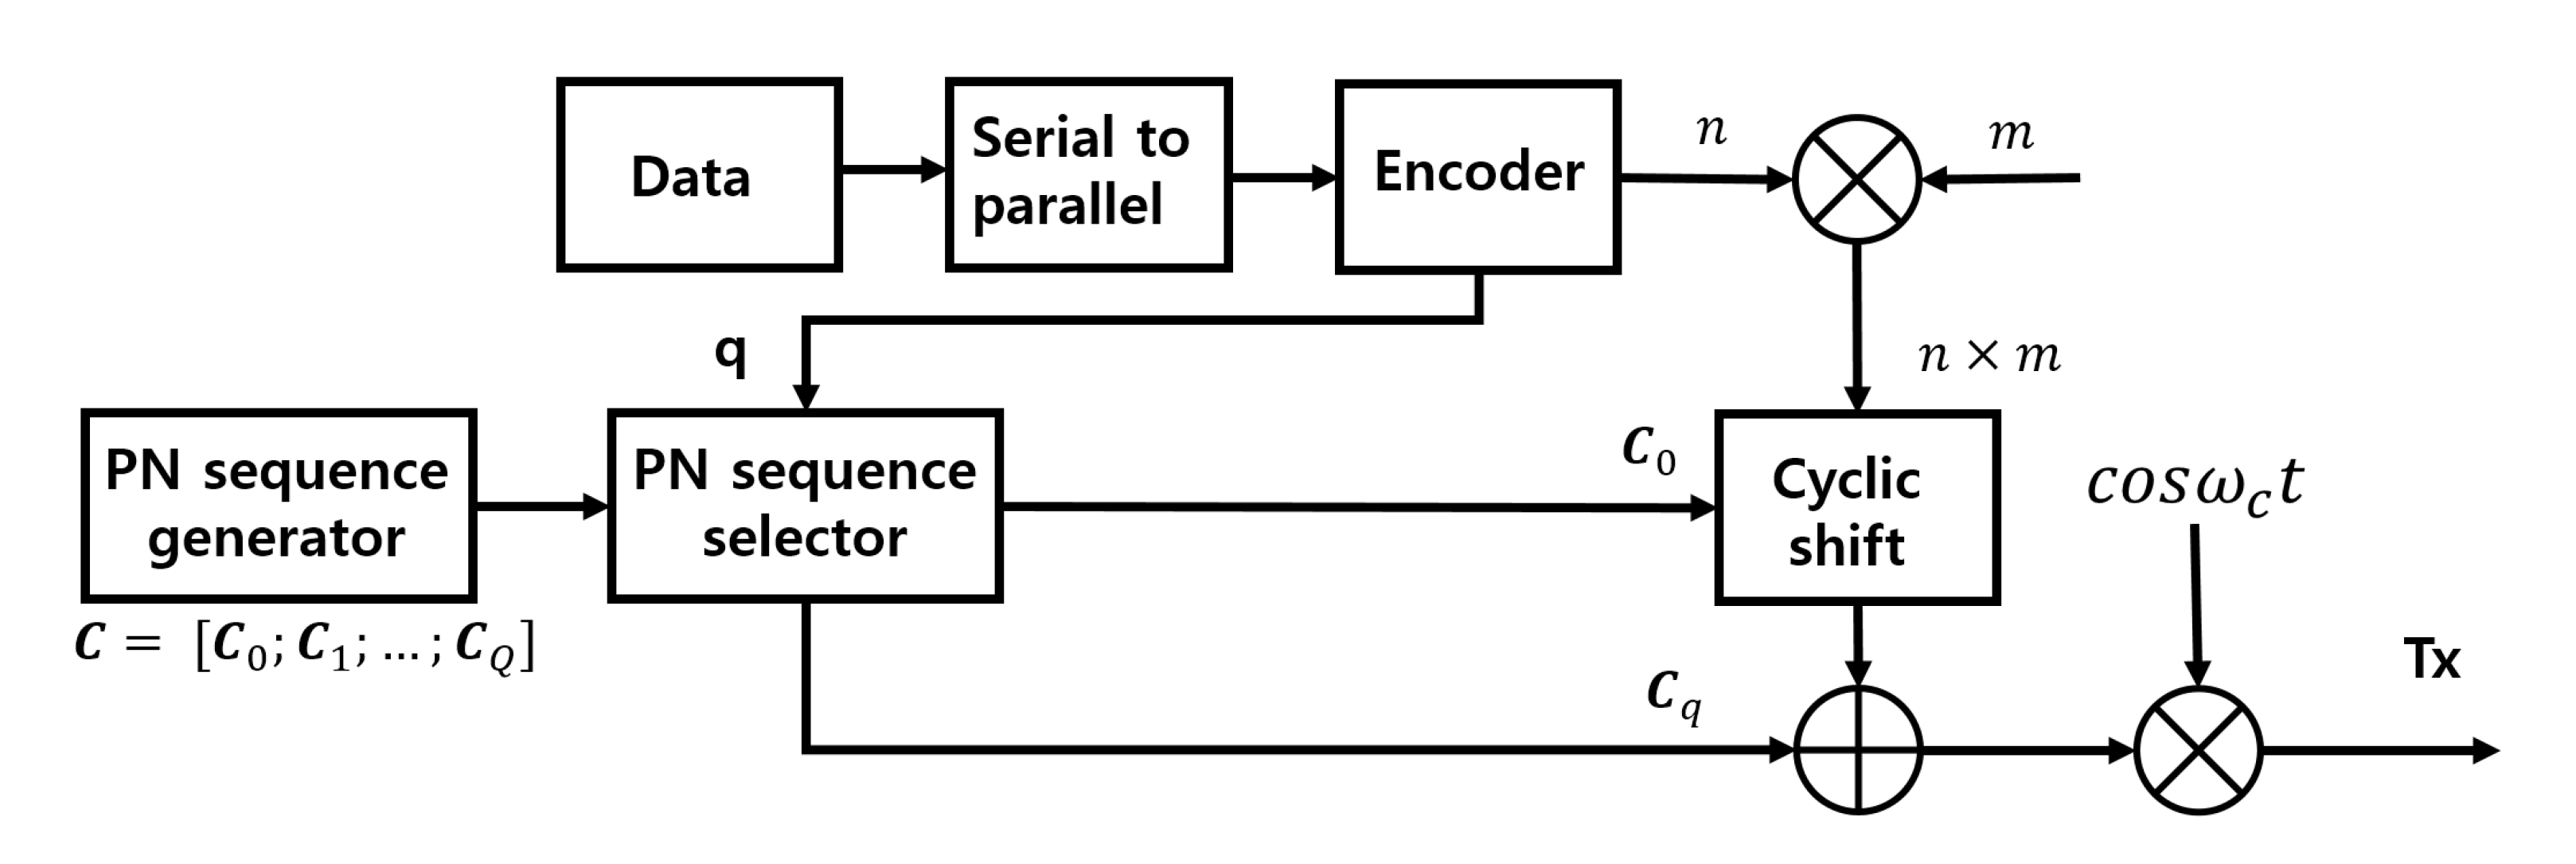
2.1. Principle of MCSS

Each symbol in the M-ary Spread Spectrum (MSS) group of pseudorandom codes can represent M bits and has a quantity of Q ( Q = 2 M ). Cyclic Shift Keying (CSK) is a communication method in which the pseudonoise (PN) sequence is cyclic shifted and the shifted information is demodulated through the peak. Depending on the amount of cyclic shift, the bit that can be expressed is defined. For example, a cyclic shift of 2 N is required to represent N bits [25]. However, since demodulation is performed through the peak position, it is highly prone to Doppler spread. Both are much more efficient in transmitting data than the conventional direct sequence spread spectrum. Via MSS communication, we can express M bits, N bits with CSK communication, and (M + N) bits in a single symbol. As a result, we transmit MSS with Q PN sequences and CSK with 1 PN sequence, resulting in Q   + 1 PN sequences. We created a very long PN sequence ( 2 k 1 , where k is a very large constant) and then cut it to the appropriate length, then used it to generate the Q   + 1 PN sequence. The very long PN sequence is expressed as:
c P N = c 1 , c 2 ,     c 2 k 1 .
C q , l = c P N l + L × q q 0 ,     Q ,         l 1 ,     L
where C is the q × L matrix and L is the length of a PN sequence used for one symbol. The first row in the C matrix is C 0 ; 1 , , C 0 ; l and is expressed as C 0 . As a result, the C matrix has the form [ C 0 ; C 1 ;   ;   C Q ].
One of the most significant advantages of MSS is that these multiple code sequences are suitable for communication with a low probability of intercept (LPI). Below, Figure 1 is a four-by-four matrix. The image in the top left, for example, is autocorrelated with the first PN sequence, and the figure to the right of it is a picture of cross-correlating the first PN sequence with the second PN sequence, and so on.
The proposed method represents M data in the MSS method and N data in the CSK method. A decimal representation of several bits that make up a single symbol is N and M. If three consecutive bits are of the form ‘101’, for example, n is 5. The nonshifted PN sequence and the shifted PN sequence are combined to form one symbol. The proposed method applies a PN sequence cyclic shift method, but unlike the conventional CSK method, the MSS and cyclically shifted PN sequences overlap, as shown in Figure 2. The PN sequence used for CSK is denoted by C 0 , and the PN sequence used for MSS is not cyclically shifted. As much as n × m of the cyclic shift is performed. Here, m ( m   1 ) represents the minimum distance, and the reason for using the minimum distance is that the cyclic shift of one chip does not have discriminating power in demodulation with the peak-to-peak distance. As a result, multiplying by m generates and transmits an adequate distance. If m is large, however, n × m becomes very large and the orthogonality may be lost. As a result of comparing BER performance according to m in simulation, it was confirmed that the best performance was achieved when m = 3 .
The PN sequences for MSS and CSK are merged to create a single sign. An encoder is used to convert a binary number to a decimal number, and then the cyclically shifted PN sequence and the noncyclically shifted PN sequence are combined to create an MCSS signal. The proposed method is unique in that the receiver finds M through a cross-collation of PN sequences in one symbol and then cross-collations C 0 from the symbol to find n as a result of using MCSS by synthesizing MSS and CSK. The main advantage of MCSS is that, unlike conventional CSK, the peak position in MSS and the peak position of the C 0 cross-collation can both be found within one symbol, making it more resistant to Doppler spread.
One symbol is modulated per sequence in conventional DSSS systems. The i-th signal is as follows:
x i = s i c .
The i-th transmitted symbol is s i , and the spreading sequence is c . The cyclic shift matrix can be written as:
  T = 0 1 × L 1 1 I L 1 0 L 1 × 1 .
where I L denotes the l × L identity matrix and L   is the length of the PN sequence. As shown in Figure 2, cyclically shifted C 0 and noncyclically shifted C q are combined to form one symbol, where q   [1, 2..., Q ]. q represents M bits of information and n represents N bits of information. In the i-th symbol x i , M bits indicated by q are q i , and N bits indicated by n are n i . As a result, the i-th symbol represents (M+N) bit information. The symbol x i can be expressed as:
x i = j = 1 2 C j 1 × q i T 2 j × n i × m
where the symbol x is an i ×  L matrix and the passband is expressed as:
s i t =   Re l = 1 L x i n g t i T s l T c e j 2 π f c t
s t = [   s 1 t ,   s 2 t   , , s i t ]
where T s ,   T c are the symbol and chip duration time,   f c is the carrier frequency, and L is the length of the symbol. g t is the impulse response of the pulse-shaping filter. Equation (6) means the convolution between the pulse-shaping filter and the symbol. A raised-cosine filter was utilized with a roll factor of 0.5.

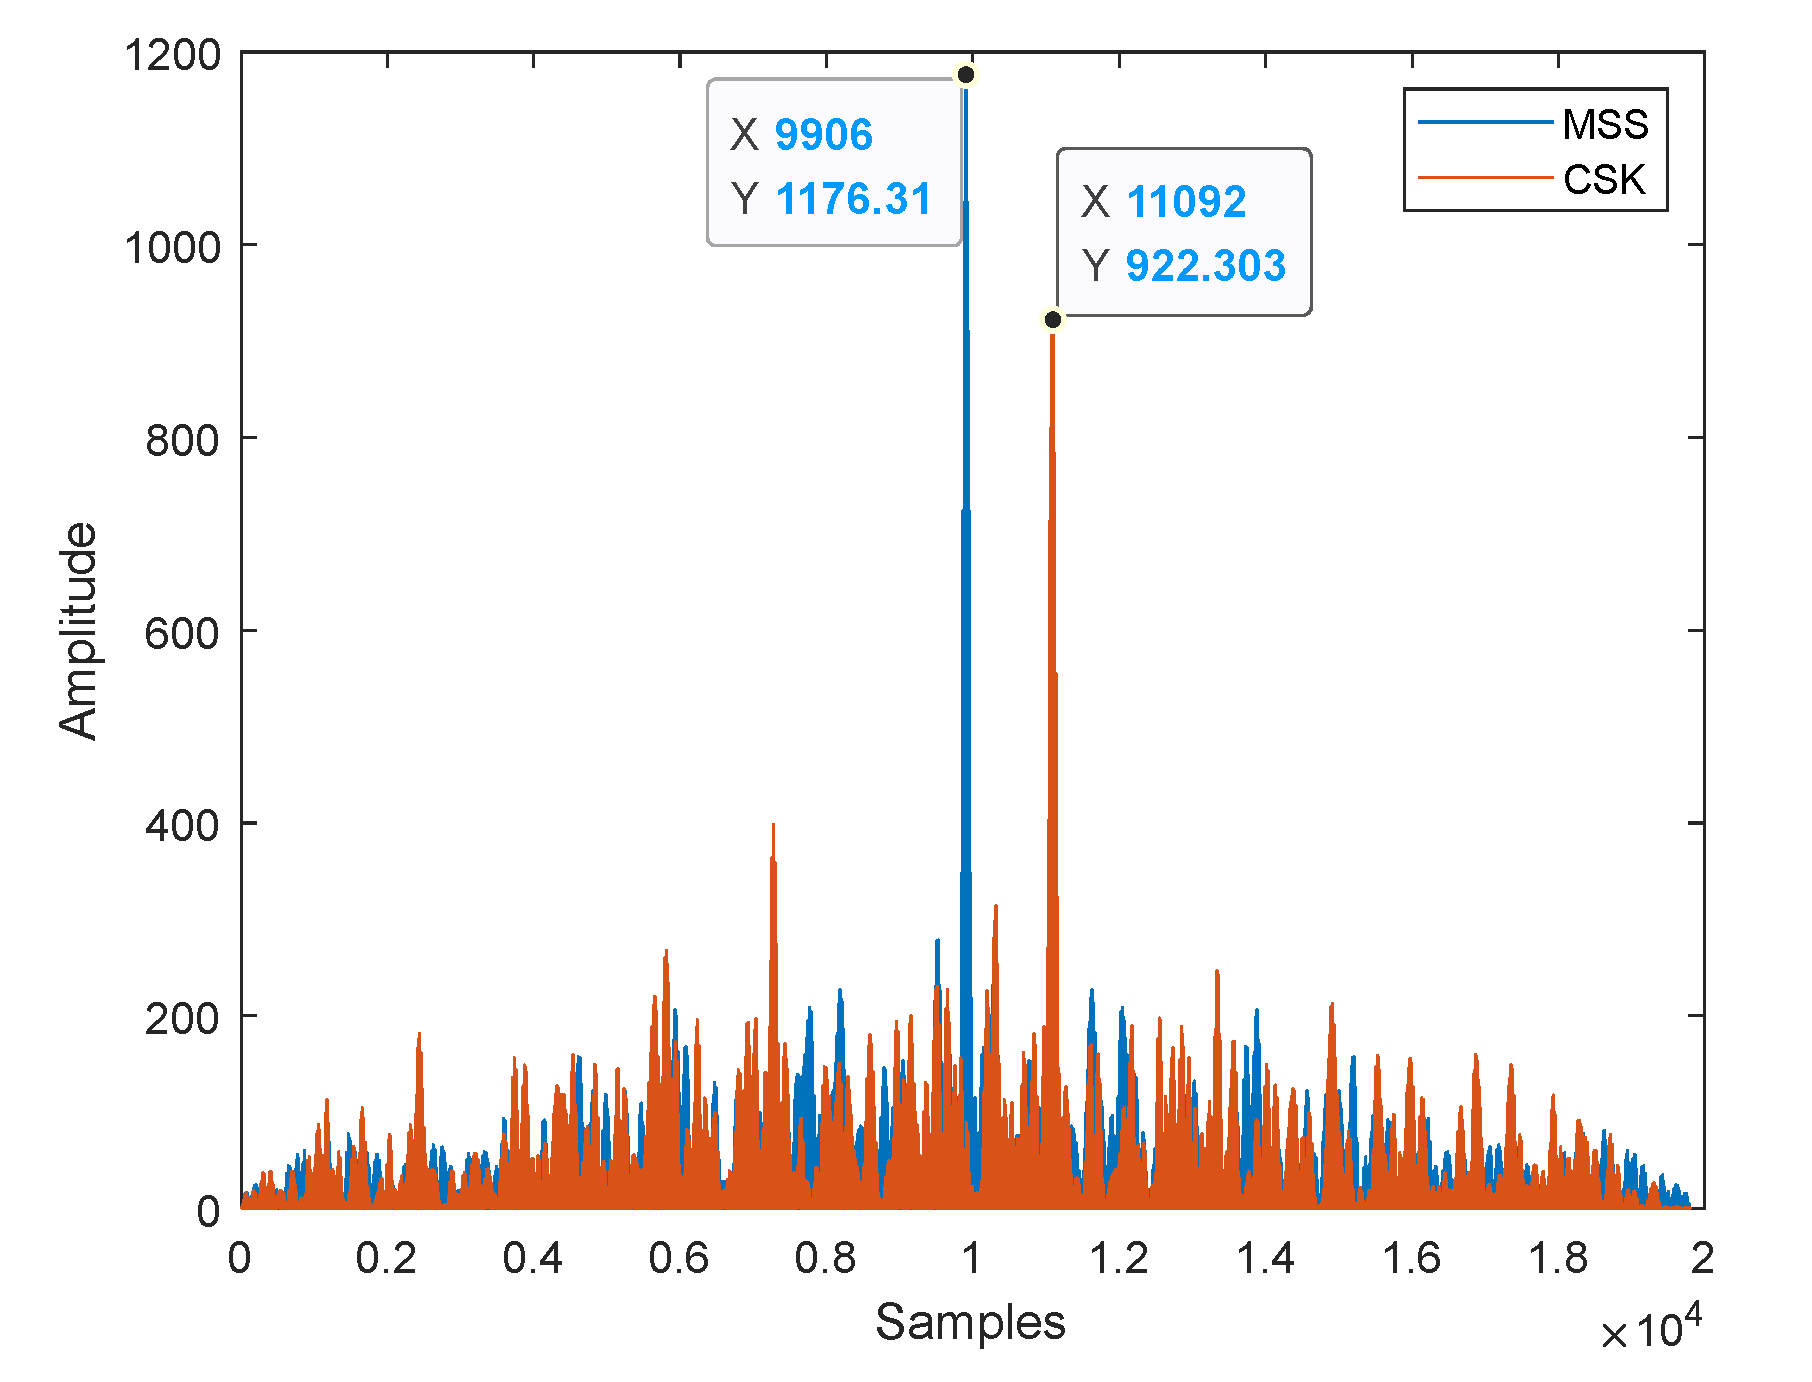
2.2. Estimation of the Approximate Doppler Shift Based on Two Peaks

The signal is compressed or extended as a result of Doppler distortion in the time domain. As a result of the Doppler’s influence, UWA signals are frequently modeled in the following way.
r t = s 1 + Δ t     [   s 1 1 + Δ 1 ) t ,   s 2 1 + Δ 2 ) t   , , s i 1 + Δ i t ) ]
where r t is the received signal and can be expressed as the sum of each symbol. Δ is the Doppler scale, which is defined as the ratio of the relative velocity between the source and receiver to the propagation wave velocity. The received signal with a Doppler scale ( Δ ) is equivalent to a scaling of the sampling period in a discrete-time processing system with interpolation.
f s + Δ     1 + Δ f s       f c + Δ   1 + Δ f c
The sampling frequency and the carrier frequency are both affected by the same ratio of Doppler spread and f s indicates the sampling frequency. The underwater vehicle’s top speed is approximately 45 knots (12.86 m/s). The sound speed is 1500 m/s, with a range of Δ = 0.0085 to 0.0085. As a result, if f c = 2.5 kHz, the Doppler frequency range is −21.4 Hz to 21.4 Hz. We want to find Doppler by the approximate sample difference of the chip in the sample area since the Doppler spread is highly unpredictable.
Chip ns = f s s p s × L
Here, Chip ns indicates the number of samples that one chip has. The symbol rate (symbol per second, sps) of the transmission signal is 10 and one symbol includes 127 chips. As a result, the chip duration is 0.787 ms and each chip has 78 samples when the sampling frequency f s is set to 100 k. The number of samples that can be changed by Doppler ranges from −84 to 84 when Δ = 0.0085 to 0.0085 and one symbol has 9906 samples. Because there is a sample change greater than the number of samples on a single chip, a stable system can be achieved by setting the minimum distance m to 3 or more.
Signals such as Equation (11) are generated to determine the C q sequence with the highest peak through MSS, and Equation (12) can be written as a reference signal to find the difference between the peaks of CSK as follows:
M S S f c q t = Re l = 1 L C q l g t l T C q e j 2 π f c t                 f o r   q     1 ,   2 ,     ,   Q .
C S K f c t = Re l = 1 L C 0 l g t l T C 0 e j 2 π f c t .
As shown in Figure 3, the sequence with the largest amplitude can be found by correlating M S S f c q , and the correlation result of   q ( q   [1, 2..., Q]) is shown. It was also possible to check how much cyclic shift there was by correlating C S K f c in the same symbol. Each chip contains approximately 78 samples, as previously stated. The desired value of n can be calculated because the minimum distance m is determined when transmitting. The peak-to-peak distance in Figure 3 differs by 1186 samples. Each chip has 78 samples and the cyclic shift is as much as the product of the minimum distance m and bit information n . As a result, 1186 divided by 78 × m equals n .
The peak-to-peak distance can be used to determine the data and Doppler. C S K f c and M S S f c q t are used to correlate the received signal, where   is the measured correlation. The formula for determining the position in the result with the highest value is as follows:
M A X m s s q i > 1 i = arg   max   t T s   q   1 ,   2 ,     ,   Q r i 1 t M S S f c q t .
M A X c s k i i = arg   max t T s   r i t C S K f c t .
r i denotes the i-th symbol transmitted and M A X m s s i indicates the position of the sample with the maximum value when correlated with M S S f c q t . When correlated with C S K f c , the position of the sample showing the maximum value is given as M A X c s k i . Doppler compensation is applied to the first symbol (when i = 1 ) in the transmission signal design by adding a preamble signal in front of the payload, and the peak difference is determined using the premise that the peak floats in the middle due to Doppler compensation.
n d i = M A X c s k i M A X m s s q i m × L  
MSS has already demodulated q using Equation (13), and after demodulating q, the maximum value of MSS is used as a reference and the peak of CSK is found to obtain n . Additionally, using the variables resulting from Equations (15) and (16), the Doppler scale ( Δ ) can be approximated using the following equation:
Δ i   ( n d i n d i ) × m L         Δ ,     n d i n d i   0 + Δ ,     n d i n d i < 0   .
where · means rounding · to the nearest integer. Equation 16 considers that Doppler occurs in proportion to the number of samples shifted and calculates approximate Doppler based on that number. That is, the Doppler frequency is roughly estimated in proportion to the number of samples between the peaks in one symbol. Although the number of samples is insufficient to perfectly estimate the Doppler frequency, an approximate value can be estimated, which reduces the amount of computation when using a Doppler bank.

2.3. Symbol Synchronization and Doppler estimation with MSS

The method proposed in this paper is the calculation of the sample change at the peak position, the calculation of the approximate Doppler based on the change amount, and the calculation of f c Δ accurately within the range. Within the approximately calculated Doppler range ( f c Δ ~ f c + Δ ), the step size is established and the ( Δ i ) with the highest correlation result is found and compensated. It compensates Δ i and compensates for the starting point of the next symbol as follows:
l e n i = 1 + Δ i Chip ns × L
The number of samples per i-th symbol is denoted by l e n i . We can compensate for the start synchronization of the next symbol for each of the symbols by adjusting the number of samples after Doppler compensation [26].
Following the MSS method, the step size is determined within the range of − Δ to + Δ using the previously determined Δ , and the largest value is found to compensate for precise Doppler, as shown in Figure 4. The peak is then found using the CSK’s correlation in the Doppler-compensated symbol, and the value of n is determined by comparing it to the peak position of the M S S f c q correlation. The derived q and n are then decoded into binary numbers.
In the conventional M-ary cyclic shift keying (MCSK) method, if q sequences are used for MSS and N cyclic shifts are performed on the original MCSK signal, ( log q + log N ) bits can be expressed in one symbol. The MCSK method, on the other hand, creates a number of cases by cyclic shifting each MSS sequence, whereas the MCSS method proposed by us overlaps the MSS sequences and the CSK sequence so that the receiver can demodulate it using only MF. Furthermore, because MSS and CSK overlap, MSS serves as a reference for the midpoint of CSK’s cyclic shift, allowing the cyclic shift value to be demodulated more consistently.

3. Simulation Results

3.1. Simulation Channel Characteristics

The transmitted signal packet utilized in the simulation is depicted in Figure 5, and the 512-bit PN sequence used as the preamble is used to find the payload’s synchronization and compensate for the first symbol’s Doppler. The range of the Doppler bank was run with a 0.1 step size to find f d , taking into account the submarine’s speed and assuming that the maximum Doppler is approximately 21 Hz. The program took approximately 48 s to search the −21 Hz to 21 Hz range and approximately 11.6 s to use Equation (16) to find Δ and run the Doppler bank within that range [27,28]. Although using the Doppler bank in the passband has the disadvantage of requiring a considerable amount of computation, Equations (15) and (16) show that this can be reduced significantly.
Figure 6 depicts the sound speed profile measured during the November 2020 sea trial. The channel impulse response was obtained using this method, which involved running a simulation based on the Bellhop model and then applying the UWA communication signal to it. The transmitter and receiver were separated by 20 km. Figure 7 shows the channel impulse response at the receiver positioned at a depth of approximately 229 m as a result of channel modeling.
Simulation was used to compare the BER performance of the existing CSK, MSS MCSK, and our proposed MCSS using a channel with the same transfer characteristics as Figure 6. The signal transmission rate is usually designed for 10 sps, but depending on the simulation case, it may be designed for 5 sps. CSK and MSS had three bits per symbol, whereas MCSK and MCSS had up to six bits per symbol. At 1270 bps, the preamble sends an m-sequence of 511 bits with a length of approximately 0.4 s. The length of the information data in the simulation was 1.5 × 10 3 bits and each bit was spread across 127 chips at 10 sps and 255 chips at 5 sps. The simulation outcomes are depicted in the diagram below.
In Figure 8, the Doppler effect was created by arbitrarily changing the sampling rate in the time domain, and the rate of change in the form of a sine graph was created to confirm both positive and negative Doppler. The value of f d   varies depending on how much the sampling changes. That is, the Doppler shifts in response to the gradient change. Figure 9 shows the Doppler factor ( α ), which can be expressed by the following equation:
Doppler   factor   α = f d f c × ( Chip ns × L ) f s
Equation (18) represents the rate of change in symbol length and the measured f d per symbol should be used to compare performance. The rate of change of sampling per symbol is calculated by measuring the gradient of the change of the sampling frequency in Figure 8. It can be confirmed whether the correct f d is estimated by comparing the rate of change of sampling per symbol with α .

3.2. Performance Comparison

To demonstrate the performance of the proposed MCSS method, it was compared to the conventional CSK, MSS, and MCSK methods. The parameters of the modulated signals are summarized in Table 1. Table 2 lists the parameters for each signal. For the spreading sequence, the maximum length (ML) sequence was used, and all four signals were intended to have the same bandwidth.
The BER curves for each SNR after Doppler compensation and the BER for each SNR of the channel with and without Doppler were calculated. At a frequency range of −4 Hz to 4 Hz, artificial Doppler was applied to the channel, with a different Doppler applied to each symbol. When the same bandwidth is used, MCSK and MCSS can have more bits of information per symbol. As a result, we compared their performance in the same bandwidth, the case where the data rates (bps) are the same, and the case where the symbol rates (sps) are the same. The symbol rate was lowered, and the number of spread sequences was increased to have the same bandwidth to compare the performance by matching the bps equally.
Figure 10a is the result of BER per channel SNR to which only CIR (Figure 7) is applied, and Figure 10b is the result of BER per channel SNR to which only CIR (Figure 7) is applied. Figure 10b shows the results of BER per SNR in the channels added to CIR in Figure 7 and Doppler in Figure 8 without correcting for Doppler, and Figure 10c shows the results of compensating Doppler for each symbol in the channels added to CIR and Doppler. Figure 11 shows the results of comparing the same bit rates. To make the bit rate the same, the symbol rate of MCSK and our proposed MCSS is halved and the number of sequences is doubled to have the same bandwidth. Only CIR is used in Figure 10a and Figure 11a, and the outcome is a performance comparison for orthogonality of signals. At the same symbol rate, MSS was the best, followed by MCSS, MCSK, and CSK. MCSK performed better than CSK at the same bit rate. The results without Doppler compensation in the channel with CIR and Doppler added are shown in Figure 10b and Figure 11b. MSS has the best performance when the symbol rate is the same, followed by MCSS. By superimposing two separate sequences, our proposed MCSS signal contains more information in a single symbol. At the same symbol rate, the two distinct sequences acted as noise to each other, resulting in somewhat worse performance than MSS. Our proposed MCSS, on the other hand, performed better at the same bit rate. Even when the SNR was 0 dB, the BER of the CSK and MCSK signals was measured to be 0.3 or higher, and the result was very sensitive to Doppler. CSK and MCSK demodulate at the baseband, so phase variation is included in the desreading process, resulting in poor BER performance. However, MSS and MCSS show more robust results because Doppler frequency correction in passband is included. The results of Doppler compensation in the channel to which CIR and Doppler are added are shown in Figure 10c and Figure 11c. The MSS and MCSS data exhibit similar tendencies to those without Doppler adjustment; however, they perform much better at lower SNRs. In CSK and MCSK, Doppler is compensated for the first symbol using the preamble, and phase is compensated using the PLL.
Figure 12 shows f d measured using the Doppler bank, and Figure 13 shows the change of one symbol length according to f d . It was demonstrated that the change in the time axis utilized in the simulation and the change in the symbol length by the measured f d produced the same outcome. As previously stated, the present Doppler bank detects Doppler in the −21.4 Hz to 21.4 Hz range. However, our proposed method uses the peak-to-peak distance to obtain the approximate Doppler ( Δ ) and the Doppler bank to find the precise f d within the approximate Doppler error range.

4. Experimental Results

In March 2022, an experiment was conducted off the coast to evaluate the proposed method’s efficiency in an actual underwater acoustic channel. By comparing the BER of the UWA communication, the performance of the communication system was determined.

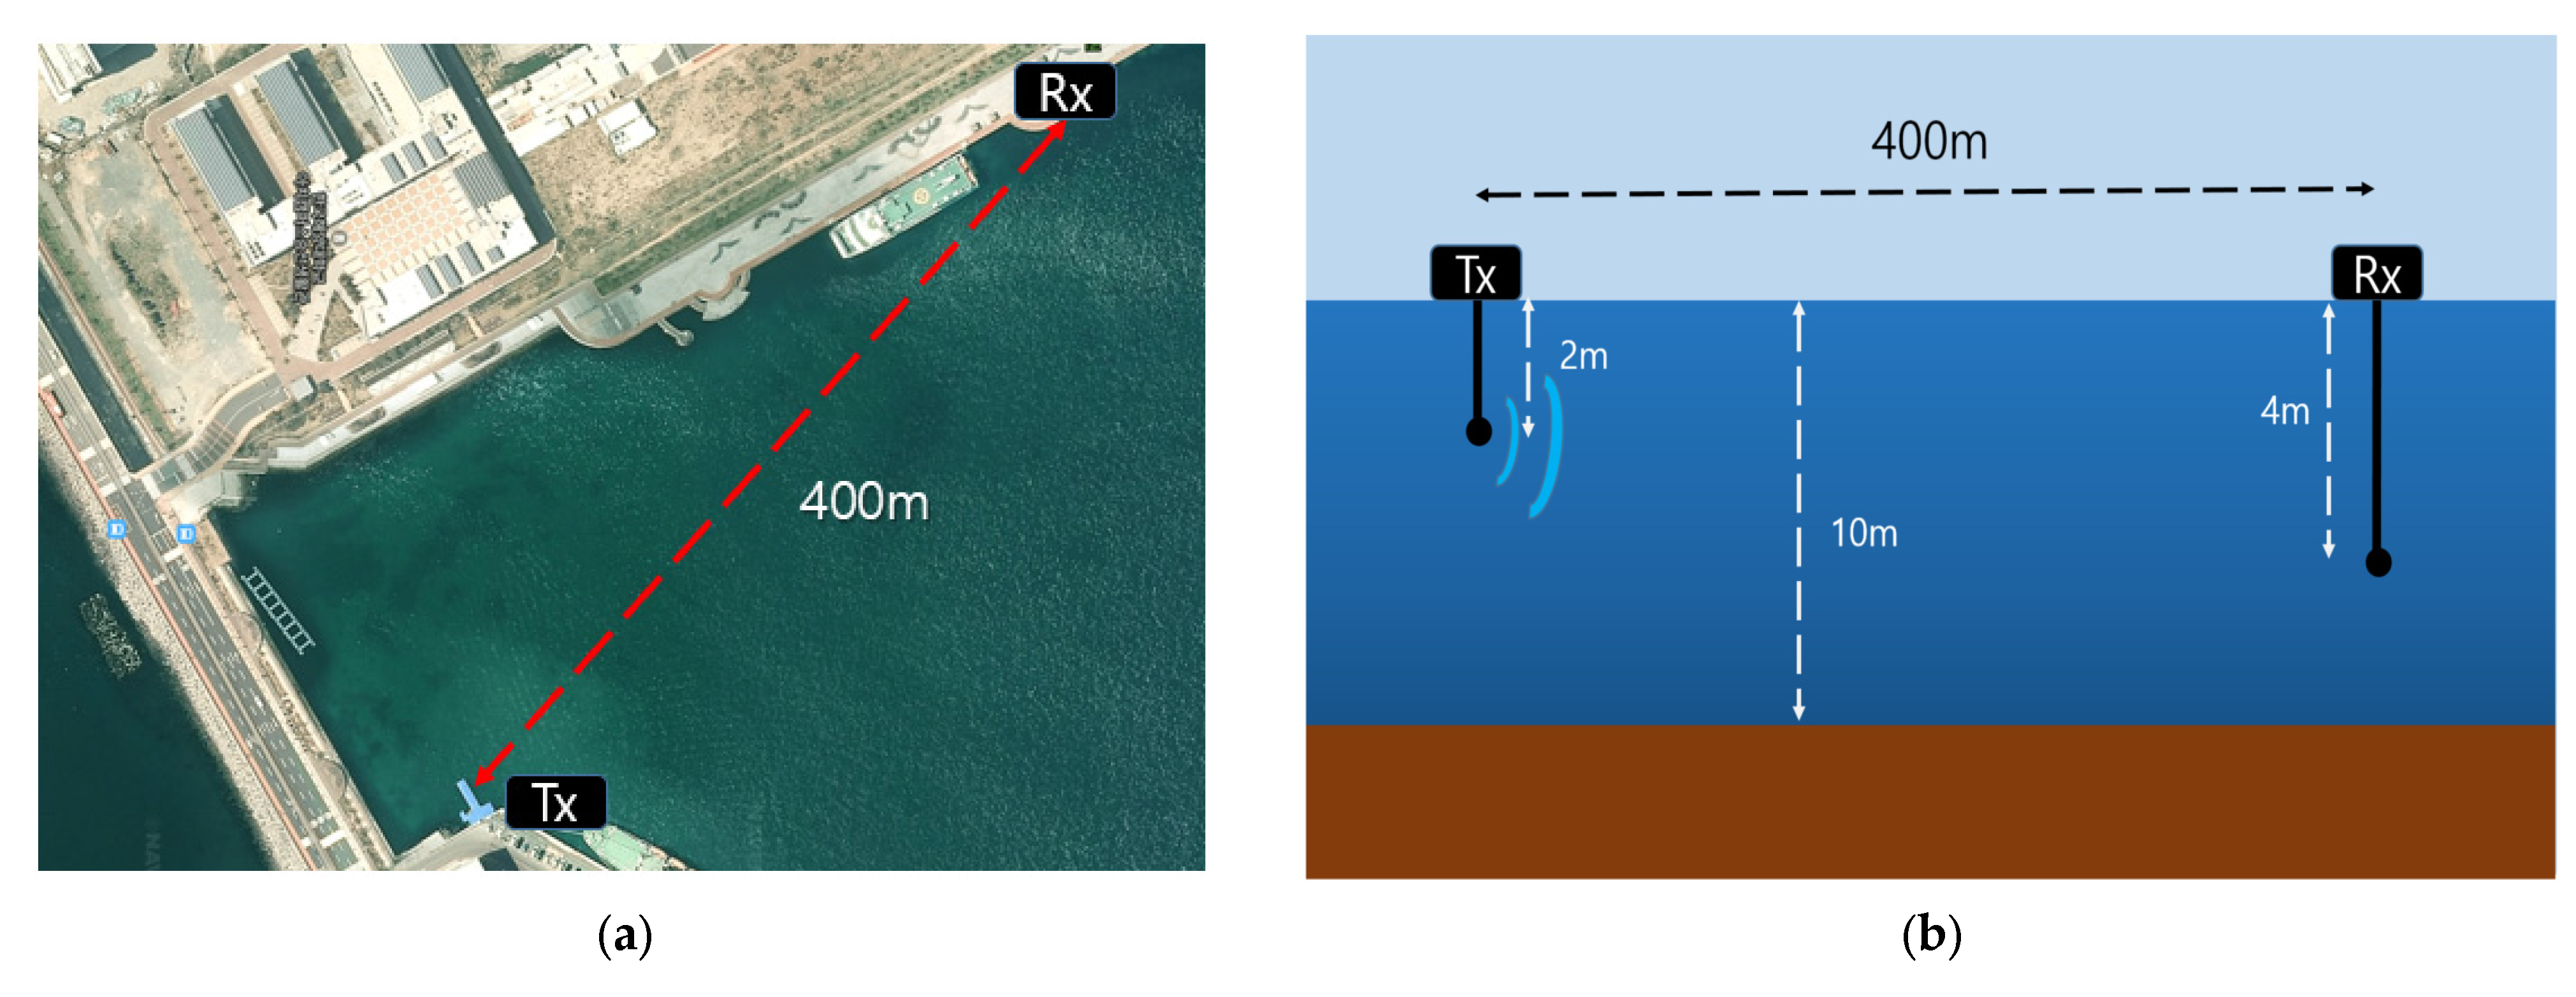
4.1. Experimental Environment

Figure 14 shows a diagram of the experimental equipment configuration. This experiment was carried out off the coast of the Korea Maritime and Ocean University. Table 3 shows parameters for sea trials. The range between the transmitter and receiver was 400 m and the sea depth was approximately 10 m. The transmitter was at a depth of 2 m, whereas the receiver was at a depth of 4 m. A transmitter, the ITC-3013 [29], offers highly efficient broadband transmission with a hemispherical beam pattern.
We used a directional transmitter because we wanted to reduce the effects of multipaths in shallow water. At approximately 400 m, the receiver was a Teledyne Reson TC4032 [30]. Figure 15a shows the measured channel impulse response. A linear plot of the impulse-response function, Figure 15b, shows the delay-Doppler spread function. An assessment of the channel environment is required to interpret the received signals. As a result, the characteristics of the underwater channel were estimated prior to the experiment. A 128-ms LFM (linear frequency modulation) pulse train with a 2-kHz bandwidth was used and it was repeated 200 times.

4.2. The Results

The signal transmitted in the experiment consists of the LFM signal, guard interval, PN code, and data part, as shown in Figure 5. Data are encoded with 336 bits of turbo-coded data, and all transmission signals have the same symbol rate.
The LFM signal was used to distinguish the transmitted signals and it can also be used to approximate signal synchronization. If the LFM signal is used to find rough synchronization, the PN signal is used to find fine synchronization. A DSSS signal contains one bit of information per symbol, CSK and MSS contain three bits of information per symbol, and MCSK and MCSS contain six bits of information per symbol. As stated in Table 4, there are five different types of transmission signals, as well as five signals with an artificial Doppler shift to see how the Doppler shift affects the system. We aimed to validate the efficiency of our proposed method in the channel without Doppler and the efficiency of our proposed method in the channel with Doppler by comparing them with the conclusions of the simulation.
The uncoded BER results of MCSS, our proposed method, and the other four conventional signals are shown in Table 5 and Table 6. The BER of transmissions without an artificial The doppler shift is shown in Table 5. Although there is no Doppler shift, due to the influence of the wind and current, a Doppler spread occurred, and the phase of each symbol changed, as seen in Figure 16a. Table 5 illustrates the BER after PLL phase compensation. The BER results of transmissions with artificial Doppler are shown in Table 6. MSS and MCSS can compensate for Doppler per symbol estimation; however, DSSS, CSK, and MCSS are unable to do so. As a result, the BER of the DSSS, CSK, and MCSK signals in all trials was 0.4~0.5. Thus, in a communication environment with a Doppler shift for each symbol, the DSSS, CSK, and MCSK signals were judged to have no meaning, and the remaining MSS and MCSS showed the BER by estimating Doppler for each symbol. The uncoded BERs of the DSSS, CSK, MSS, MCSK, and MCSS signals were 0.092, 0.0846, 0.0548, 0.0774, and 0.0525 on average, respectively, in an environment without artificial Doppler, and the uncoded BERs of the MSS and MCSS signals were 0.1071 and 0.1002 on average, respectively, in an environment with artificial Doppler.
Figure 16a shows the phase change due to the influence of the Doppler spread due to ocean currents and wind as a constellation diagram of the DSSS signal. CSK and MCSK were also subjected to phase correction using PLL after downconverting the signal. Figure 16b shows the comparison between the artificial Doppler factor and the Doppler factor measured based on the obtained data.
The input SNR measurement in the real communication channel was −4.7883 dB. The performance in the simulation was somewhat good in the SNR environment of approximately −5 dB, but the overall BER performance in the actual communication channel was substantially lower. The Doppler spread was shown to have a much greater impact on system performance.
S N R i n p u t = 10 log P P a y l o a d P g u a r d P g u a r d
where P P a y l o a d indicates the payload, that is, the power of the data part, and P g u a r d indicates the guard, that is, the power of the noise part. The performance of our proposed method, MCSS, is better than other signals, as shown in the experimental results in Table 5 and Table 6. It performs similarly to the conventional MSS signal on a channel with artificial Doppler added. In terms of BER outcomes, the results are comparable. However, because the proposed MCSS approach has twice the data rate of MSS, experiments and simulations have shown that the proposed method is a better UWA communication method.

5. Conclusions

In this paper, we present a Doppler estimation and timing synchronization method for underwater acoustic communication that is affected by a Doppler shift and Doppler spread, as well as an MCSS communication method that provides beneficial modulation in these fluctuating channels. The proposed method’s performance was validated through simulation by comparing it to an existing spread spectrum method in a channel with multipath and Doppler shifts. The BER results for each SNR of the simulation in a channel with signal interference and a Doppler shift were compared, and the nonlinear change in Doppler was well-captured and unaffected by the cumulative effects of synchronization errors. In addition, the performance was verified through a sea trial, and an artificial Doppler shift was added to the transmission signal because the nonlinear part of the Doppler shift could not be visually seen in the simulation. As a result, a channel with a Doppler shift, Doppler spread, and multipath was created, and when the performance of these channels was compared, it was discovered that the conventional spread spectrum methods achieved better BER at the same symbol rate.
The reception process requires more computation than the baseband; a tradeoff for this might be higher accuracy. Developing hardware that can cover many computations and finding a way to achieve better accuracy with less computation is an important task for future research. Experiments have shown that the Doppler estimation method or transmission method described in this paper is feasible and that higher speeds of autonomous underwater vehicles will be detectable in the future. We also investigated and tested ways to improve communication within the underwater vehicle itself.

Author Contributions

Data curation, H.R. and C.Y.; Methodology, K.K.; Software, H.R.; Supervision, K.K.; Writing—original draft, H.R.; Writing—review and editing, K.K. All authors have read and agreed to the published version of the manuscript.

Funding

This research was funded by the Agency for Defense Development, South Korea, grant number UD200010DD.

Institutional Review Board Statement

Not applicable.

Informed Consent Statement

Not applicable.

Data Availability Statement

Not applicable.

Conflicts of Interest

The authors declare no conflict of interest.

References

  1. Dushaw, B.D. The acoustic thermometry of ocean climate (ATOC) project: Towards depth-averaged temperature maps of the north Pacific Ocean. In Proceedings of the International Symposium on Acoustic Tomography and Thermometry, Tokyo, Japan, 8–9 February 1999; pp. 8–9. [Google Scholar]
  2. Stojanovic, M. Underwater acoustic communications. In Proceedings of the Electro/International 1995, Boston, MA, USA, 21–23 June 1995; pp. 435–440. [Google Scholar]
  3. Urick, R.J. Principle of Underwater Sound, 3rd ed.; McGraw-Hill Book Company: New York, NY, USA, 1996; pp. 99–197. [Google Scholar]
  4. Du, P.; Zhu, X.; Li, Y. Direct sequence spread spectrum underwater acoustic communication based on differential correlation detector. In Proceedings of the 2018 IEEE International Conference on Signal Processing, Communications and Computing (ICSPCC), Qingdao, China, 14–16 September 2018; pp. 1–5. [Google Scholar]
  5. Freitag, L.; Stojanovic, M.; Singh, S.; Johnson, M. Analysis of channel effects on direct-sequence and frequency-hopped spread-spectrum acoustic communication. IEEE J. Ocean. Eng. 2001, 26, 586–593. [Google Scholar] [CrossRef]
  6. Stojanovic, M.; Proarkis, J.G.; Rice, J.A.; Green, M.D. Spread spectrum underwater acoustic telemetry. In Proceedings of the IEEE Oceanic Engineering Society. OCEANS’98. Conference Proceedings (Cat. No. 98CH36259), Nice, France, 28 September–1 October 1998; IEEE: New York, NY, USA, 1998; Volume 2, pp. 650–654. [Google Scholar]
  7. Demirors, E.; Melodia, T. Chirp-based lpd/lpi underwater acoustic communications with code-time-frequency multidimensional spreading. In Proceedings of the 11th ACM International Conference on Underwater Networks and Systems, Shanghai, China, 24–26 October 2016; pp. 1–6. [Google Scholar]
  8. Stojanovic, M. Recent advances in high-speed underwater acoustic communication. IEEE J. Ocean. Eng. 1996, 21, 125–136. [Google Scholar] [CrossRef]
  9. Mosca, F.; Matte, G.; Mingnard, V.; Rioblanc, M. Low frequency source for very long range underwater communication. In Proceedings of the 2013 OCEANS, San Diego, CA, USA, 23–27 September 2013; pp. 1–5. [Google Scholar]
  10. Song, H.C. Acoustic communication in deep water exploiting multiple beams with a horizontal array. J. Acoust. Soc. Am. 2012, 132, EL81–EL87. [Google Scholar] [CrossRef] [PubMed] [Green Version]
  11. Qu, F.; Yang, L.; Yang, T.C. High reliability direct-sequence spread spectrum for underwater acoustic communications. In Proceedings of the 2009 OCEANS, Biloxi, MS, USA, 26–29 October 2009; pp. 1–6. [Google Scholar]
  12. Liu, Z.; Yoo, K.; Yang, T.C.; Cho, S.E.; Song, H.C.; Ensberg, D.E. Long-Range Double-Differentially Coded Spread-Spectrum Acoustic Communications with a Towed Array. IEEE J. Ocean. Eng. 2013, 39, 482–490. [Google Scholar] [CrossRef]
  13. Walree, P.A.V.; Buen, H.; Otnes, R. A performance comparison between DSSS. M-FSK, and frequency-division multiplexing in underwater acoustic channels. In Proceedings of the 2014 Underwater Communications and Networking (UComms), Sestri Levante, Italy, 3–5 September 2014; pp. 1–5. [Google Scholar]
  14. Van Walree, P.; Sangfelt, E.; Leus, G. Multicarrier spread spectrum for covert acoustic communications. In Proceedings of the OCEANS 2008, Quebec City, QC, Canada, 15–18 September 2008. [Google Scholar]
  15. Ritcey, J.A.; Griep, K.R. Code shift keyed spread spectrum for ocean acoustic telemetry. In Proceedings of the Challenges of Our Changing Global Environment. OCEANS’95 MTS/IEEE, San Diego, CA, USA, 9–12 October 1995; IEEE: New York, NY, USA, 1995; Volume 3, pp. 1386–1391. [Google Scholar]
  16. He, C.; Jing, L.; Zhang, Q.; Huang, J. Multiuser underwater acoustic communication using cyclic shift keying. In Proceedings of the OCEANS 2016, Shanghai, China, 10–13 April 2016; pp. 1–4. [Google Scholar]
  17. Jing, L.; Huang, J. Cyclic shift keying spread spectrum OFDM method over underwater acoustic channel. In Proceedings of the 2012 IEEE International Conference on Signal Processing, Communication and Computing (ICSPCC 2012), Hong Kong, China, 12–15 August 2012; pp. 798–801. [Google Scholar]
  18. Yang, G.; Zhou, F.; Lou, Y.; Qiao, G.; Ahmed, N.; He, Y. Double-differential coded M-ary direct sequence spread spectrum for mobile underwater acoustic communication system. Appl. Acoust. 2021, 183, 108303. [Google Scholar] [CrossRef]
  19. Ra, H.I.; An, J.H.; Yoon, C.H.; Kim, K.M. Superimposed DSSS transmission based on cyclic shift keying in underwater acoustic communication. In Proceedings of the OCEANS 2021: San Diego–Porto, San Diego, CA, USA, 20–23 September 2021; pp. 1–4. [Google Scholar]
  20. Zhou, F.; Liu, B.; Nie, D.; Yang, G.; Zhang, W.; Ma, D. Mary cyclic shift keying spread spectrum underwater acoustic communications based on virtual time-reversal mirror. Sensors 2019, 19, 3577. [Google Scholar] [CrossRef] [PubMed] [Green Version]
  21. Zhang, G.; He, X.; Liu, J. A novel Mary dierential underwater acoustic direct sequence spread spectrum communication system. In Proceedings of the 11th ACM International Conference on Underwater Networks & Systems, Shanghai, China, 24–26 October 2016. [Google Scholar]
  22. Yang, G.; Qiao, G.; Zhou, F.; He, Y.; Zhao, Y.; Liu, Y. Doppler tracking and symbol synchronization method for mobile Mary spread spectrum underwater acoustic communications. In Proceedings of the 2021 OES China Ocean Acoustics (COA), Harbin, China, 14–17 July 2021; pp. 550–555. [Google Scholar]
  23. Yang, W.B.; Yang, T.C. High-frequency channel characterization for Mary frequency-shift-keying underwater acoustic communications. J. Acoust. Soc. Am. 2006, 120, 2615–2626. [Google Scholar] [CrossRef]
  24. Lindsey, W.C.; Chie, C.M. A survey of digital phase-locked loops. Proc. IEEE 1981, 69, 410–431. [Google Scholar] [CrossRef]
  25. Pursley, M.B.; Royster, T.C. High-rate direct-sequence spread spectrum with error-control coding. IEEE Trans. Commun. 2006, 54, 1693–1702. [Google Scholar] [CrossRef]
  26. Wang, K.; Chen, S.; Liu, C.; Liu, Y.; Xu, Y. Doppler estimation and timing synchronization of underwater acoustic communication based on hyperbolic frequency modulation signal. In Proceedings of the 2015 IEEE 12th International Conference on Networking, Sensing and Control, Taipei, Taiwan, 9–11 April 2015; pp. 75–80. [Google Scholar]
  27. Transter, W.H.; Shanmugan, K.S.; Rapport, T.S.; Kobar, K.L. Principle of Communication Systems Simulation with Wireless Application; Prentice Hall: Upper Saddle River, NJ, USA, 2003; Chapter 3. [Google Scholar]
  28. Van Walree, P.; Socheleau, F.X.; Otnes, R.; Jenserud, T. The Watermark Benchmark for Underwater Acoustic Modulation Schemes. IEEE J. Ocean. Eng. 2017, 42, 1007–1018. [Google Scholar] [CrossRef] [Green Version]
  29. Gavial ITC Transducers. Available online: https://www.gavial.com/_files/ugd/8aa48d_c59692d9461c47be92502ee6ba9ec81c.pdf (accessed on 1 April 2022).
  30. Reson Hydrophone. Available online: https://www.m-b-t.com/fileadmin/redakteur/Ozeanographie/Hydrophone/Produktblaetter/TC4032.pdf (accessed on 1 April 2022).
Figure 1. Autocorrelation and cross-correlation of PN sequences.
Electronics 11 01698 g001
Figure 2. Block diagram of transmitter.
Electronics 11 01698 g002
Figure 3. Correlation characteristics of MSS and CSK.
Electronics 11 01698 g003
Figure 4. Block diagram of the proposed method.
Electronics 11 01698 g004
Figure 5. Packet structure for simulation.
Electronics 11 01698 g005
Figure 6. Sound speed profile.
Electronics 11 01698 g006
Figure 7. Channel impulse response by Bellhop model.
Electronics 11 01698 g007
Figure 8. Change of sampling frequency in time domain.
Electronics 11 01698 g008
Figure 9. Doppler factor per symbol.
Electronics 11 01698 g009
Figure 10. BER performance at the same symbol rate. (a) is when there is no artificial Doppler shift, (b) is with Doppler and no compensation, (c) is when Doppler is compensated.
Electronics 11 01698 g010
Figure 11. BER performance at the same bit rate. (a) is when there is no artificial Doppler shift, (b) is with Doppler and no compensation, (c) is when Doppler is compensated.
Electronics 11 01698 g011
Figure 12. Comparison of the measured Doppler factor.
Electronics 11 01698 g012
Figure 13. (a) Doppler error, (b) Histogram of the estimated Doppler error.
Electronics 11 01698 g013
Figure 14. (a) Layout diagram of experimental area, (b) Experimental setup.
Electronics 11 01698 g014
Figure 15. (a) Measured channel impulse response. (upper panel) A linear plot of the impulse-response function, (b) Delay-Doppler spread function.
Electronics 11 01698 g015
Figure 16. (a) Constellation diagram of DSSS. (b) Artificial Doppler factor and results of measured Doppler factor from the received data.
Electronics 11 01698 g016
Table 1. Simulation parameters.
ParameterValue
Sampling frequency192 kHz
Carrier frequency12.5 kHz
Bandwidth2 kHz
SNR−30~0 dB
Table 2. Parameters based on the modulation scheme.
ParameterCSKMSSMCSKMCSS
Data rate (bps)303060/3060/30
Symbol rate (sps)101010/510/5
Number of sequences127127127/255127/255
Table 3. Parameters of sea trials.
ParametersValue
Sampling frequency192 kHz
Carrier frequency12.5 kHz
Data rate10~60 bps
Bandwidth1.92 kHz
Range between projector and hydrophone400 m
Projector depth2 m
Hydrophone depth4 m
ProjectorICT-3013
HydrophoneTeledyne Reson TC4032
Table 4. Transmission signal parameters.
ParameterDSSSCSKMSSMCSKMCSS
Data rate (bps)1030306060
Symbol rate (sps)1010101010
Number of sequences127127127127127
Table 5. Uncoded BER of signals without Doppler shift.
TrialsDSSSCSKMSSMCSKMCSS
1 8.03 × 10 2 6.55 × 10 2 4.76 × 10 2 6.68 × 10 2 3.57 × 10 2
2 8.9 × 10 2 8.74 × 10 2 5.65 × 10 2 7.03 × 10 2 5.95 × 10 2
3 1.07 × 10 1 1.01 × 10 1 6.03 × 10 2 9.52 × 10 2 6.24 × 10 2
Average 9.21 × 10 2 8.46 × 10 2 5.48 × 10 2 7.74 × 10 2 5.25 × 10 2
Table 6. Uncoded BER of signals with Doppler shift.
TrialsMSSMCSS
1 1.012 × 10 1 8.63 × 10 2
2 1.041 × 10 1 1.072 × 10 1
3 1.16 × 10 1 1.072 × 10 1
Average 1.071 × 10 1 1.002 × 10 1
Publisher’s Note: MDPI stays neutral with regard to jurisdictional claims in published maps and institutional affiliations.

