1. Introduction
Facial EMG is an EMG method that measures and analyses the electrical activities of muscle movement. It senses and amplifies the small electrical impulses that are produced by muscle strings when they expand and contract on the face. By mounting electrodes on the muscle surface, the action amount can be measured.
The application of EMG signal processing is multifold. It can be used to diagnose neuromuscular disease, control artificial organs, and identify pain [
1,
2,
3]. Studies in [
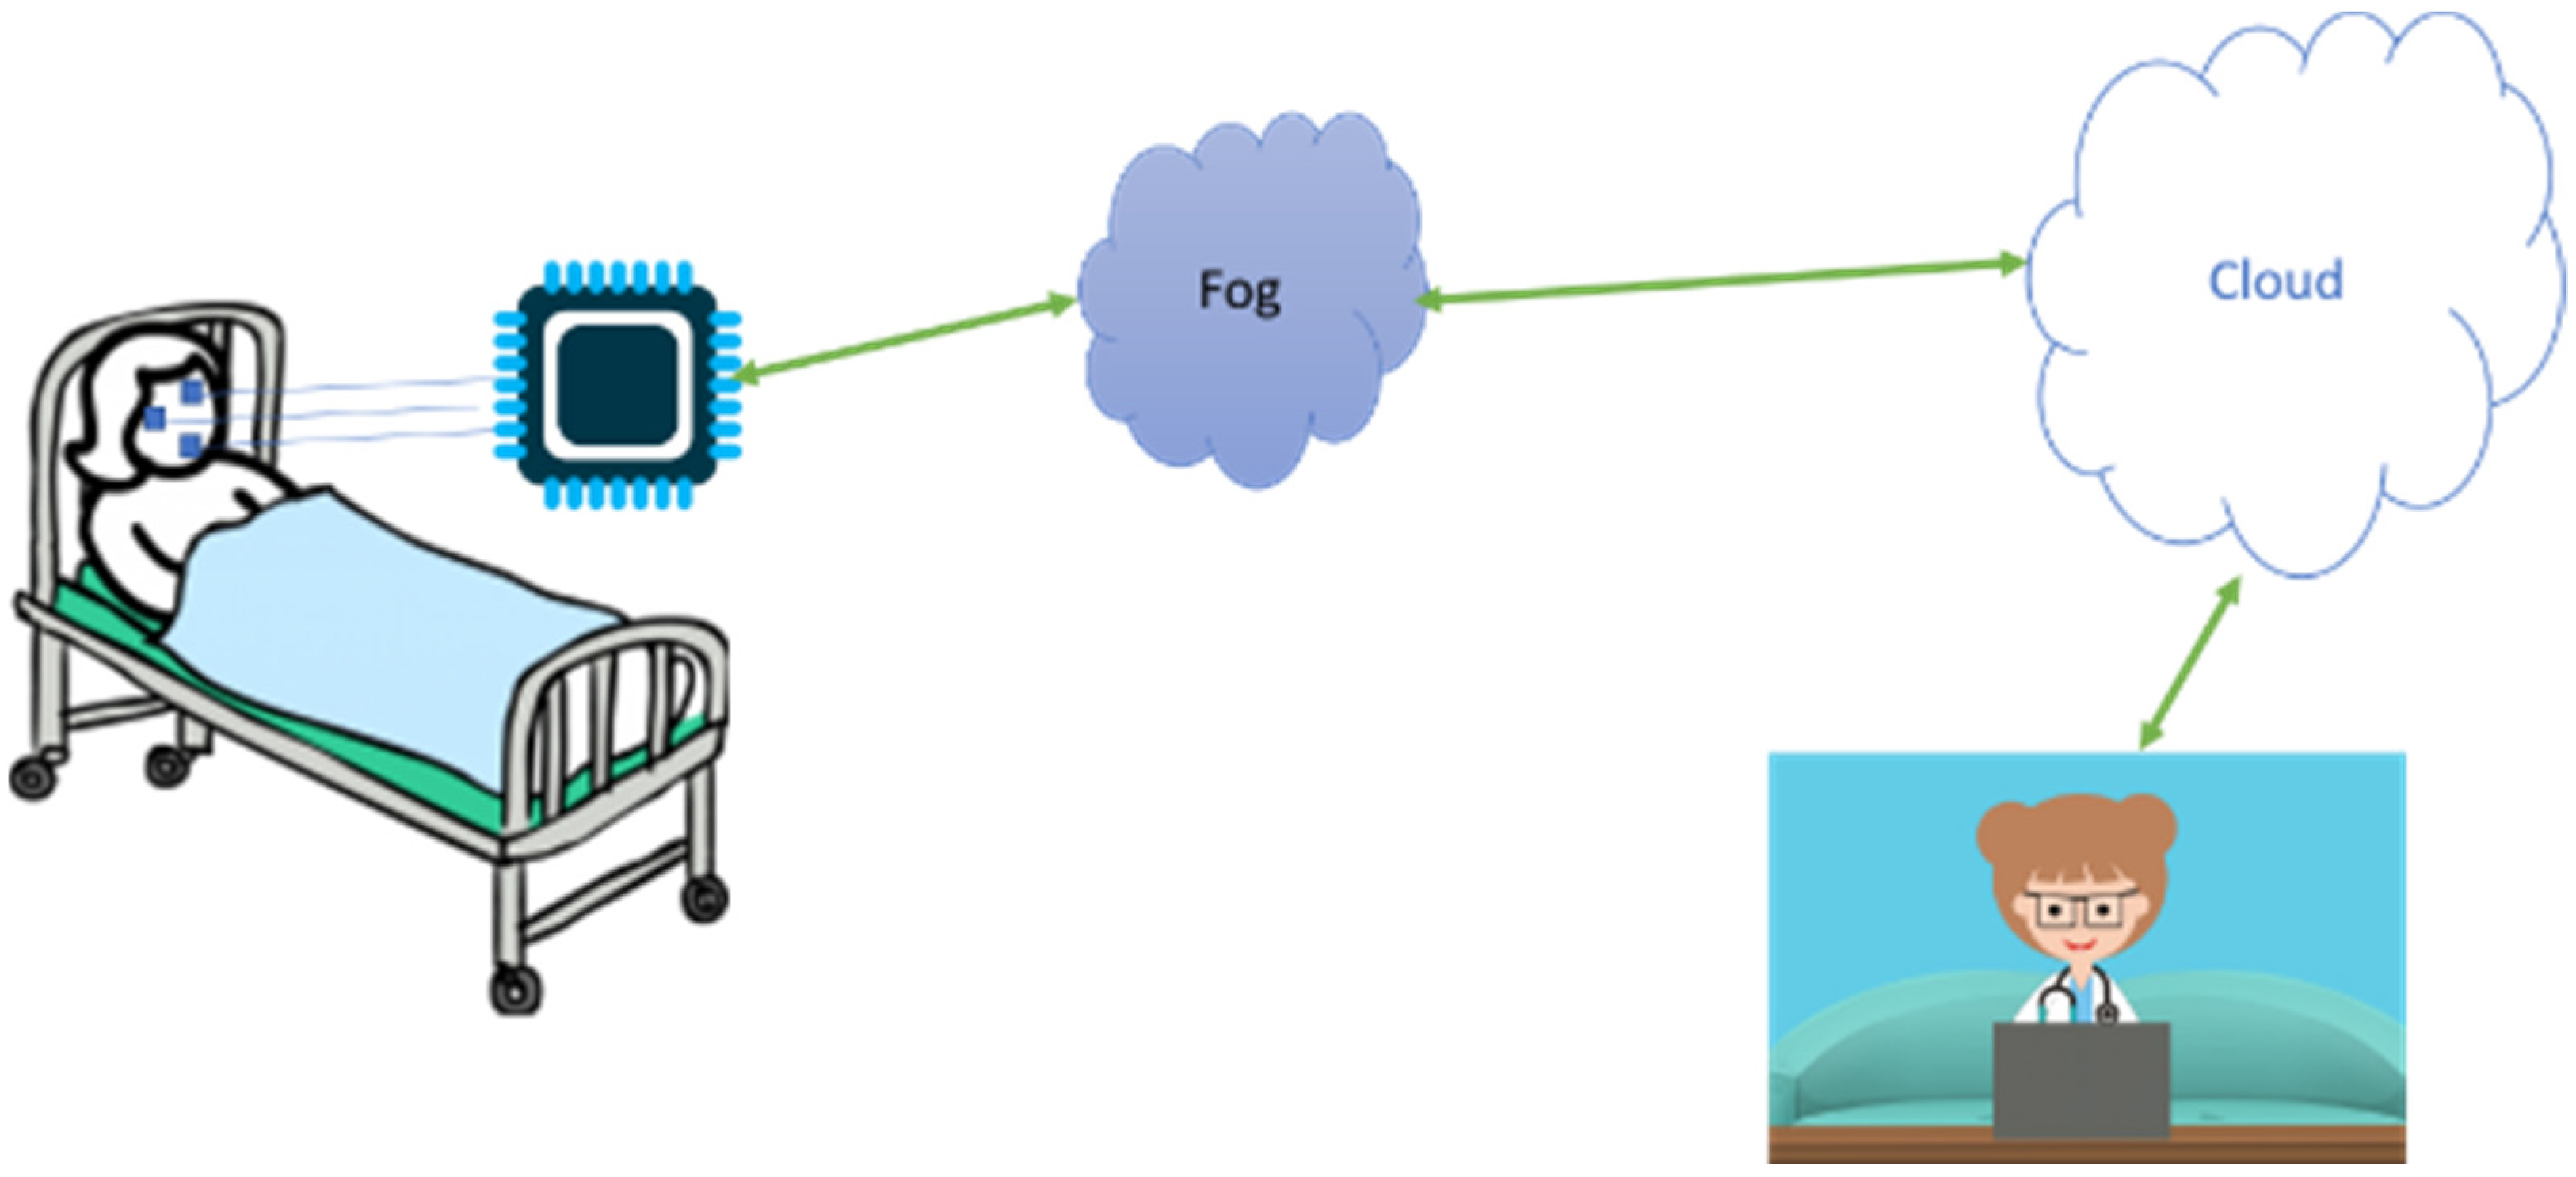
4] depict an automated pain assessment using wearables and fog computing. The system is composed of sensors that collect EMG signals, a micro-controller for pre-processing and signal transmission, and fog and cloud computing that run machine-learning algorithms for pain assessment. Fog and cloud computing help in reducing the latency, addressing the security, and reducing the power consumption. Further details are provided in many published and reported studies [
4,
5]. In e-health, particularly in remote pain assessment, the fog layer is responsible for processing and detecting the pain level per patient or per hospital [
4].
Studies in the BioVid Heat Pain database collection have also shown how the measured signal is associated with negative or positive emotions [
6]. Researchers have discussed how outward emotional activities such as smiles [
7,
8] are used in supplementary compound circumstances and how the smiling action may be hard to understand, as smiles can be sarcastic, smirking, and wry as well as expressions of real optimistic sensation.
A patient who suffers from pain can illustrate integral emotional reactions that are measured by facial muscle movement. It is then necessary to make associations that, with the benefit of fEMG measurement of the EMG corrugator and EMG zygomaticus, grow the strength of interpreting emotional facial expressions [
9,
10]. For this analysis, volunteers were offered a series of stimuli that had been tested earlier to activate a series of precise emotions, while fEMG, respiration, and skin conductance (GSR) were recorded. According to the corresponding survey, the fEMG on the zygomaticus is not always related to the creation of positive emotions [
10]. Similarly, a negative association was investigated with corrugator movement by the indication of the frowning muscle that included a positive stimulus. In general, it is common to associate the action of the zygomaticus joint with happiness and the corrugator with negative effectiveness [
11]; therefore, the corrugator muscle, which is related to pain actions, was also analyzed [
10]. The author considered a nonlinear and non-stationary Empirical Mode Decomposition (EMD) technique to evaluate an EMG dataset in applying the EMG signal stimulated through pain. The classification of ‘no pain’ was determined using the linear SVM algorithm on the most valuable extracted features. Here, we demonstrated that the muscle activation of the corrugator was able to support the self-reported pain more than the rest of the facial muscle activation.
Diverse phases of heat pain were confirmed using bio-signals such as EMG, ECG, GSR, EEG, etc. [
10,
11,
12]; additionally, the transformation of the facial appearance was noted using video signals during various pain levels [
3]. Studies have been done to show the association between pain and the actions of facial muscles. Ref. [
13] has revealed that the movements of seriously sick people’s facial expressions through pain are analogous to those of fit people. The combined facial activity of pain has been reported to be associated with the facial expression of the brow, lip, nose, mouth, and eye movements [
14,
15]. At present, doctors depend on the tentative patient’s explanation of pain as it relates to a rating scale [
16] and another rating scale for ’no pain’ and ‘worst possible pain’ [
17] to determine the level, location, and intensity of the pain. Another study [
18] has revealed that the EMG and machine vision data with similar performance and results support machine vision as a suitable tool for assessing the effects of facial reactions. Video signals have been used for classifying significant pain versus no significant pain in children [
19]. As detailed in [
20], for anesthetized patients, bioimpedance spectroscopy is the most appropriate method for pain assessment [
21]. Nevertheless, these approaches for pain assessment do not work adequately when the patient can respond, therefore, self-determining pain recognition schemes are extremely significant and real-time schemes for the acknowledgment of the level of pain through facial expressions are needed. Facial expression is an ideal representation of feeling that can demonstrate the subject’s emotional situation and alteration of the sentimental conditions during a progression of stimulation [
22,
23]. Pain is associated with actions that can vary the mutual biopotential stages of ECG, EEG, EMG, etc.; the activities and assessment of pain can correspond with the studies of the distinctive bio-signal. Our previous paper [
24] shows a result obtained from testing our prototype module [
25,
26] in an experimental setting using volunteers for facial emotion identification and detection of fEMG movement (frowning and smiling). We learned that, to relate it to the practice of pain assessment based on emotion and the recognition of fEMG signals, fEMG signals need to be used with a clinically approved database for a better pain prediction model and to associate the fEMG and pain assessment.
Nowadays, there is rising attention from medical professionals and academic studies on the bio-signal analysis of pain assessments using the Internet of Medical Things (IoMT). As mentioned, heat pain realized by using bio-signals was analyzed through facial expressions collected by employing video signals on several pain steps [
10]. Nevertheless, pain assessments using video need an intricate and expensive system. We support a research-based, cost-effective way of pain assessment that can be obtained from the facial expression of EMG signals from zygomaticus and corrugator muscles. The advanced methodology is applied for real-time pattern recognition on surface electromyography (sEMG) using a non-invasive methodology for computing the electrical action of facial muscles with electrodes sited on the skin [
27]. The changes in facial expression detection upon diverse pain levels through signal collection from the zygomaticus and corrugator muscles have gained tremendous positive results. Individuals were subjected to painful heat stimuli to modify the biopotential level of the facial EMG muscle to note with practical accuracy the pain level (P
4) concerning the ‘no pain’ and ‘pain’ state [
28]. The benefit of an sEMG methodology is the capacity to distinguish facial muscle movement that can be impossible and imperceptible to viewers [
27]. Though, a current assessment [
29] initiates a unique study with the application of sEMG to recognize facial pain expressions accurately. Additionally, the proposed relationship between pain intensity and muscle strain has continued unverified. Automatic pain assessments for seriously sick patients were studied to assess the sEMG signal possibility for pain detection in comparison to healthy individuals. The goal was to observe the facial muscles’ expressions to be able to distinguish pain and consider the certainty of pain strength [
2].
The investigation of facial expression to assess pain intensity was to propose an opportunity to specify the need for health care and medicine for patients who are in the Intensive Care Unit (ICU) and for those who are unable to communicate their level of pain. The analysis of facial expressions to measure pain strength delivers a way to regulate the essential pain medicine in patients that lack communication ability. The use of EMG is a promising method for continuous pain monitoring in assisting daily living. In this article, we propose the EMG analysis of the zygomaticus and the corrugator for investigating facial expressions as pain monitoring systems using EMGs with machine learning algorithms. Still, there is limited research considering the ML challenge of real-time pain recognition. Up to the present, to the best of our knowledge, there are no studies that compare the signal from subject bias analysis and identify limitations in the classification of the signals on the level of pain. Further, we will discuss and study whether emotional activity due to pain can be detected in patients based on the activity of two facial muscles, the zygomaticus and corrugator. Our findings represent the classification of pain intensity based on a selected optimal feature that can reveal the pain level for emotional reactions measured by fEMG:
We analyzed the data without subject matter to approve the EMG signal accuracy. To the best of our knowledge, this approach has not been done before.
We compared our result with different K values, i.e., using accuracy versus the number of K for K-NN classifiers (Fine, Medium, and Coarse), and the Medium K-NN has shown a shown a better accuracy than the others.
We showed, using real data to improve the results through our selected analysis, that an EMG signal can classify the level of pain very accurately.
We suggest that our method may establish the relevance of the pain assessment for health care facilities and improve approaches for proper treatment.
The rest of the paper is organized as follows:
Section 2 presents the background materials and methods used to collect the fEMG data, analysis, and identification techniques. This section also describes the prototype developed by the author for the fEMG signal acquisition and analysis methodology and further discusses the BioVid Heat Pain Database that is used as the benchmark for our contributions of fEMG signal analysis and feature extraction classification algorithms. The experimental results and implementation analysis are presented in
Section 3. Finally,
Section 4 summarizes the key result and steps for further research in this work.
2. Materials and Methods
Researchers from the academic and commercial sectors have used the characterization of fEMG for emotional expressions for more than 30 years. The facial muscles, being responsible for raising the eyebrows and corners of the mouth, are measured simultaneously with the EMG during experiments. Detection and analysis include the work of detecting the facial emotions of the person and analyzing this data to note how it is different from their normal face. In our previous paper [
28,
29,
30], the collection of the sEMG dataset was done on an experimental setup in our lab. The data is composed of the facial muscle movement that is formed by the emotion of the facial expressions by the insertion of our developed biosensor prototype. The prototype is a mixed single chip consisting of an analog front end (AFE), a successive approximation register analog to digital converter (ADC), and a digital core. The vital part of the bioelectric SoC is that EOG, EMG, ECG, and EEG signals can be effectively recorded through this. The collected data is evaluated and analyzed in this work in a MATLAB [
31] environment by signal processing tools and methods. An algorithm for a signal processing of raw EMG signals to be converted into the signals that represent the intensity of facial movements has also been developed.
The fEMG collection method uses one electrode per muscle that has multi-channel sEMG measurement capacity on wireless devices, providing a constant recording for at least a couple of hours. To acquire EMG signals, the ADS1192 [
32] Analog Front End (AFE) from Texas Instruments was selected. This unit delivers real-time sampling, 16-bit, delta-sigma (ΔΣ) analog-to-digital converters (ADCs) with an in-built programmable gain amplifier (PGA). The ADS1192 has a configurable gain from 1 to 12 and samples 2 channels of sEMG signals at the same time at 500 samples per second with a resolution of 16 bits. The ADS1192 is interfaced to the RTX4140 module via the SPI (Serial Peripheral Interface) bus [
30]. The SPI bus is boosted to deliver commands to the ADS1192 to be used for gain adjustments, channel configuration, etc. The SPI bus is also assisted to obtain the renewed data from the ADS1192, and the ADS1192 delivers available data for each channel such as lead-off detection [
30]. The ADS1192 manufacturer has a demonstration kit (ADS1192ECG-FE) [
32] which we used in our lab for the experiment. The board consists of test points that were used to connect the SPI bus to our prototyping board, employing a jumper to connect to the RTX4140 SPI ports using the provided docking station. The prototype also includes a software package that can communicate with the application through UDP and TCP protocols
In summary, we delivered a battery-powered Wi-Fi-based wearable IoT unit for the assessment and control of patients’ bio-signal for their health control at any time and from anywhere employing an IP-based network. We applied the device to monitor biomedical signals and applicable techniques for the real-time feature selection and classifications approach. In our previous paper, we showed the experimental result of the muscle activity of the face which formed upon emotional expressions. The main task was to find a specific classification technique for the collected facial sEMG signals. We also investigated an ML algorithm as a suitable method for the recognition and classification of EMG signals using the obtained facial EMG dataset. The SVM classifier was processed for the classification of facial sEMG signals related to the pain intensity dataset. The result obtained from the assessment effects and approaches showed that the pattern recognition and facial EMG signal classification are based on emotional expression. Even though the classification result is 99% [
24] accurate using the SVM technique, the dataset we collected was not clinically approved. It was based on the experimental procedure used in our lab. However, the result shows that SVM is an effective classification technique for a dataset related to facial emotion expression using experimental data. We need clinically approved data in context for our proposed use of fEMG as a communication tool for healthcare services.
The publicly available and clinically verified datasets are strongly recommended to be shared among researchers to accelerate progress in pain recognition research and facilitate the comparison of competing approaches. A special thanks to the BioVid Heat Pain database [
28] group for being willing to share their clinically approved database of biopotentials to advance an automated pain recognition system. The dataset contains the painful heat stimuli of eighty-five participants under measured situations, and fEMG signals are one of the collected signals. A total of 156 features were extracted from the mathematical groupings of amplitude, frequency, stationarity, entropy, linearity, variability, and similarity. In this paper, we focus on the fEMG of the BioVid Heat Pain database for use in pain assessment and pain detection by showing a significant improvement over the current techniques. The dataset classification phases are described in the following sections: data collection, data pre-processing, feature extraction, feature selection, and classification.
2.1. Benchmark Datasets
Our paper investigates the possibilities of acquiring and processing the fEMG signals to extract the time-frequency domain signal intensity (by various filtering, rectification, and similar techniques) for further measuring the sensitivity of the pain signals.
In this paper, we use the BioVid Heat Pain Database [
6,
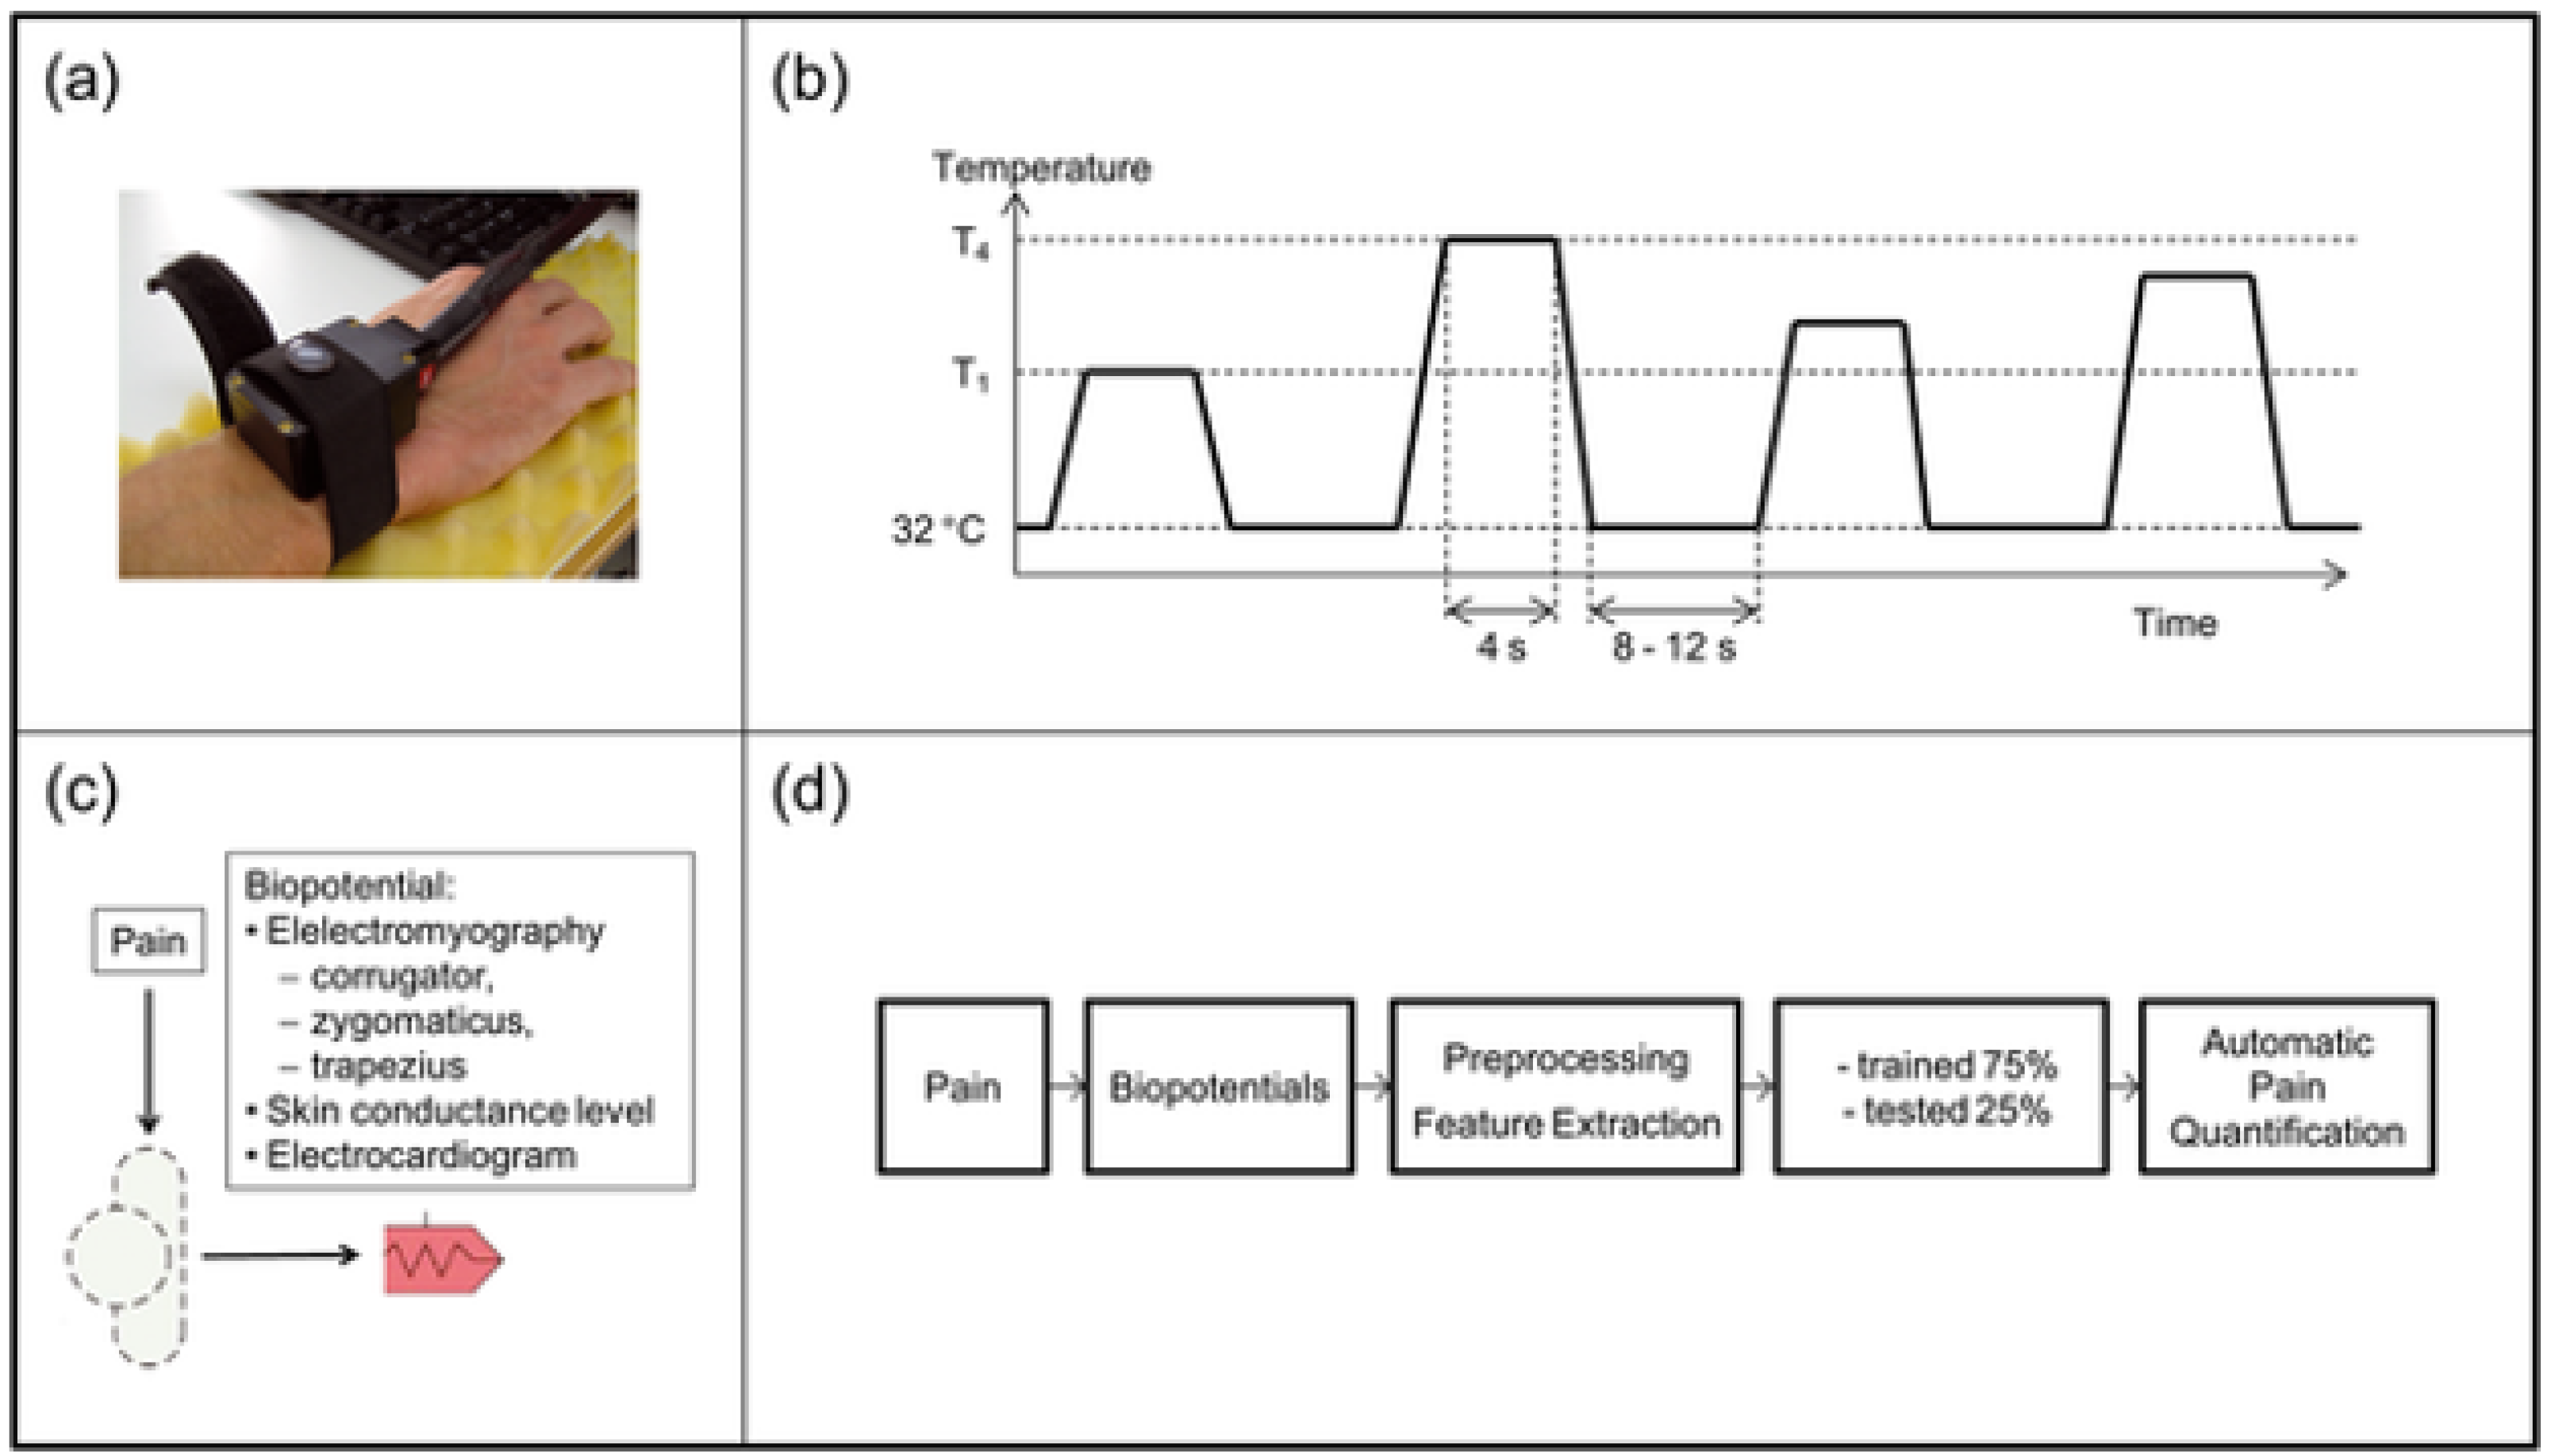
28], where the study was conducted by the ethics committee of the University of Ulm (Helmholtzstraße 20, 89081 Ulm, Germany). All contributors provided written informed consent to participate in the study. The experimental setup [
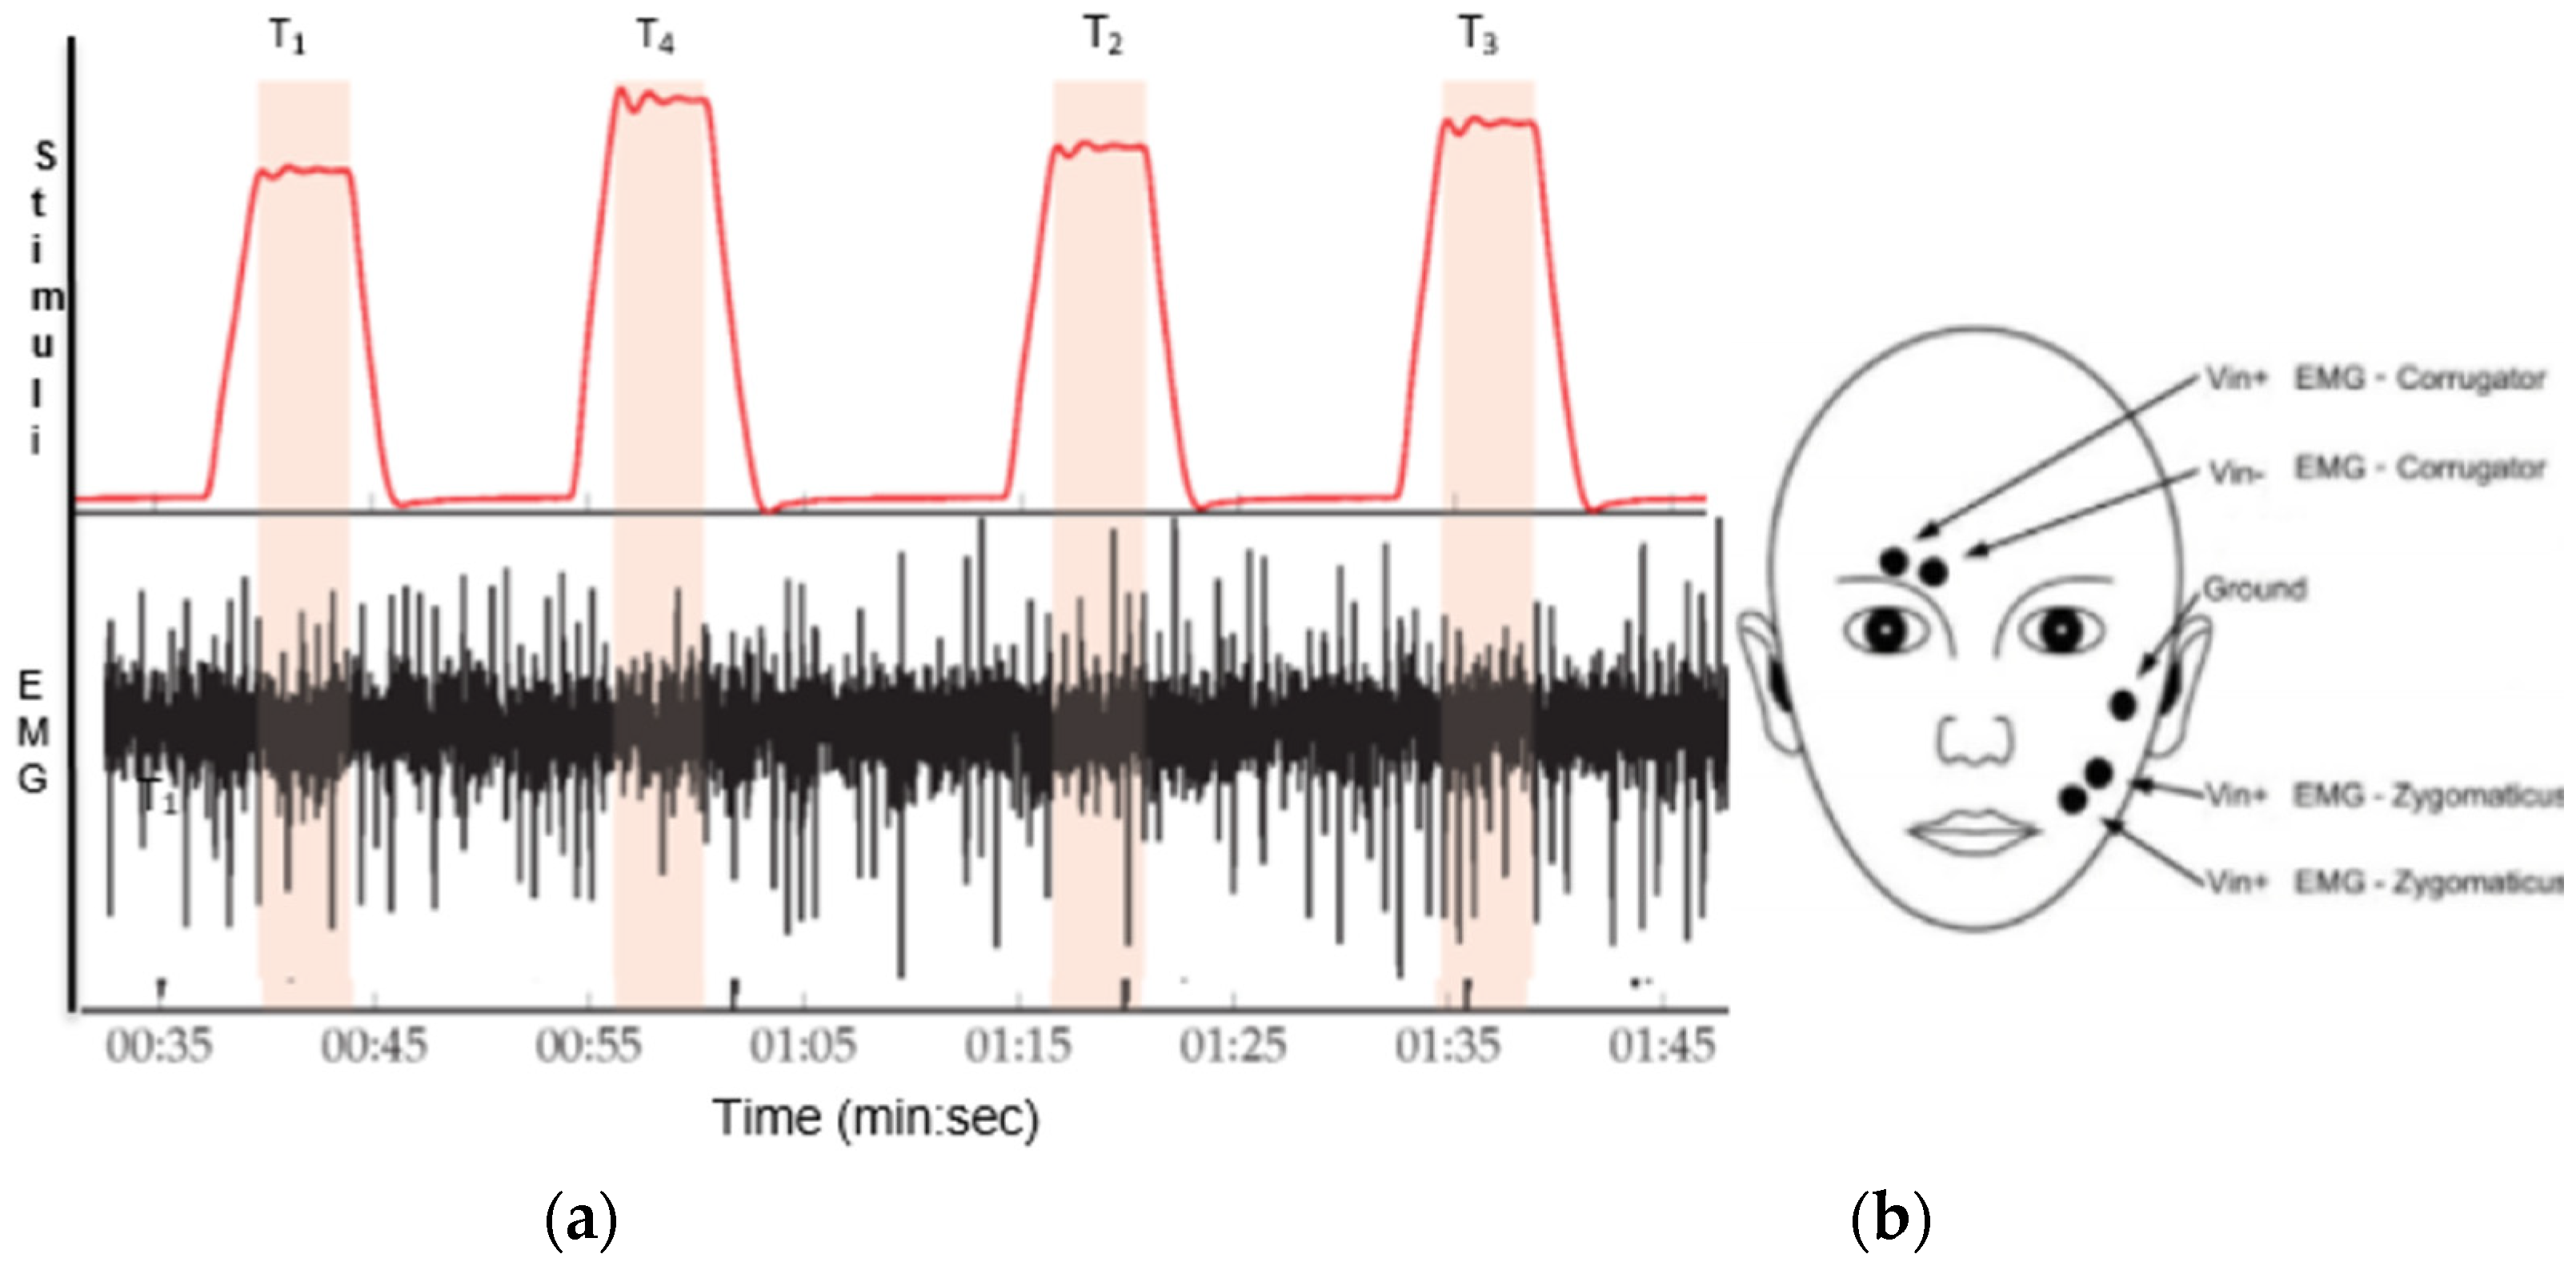
27], that was used for pain elicitation on the right arm. Before the data collection happened, each subject’s pain threshold was investigated. These thresholds were applied as the temperatures for the lowest and highest pain levels (T
1 and T
4, respectively) together with two additional intermediate levels (T
2 and T
3), thus obtaining four pain levels. These temperatures were equally distributed as described in their paper [
26], between P
1 and P
4 and are not over 50.5 °C, and the baseline (no pain) was 32 °C. We used the bench band dataset for our experiment; the BioVid heat Pain dataset collecting process is explained in detail [
32] and indicated in
Figure 1.
2.1.1. Facial Expression Techniques
One of the ways to collect and analyze facial expressions is by tracking fEMG activities. The signal can show the movement of facial muscles with electrodes placed on the surface of the skin. There are two main facial muscles used for emotion recognition using fEMG:
Corrugator muscle—causes the eyebrow wrinkle, forehead wrinkling, and mainly expresses negative emotions such as pain.
Zygomaticus muscle—located around the cheekbone and mouth corner and moves the mouth up and out; naturally related positive emotions such as smiling.
Table 1 is discussing the benefits and limitations of fEMG:
2.1.2. Data Analysis
Our research also considered the fEMG from the EMG corrugator and EMG zygomaticus for the use of EMG to investigate and to characterize using the ML approach to qualify the nonstop monitoring of patients in the health care center or ICU. The target task and application of this paper is to focus on describing the method for the assessment of acute pain which results in changes in the facial electrical activity of skeletal muscles as measured by an EMG signal.
Part of the experimental sequence on which we evaluated the EMG signals were initially filtered with a Butterworth bandpass filter (20–250 Hz). For further noise reduction, a signal separation method (“decomposition analysis”) was subsequently applied [
33]. Characteristics describing the amplitude, variability, stationarity, entropy, and frequency characteristics of the respective signal were extracted from the processed signals [
33]. The database involved healthy people subjected to heat stimuli in four altered pain stages (
P1,
P2,
P3, and
P4). The standard (no pain) was 32 °C.
T1 is the threshold temperature stage. The maximum temperature which was used for tolerance heat pain stimulus (
T4) is 50.50 °C. The stage of the temperature was divided equally, and the middle-temperature stage was calculated as Equations (1) and (2).
Every pain stage, including no pain, was applied 20 times, making 100 responses. Each stimulus was applied for 4 s with pauses of 8–12 s between the stimuli. Bio-signals such as Galvanic skin response (GSR), EMG, ECG, EEG, and video signals were also recorded using a Nexus 32 amplifier [
34]. However, there are many situations where webcam-based facial expressions could not be collected. Therefore, our consideration focused on the facial expression analysis as a tool for measuring pain from the EMG-corrugator and EMG-zygomaticus for continuous pain estimation (
Figure 2).
Figure 3 shows the fEMG signal with the corresponding applied level of heat stimuli.
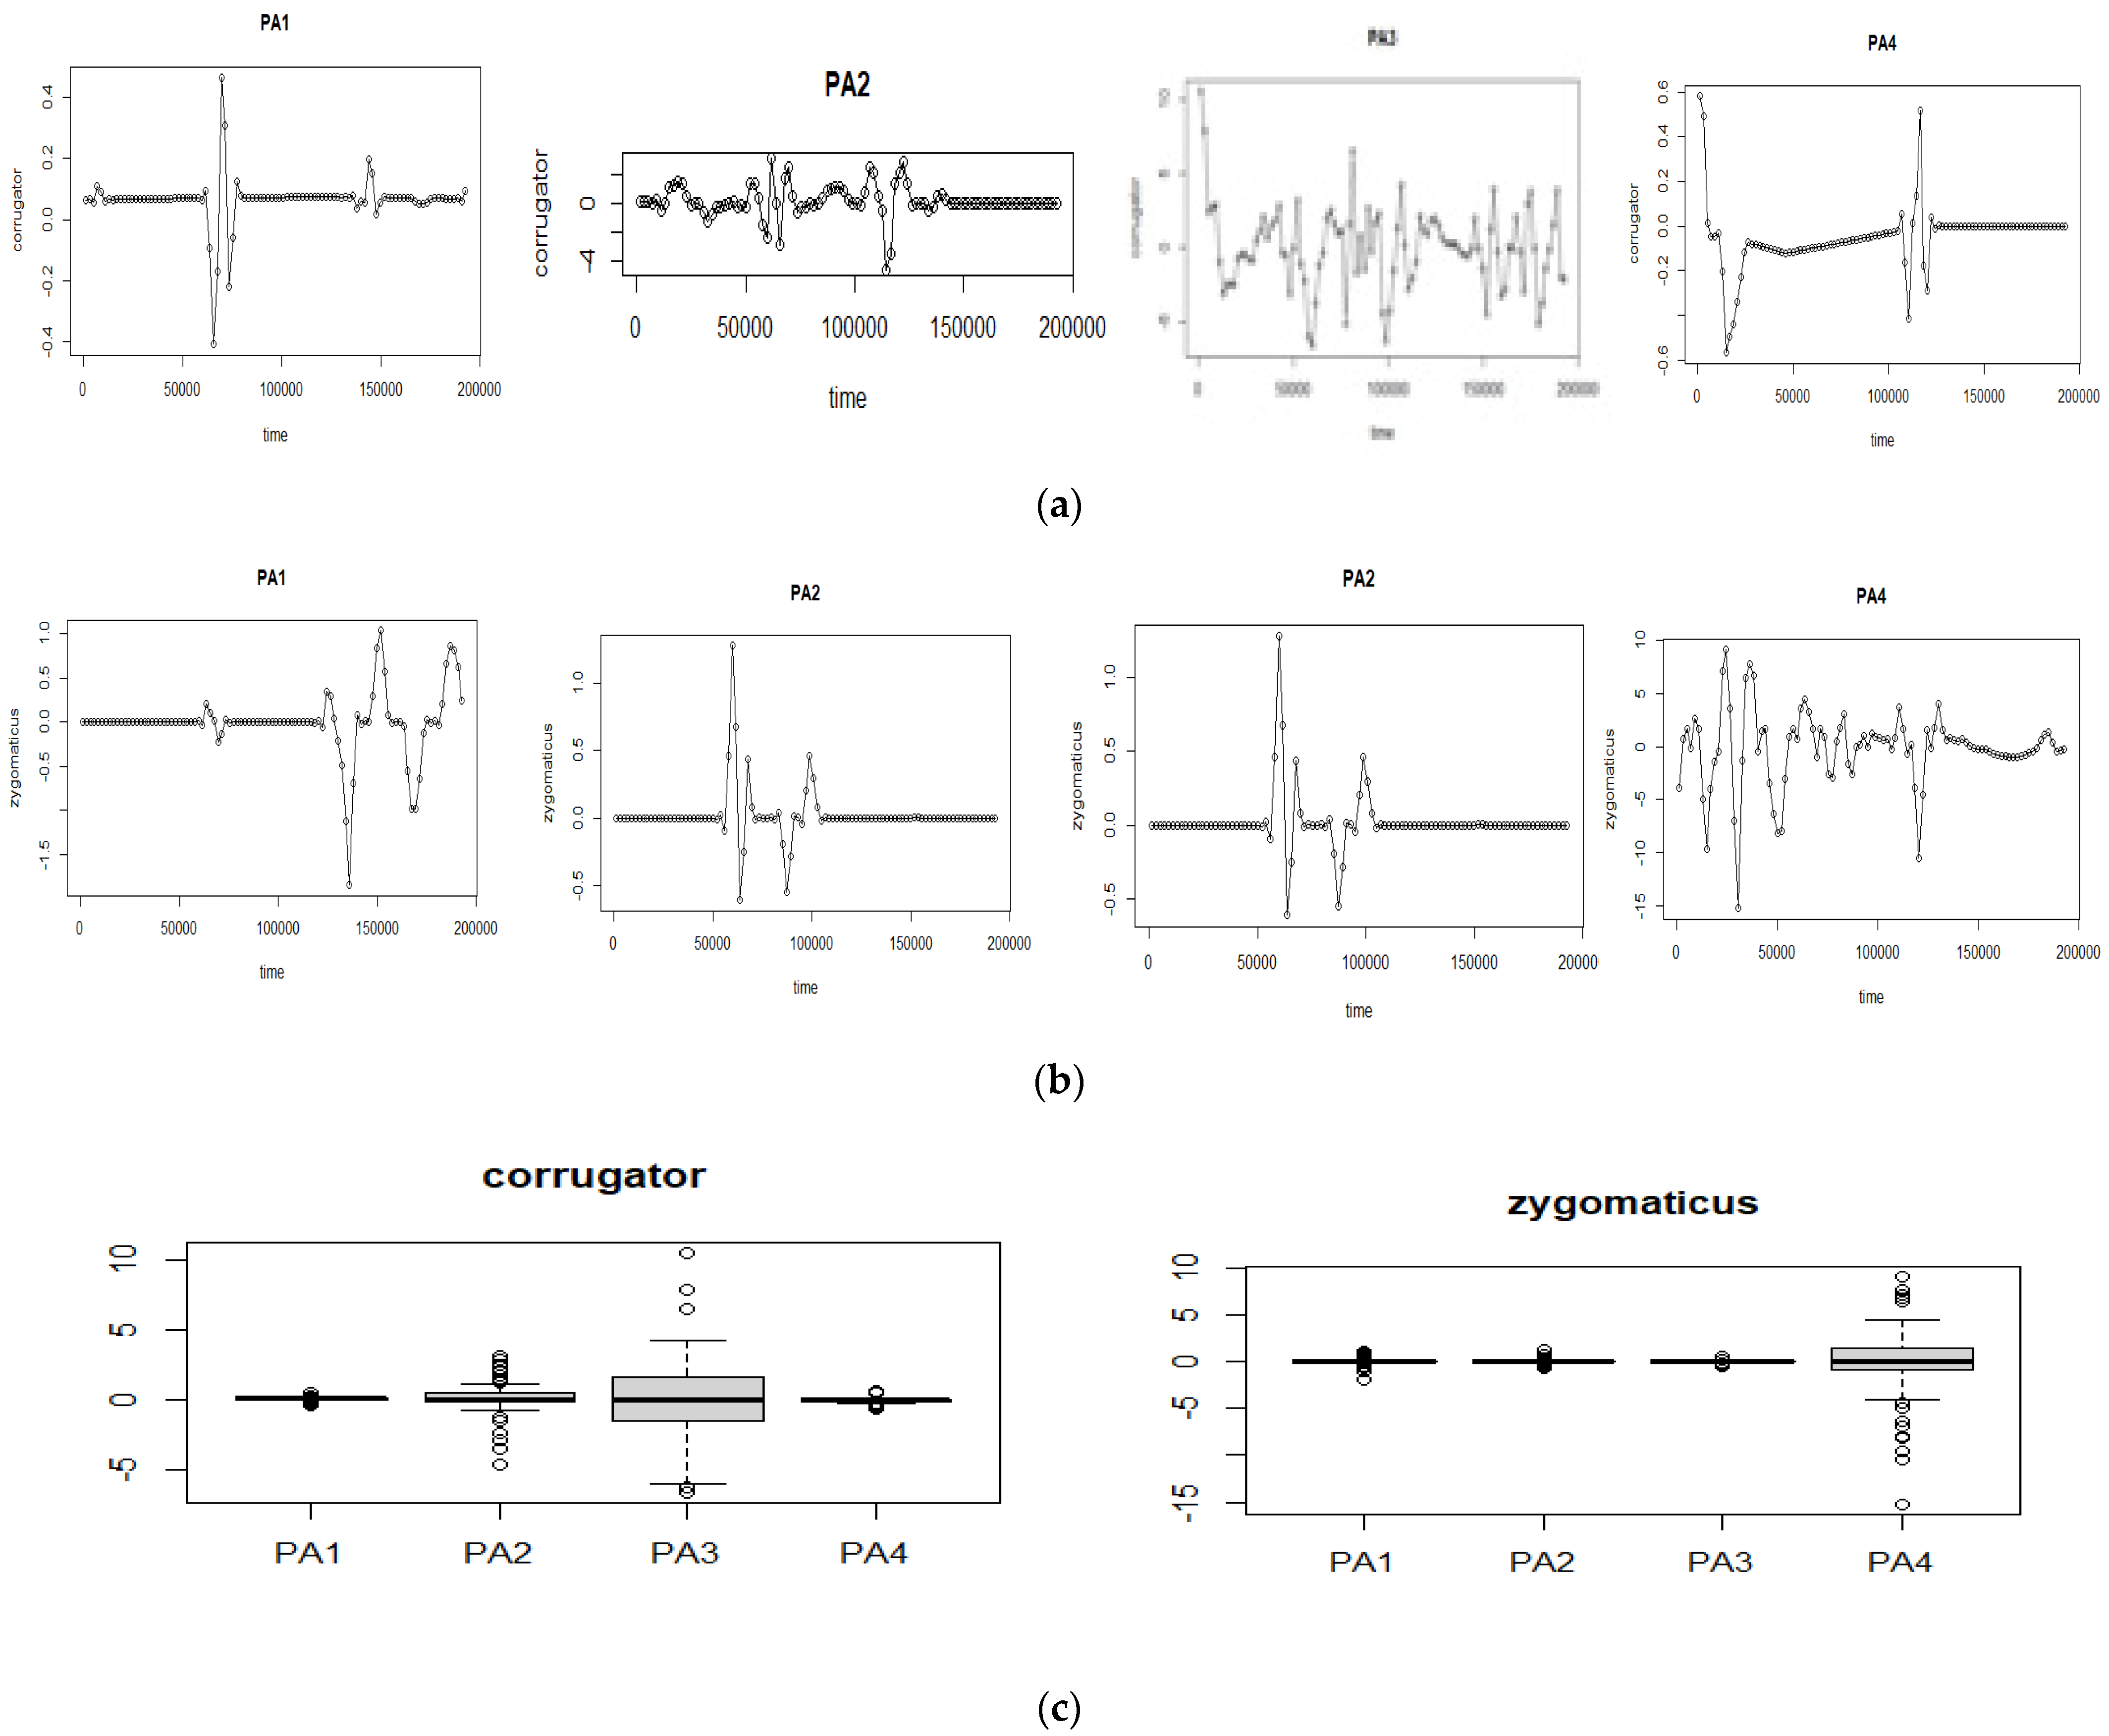
The optimal pain classification using fEMG signals is shown by applying the selected fEMG features as the input, and the pain stage PA
1–PA
4 as the output for each EMG-zygomaticus and EMG-corrugator, as illustrated in
Figure 4.
2.2. Preprocessing
The use of EMG investigations to characterize has a different approach to qualifying the nonstop monitoring of patients in the ICU. The target task and application of this paper is to focus on describing the method for the assessment of acute pain which results in changes in the facial electrical activity of skeletal muscles with the measurement of sEMG signal.
Alternatively, the activity of electromyography (EMG) signals, in particular of the zygomatic and corrugator muscles, could provide information on pain intensity [
12,
35]. Part of the experimental sequence on which we evaluated the EMG signals were filtered with a Butterworth bandpass filter (20–250 Hz). For further noise reduction, a signal separation method (“decomposition analysis”) was subsequently applied [
35]. Characteristics describing the amplitude, variability, stationarity, entropy, and frequency characteristics of the respective. The database involved healthy people and their processed signals became extracted features that determined the amplitude, variability, stationarity, entropy, and frequency characteristics of the respective signal. As described earlier, the filtered EMG signal was processed with a Butterworth bandpass filter (20–250 Hz). A signal decomposition method (“decomposition analysis”) was then applied to further reduce noise [
33].
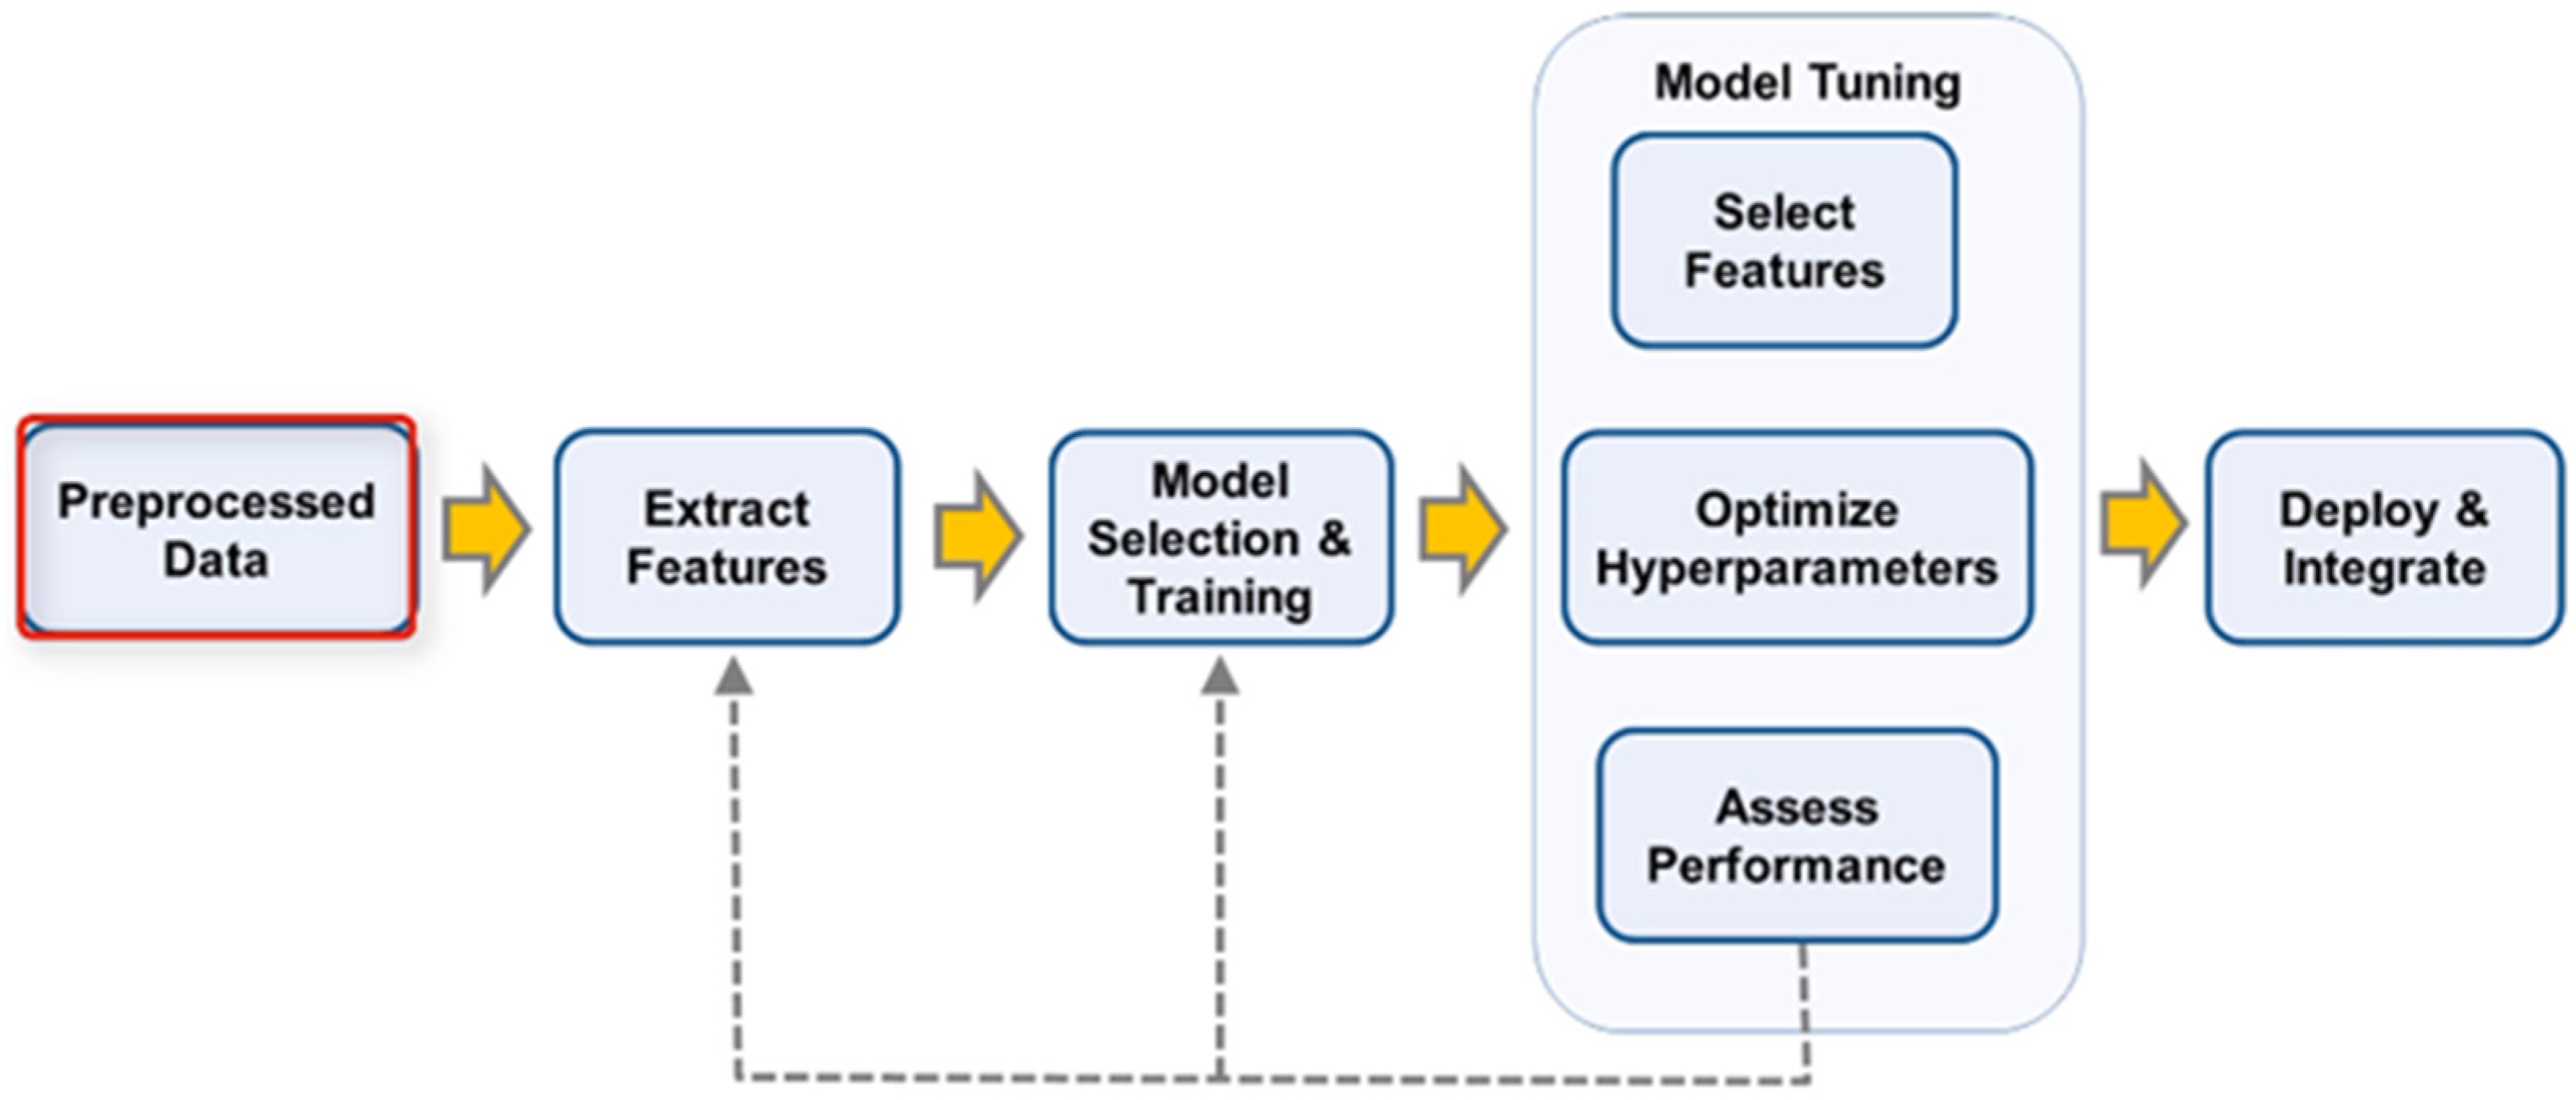
Figure 5; describes the undertaken stages for the dataset classification stage.
We were able to analyze the recorded EMG with pain signal by comparing the activation that occurred because of pain and the onset of the signal as determined by amplitude, frequency content, and timing of the signal. We used the rectified fEMG that were recorded, performed preprocessing steps to eliminate the dc onset, extracted the interfaces, and processed them at a sampling rate of 512 Hz. The Butterworth filter of order 4 with cutoff frequencies at 20–250 Hz was applied to the EMG signal for processing.
The Preprocessing of the EMG signal was already performed using these steps:
The the raw signal was visualized to quantify the noise intensity and the movement that corresponded to the stimulation of the pain.
The EMG signals were filtered between 20–250 Hz using the Butterworth filter.
The level of pain was measured practically by heat using four pain thresholds (T
1–T
4) with each 5.5 s “pain window” that corresponded to the base concerning the baseline during the “non-pain window” (see
Figure 2).
The eruptions of EMG activity are distinguished by using the Hilbert Spectrum [
34].
2.3. Feature Extraction
The Time-domain of the sEMG features lies in four groups under the mathematical specifications [
36]:
Calculations that depend on the amplitude amount of the sEMG signal, which consist of features energy information of the signal (e.g., RMS) and other information of the signal;
The features include the frequency information (e.g., ZC and SSC) where a threshold parameter needs to be predefined;
Coefficients of the prediction model (e.g., AR);
Features extracted from two adjacent or several segments of an sEMG signal (e.g., MAVS).
Moreover, frequency domain features are extracted from power spectral density. Time-domain features are more commonly found in sEMG pattern recognition studies, and studies revealed that the frequency domain features did not show better performance compared to the time domain ones [
36].
The considered EMG features are based according to the previous studies [
28] which tend to show high classification accuracy:
APeak as amplitude peak of the EMG signal;
ARMS as amplitude quadratic mean of the EMG signal;
Vrange as variation width of the EMG signal;
Vstd as standard deviation of the EMG signal;
Fzc as the number of zero crossings of the EMG signal (frequency measurement);
Ssd as standard deviation of EMG signal components (degree of stationary); and
EShannon as the entropy of the EMG signal according to Shannon.
The features were extracted for each of the EMG signals, i.e., for the EMG -zygomaticus and EMG-corrugator. Then, the features were independently standardized (z-transformation).
Further, as we mentioned earlier, the features were computed on the preprocessed windows of 5.5 s. In this regard, there were a total of 159 extracted features to be evaluated;
Table 2 shows the feature list and their calculations.
The extracted features from the raw data are the input variables for the source to distinguish the pattern and classifiers. The extracted features can show the advanced information of the pattern in the feature space related to the raw data. Some of the features extracted from the fEMG signal have been investigated because of facial expression and emotional state recognition applications. We describe more details on the process of EMG feature selection in the results section. The results from the sEMG feature comparison were obtained according to the study [
27] by setting a boundary on the number of features obtained for the estimation of the pain strength. The statistical evaluation of the fEMG features was manually estimated on the test periods P
0–P
4; the fEMG feature medians were investigated, and a statistical comparison of the feature medians was performed.
In addition, for feature detection, from the time domain feature extraction, the mean absolute value (MAV), number of zero-crossings (ZC), waveform length (WFL), number of slope sign changes (SSC), root mean square (RMS), and the frequency domain feature extraction auto-regression coefficients (AR) were considered. The features and their description [
29] are for fEMG analysis. The individual feature was z transformed for the normalization of the signals indicated, and the extracted feature from the study is available at [
37] after the raw dataset was preprocessed for signals.
2.4. Classification
The K-NN classification algorithm was chosen after testing several machine learners’ classifier algorithms. Among them, K-Nearest Neighbor, Neural Networks, SVM, and Decision Trees were involved [
37,
38,
39]. K-NN shows a promising approach and results for the classification of the desired pain intensities since the classifier approach is based on deciding and comparing new unknown testing data with training or baseline data. The k Nearest Neighbor (KNN), is a supervised classifier that has a main parameter to obtain the cluster label of the data to find the distance of the data within the neighborhood data and compare the distance, assign the clusters, and visualize the cluster points. This is done by using the Euclidean distance calculation method or similar other methods. Equation (3) shows the Euclidean distance between two points in n-dimensional space.
The user defines the K-Means method to classify the given data set into K clusters, i.e., the value of K (number of clusters). The clustering algorithm minimizes the sum of squared distances between all points and the cluster center.
The calculation or the approach we used to determine the k function or decision rules for the K-NN algorithm is the majority voting scheme [
40,
41] which deepens on the category) or class that has one vote for each instance on the class set of the sample K-neighborhood samples. In that case, the new data sample is classified according to the highest number of votes in the class. This majority voting is more commonly used because it is less sensitive to outliers in emotion classification. In this case, the K-NN classification algorithm to classify the amount of pain intensity in patients could deliver valuable evidence for health care providers and aid in treatment assessment. The analysis had respective average performances of 99.4%. The figures show the actual dataset used for the classification of the pain level and the result of the K-classifier.
2.4.1. FEMG Classification
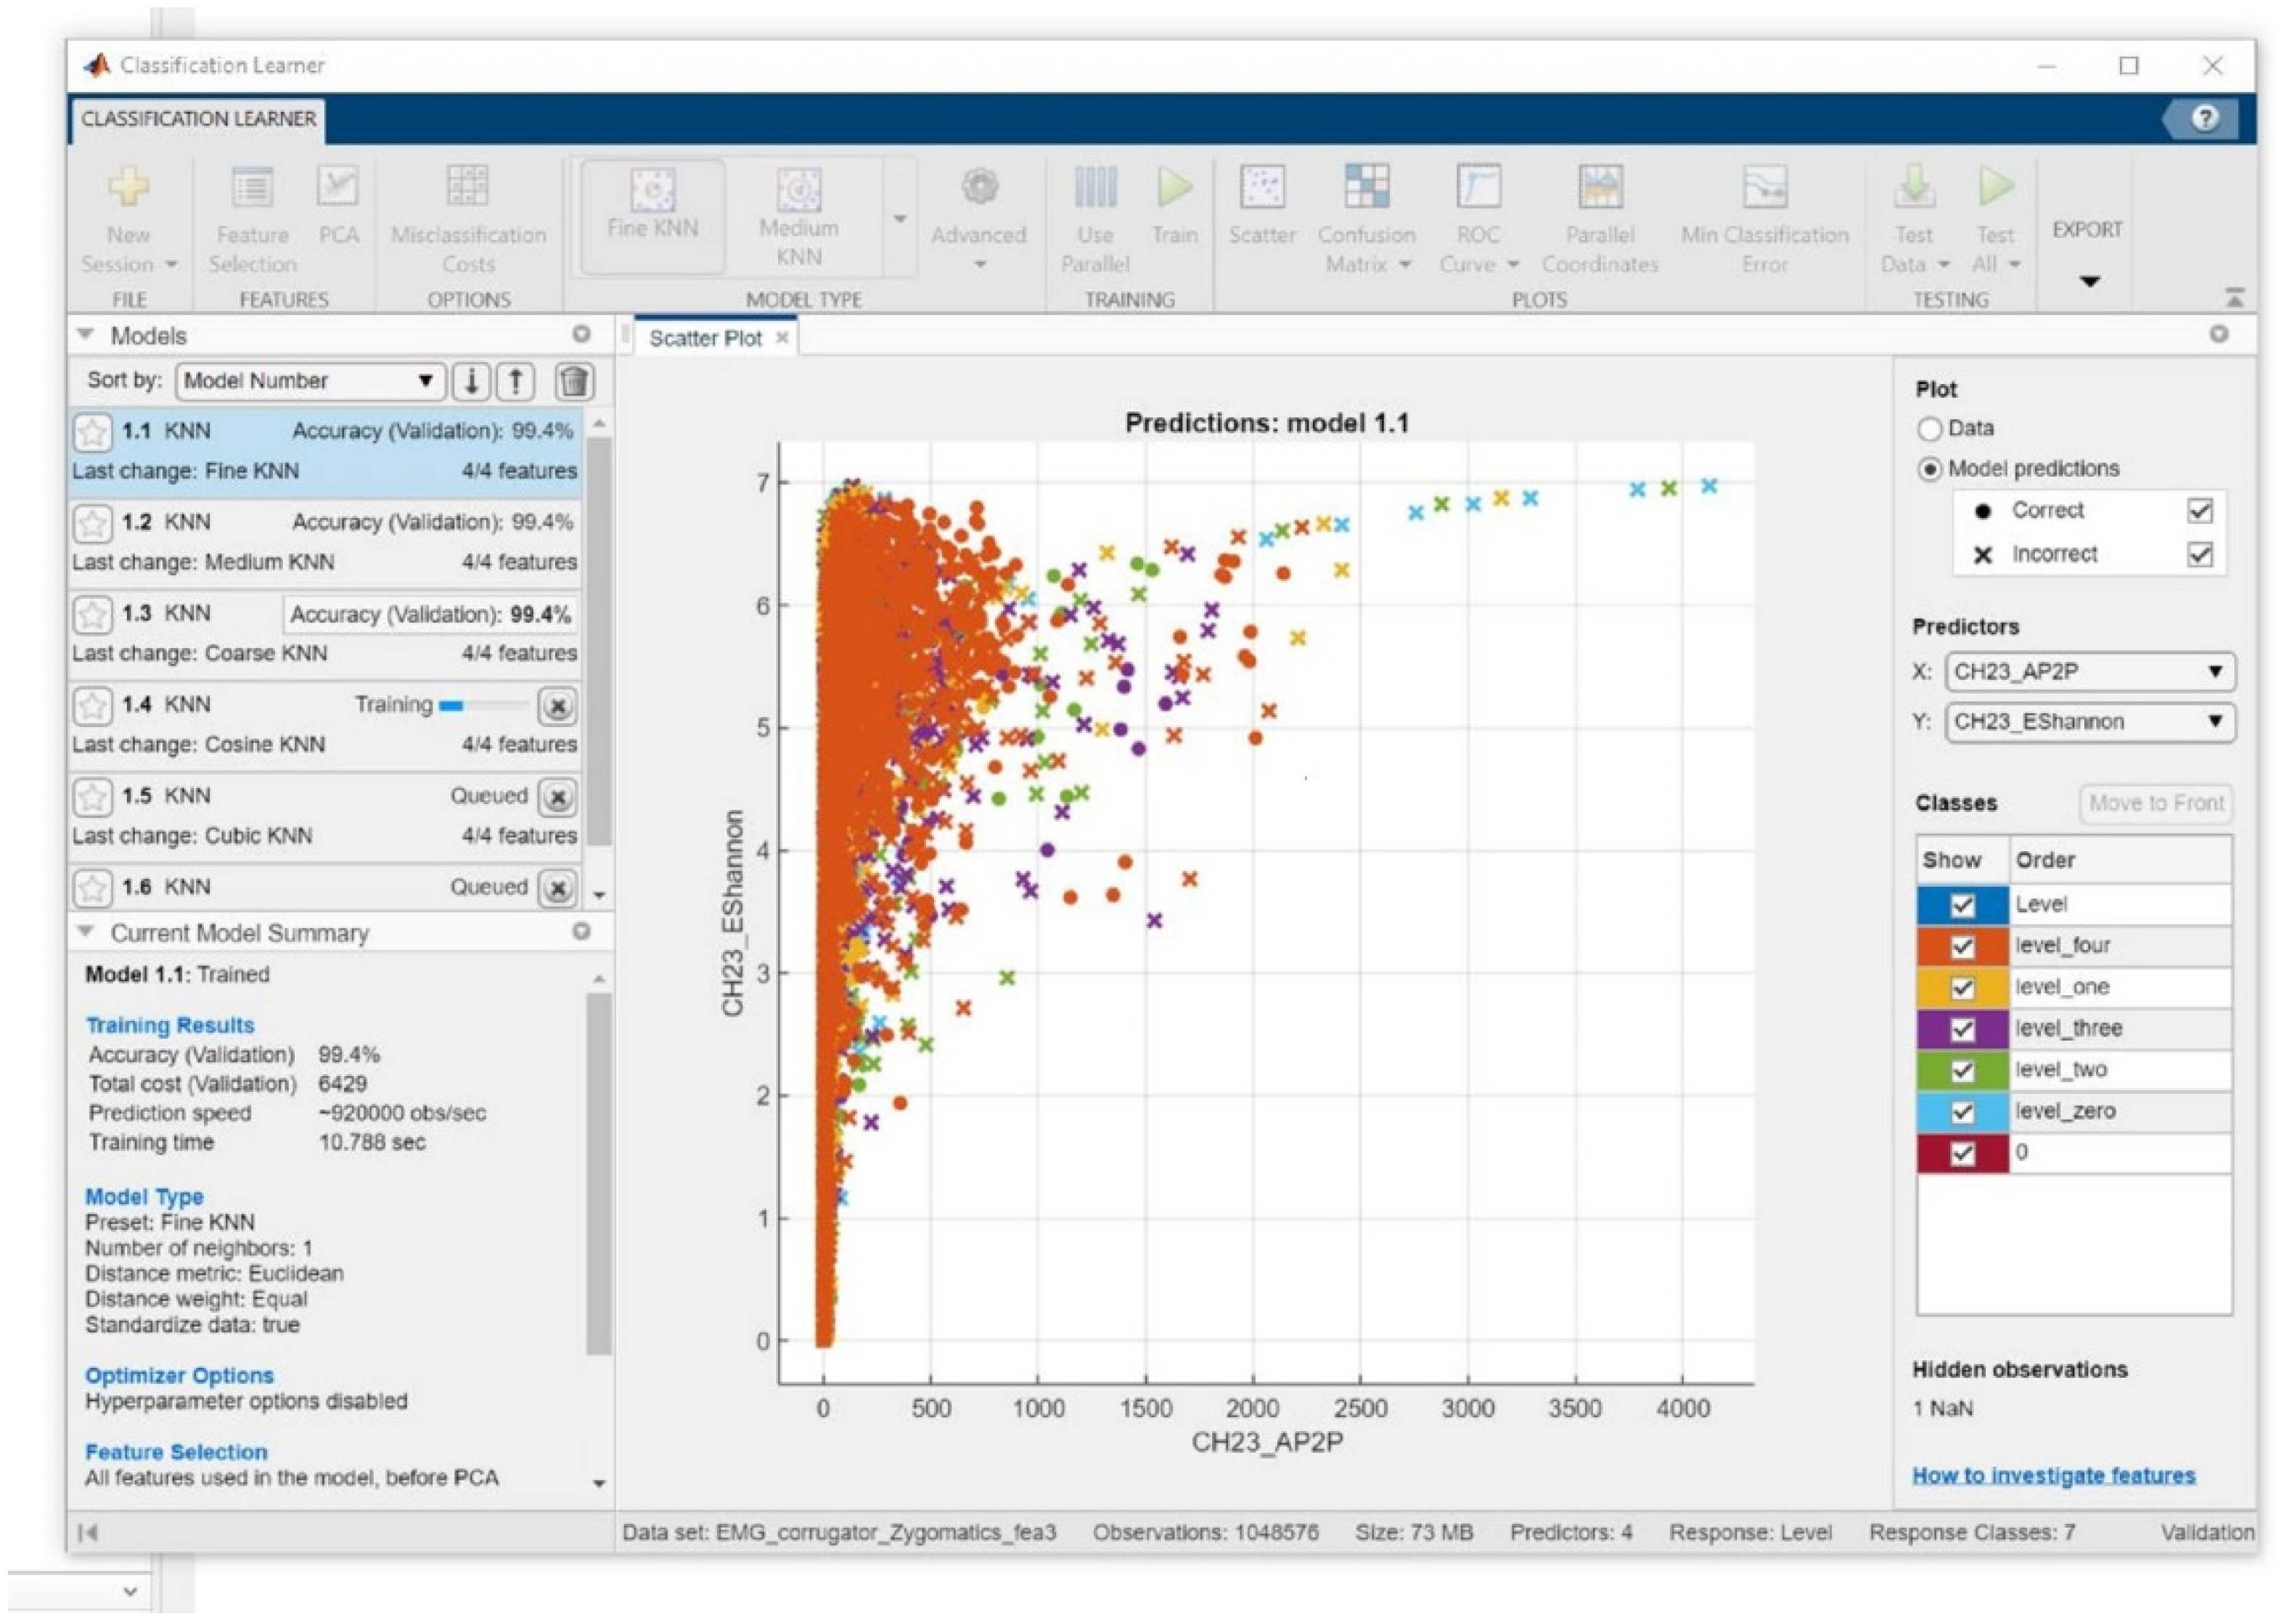
In this work, we considered the BioVid Heat Pain database that includes EMG signals of 159 features from 85 subjects for five levels of pain intensity. Each subject experienced 100 trials for each emotion. Therefore, the database is composed of a sum of 42,500 fEMG signals for each zygomaticus and corrugator signal for 159 features. The resultant features are grouped into a set of training and testing vectors for classifying the emotions using EMG signals. The classification ability of a statistical feature set can be measured through classification accuracy by averaging five times over a 5-fold cross-validation before the classification. The extracted 159 features were subjected to statistical analyses by checking and verification checks. The initial steps were to eliminate out-liners of the features that include either zero or the static number for all conditions. Therefore, our evaluation is based on the relationship between the pain threshold (0 vs. 1 vs. 2 vs. 3 vs. 4) and EMG signal characteristics in
Figure 6. Moreover, we noted that the amplitude features P
2P and the entropy feature E
Shannon were previously investigated as the features for accurate classification of the pain intensity on both zygomaticus and corrugator signals by using the K-NN classifier [
42,
43] We showed an improved method for better classification accuracy by deploying the fEMG feature independent of the subject. The classification was performed on the K-NN algorithm by choosing the value of k that depends on the majority voting. One of the reasons for using K-NN is because it is less sensitive to outliers [
44]. Further, the presentation of the accuracy estimation has shown a considerable increase in classification accuracy. In this paper, K = 10 delivers the higher classification value rate on record of the pain level emotions related to other K values.
Figure 6, shows The maximum classification rate 99.4% was obtained for the training; however, in the same data analysis with the consideration of subject bias, the highest accuracy of classification was 38.89%. The subject bias dataset has different categories for male and female and age which helps the classification to obtain a desirable result. The fact that male and female subjects do not experience the same emotional inducement stimuli, and as are compared when they are similar in age, the range can make a significant difference in the resulting circumstances.
2.4.2. Validation
The application of the ML algorithm to classify the level of pain in patients could deliver valuable information and evidence for health care providers and aid treatment assessment. In this work, the classification performance gives an average of 99.4% accuracy. The process for the classifications is performed on the features that consist of the discrimination between the baseline and the pain tolerance level (P
1 verse P
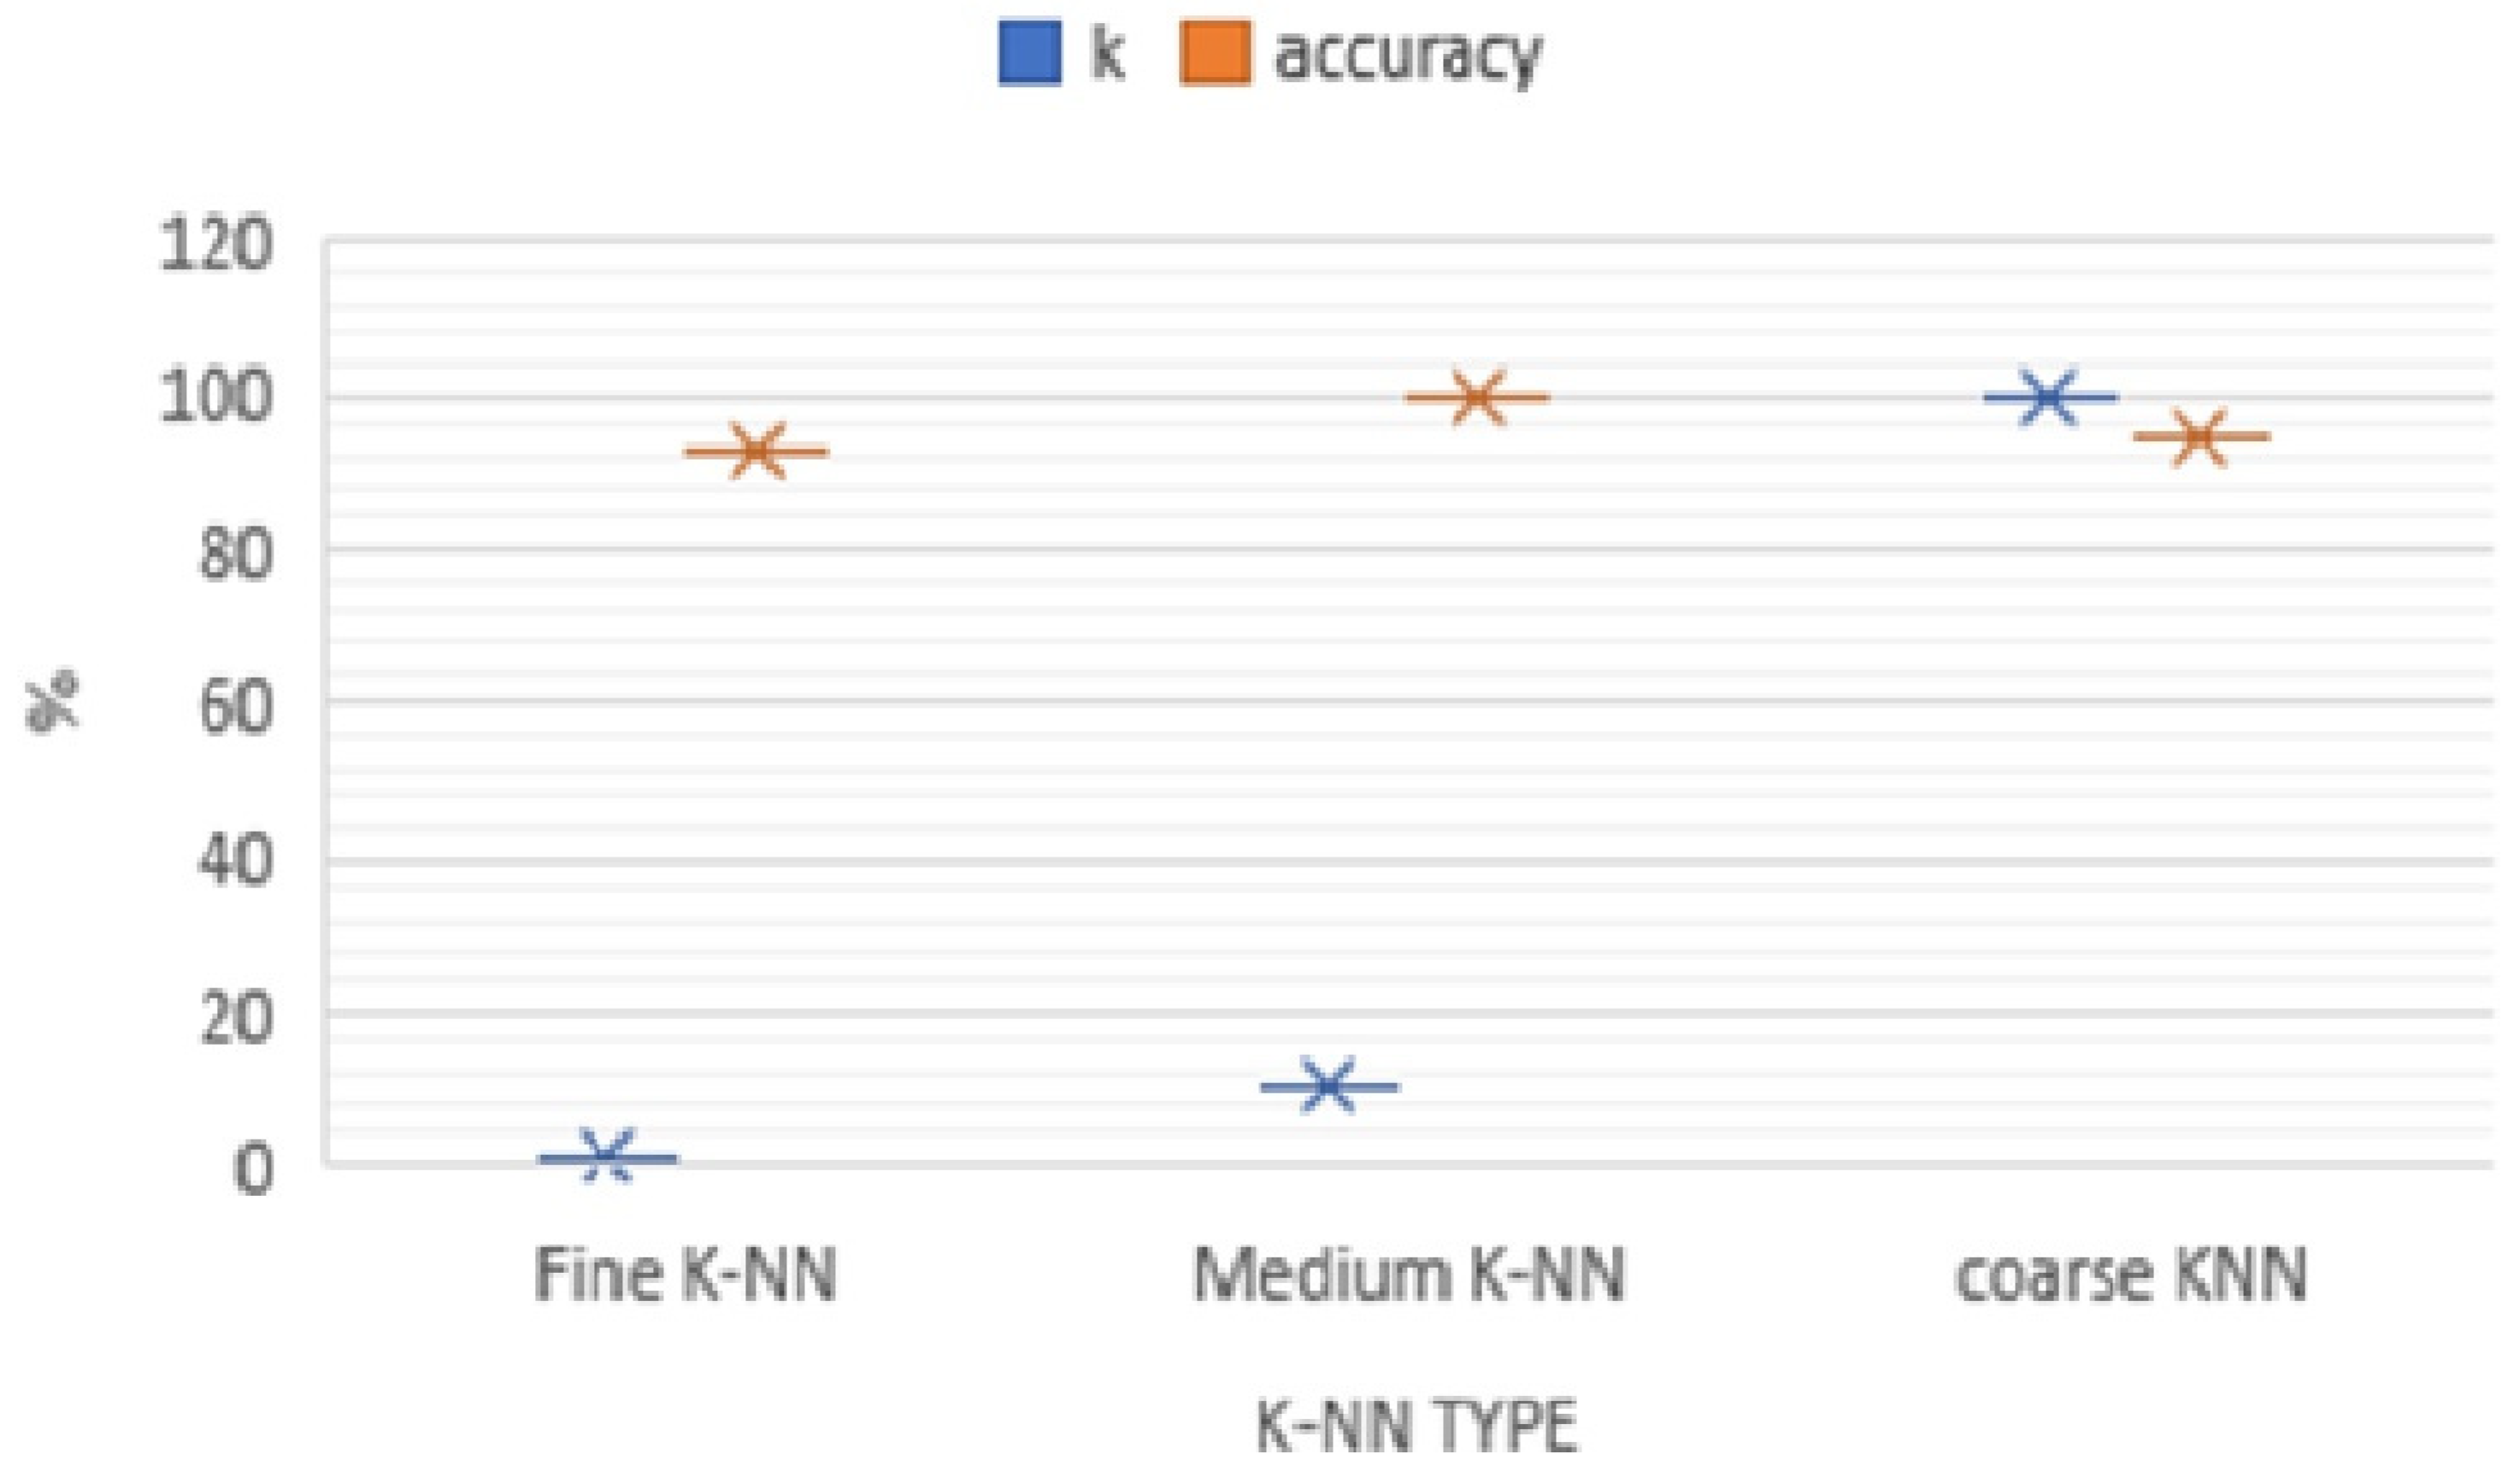
4) independent of the out subject bias. Three of the K-NN classifiers: Fine, Medium, and Coarse K-NN are considered for the classification. The procedure also later included the Principal Component Analysis (PCA) algorithm to reduce the computing and aid faster characterization. The classification analysis results demonstrate the relevance of the pain assessment for health care facilities and approaches.
Figure 7 shows the K-NN classifiers (K-NN Fine, Medium, and Coarse K-NN) that are compared on 8501 instants and the accuracy of the 5-fold cross-validations techniques of the obtained classification accuracy.
3. Results
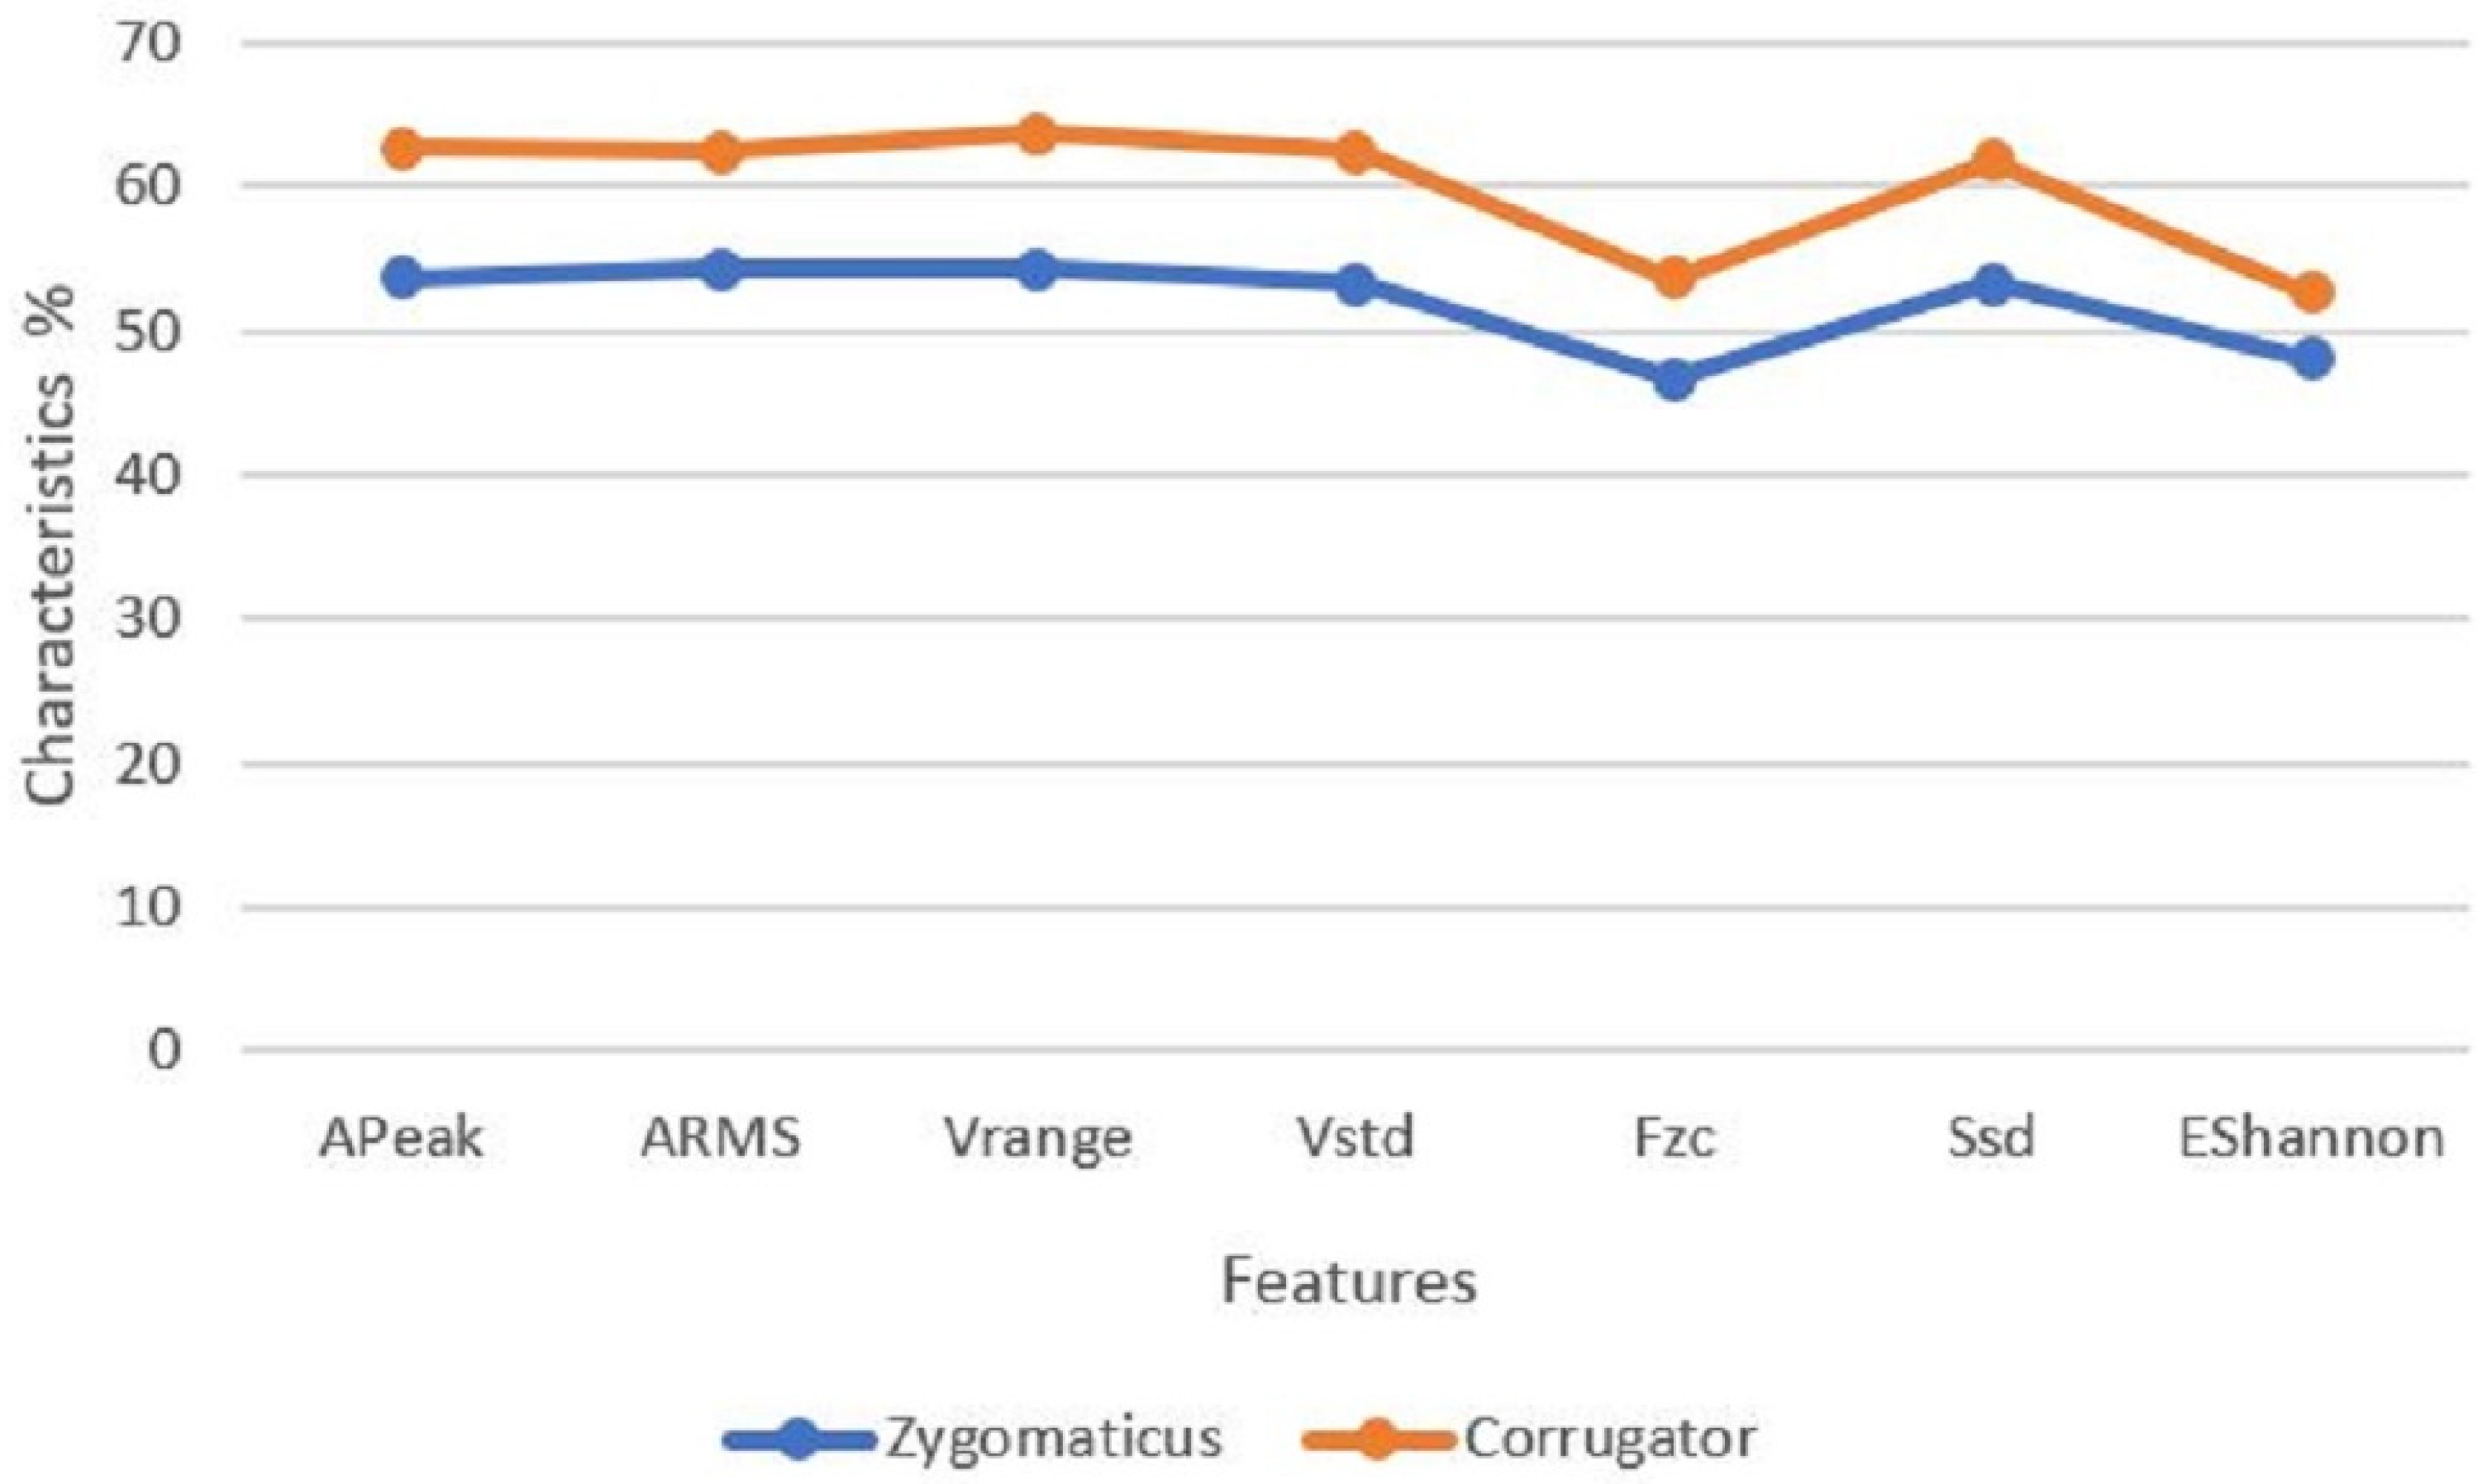
The feature selection algorithm was achieved by the preselection of all the extracted 159 features using statistical analyses, checking, and verification checks. The initial step was to eliminate outliners of the features that included either a zero or a static number for all conditions. The relationship among pain thresholds (0 vs. 1 vs. 2 vs. 3 vs. 4) and EMG signal characteristics (A
Peak, A
RMS, V
range, V
std,
Fzc, S
sd, and E
Shannon) for the zygomaticus verse corrugator of the experimental results with the experimental conclusions is illustrated in
Figure 8.
We proved that the signal characteristics (APeak, ARMS, Vrange, Vstd, Fzc, Ssd, and EShannon) for the zygomaticus verse corrugator with the experimental results that the corrugator had a better performance than the zygomaticus for classification of pain.
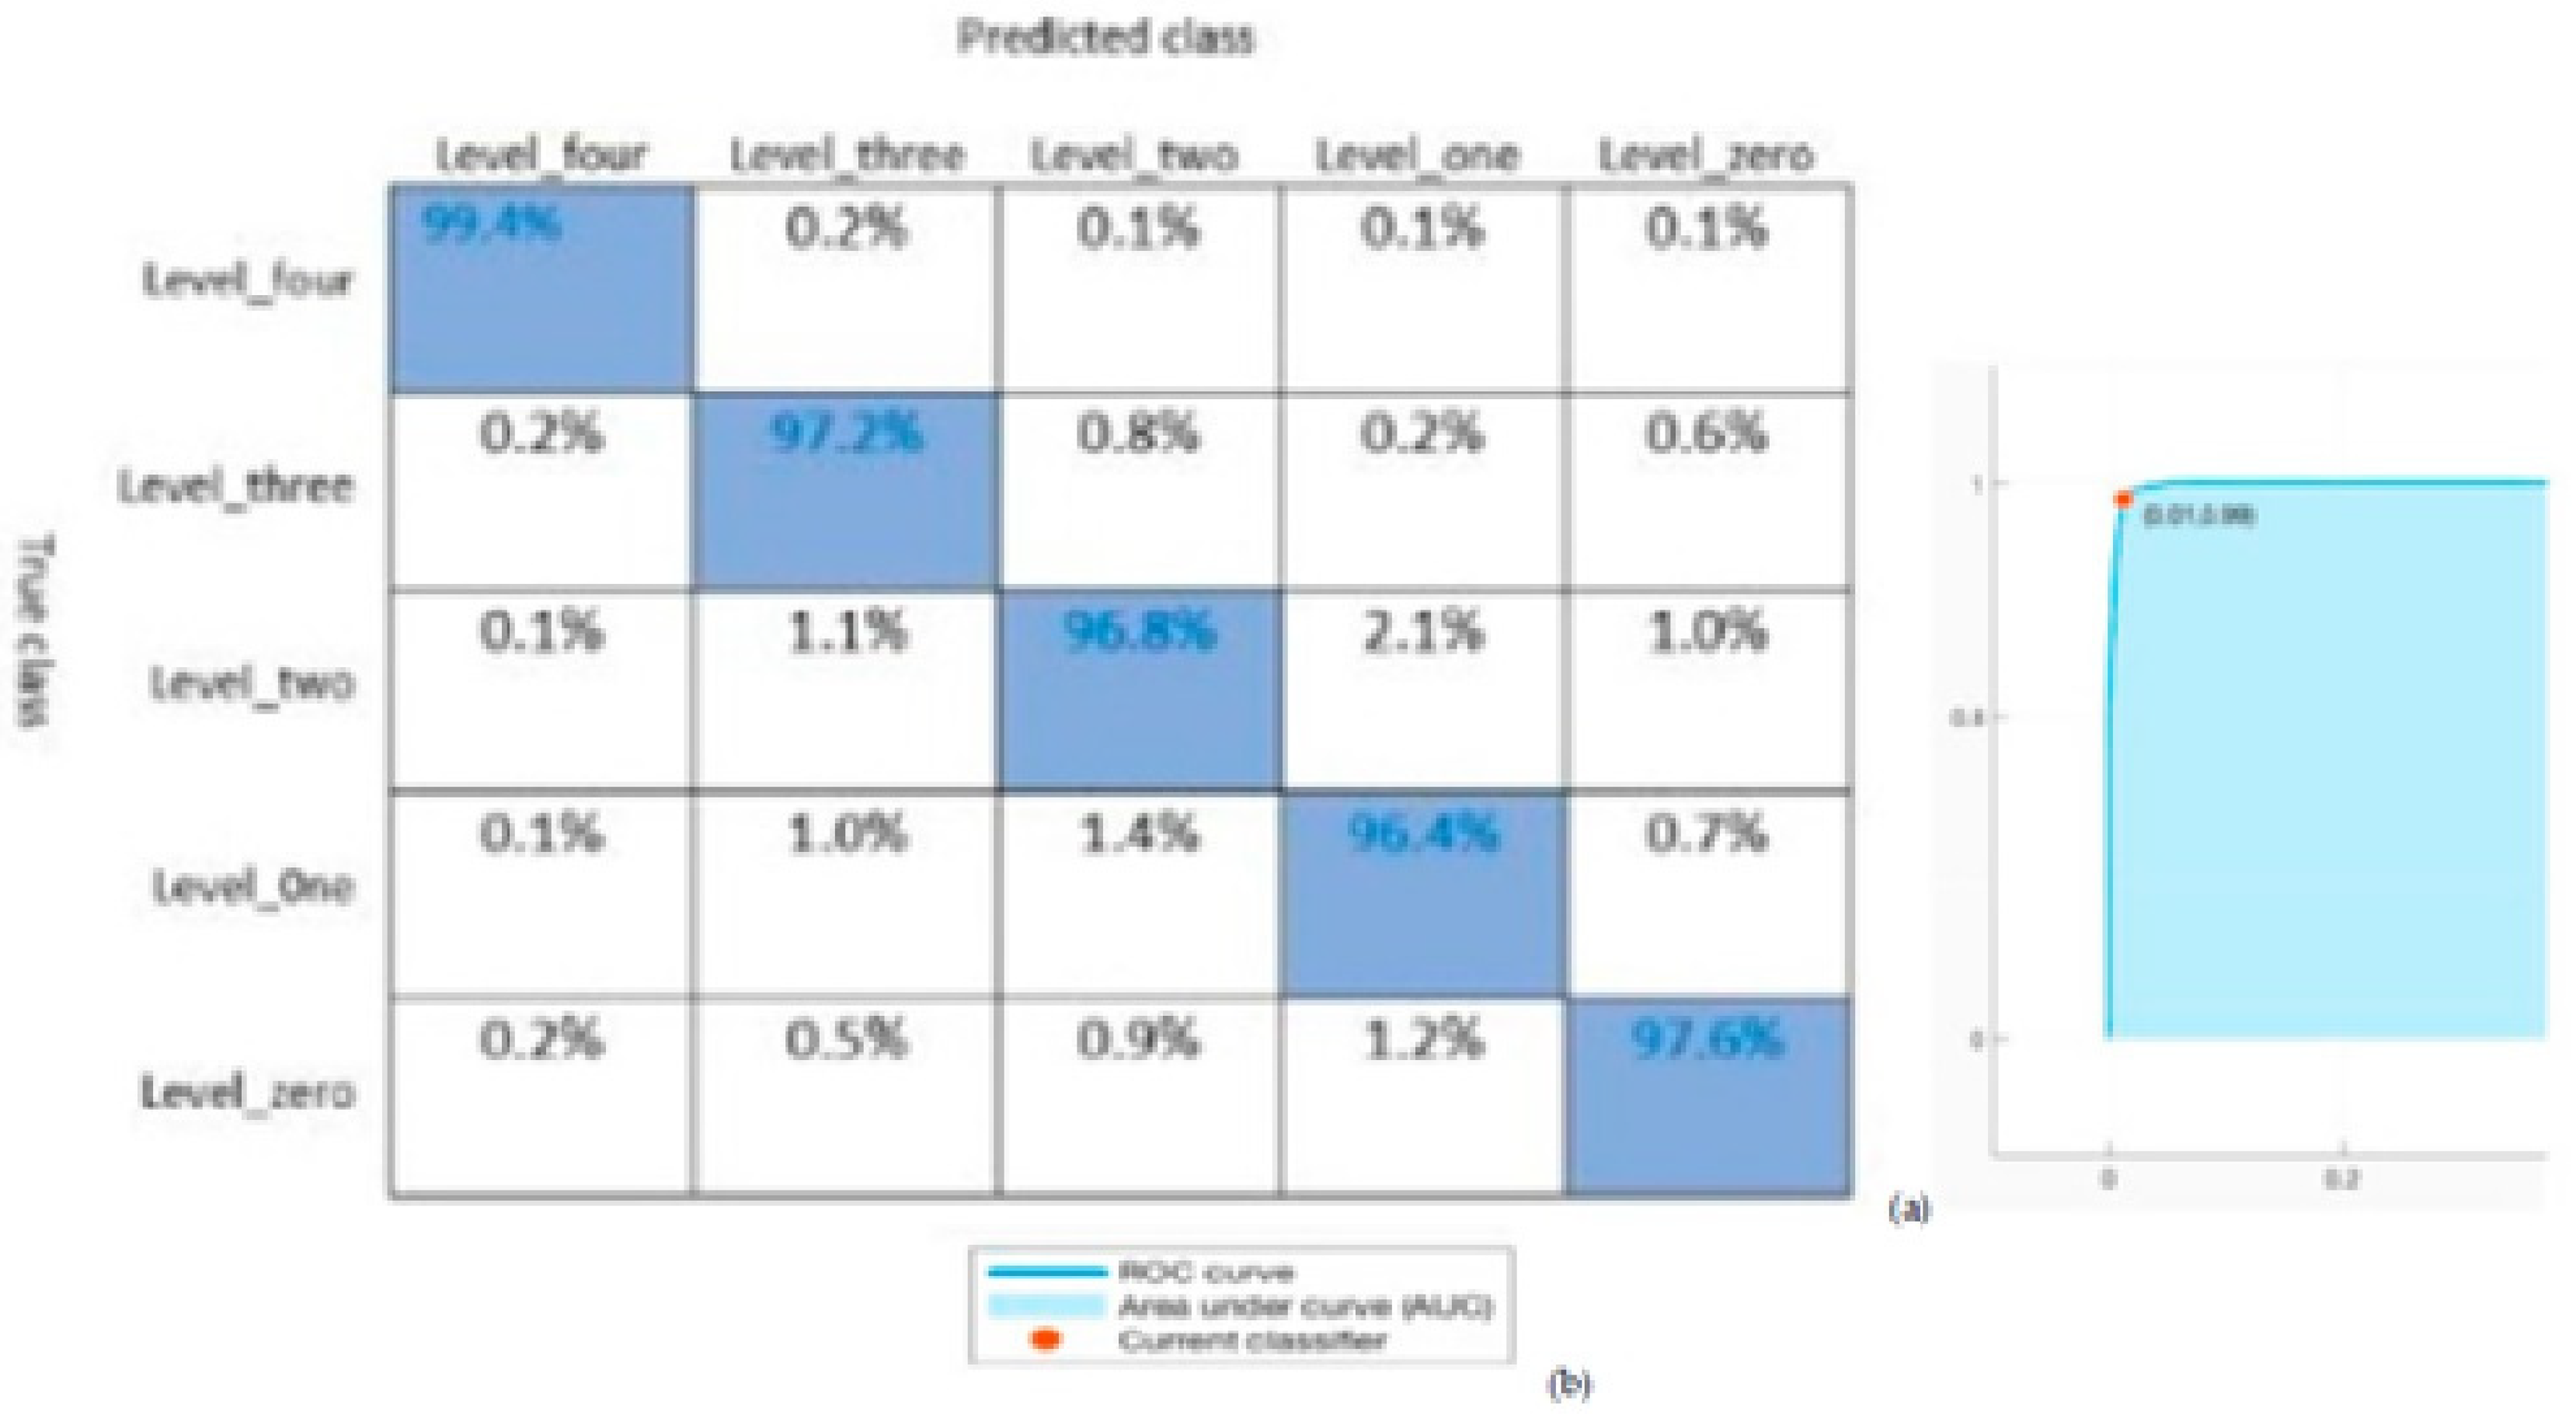
In addition, part of the confusion matrix and ROC are demonstrated in
Figure 9. In this paper, K = 10 delivers a higher classification value from the record of the pain level emotions related to other K values. The maximum classification rate of 99.4% was determined on pain levels using the K-NN classifier. The confusion Matrices and the ROC curve for classification performance can also be accessed by the area under the ROC curve (AUC) as seen in
Figure 9. The analysis is discussed according to the performance which was dependent on the accuracy of the classification. The best performance was obtained from the K-NN classifiers: Fine, Medium, and Coarse K-NN is shown in
Figure 10.
The aim of this work is to propose a solution that can be implemented with IoT. Deep learning algorithms require more computing power compared with KNN. Implementation of KNN on tiny devices has been demonstrated in many published reports [
44,
45].
Further, concerning the training dataset scope, the result of classification depends on the training dataset size. The result was better using a bigger training dataset. Still, the number K has an impact on the result; with a higher K, the the classification performance result will be reduced. By reducing the training dataset in a specific ratio, some classifiers can still perform well, however, some cannot.
Figure 10 gives the overall accuracy variation by changing the number of k of three classifiers mentioned earlier, the K-NN classifiers (K-NN Fine, Medium, and Coarse K-NN). With these variations, the Medium K-NN classifiers can still perform very well. Therefore, in this experiment, the K-NN classifier should be the most appropriate classifier, which means limited data can have higher recognition accuracy with different evaluated values of K: 1 to 10, and 100; K = 10 eventually provided the highest classification accuracy as seen in
Figure 5. We noted that the highest accuracies were at K = 10 and after that, there was a decreasing trend in accuracy. Based on that information, the appropriate value for K = 10.
4. Conclusions
A novel methodology utilizing the facial expression associated with pain amplified on the corrugator and zygomaticus EMG on the classification analysis independent of a subject bias was performed. Features based on the comparisons resulting from the zygomaticus and corrugator were extremely applicable. It was shown that the facial zygomaticus EMG actions associated more with no pain or neutral which was especially notable. Considering prior research studies on the corrugator and zygomaticus, the EMG is capable of recognizing negative and positive reactions separately. Hence, the corrugator and zygomaticus EMGs can be used to measure indicators of pain and no pain expressive conditions. Furthermore, the corrugator is good for indicating when there is pain or no pain, however, the zygomaticus is vague with no pain, neutral, and negative emotions. In our case, facial EMGs and individual emotional involvement were related and exhibited in the features enough to discriminate between the baseline and the pain tolerance level (P0 versus P4) independent of the subject bias.
Future studies using fEMG over the corrugator and zygomaticus should be united with the emotional state to identify more intricate feelings. Personal situations of behavior and gender should also be considered. Finally, from the collected BioVid Heat Pain database, the fEMG signal of the corrugator and zygomaticus can successfully distinguish pain and no pain excitements. Additionally, fEMG actions are meaningfully associated with individual emotional practices. However, we relied on the applications of real-time classification methods for identifying emotional states mainly by simplifying their identification in people in daily routine but not having the same sort of incapacities in healthcare.


 ,
, 


