Article

Investigation of Partial Shading Scenarios on a Photovoltaic Array’s Characteristics

1
Innovative Technologies Laboratory, Higher School of Technology, Sidi Mohamed Ben Abdellah University, Fez 30000, Morocco
2
Engineering, Systems and Applications Laboratory, ENSA, Sidi Mohamed Ben Abdellah University, Fez 30000, Morocco
3
Industrial Technologies and Services Laboratory, Higher School of Technology, Sidi Mohamed Ben Abdellah University, Fez 30000, Morocco
4
Department of Computer Science, College of Computers and Information Technology, Taif University, P.O. Box 11099, Taif 21944, Saudi Arabia
5
Department of Information Technology, College of Computers and Information Technology, Taif University, P.O. Box 11099, Taif 21944, Saudi Arabia
*
Author to whom correspondence should be addressed.
Electronics 2022, 11(1), 96; https://doi.org/10.3390/electronics11010096
Submission received: 5 December 2021 / Revised: 20 December 2021 / Accepted: 27 December 2021 / Published: 29 December 2021

Abstract

:
The purpose of this study is to investigate the impact of different partial shading scenarios on a PV array’s characteristics in order to develop a simple and easy-to-implement GMPP controller that tracks the PV array’s global maximum power point (GMPP). The P-V characteristic of the PV array becomes more complicated under partial shading, owing to the presence of many power peaks, as opposed to uniform irradiance conditions, when there is only one peak called the maximum power point. In fact, and according to an experiment conducted in this study, when a PV array is partially shaded, the P-V characteristic mostly presents two peaks, given the existence of only two levels of irradiance, one of which is called the global peak (i.e., the GMPP). Furthermore, the first peak is located at Vmpp1 (the PV array’s voltage corresponds to this peak), whereas the second is at Vmpp2. The proposed approach works by estimating the values of Vmpp1 and Vmpp2 using two equations in order to control the DC/DC converter of the PV system. The first equation is used when the GMPP is at the first peak, while the other is used when the GMPP is at the second peak. Several scenarios are simulated and presented in this paper to verify the accuracy of these equations. In addition, some conclusions are drawn to suggest a simple method for tracking the GMPP.

1. Introduction

Solar PV energy has piqued the curiosity of researchers all around the world in recent years [1,2]. Many researchers are working on the P-V and I-V characteristics of PV panels to extract energy with high reliability and improve their efficiency [3]. Solar irradiation, which is either uniform or non-uniform over a PV panel, has a significant impact on the characteristics of a PV array [4]. Under uniform solar irradiation conditions (i.e., when all PV panels receive the same insolation), the PV array’s P-V characteristic has one peak called the maximum power point (MPP). This MPP can be tracked using conventional maximum power point tracking (MPPT) approaches to extract the maximum power from the panels [5,6,7,8].
In the case of non-uniform solar irradiation or partial shading conditions (PSC) (i.e., when the insolation received by some PV panels (shaded panels) is less than that received by the other PV panels), the shaded PV panels act as a load instead of a power generator. This leads to the HOT-SPOT problem, which can damage the shaded panels [9,10,11]. This is why bypass diodes are used and connected in parallel with the panels to force the current from the unshaded PV panels to pass through the bypass diodes of the shaded PV panels to protect them from the HOT-SPOT problem. It should be mentioned that in the case of PSC, the energy production of the PV system could be decreased by 10–70% [12,13,14]. Furthermore, under PSC, the P-V characteristic of the PV array presents many peaks, one of which is the global peak, which reflects the PV array’s global maximum power point (GMPP), while the others are the local peaks. Conventional MPPT approaches such as perturb and observe (P&O) and incremental conductance, on the other hand, are unable to discover the GMPP under PSC because they converge to the MPP that comes into contact first and fails to differentiate between a GMPP and a local MPP. To address this issue, a variety of GMPPT strategies have been proposed in the literature, including particle swarm optimization (PSO), artificial bee colony (ABC), artificial neural network (ANN), fuzzy logic control (FLC), and gray wolf optimization (GOW), which can track the true GMPP under PSC [15,16,17,18,19,20,21,22]. However, these techniques are complicated in terms of their real implementation [20]. The high complexity of these techniques requires finding a simple and easy method to track the GMPP of the PV array under PSC. Aside from that, several researchers have investigated the PV array’s P-V characteristic under PSC to provide a simple method to track the GMPP. In [23,24,25,26], the authors provide a good explanation of the effect and assessment of PSC on the P-V characteristic. Often, the P-V characteristic of a PV array mostly presents two peaks located in two areas. The GMPP is the high peak between the two peaks, and it is sometimes located in area 1 and other times in area 2. As a result, studying the P-V characteristic curve with various numbers of shaded modules is critical for determining the GMPP’s location. In this context, some previously published articles aimed to identify the critical point that separated these two areas [27,28]. Simulations have been performed in these studies with the irradiance value of the shaded panels set to 0, 100, 200, 300, 400, 500, 600, 700, 800, and 900 W/m2, whereas in this work, and based on an experimental test, it is found that the irradiance value in the shaded panel area is generally constant around a unique value (in our case 100 W/m²). Subsequently, we assumed that the value of the irradiance of the shaded panels was 100 W/m², a value that would be applied in all test simulations of the different PSC scenarios.
The main goal of this work is to study different partial shading scenarios on PV array characteristics in order to provide a simple and easily applicable method for GMPP tracking. The objective is to estimate the voltage values of the two MPP peaks presented in the P-V curve. To this end, two equations are proposed: Equation (1) for estimating the voltage at the first peak and Equation (2) for estimating the voltage at the second peak. The idea behind this is to propose a simple technique to control the DC/DC converter, using Equation (1) when the GMPP is located at the first peak (area 1) and Equation (2) when the GMPP is located at the second peak (area 2).
The remainder of this paper is organized as follows. Section 2 introduces the PV characteristics under uniform irradiance conditions. In Section 3, the impact of partial shading on the PV array characteristics is investigated. Section 4 presents the findings and discussion. Finally, Section 5 concludes the work and gives some suggestions for future research.

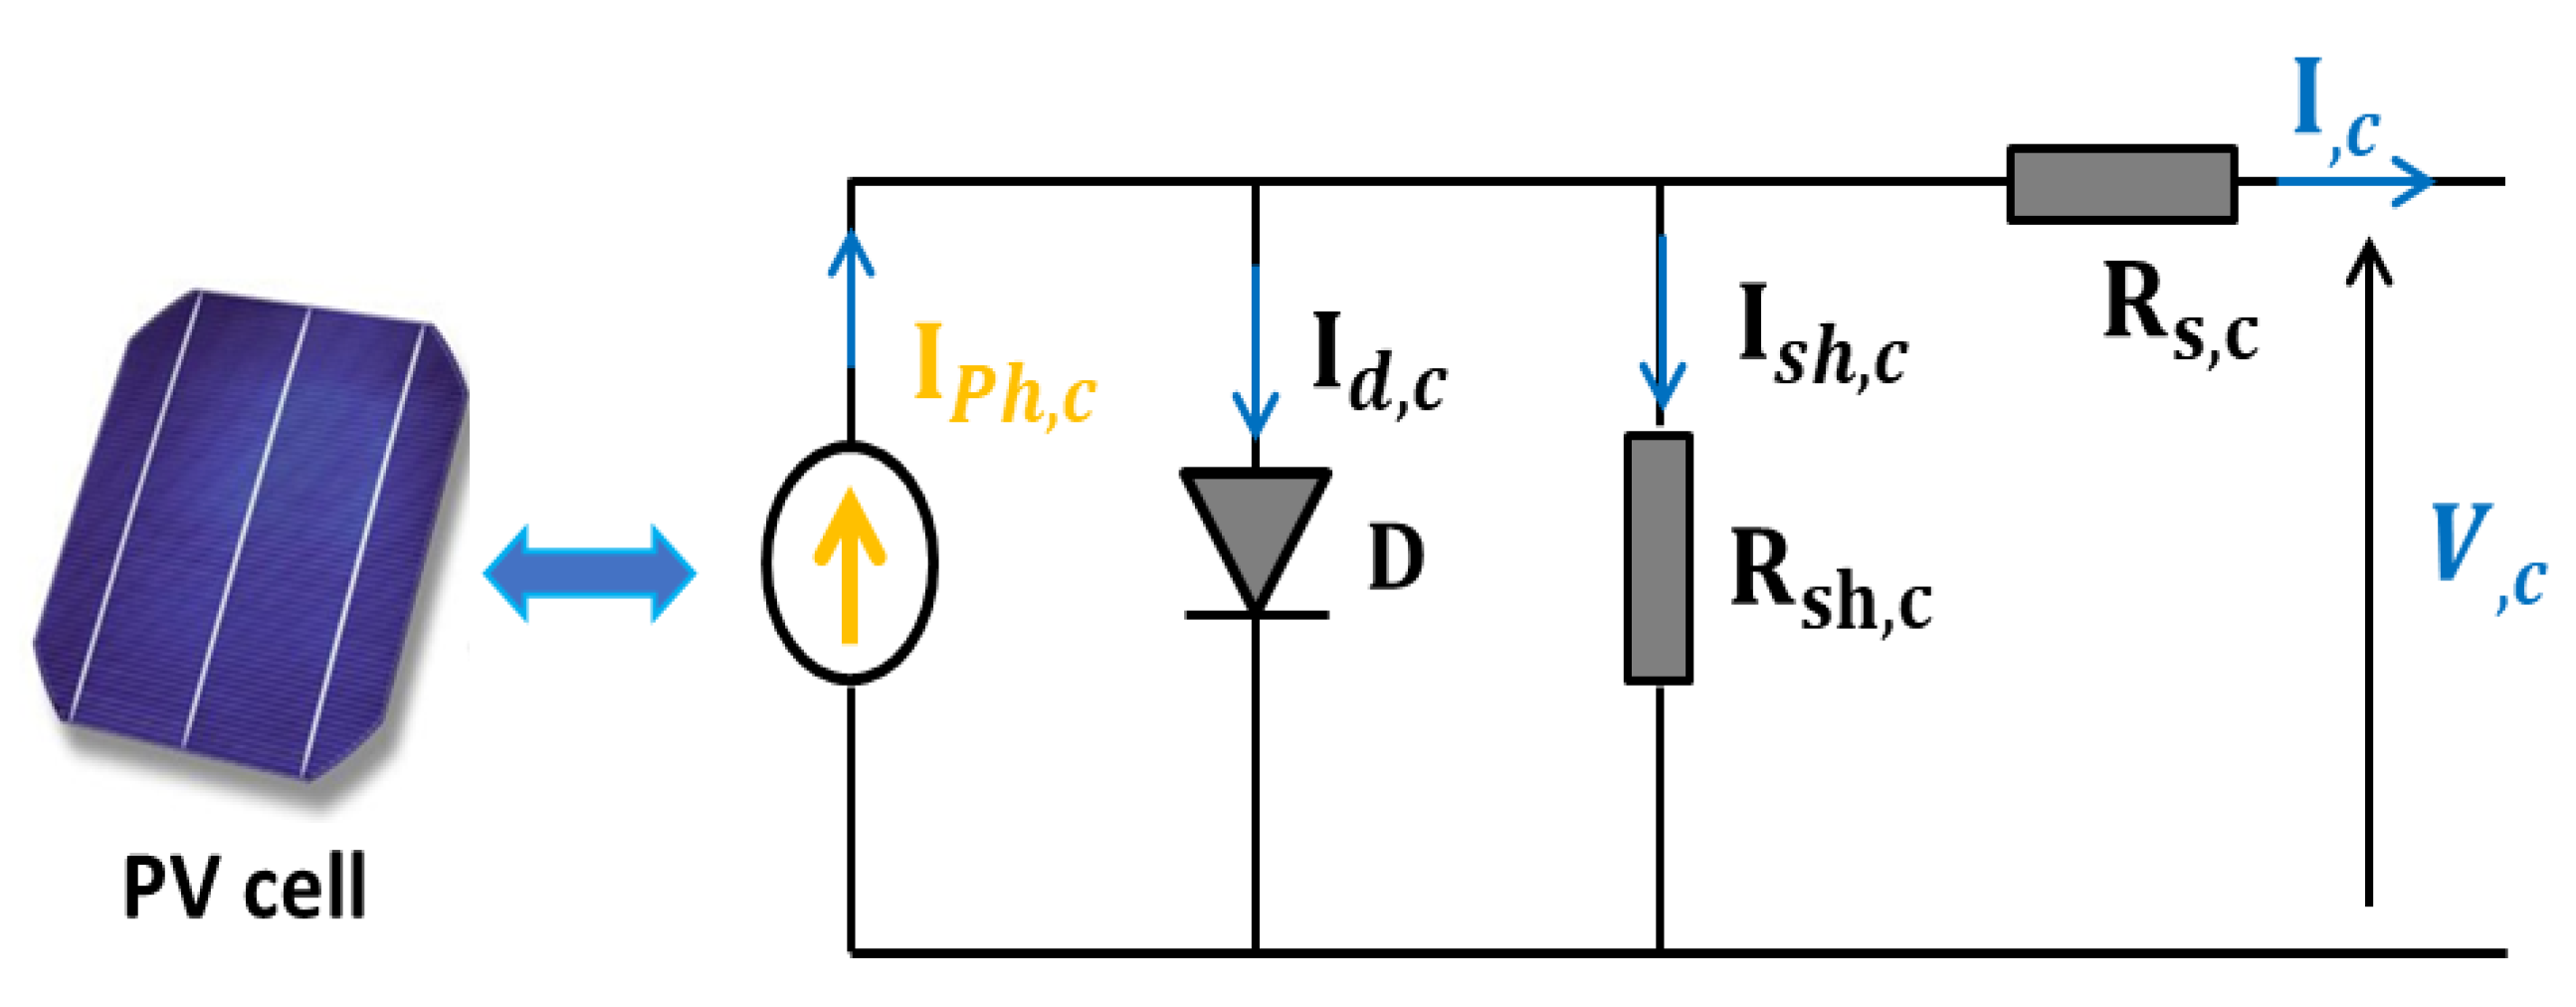
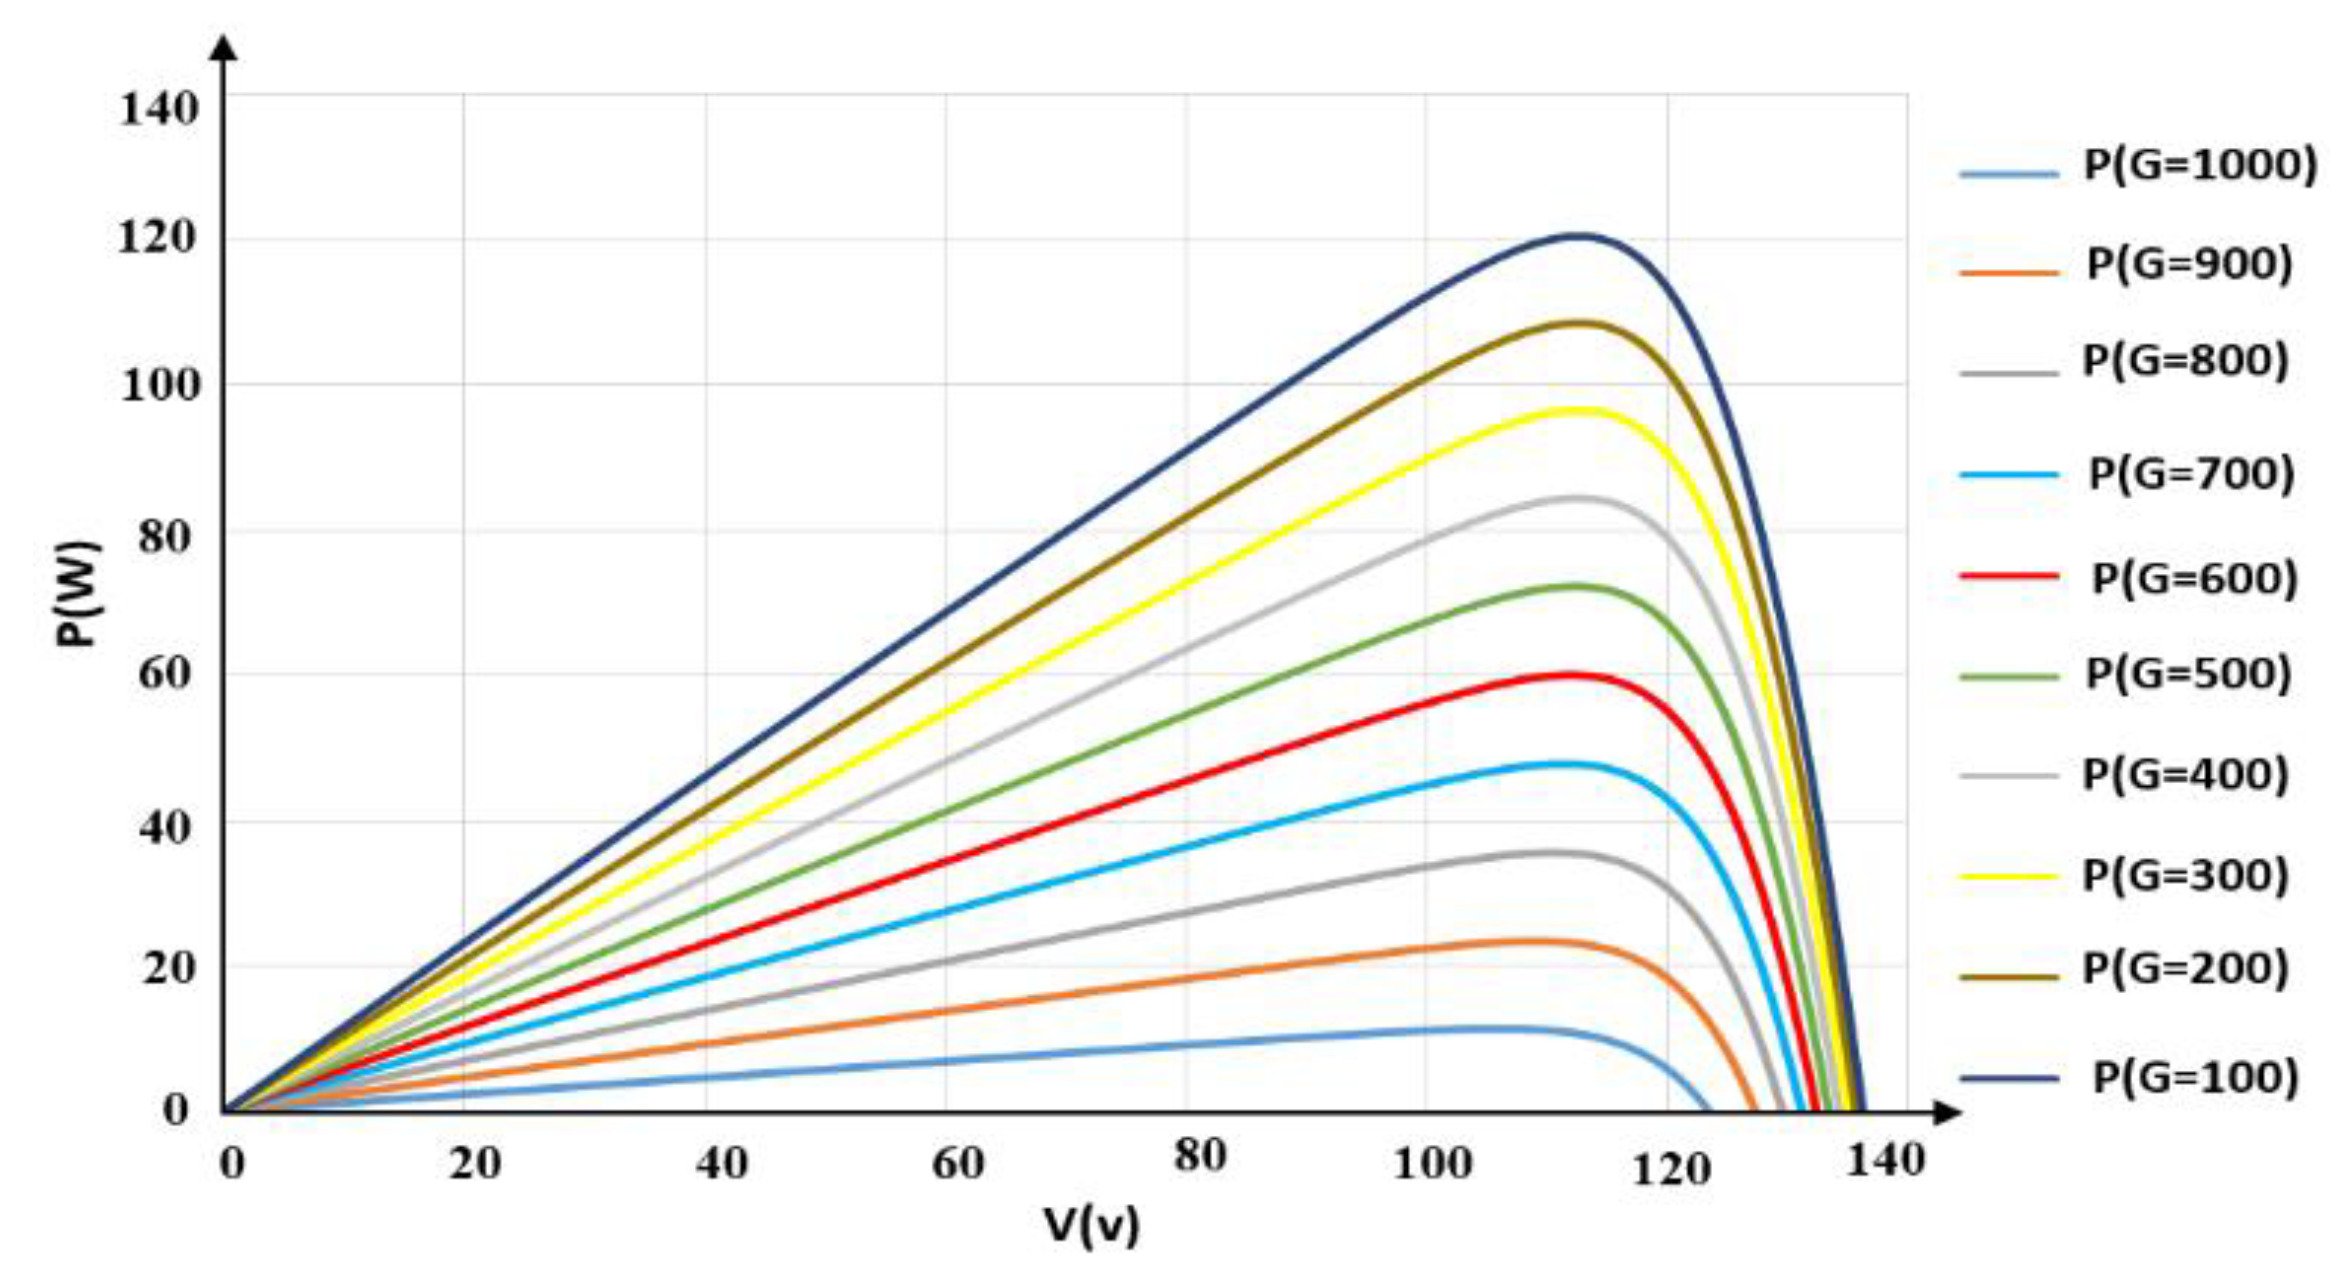
2. PV Characteristics under Uniform Irradiance Conditions

The one-diode model of the PV cell, as shown in Figure 1, is used to characterize the PV array in this work [29]. Multiple PV panels (or modules) are connected in series, parallel, or series-parallel to form a PV array. A PV panel, on the other hand, is a collection of cells connected in series or parallel. The characteristics of the PV panel used are shown in Table 1 [30]. Figure 2 shows the configuration of the PV array under consideration, which was composed of six PV panels connected in series and having the same characteristics. Figure 3 depicts the P-V curves of the PV array obtained for different levels of uniform irradiation (all PV panels received the same insolation) from 100 to 1000 W/m². As seen in this figure, each P-V curve had just one peak point, known as the MPP.

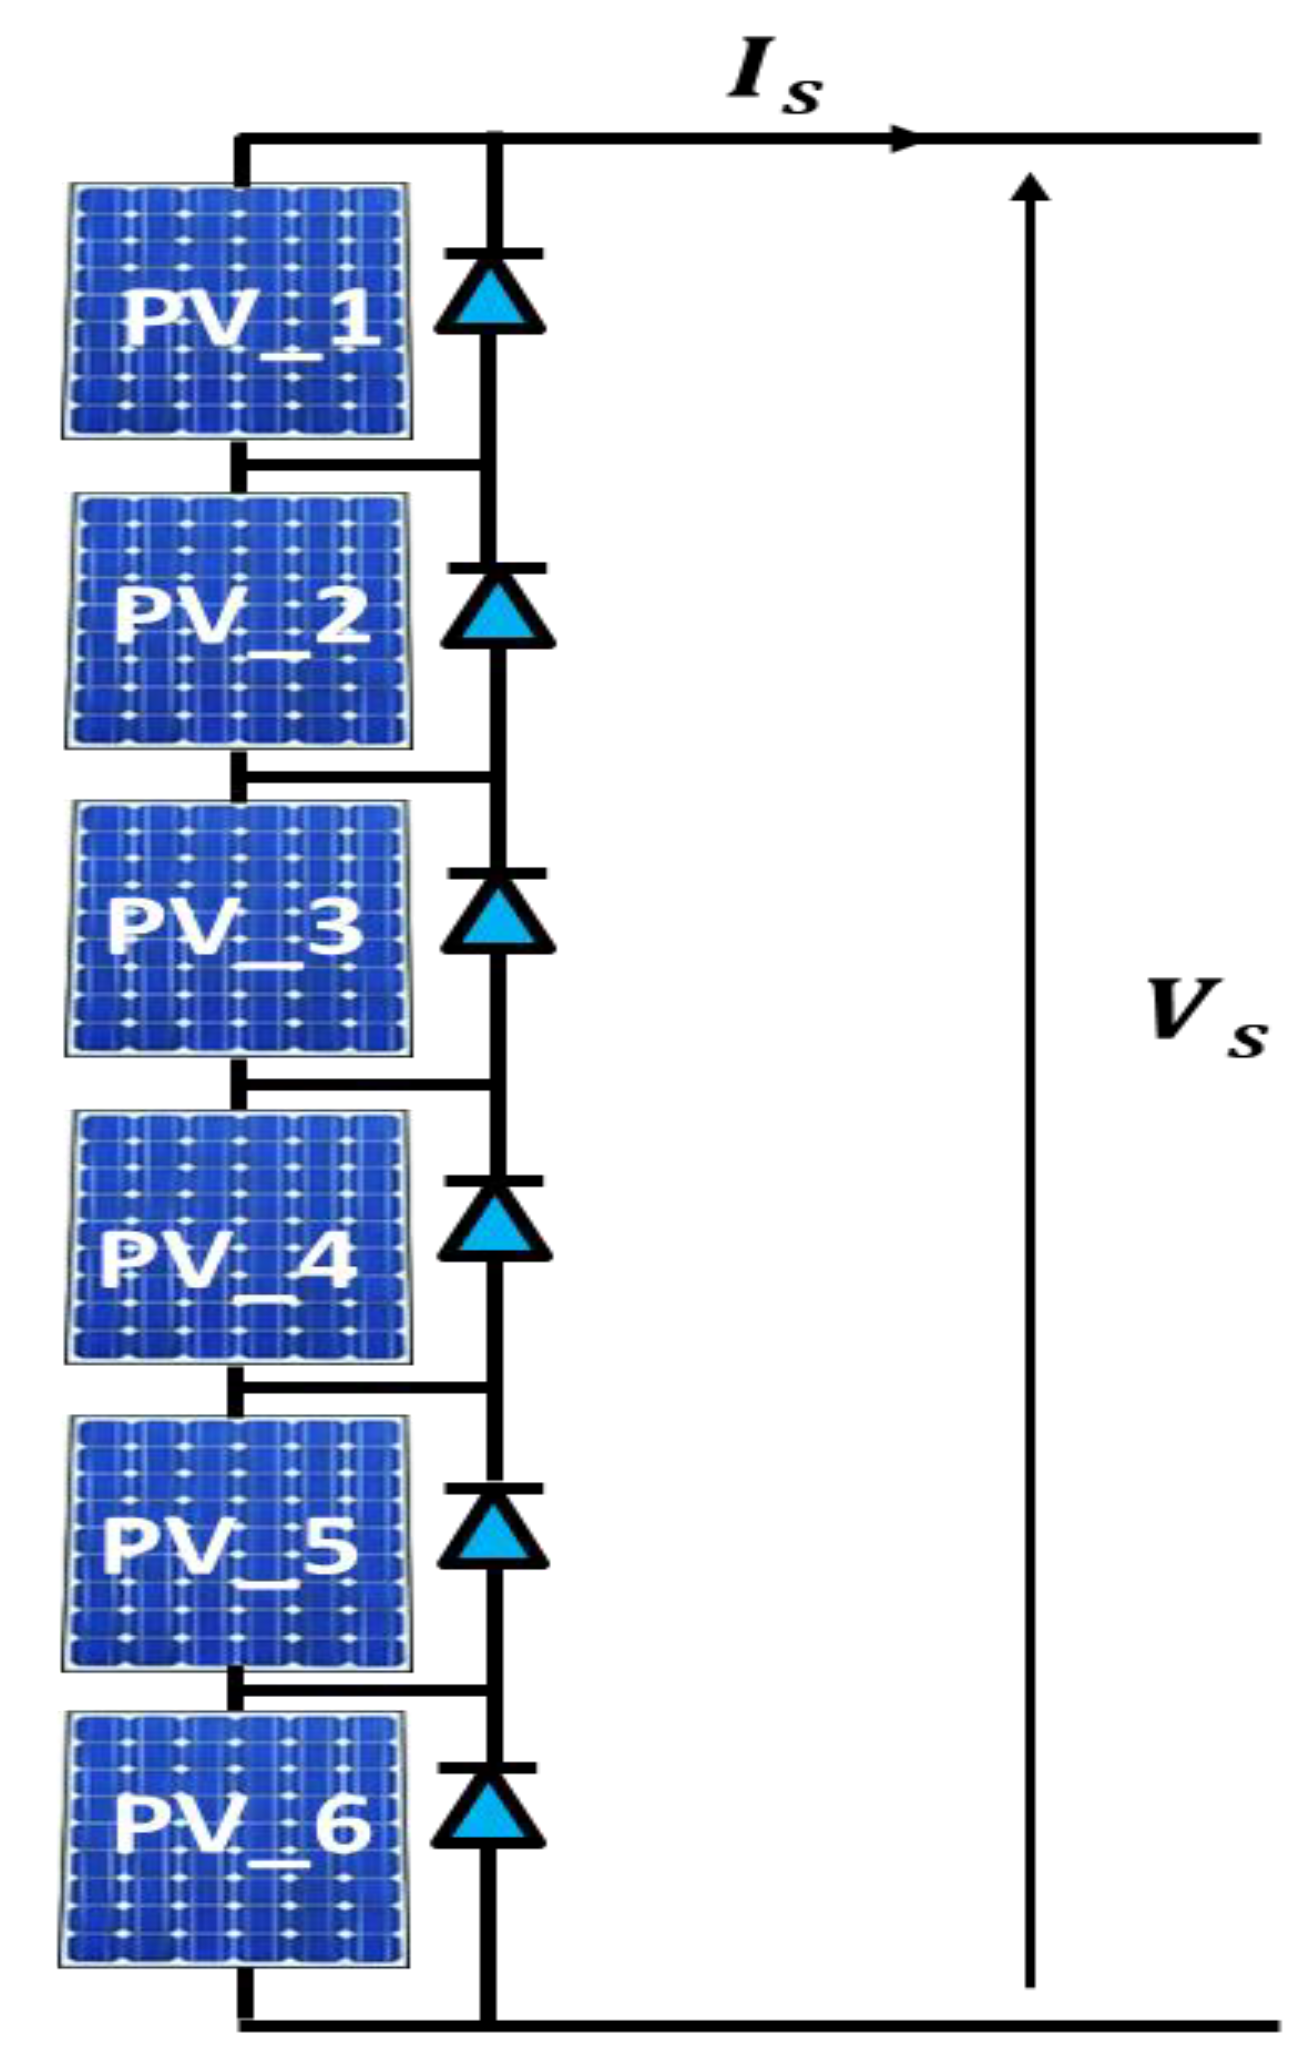
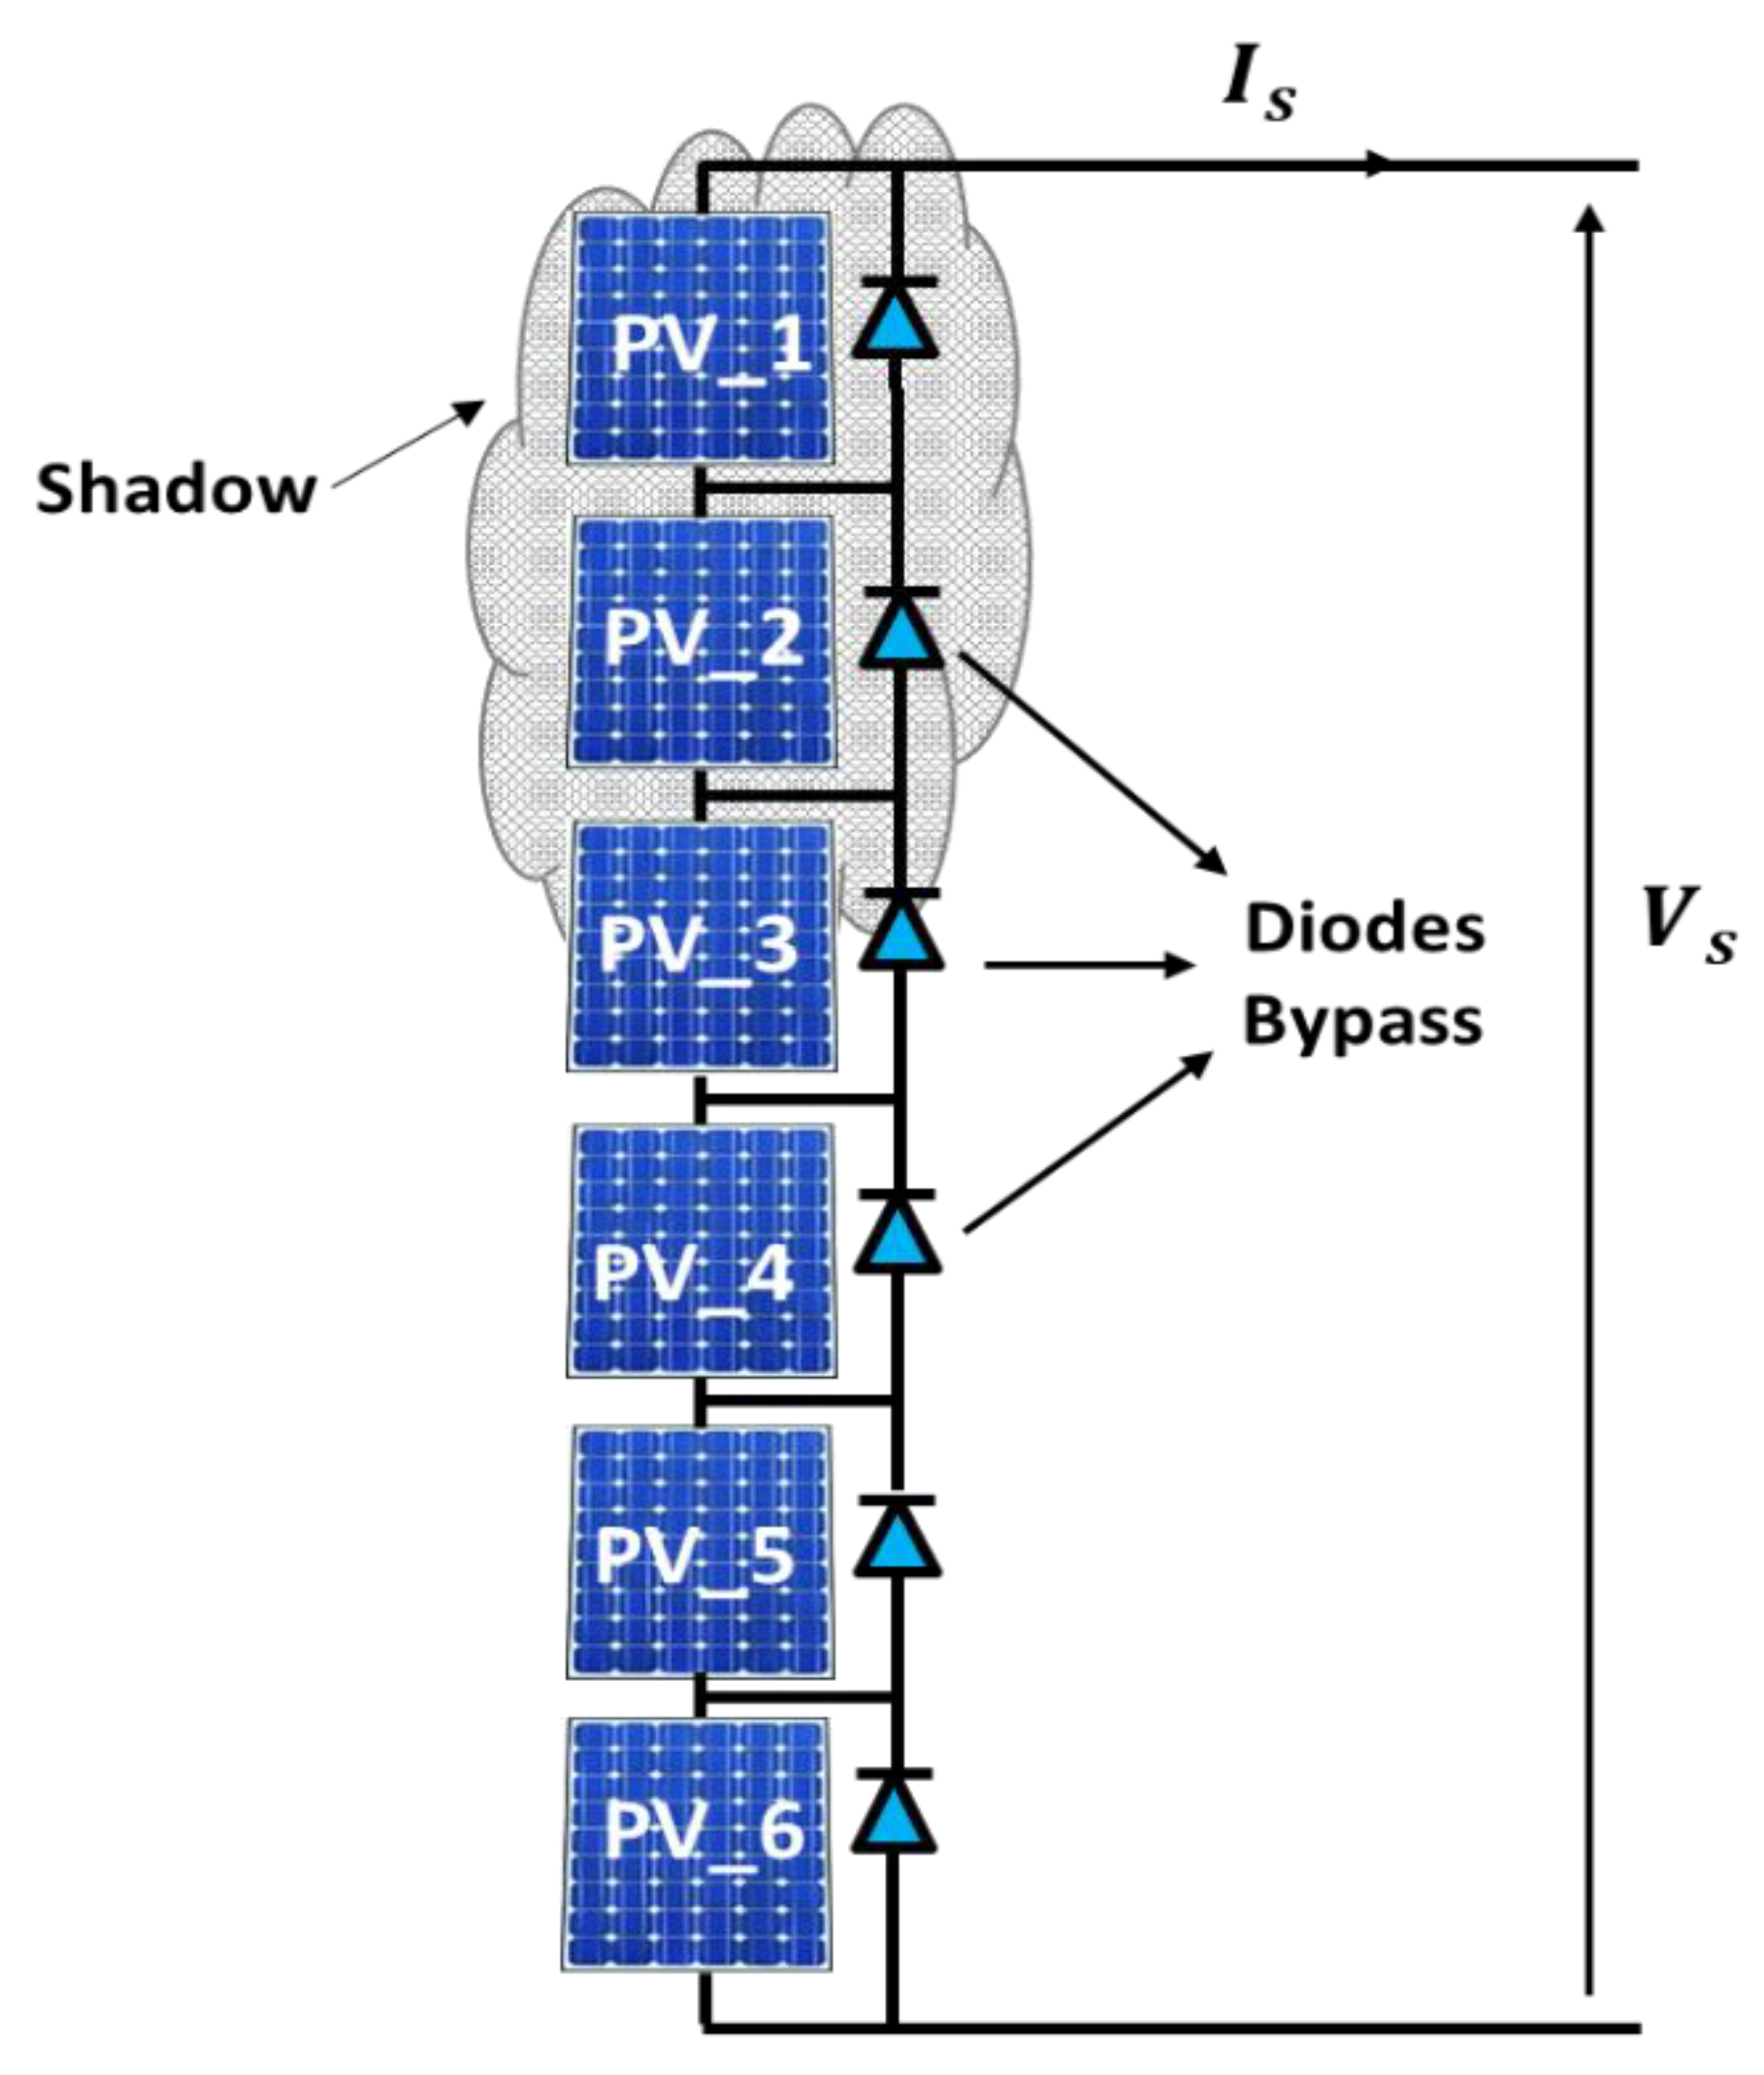
3. PV Characteristics under Non-Uniform Irradiance Conditions

When one or more of the PV panels are shaded, as can be seen in Figure 4, they act as loads instead of an energy source. Therefore, the shaded PV panels will be damaged under long-term working conditions (the HOT-SPOT phenomena). As a solution, each PV panel is connected in parallel with bypass diodes to force the current from the unshaded PV panels to pass through the bypass diodes of the shaded PV panels to prevent the shaded panels from self-heating [31]. In addition, under the non-uniform irradiation conditions (partial shading), the PV array’s P-V characteristic exhibits numerous peaks, owing to the presence of different levels of irradiation; one of them is the global peak, which reflects the PV array’s MPP (GMPP), while the others are the local peaks.
Figure 5 shows a simulation result of the PV array’s P-V characteristic for three different tests, including the uniform and non-uniform irradiance conditions for STC (all PV panels received the same solar irradiation of 1000 W/m²) and for two shading scenarios. The first test of the shading scenarios was performed with an irradiance value of 100 W/m2 for five shaded PV panels and 300 W/m2 for the remaining unshaded PV panel, while the second test was performed with an irradiance value of 100 W/m2 for three shaded PV panels and 700 W/m2 for the other unshaded PV panels. From this figure, the P-V curve showed only one peak point under STC, while it showed two peaks for both shading scenarios. Each of these peaks was characterized by its own voltage and power: Vmpp1 and Pmpp1 for the first peak and Vmpp2 and Pmpp2 for the second one. While the largest value between Pmpp1 and Pmpp2 represents the GMPP, which sometimes existed in area 1 and other times in area 2.
To apprehend the current flow direction of the PV array under PSC, consider the PV array shown in Figure 6 consisting of six PV panels, three of which were unshaded, while the others were shaded. In addition, as shown in Figure 5, the P-V curve of the PV array under PSC could be divided into two areas. In area 1, the bypass diode of each shaded PV panel conducted as a short circuit. Figure 6a depicts the equivalence diagram of the current flow direction of the PV array when the load demanded more than the current value of the shaded PV panels. Therefore, the equation of Vmpp1 can be expressed mathematically as follows:
V m p p 1 = ( N s N s h ) V m p p , S T C N s h 0.7
where Vmpp1 is the voltage at the first peak, Ns is the number of PV panels, Nsh is the number of shaded panels, and Vmpp,STC is the voltage at the MPP of the PV array under STC.
By contrast, in area 2, the bypass diodes of all PV panels were not conducting. Figure 6b depicts the equivalence diagram of the current flow direction of the PV array when the load demanded less than the current value of the shaded PV panels. Therefore, the equation of Vmpp2 can be expressed mathematically as follows:
V m p p 2 = N s V m p p , S T C
where Vmpp2 is the voltage at the second peak. Ns is the number of PV panels, and Vmpp,STC is the voltage at the MPP of the PV array under STC.
To investigate the effects of partial shading on the PV array characteristics, multiple partial shading scenarios had to be simulated by changing the number of shaded panels and the incident irradiance value on the PV panels. An experimental test was conducted for this purpose in order to identify the irradiance value of the shaded panels that would be employed in all shading scenario simulations. Figure 7 presents the experimental set-up for this test, which included a PV panel and two pyranometers: one for measuring irradiance levels in an unshaded place and the other for measurements in a shaded place.
Figure 8 illustrates the variation in irradiance levels in the shhaded and sunny places across two days in two different months. As can be observed in this figure, the irradiance value in the sunny place varied over the course of the day from about 100 W/m2 to 1000 W/m2, while the irradiance value in the shaded place remained relatively constant at around 100 W/m2. As a result, the irradiance value of the shaded panels would be set to 100 W/m2 in all simulations of partial shading scenarios, whereas that of unshaded panels would vary between 100 and 1000 W/m2.

4. Results and Discussion
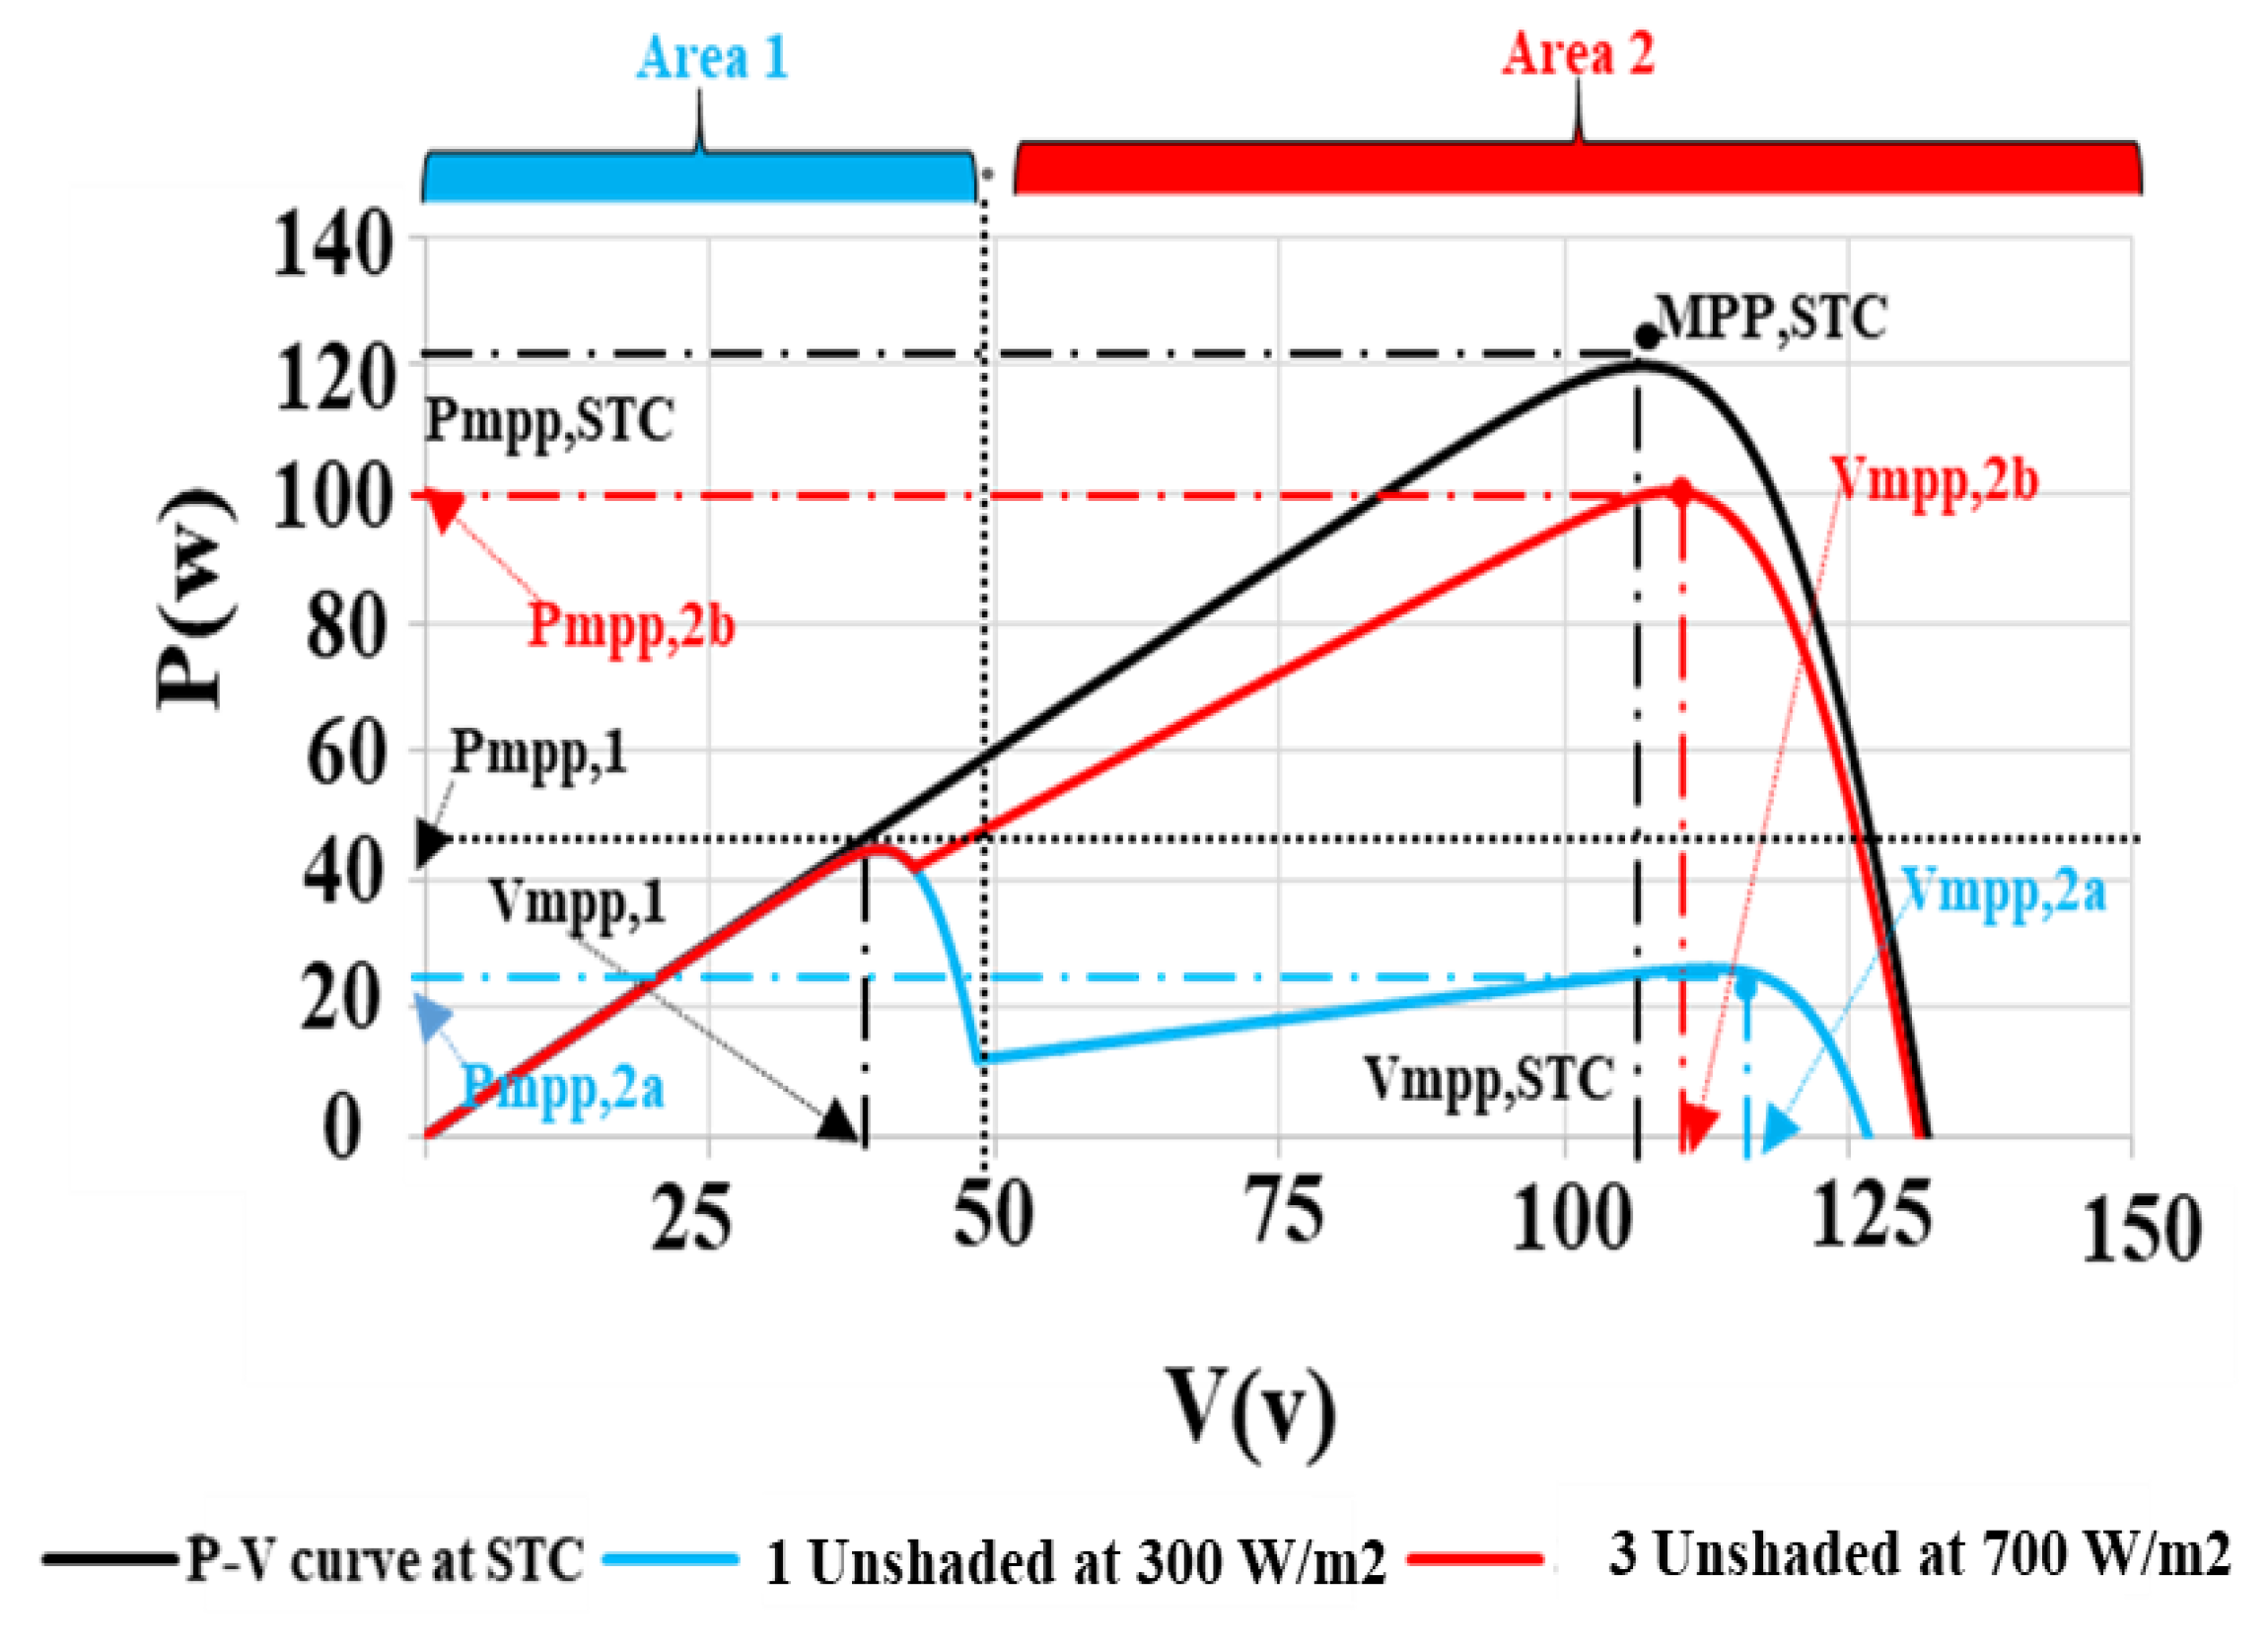
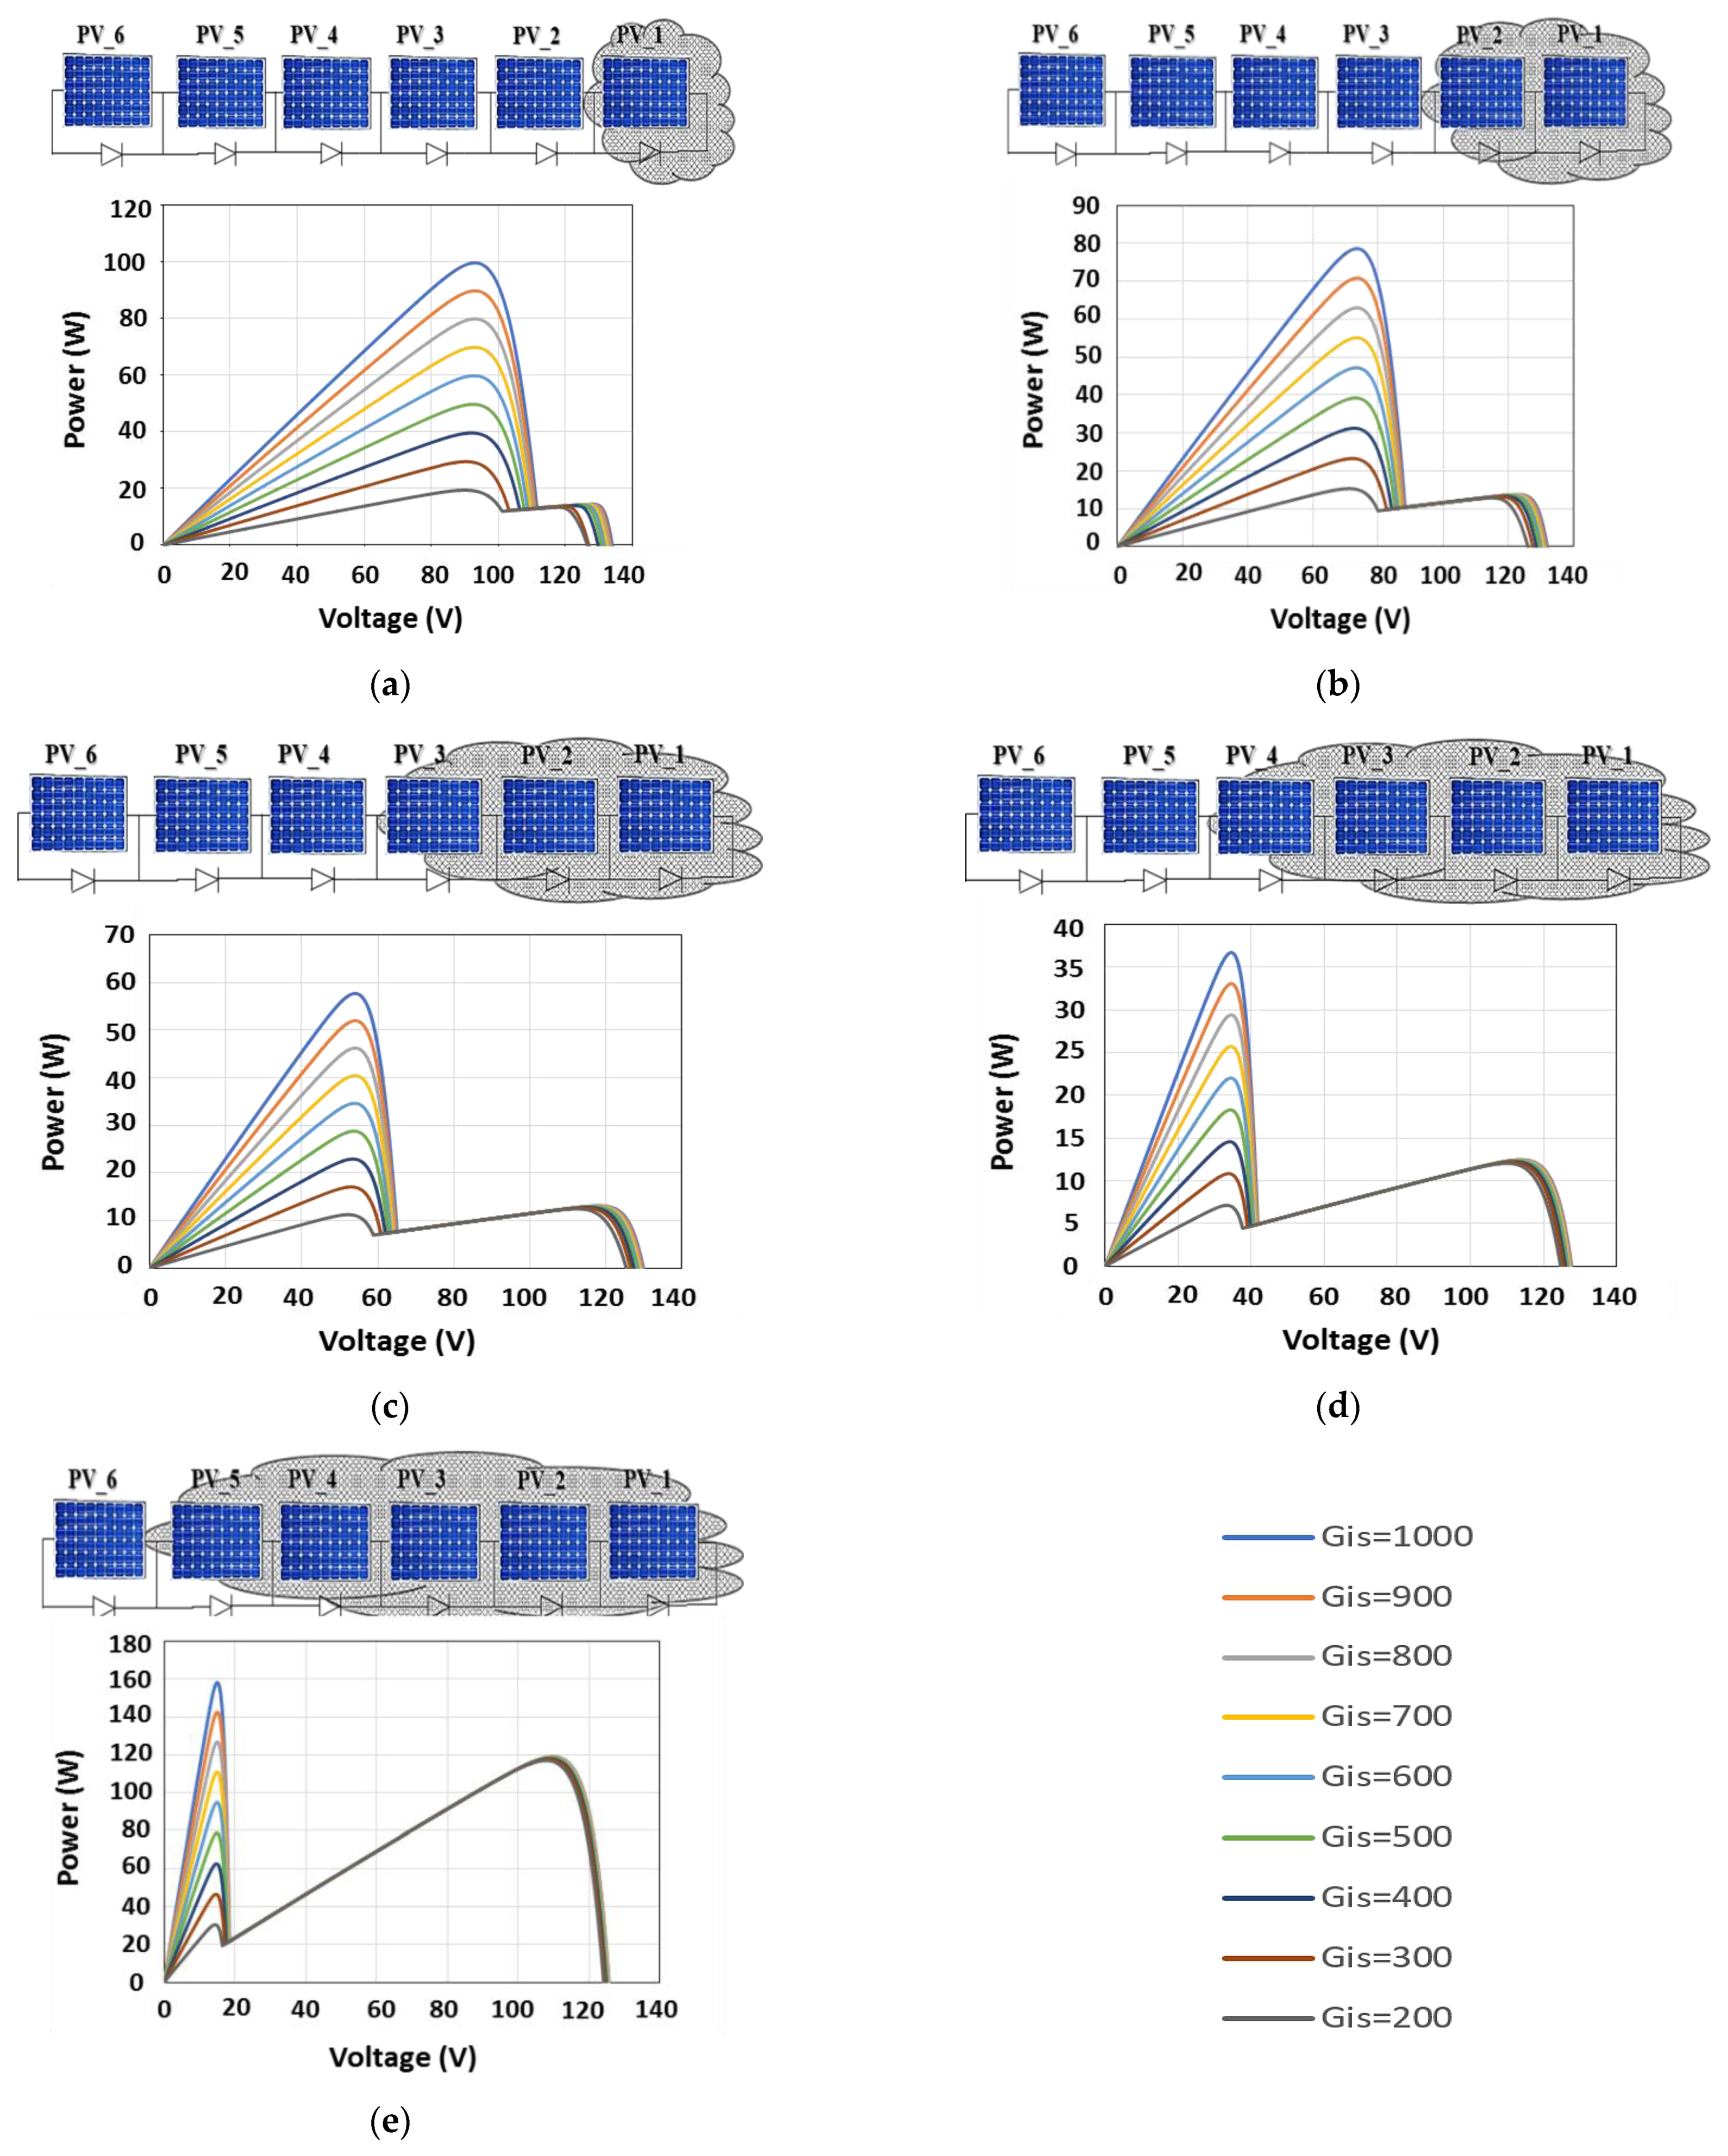
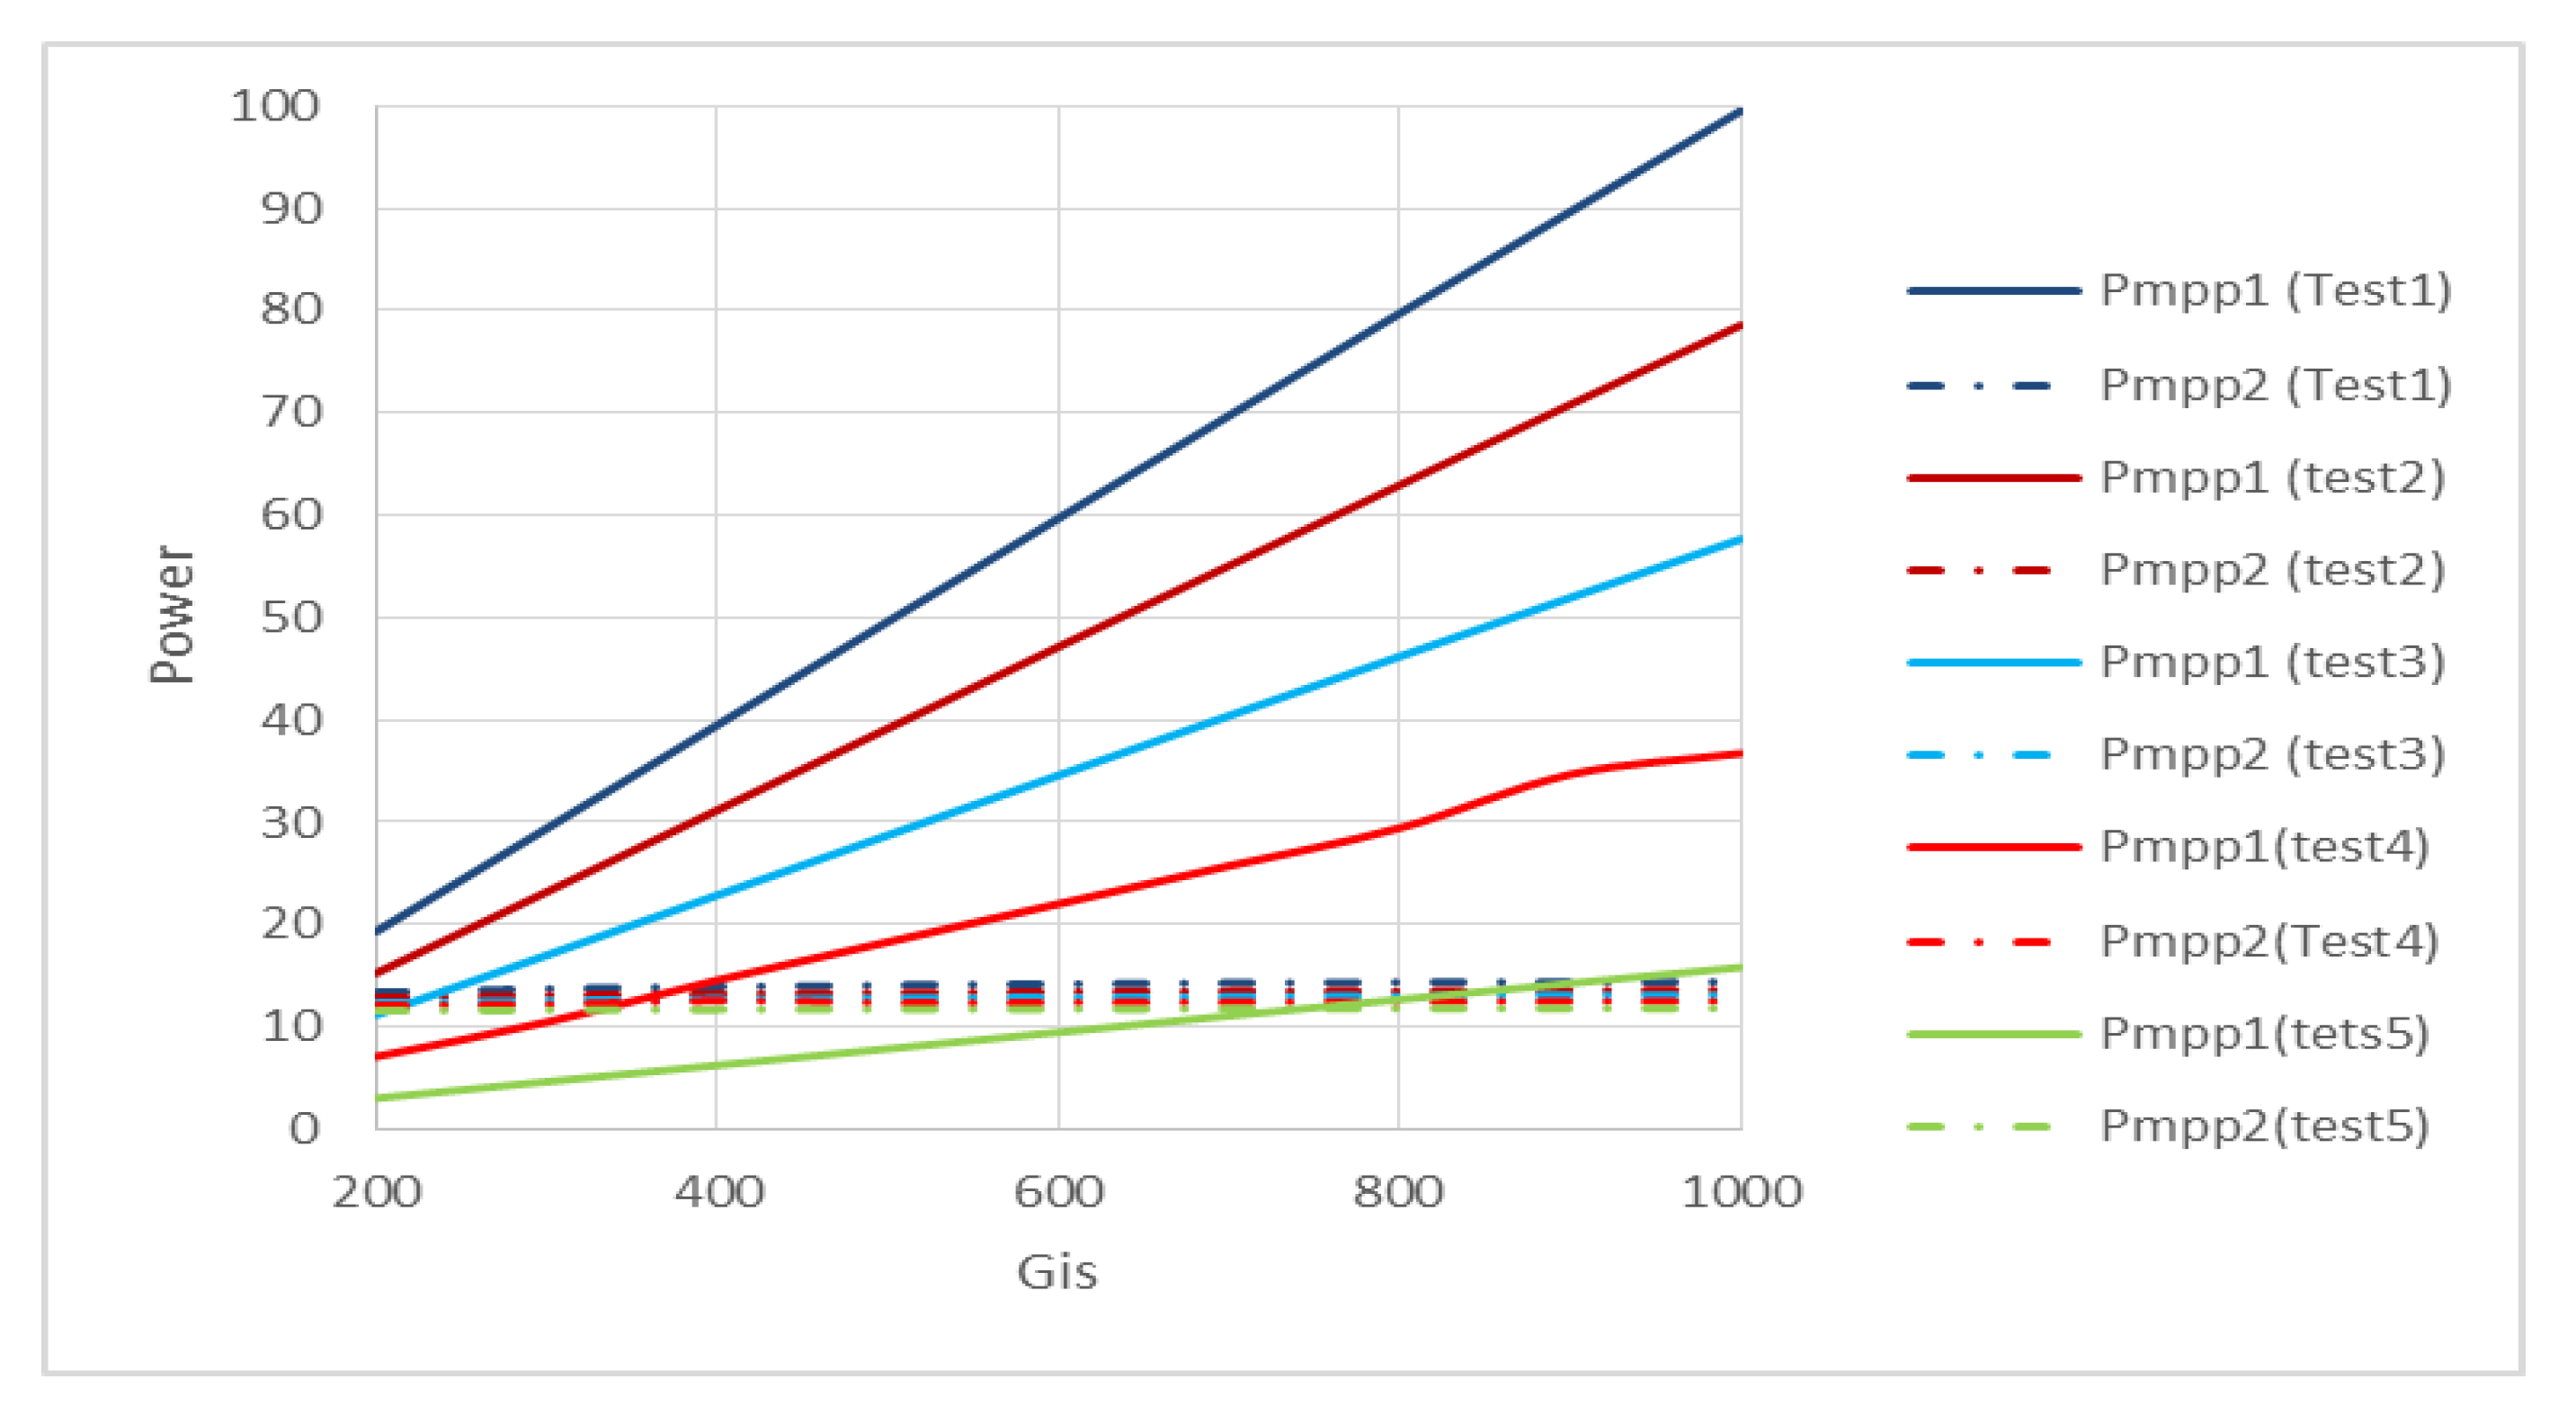
Table 2 lists all the tests applied to the simulation of the PV array in the Matlab Simulink environment, and Figure 9 presents the P-V characteristic obtained in each test. As can be seen in this figure, the GMPP was sometimes located at Vmpp1 and other times at Vmpp2, according to the number of shaded panels and the irradiance value of the unshaded panel. In the case of tests 1 and 2, the GMPP appeared at Vmpp1 when the irradiance value varied between 200 and 1000 W/m2 while it appeared at Vmpp2 when the irradiance value varied between 0 and 200 W/m2. In the case of test 3, the GMPP appeared at Vmpp2 when the irradiance value of the unshaded panels was between 0 and 200 W/m2 and appeared at Vmpp2 when this value was between 200 and 1000 W/m2. As for tests 4 and 5, analogous scenarios could be noted where the GMPP was located at Vmpp1 when the irradiance value of the unshaded panels was above a certain threshold, and it was located at Vmpp2 when the irradiance value was below a certain threshold.
Table 3, Table 4, Table 5, Table 6 and Table 7 present the simulation data of the P-V characteristic for the five shading scenarios, including the values of Vmpp1 and Vmpp2, and their corresponding estimated values. The estimated value of Vmpp1 by Equation (1) was almost equal to the corresponding simulated value, with a maximum error of about 0.63% in test 1, 0.65% in test 2, 0.62% in test 3, 0.81% in test 4, and 0.64% in test 5. On the other hand, the estimated value of Vmpp2 by Equation (2) and the corresponding simulated value were different, with a maximum error of up to 16% in test 1, 10% in test 2, 6% in test 3, 4% in test 4, and 2% in test 5. However, when the GMPP was located at the second peak, the maximum error of the estimated value of Vmpp2 could reach 3.8%. Therefore, we could consider Equation (2) to estimate the value of Vmpp2. From these results, many critical observations can be extracted, such as the following:
(i)
The first peak was created by the unshaded PV panels;
(ii)
The second peak was affected by shading on the PV panels;
(iii)
The localization of the GMPP was influenced by the irradiance value of the unshaded panels and the number of shaded panels.
As the results of all the simulation tests show that the GMPP sometimes existed in area 1 and other times in area 2, it was necessary to determine the area of the GMPP or the critical point to control the DC/DC converter using Equation (1) for area 1 and Equation (2) for area 2 for the purpose of extracting the GMPP from the PV system. Figure 10 presents the variation of Pmpp1 and Pmpp2 according to the irradiance value of the unshaded panel for the five tests. From this figure, the critical point is the intersection of the Pmpp1 and Pmpp2 curves. In addition, it is observed that the critical point was influenced by the irradiance value of the shaded panel and the number of shaded panels. Furthermore, the critical point changed when the number of shaded panels and the irradiance value of the shaded panels changed, as shown in Figure 10. Therefore, the GMPP was Pmpp1 in the case where the irradiance value of the shaded panel was less than or equal to the critical point value, whereas it was Pmpp2 in the case where the irradiance value was greater than or equal to the critical point value.

5. Conclusions

The goal of this paper is to investigate the impact of different partial shading scenarios on the PV array’s characteristics. First, an experimental test was performed to determine the irradiance value of the shaded panels, which was then used in all shading scenario simulations. The test, which was performed on two different days in two different months, showed that the irradiance value in a shaded location remained relatively constant. Then, two equations were given to estimate the voltages corresponding to two peaks presented in the P-V characteristic: Equation (1) for the first peak and Equation (2) for the second one. In addition, to check the accuracy of these proposed equations, simulation tests were performed for different partial shading scenarios. The obtained results showed that the estimated value of the voltage corresponding to the first peak by Equation (1) was almost equal to the simulated value with a maximum error of about 0.81%. Whereas the estimated value of the voltage corresponding to the second peak by Equation (2) and the corresponding simulated value were different, with a maximum error of up to 16% for test 1, 10% for test 2, 6% for test 3, 4% for test 4, and 2% for test 5. Based on the obtained research results, it was observed that the error of the estimate value of the voltage corresponding to the second peak was almost equal to the simulated value, with a difference of 2% when the GMPP was located at the second peak.
The following two aspects will be the focus of future research:
(1)
Finding the critical point in the form of an equation using a multiple regression algorithm or an artificial intelligence algorithm, which will allow us to know the area of the global peak in order to control the DC/DC converter using the two equations given in this work: Equation (1) when the GMPP is located at the first peak and Equation (2) when the GMPP is located at the second peak;
(2)
Design a GMPPT controller based on the proposed method and validate its feasibility of implementation in a real PV system.

Author Contributions

Conceptualization, A.C.; methodology, A.C., S.M. and A.E.G.; software, A.C.; validation, A.C. and A.E.H.; formal analysis, A.C.; investigation; writing—original draft preparation, A.C., A.E.H., S.M. and A.E.G.; writing—review and editing, A.C. and A.E.H.; visualization, S.M.; supervision, A.E.G. and A.D.; funding acquisition, M.M. and M.A.A. All authors have read and agreed to the published version of the manuscript.

Funding

Taif University Researchers Supporting Project number (TURSP-2020/98), Taif University, Taif, Saudi Arabia.

Institutional Review Board Statement

Not applicable.

Informed Consent Statement

Not applicable.

Data Availability Statement

Not applicable.

Acknowledgments

The authors are grateful for the support of Taif University Researchers Supporting Project number TURSP-2020/98, Taif University, Taif, Saudi Arabia.

Conflicts of Interest

The authors declare that they have no competing interests.

References

  1. Azeroual, M.; El Makrini, A.; El Moussaoui, H.; EL Markhi, H. Renewable Energy Potential and Available Capacity for Wind and Solar Power in Morocco Towards 2030. J. Eng. Sci. Technol. Rev. 2018, 11, 189–198. [Google Scholar] [CrossRef]
  2. Kousksou, T.; Allouhi, A.; Belattar, M.; Jamil, A.; El Rhafiki, T.; Arid, A.; Zeraouli, Y. Renewable energy potential and national policy directions for sustainable development in Morocco. Renew. Sustain. Energy Rev. 2015, 47, 46–57. [Google Scholar] [CrossRef]
  3. Xenophontos, A.; Bazzi, A.M. Model-based maximum power curves of solar photovoltaic panels under partial shading conditions. IEEE J. Photovolt. 2018, 8, 233–238. [Google Scholar] [CrossRef]
  4. Fesharaki, V.J.; Dehghani, M.; Fesharaki, J.J.; Tavasoli, H. The effect of temperature on photovoltaic cell efficiency. In Proceedings of the 1st International Conference on Emerging Trends in Energy Conservation–ETEC, Tehran, Iran, 20–21 November 2011; pp. 20–21. [Google Scholar]
  5. Ahmad, R.; Murtaza, A.F.; Sher, H.A. Power tracking techniques for efficient operation of photovoltaic array in solar applications–A review. Renew. Sustain. Energy Rev. 2019, 101, 82–102. [Google Scholar] [CrossRef]
  6. Motahhir, S.; El Hammoumi, A.; El Ghzizal, A. The most used MPPT algorithms: Review and the suitable low-cost embedded board for each algorithm. J. Clean. Prod. 2020, 246, 118983. [Google Scholar] [CrossRef]
  7. Chalh, A.; Motahhir, S.; El Hammoumi, A.; El Ghzizal, A.; Derouich, A. Study of a low-cost PV emulator for testing MPPT algorithm under fast irradiation and temperature change. Technol. Econ. Smart Grids Sustain. Energy 2018, 3, 11. [Google Scholar] [CrossRef] [Green Version]
  8. Chalh, A.; Motahhir, S.; El Hammoumi, A.; El Ghzizal, A.; Derouich, A. A low-cost PV Emulator for testing MPPT algorithm. IOP Conf. Ser. Earth Environ. Sci. 2018, 161, 012018. [Google Scholar] [CrossRef] [Green Version]
  9. Silvestre, S.; Chouder, A. Effects of shadowing on photovoltaic module performance. Prog. Photovolt. Res. Appl. 2008, 16, 141–149. [Google Scholar] [CrossRef]
  10. Silvestre, S.; Boronat, A.; Chouder, A. Study of bypass diodes configuration on PV modules. Appl. Energy 2009, 86, 1632–1640. [Google Scholar] [CrossRef]
  11. Dhimish, M. Assessing MPPT techniques on hot-spotted and partially shaded photovoltaic modules: Comprehensive review based on experimental data. IEEE Trans. Electron Devices 2019, 66, 1132–1144. [Google Scholar] [CrossRef] [Green Version]
  12. Bruendlinger, R.; Bletterie, B.; Milde, M.; Oldenkamp, H. Maximum power point tracking performance under partially shaded PV array conditions. In Proceedings of the 21st European Photovoltaic Solar Energy Conference, Dresden, Germany, 4–8 September 2006; pp. 2157–2160. [Google Scholar]
  13. Petrone, G.; Spagnuolo, G.; Teodorescu, R.; Veerachary, M.; Vitelli, M. Reliability issues in photovoltaic power processing systems. IEEE Trans. Ind. Electron. 2008, 55, 2569–2580. [Google Scholar] [CrossRef]
  14. Maghami, M.R.; Hizam, H.; Gomes, C.; Radzi, M.A.; Rezadad, M.I.; Hajighorbani, S. Power loss due to soiling on solar panel: A review. Renew. Sustain. Energy Rev. 2016, 59, 1307–1316. [Google Scholar] [CrossRef] [Green Version]
  15. Ahmed, J.; Salam, Z. A critical evaluation on maximum power point tracking methods for partial shading in PV systems. Renew. Sustain. Energy Rev. 2015, 47, 933–953. [Google Scholar] [CrossRef]
  16. Chalh, A.; El Hammoumi, A.; Motahhir, S.; El Ghzizal, A.; Subramaniam, U.; Derouich, A. Trusted Simulation Using Proteus Model for a PV System: Test Case of an Improved HC MPPT Algorithm. Energies 2020, 13, 1943. [Google Scholar] [CrossRef] [Green Version]
  17. Winston, P.; Kumar, B.P.; Christabel, S.C.; Chamkha, A.J.; Sathyamurthy, R. Maximum power extraction in solar renewable power system-a bypass diode scanning approach. Comput. Electr. Eng. 2018, 70, 122–136. [Google Scholar] [CrossRef]
  18. Motahhir, S.; Chouder, A.; El Hammoumi, A.; Benyoucef, A.S.; El Ghzizal, A.; Kichou, S.; Kara, K.; Sanjeevikumar, P.; Silvestre, S. Optimal Energy Harvesting From a Multistrings PV Generator Based on Artificial Bee Colony Algorithm. IEEE Syst. J. 2020, 15, 4137–4144. [Google Scholar] [CrossRef]
  19. Chalh, A.; El Hammoumi, A.; Motahhir, S.; EL Ghzizal, A.; Derouich, A. Development of an Improved GMPPT Based on Scanning Method for PV System Operating under a Dynamic Partial Shading Conditions. Technol. Econ. Smart Grids Sustain. Energy 2021, 6, 19. [Google Scholar] [CrossRef]
  20. Salam, Z.; Ahmed, J.; Merugu, B.S. The application of soft computing methods for MPPT of PV system: A technological and status review. Appl. Energy 2013, 107, 135–148. [Google Scholar] [CrossRef]
  21. Chao, K.-H.; Lin, Y.-S.; Lai, U.-D. Improved particle swarm optimization for maximum power point tracking in photovoltaic module arrays. Appl. Energy 2015, 158, 609–618. [Google Scholar] [CrossRef]
  22. Eltamaly, A.M.; Farh, H.M.H.; Abokhalil, A.G. A novel PSO strategy for improving dynamic change partial shading photovoltaic maximum power point tracker. Energy Sources Part A Recover. Util. Environ. Eff. 2020, 29, 1–15. [Google Scholar] [CrossRef]
  23. Patel, H.; Agarwal, V. MATLAB-based modeling to study the effects of partial shading on PV array characteristics. IEEE Trans. Energy Convers. 2008, 23, 302–310. [Google Scholar] [CrossRef]
  24. Pendem, S.R.; Mikkili, S. Modelling and performance assessment of PV array topologies under partial shading conditions to mitigate the mismatching power losses. Sol. Energy 2018, 160, 303–321. [Google Scholar] [CrossRef]
  25. Ma, J.; Pan, X.; Man, K.L.; Li, X.; Wen, H.; Ting, T.O. Detection and assessment of partial shading scenarios on photovoltaic strings. IEEE Trans. Ind. Appl. 2018, 54, 6279–6289. [Google Scholar] [CrossRef]
  26. Salem, F.; Awadallah, M.A. Detection and assessment of partial shading in photovoltaic arrays. J. Electr. Syst. Inf. Technol. 2016, 3, 23–32. [Google Scholar] [CrossRef] [Green Version]
  27. Zhao, J.; Zhou, X.; Ma, Y.; Liu, Y. Analysis of dynamic characteristic for solar arrays in series and global maximum power point tracking based on optimal initial value incremental conductance strategy under partially shaded conditions. Energies 2017, 10, 120. [Google Scholar] [CrossRef] [Green Version]
  28. Teo, J.C.; Tan, R.H.G.; Mok, V.H.; Ramachandaramurthy, V.K.; Tan, C. Impact of partial shading on the PV characteristics and the maximum power of a photovoltaic string. Energies 2018, 11, 1860. [Google Scholar] [CrossRef] [Green Version]
  29. Villalva, M.G.; Gazoli, J.R.; Filho, E.R. Comprehensive approach to modeling and simulation of photovoltaic arrays. IEEE Trans. Power Electron. 2009, 24, 1198–1208. [Google Scholar] [CrossRef]
  30. TDC-M20-36 Solar Panel. 2018. Available online: https://tdcsolar.en.alibaba.com/product/60018196685-220763581/20w_mono_small_solar_panel_from_chinese_factory.html?spm=a2700.8304367.rect38f22d.16.47185198OcAXoD (accessed on 10 January 2018).
  31. Motahhir, S.; El Ghzizal, A.; Sebti, S.; Derouich, A. Shading effect to energy withdrawn from the photovoltaic panel and implementation of DMPPT using C language. Int. Rev. Autom. Control 2016, 9, 88–94. [Google Scholar] [CrossRef]
Figure 1. PV cell equivalent circuit.
Electronics 11 00096 g001
Figure 2. PV array configuration.
Electronics 11 00096 g002
Figure 3. The PV array’s P-V curves at various irradiation levels.
Electronics 11 00096 g003
Figure 4. PV array with three PV panels exposed to shade.
Electronics 11 00096 g004
Figure 5. P-V curves of PV array for STC and for two shading scenarios.
Electronics 11 00096 g005
Figure 6. The current flow direction of the PV array (a) in area 1 and (b) in area 2.
Electronics 11 00096 g006
Figure 7. Experimental set-up of the measurement system.
Electronics 11 00096 g007
Figure 8. The variation in irradiance levels during a day in shaded and unshaded places.
Electronics 11 00096 g008
Figure 9. The P-V characteristic of the PV array for different shading scenario tests: (a) Test 1, (b) Test 2, (c) Test 3, (d) Test 4, (e) Test 5.
Electronics 11 00096 g009
Figure 10. Variation of Pmpp1 and Pmpp2 according to the irradiance value of the unshaded panel.
Electronics 11 00096 g010
Table 1. Specifications of the PV panel used [30].
TDC-M20-36 PV Panel at STC
Maximum power20 W
Maximum voltage18.76 V
Maximum current1.07 A
Short-circuit current1.17 A
Open-circuit voltage22.70 V
Temperature coefficient of open-circuit voltage−0.35%/°C
Temperature coefficient of short-circuit current−0.043%/°C
Number of cells36
Type of cellsMonocrystalline
Table 2. Tests applied to the simulation set-up.
Number of Shaded PanelsThe Unshaded Panel Irradiance (W/m2)The Shaded Panel Irradiance (W/m2)
Test 11200–1000100
Test 22200–1000100
Test 33200–1000100
Test 44200–1000100
Test 55200–1000100
Table 3. The P-V characteristic data for test 1.
GisPmpp1 (W)Vmpp1 (V)Vmpp1 (V) EstimateErrorPmpp2 (W)Vmpp2 (V)Vmpp2 (V) EstimateError
20019.3389.8690.350.4913.29118.1109.268.84
30029.4190.9791.60.6313.65121.1110.7610.34
40039.5191.8992.30.4113.86123.3111.611.7
50049.6292.5293.050.4714.01124.4112.511.9
60059.792.7493.20.5414.13125.4112.6812.54
70069.7492.9493.350.5914.22126.4112.8613.54
80079.7293.1793.450.2814.3127.1112.9814.12
90089.6593.1593.550.4014.32128.4113.115.3
100099.5193.1293.650.4914.33129.2113.2215.98
Table 4. The P-V characteristic data for test 2.
GisPmpp1 (W)Vmpp1 (V)Vmpp1 (V) EstimateErrorPmpp2 (W)Vmpp2 (V)Vmpp2 (V) EstimateError
20015.2671.0771.560.4912.81114.7109.265.44
30023.2172.572.560.0613.1117.5110.766.74
40031.1972.9673.120.1613.26119.1111.67.5
50039.1873.0773.720.6513.38120.2112.57.7
60047.1473.3473.750.4113.47121.2112.688.52
70055.0773.3373.850.5213.55121.6112.868.74
80062.9473.9573.920.0313.55123.3112.9810.32
90070.8173.6174.000.6113.64123.4113.110.3
100078.5873.4874.080.6013.68123.9113.2210.68
Table 5. The P-V characteristic data for test 3.
GisPmpp1 (W)Vmpp1 (V)Vmpp1 (V) EstimateErrorPmpp2 (W)Vmpp2 (V)Vmpp2 (V) EstimateError
20011.1952.0852.620.5412.4112.8109.263.54
30017.0253.2153.370.1612.61114.6110.763.86
40022.8853.4153.790.3812.74115.2111.63.6
50028.7453.6454.240.6012.83115.8112.53.3
60034.5853.7254.240.5212.87117.6112.684.92
70040.4153.9554.330.6212.94117.7112.865.02
80046.1954.2354.390.1612.99118.2112.985.34
90051.9554.154.450.3513.04118.1113.15
100057.6654.0754.510.4413.05119.1113.225.88
Table 6. The P-V characteristic data for test 4.
GisPmpp1 (W)Vmpp1 (V)Vmpp1 (V) EstimateErrorPmpp2 (W)Vmpp2 (V)Vmpp2 (V) EstimateError
2007.1133.2533.680.4312.03110.2109.260.94
30010.4833.7234.180.4612.17111.4110.760.64
40014.5733.9234.460.5412.52112.2111.60.6
50018.3134.3334.760.4312.31112.6112.50.1
60022.0334.334.760.4612.35113.6112.680.92
70025.7434.4334.820.3912.39113.6112.860.32
80029.4334.4834.860.3812.42113.3112.980.33
90034.6734.0934.90.8112.45114.1113.11
100036.7334.5434.940.4012.47114.5113.221.28
Table 7. The P-V characteristic data for test 5.
GisPmpp1 (W)Vmpp1 (V)Vmpp1 (V) EstimateErrorPmpp2 (W)Vmpp2 (V)Vmpp2 (V) EstimateError
2003.0414.1014.740.6411.69107.9109.261.36
3004.6514.5414.990.4511.76108.8110.761.96
4006.2614.8215.130.3111.8108.8111.62.8
5007.8814.8915.250.3611.83109.3112.53.2
6009.4814.9515.280.3311.85109.8112.682.9
70011.0915.0215.310.2911.87109.6112.863.26
80012.6814.9715.330.6411.89109.5112.983.48
90014.2615.0515.350.3011.9110.2113.13.12
100015.8314.9815.370.3911.91110.1113.223.11
Publisher’s Note: MDPI stays neutral with regard to jurisdictional claims in published maps and institutional affiliations.

