
Design and Analysis of VTOL Operated Intercity Electrical Vehicle for Urban Air Mobility

 , , and
Abstract
:1. Introduction
2. Literature Study
Study of Similar Aircrafts
3. Layout
3.1. Initial Design and Discussion
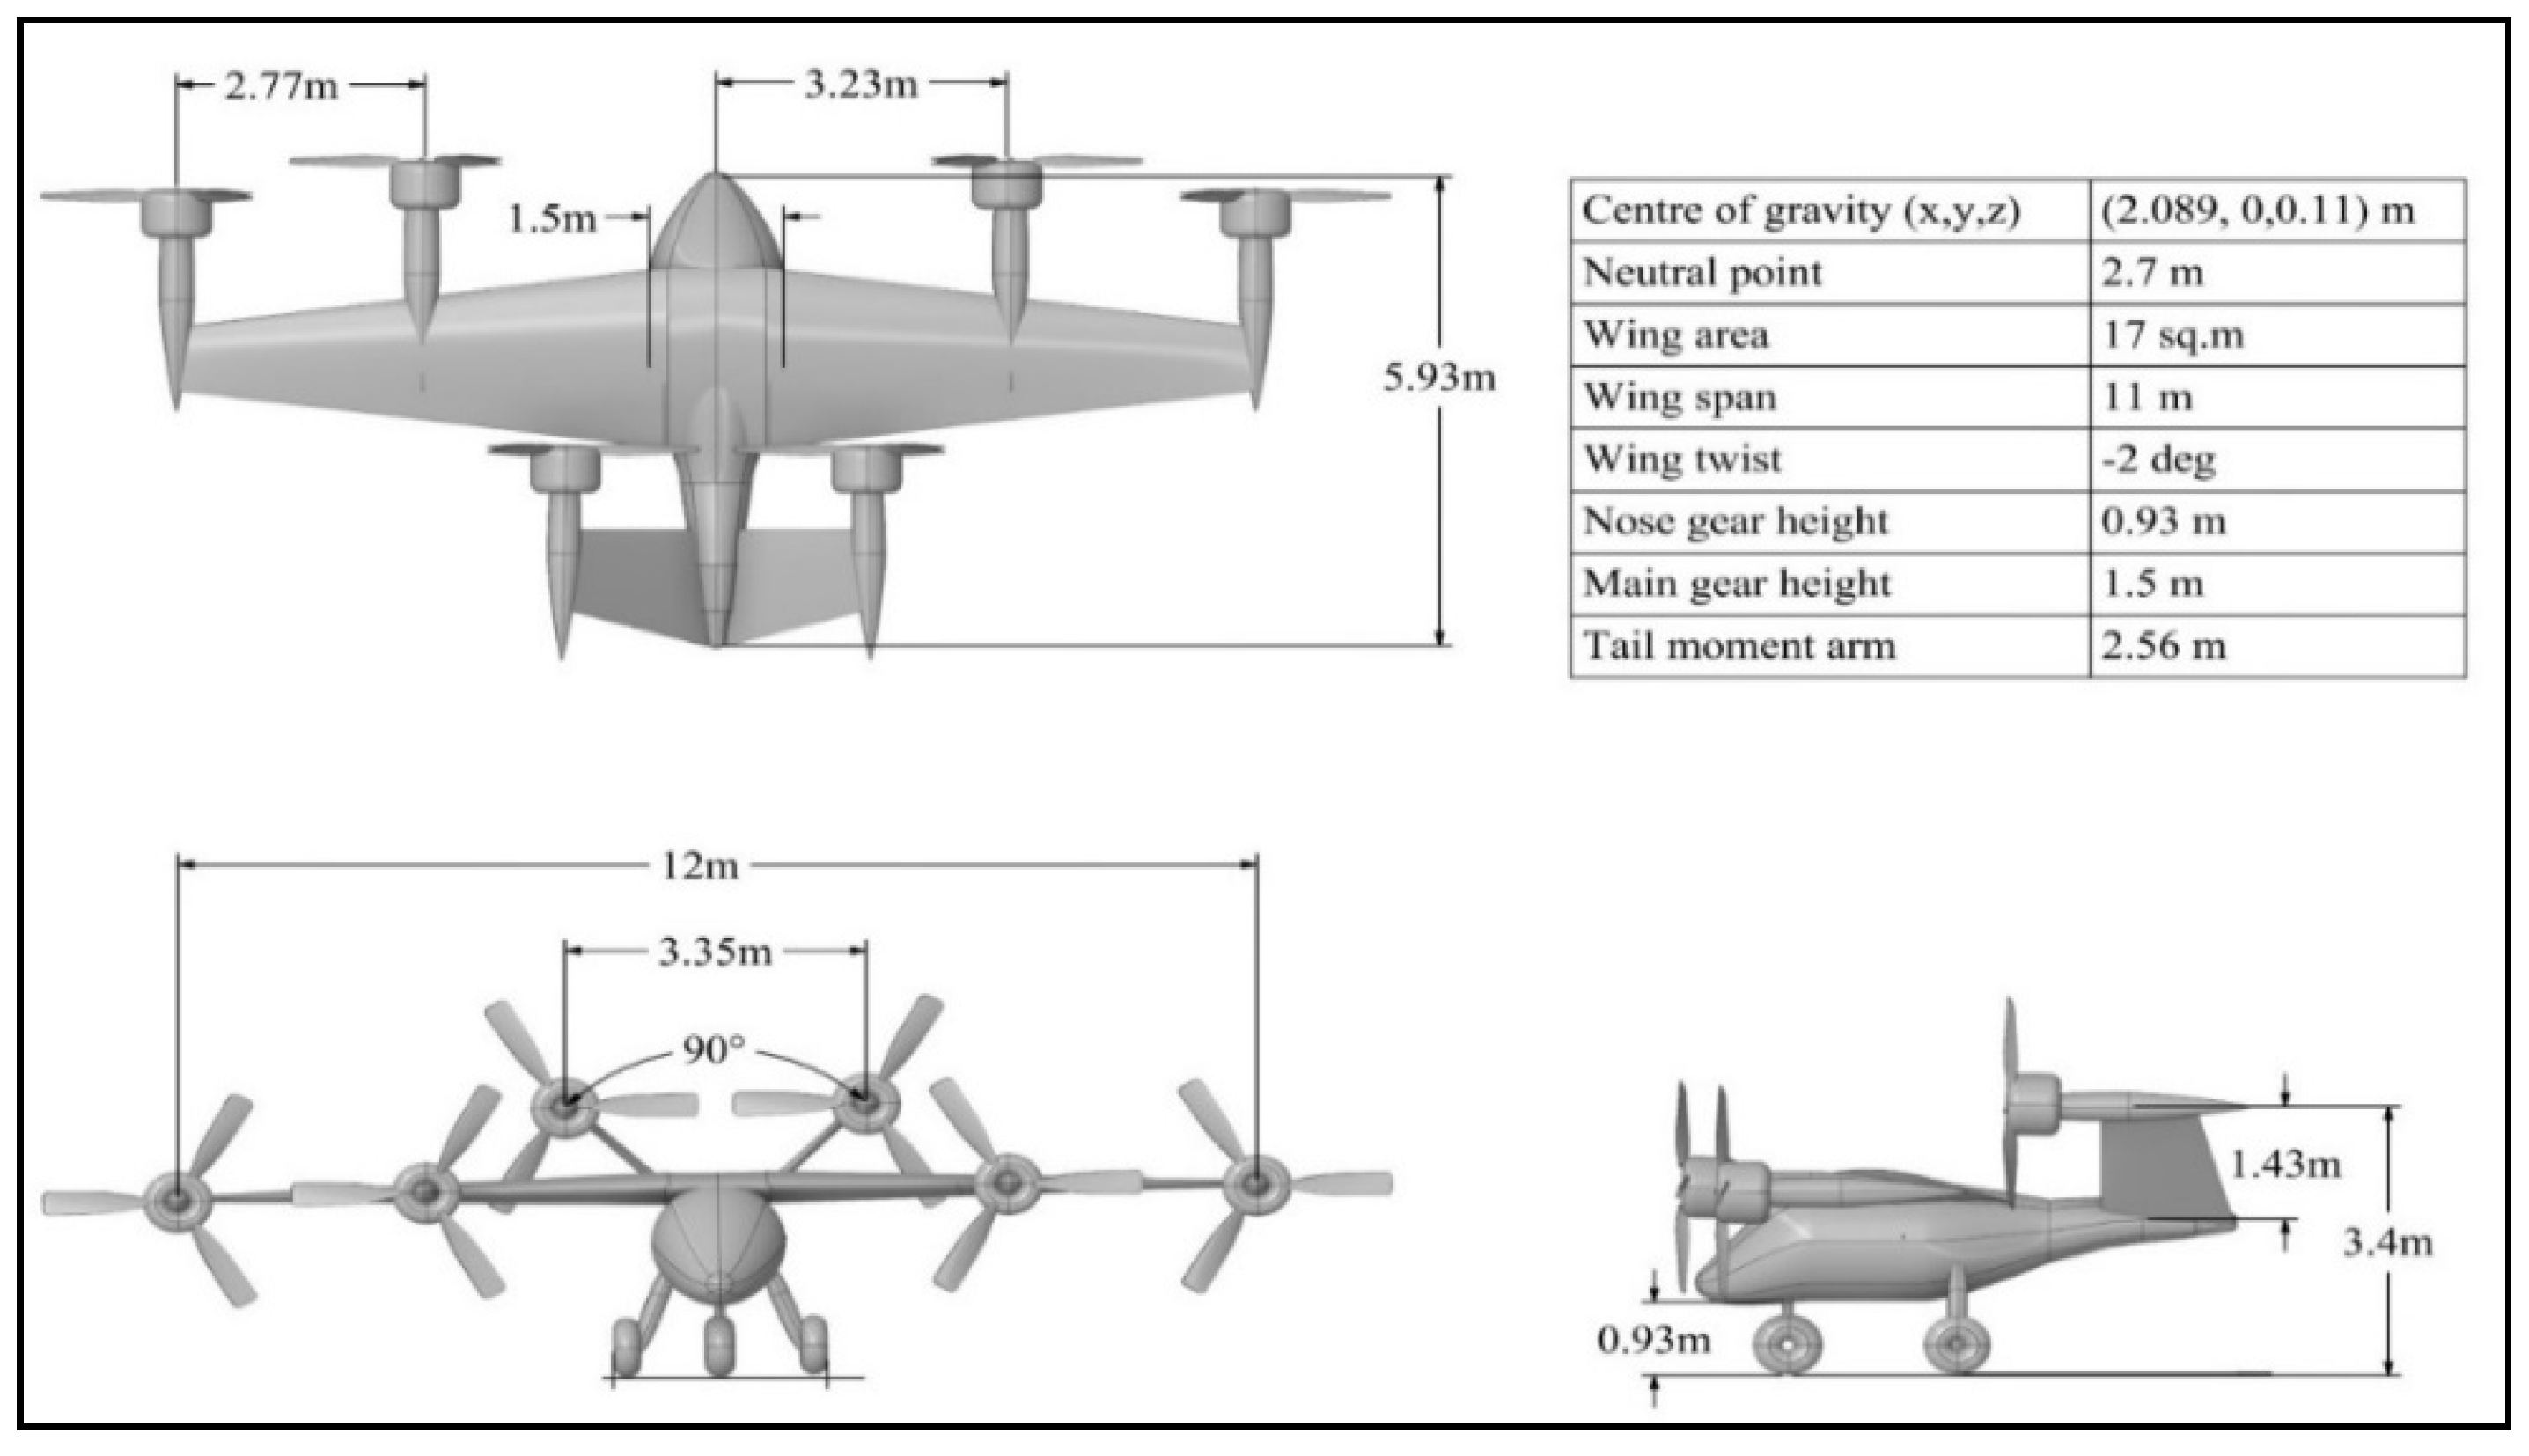
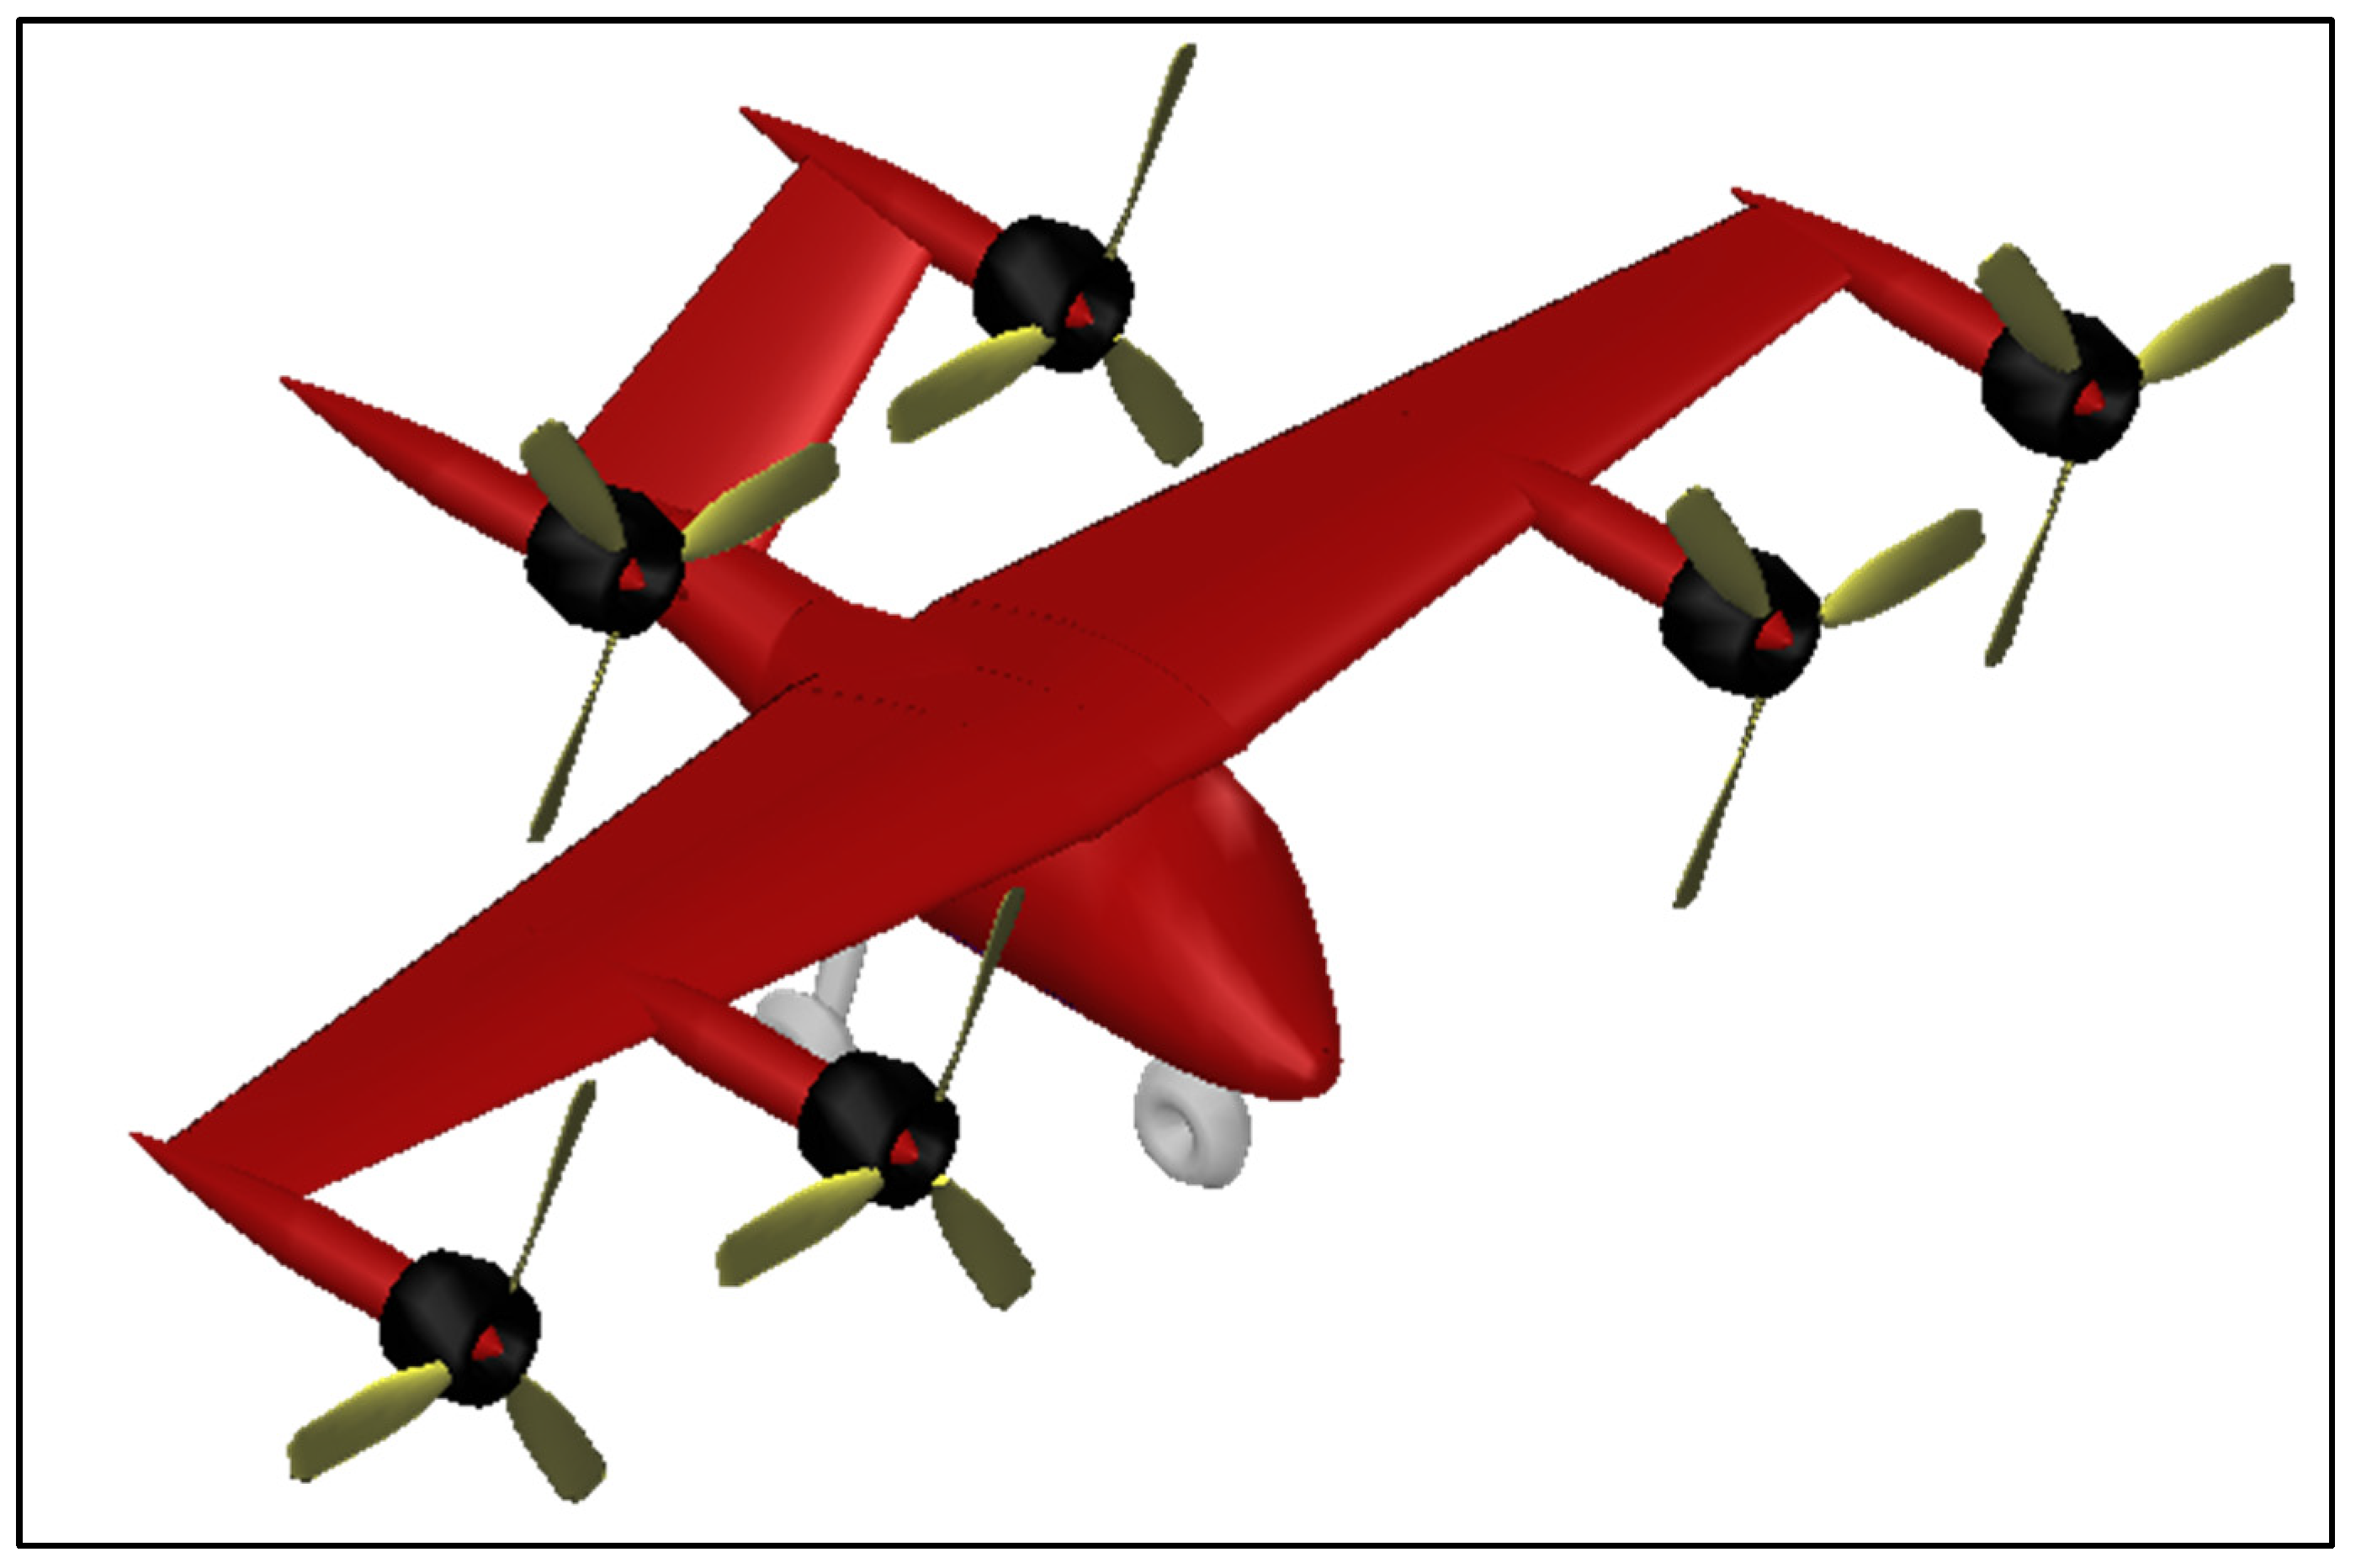
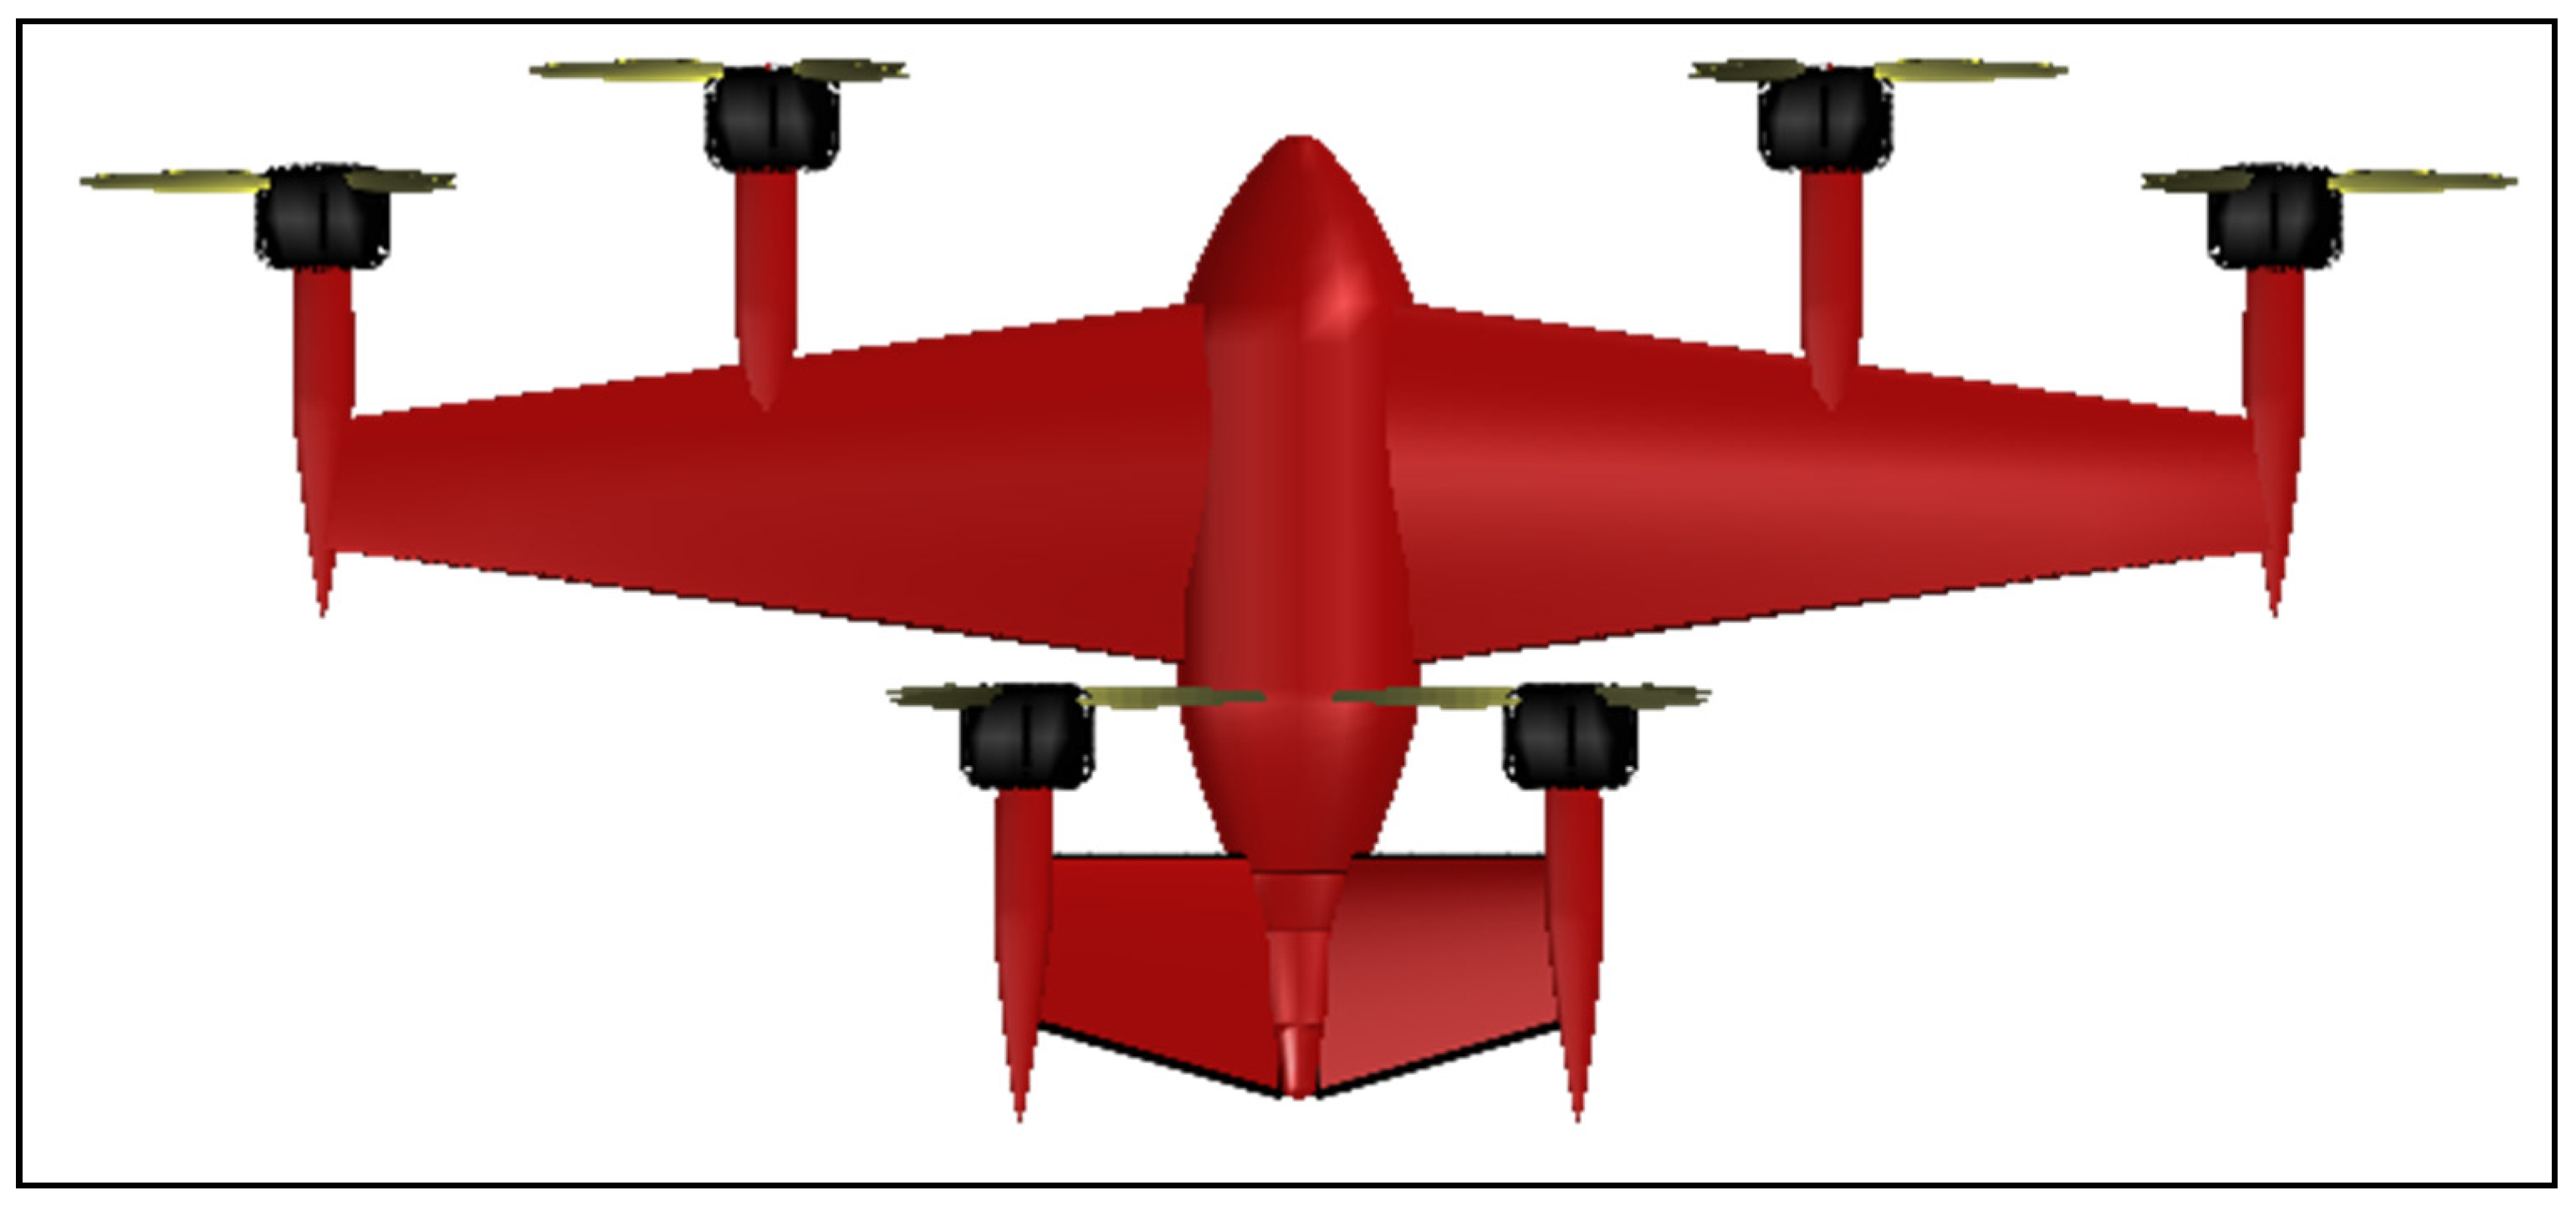
3.2. Overview of the Present Design
3.3. Configuration Selection
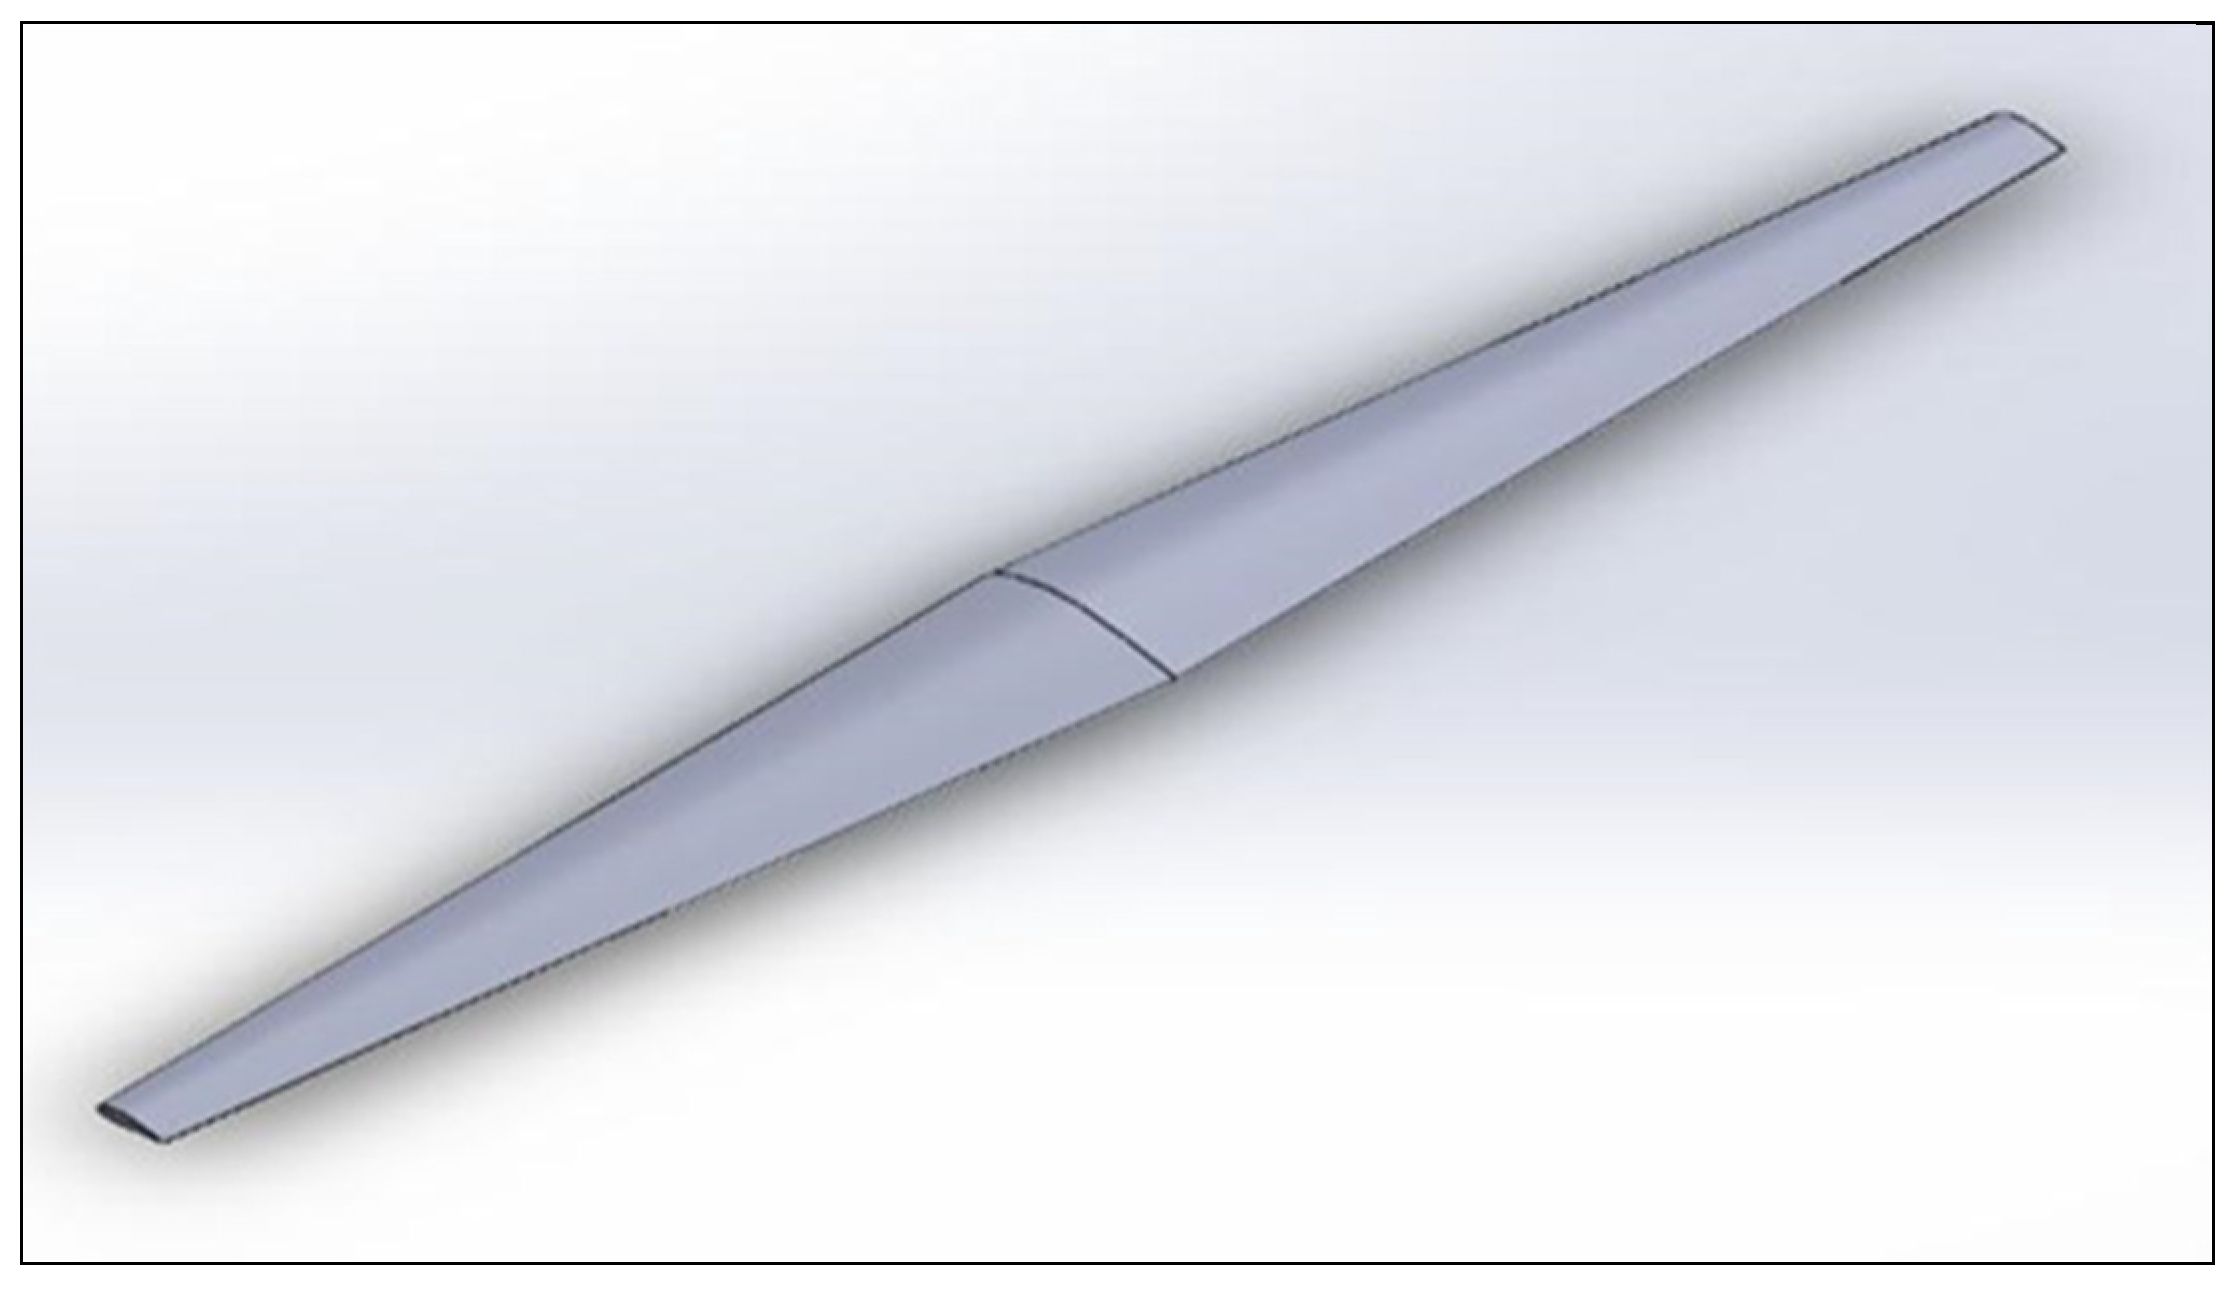
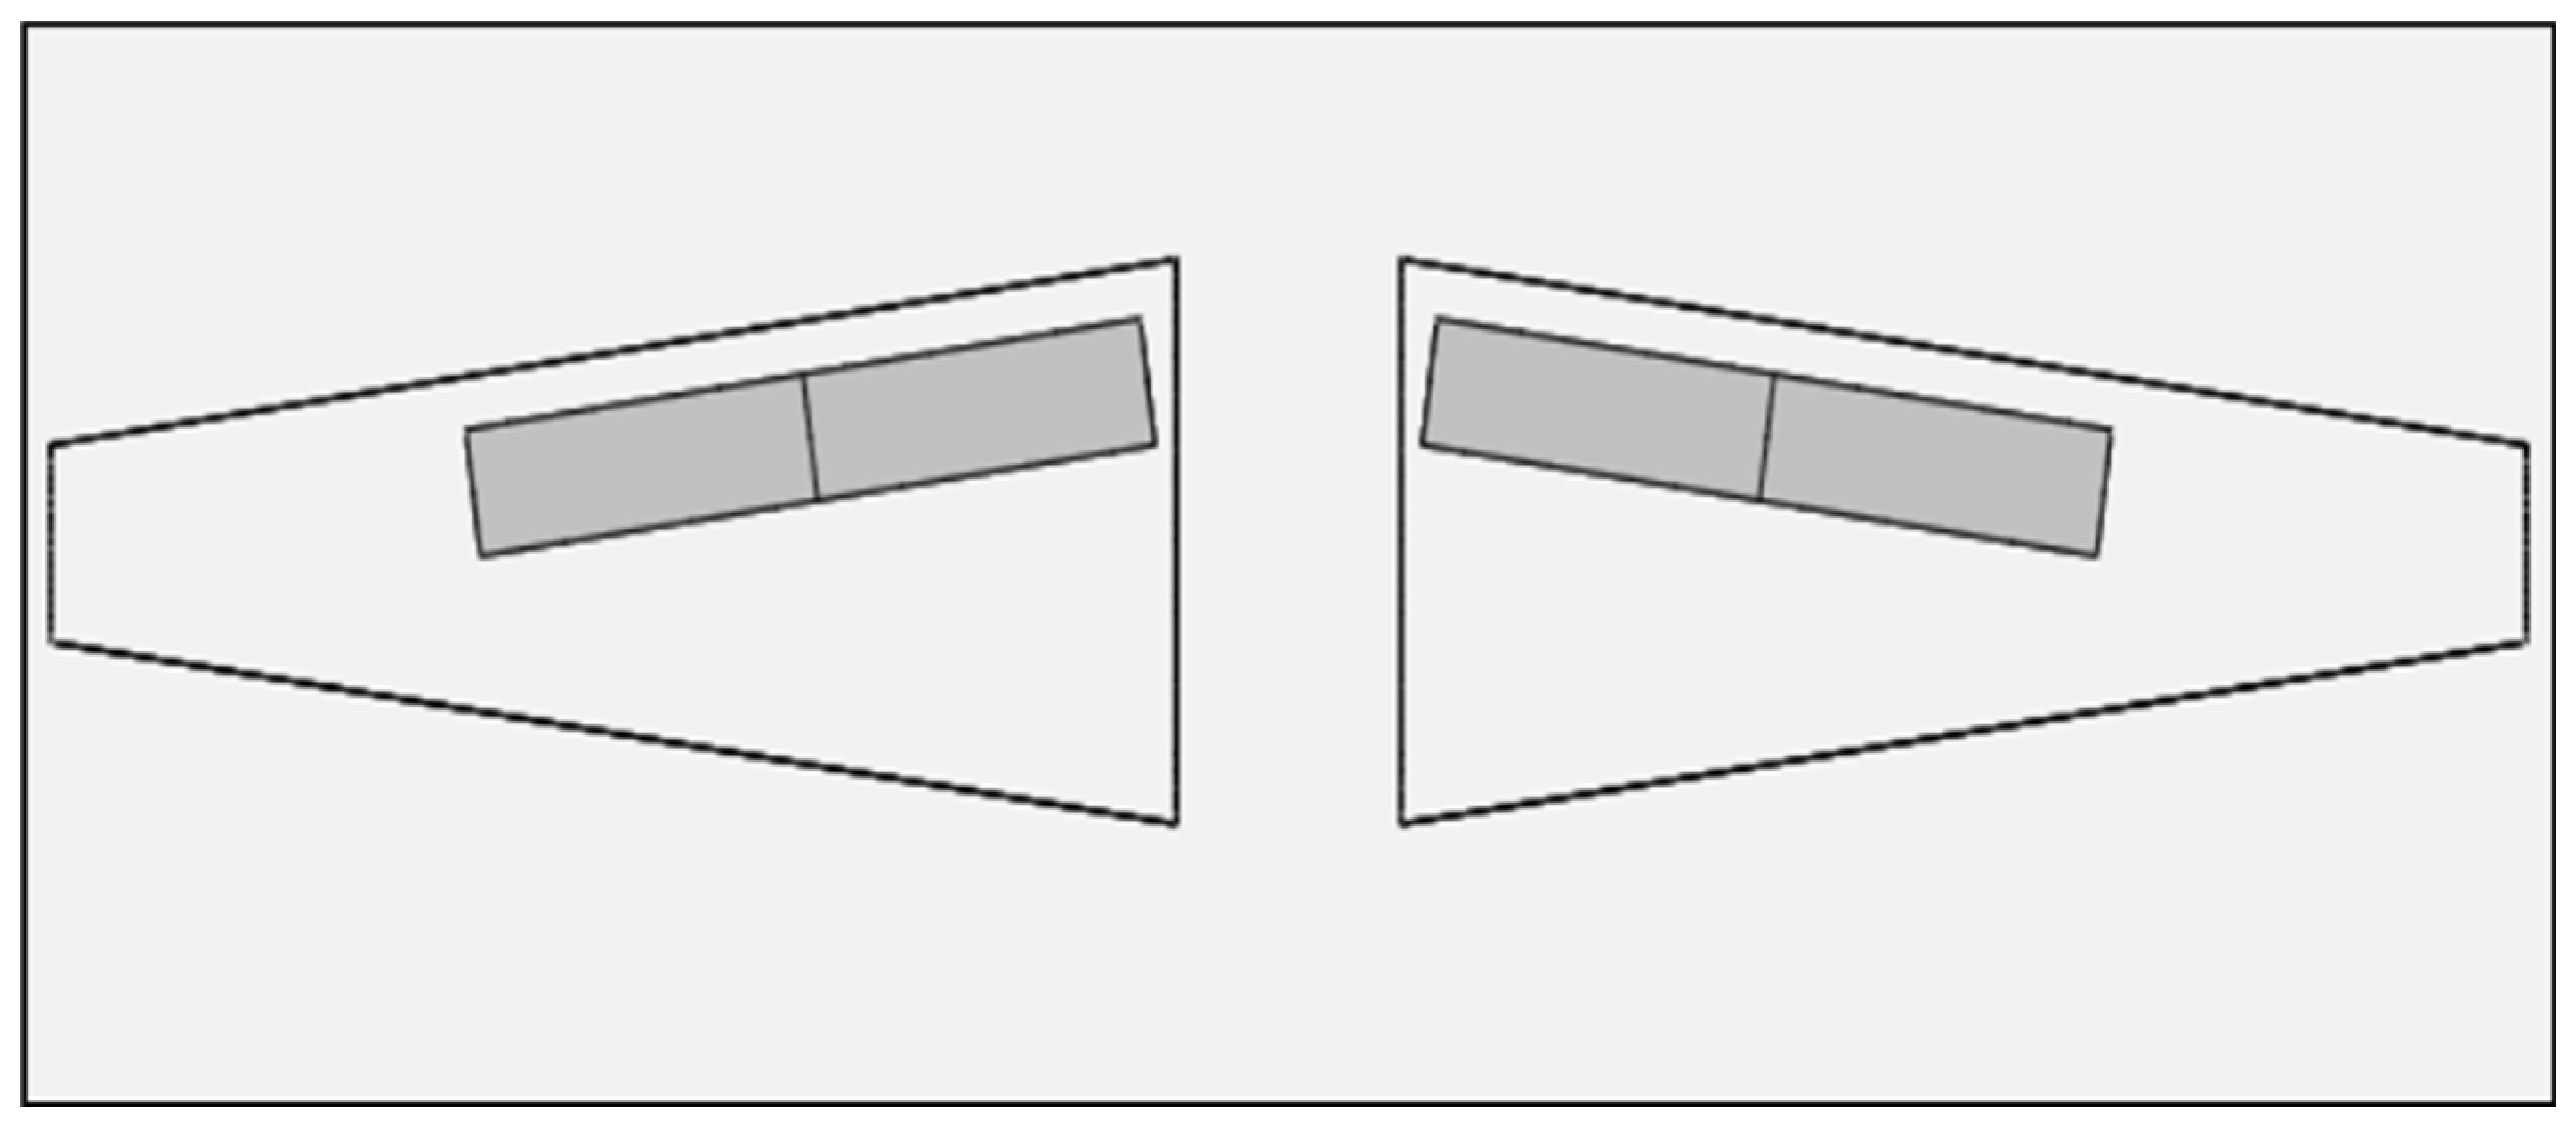
3.4. Wing Planform
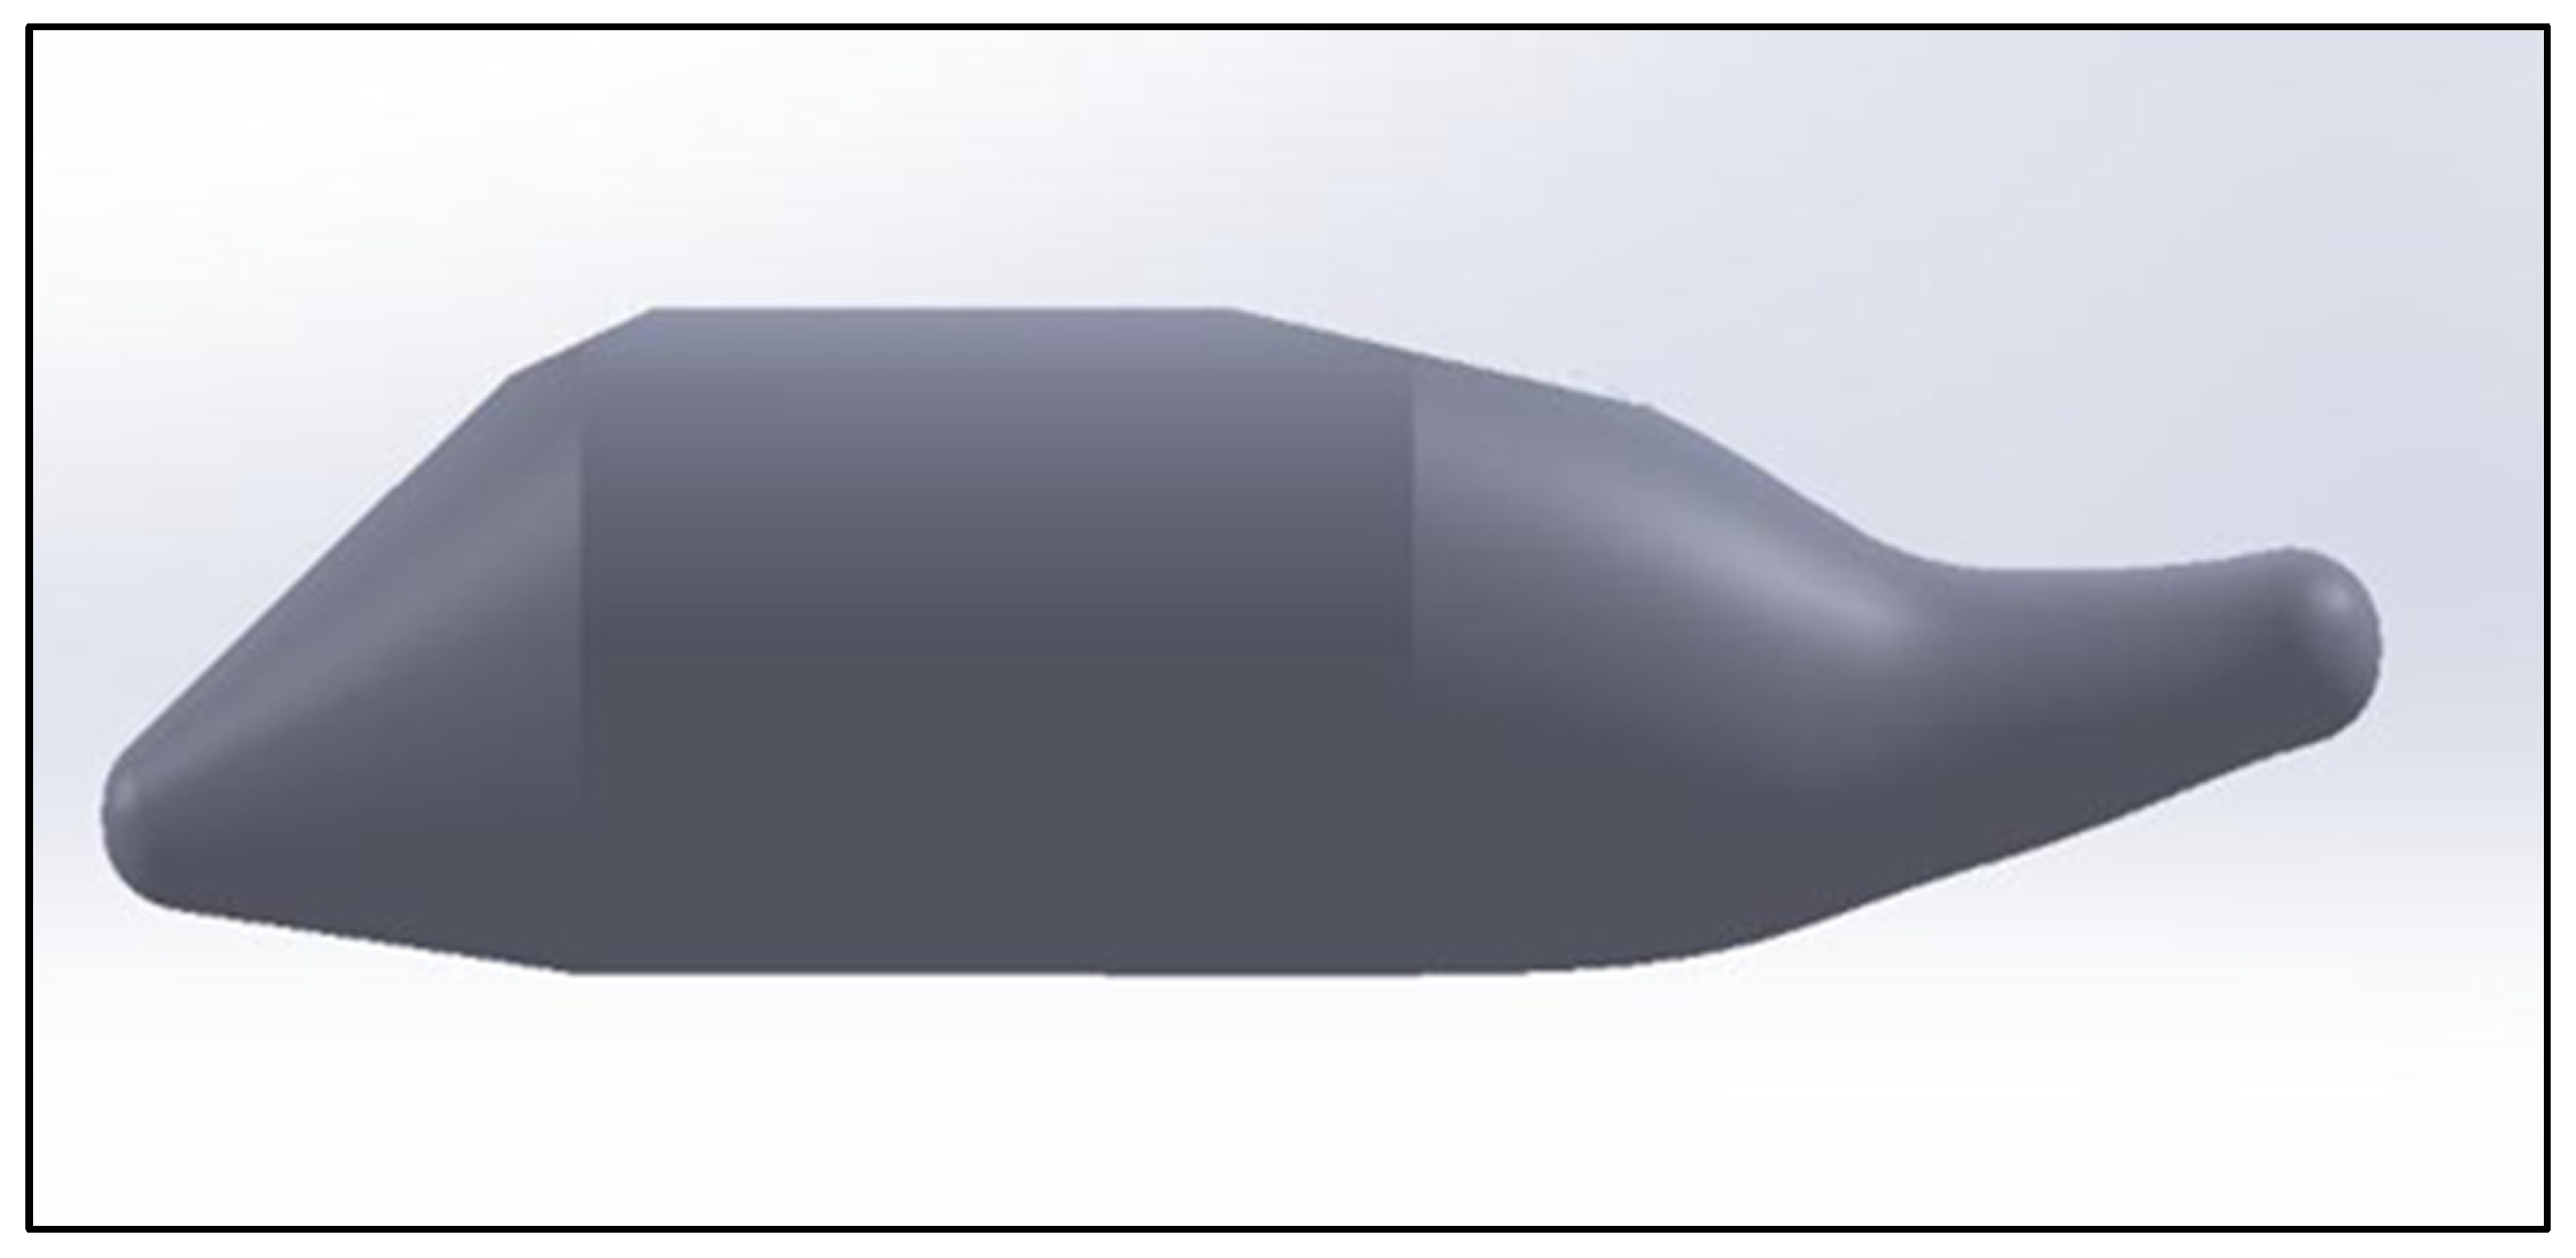
3.5. Fuselage
3.6. Landing Gear
3.7. Aerodynamic Control Surfaces
3.8. Propulsion
- Since the number of propellers in our design is six (four mounted on the wing and two on V-tail), the required thrust is obtained by increasing the diameter of the blades of the propellers. If we opt for larger diameter blades, we have to increase the area of the duct. This increases the wetted surface area which in turn increases the drag. Furthermore, the interaction of duct vortices might reduce the efficiency of the rear propellers. The construction of the duct and its support structure increases manufacturing costs and also increases the total gross weight of the eVTOL aircraft.
- In a ducted fan, the manufacturing tolerances are essential; the tighter it is, the more efficient the fan is. However, as it becomes tighter, the fans are susceptible to hitting the duct due to the flexing of blades. The pitch control and RPM control become difficult to implement due to the ducts.
- In the event of a crosswind on a ducted fan, it results in a sudden pitching moment due to the lip of the duct and the asymmetric inflow to the rotor makes the aircraft lose control and stability [26].
4. Mission Profile and Preliminary Sizing Calculations
- Range: 500 km;
- Crew: one pilot (90 kg with baggage);
- Payload capacity: 500 kg;
- Air-taxi mode: Four (04) Passenger and 0.5 m3 cargo hold;
- Air-cargo mode: 1.5 m3 cargo hold by removing passenger seats;
- Cruise and maximum speed: 200 and 250 km/h TAS;
- Powerplant: green propulsion using non-fossil fuel;
- Operational constraint: take-off and land from building rooftop;
- Enroute constraint: maintain separation of >600 m;
- Entry to market: before 1 January 2031.
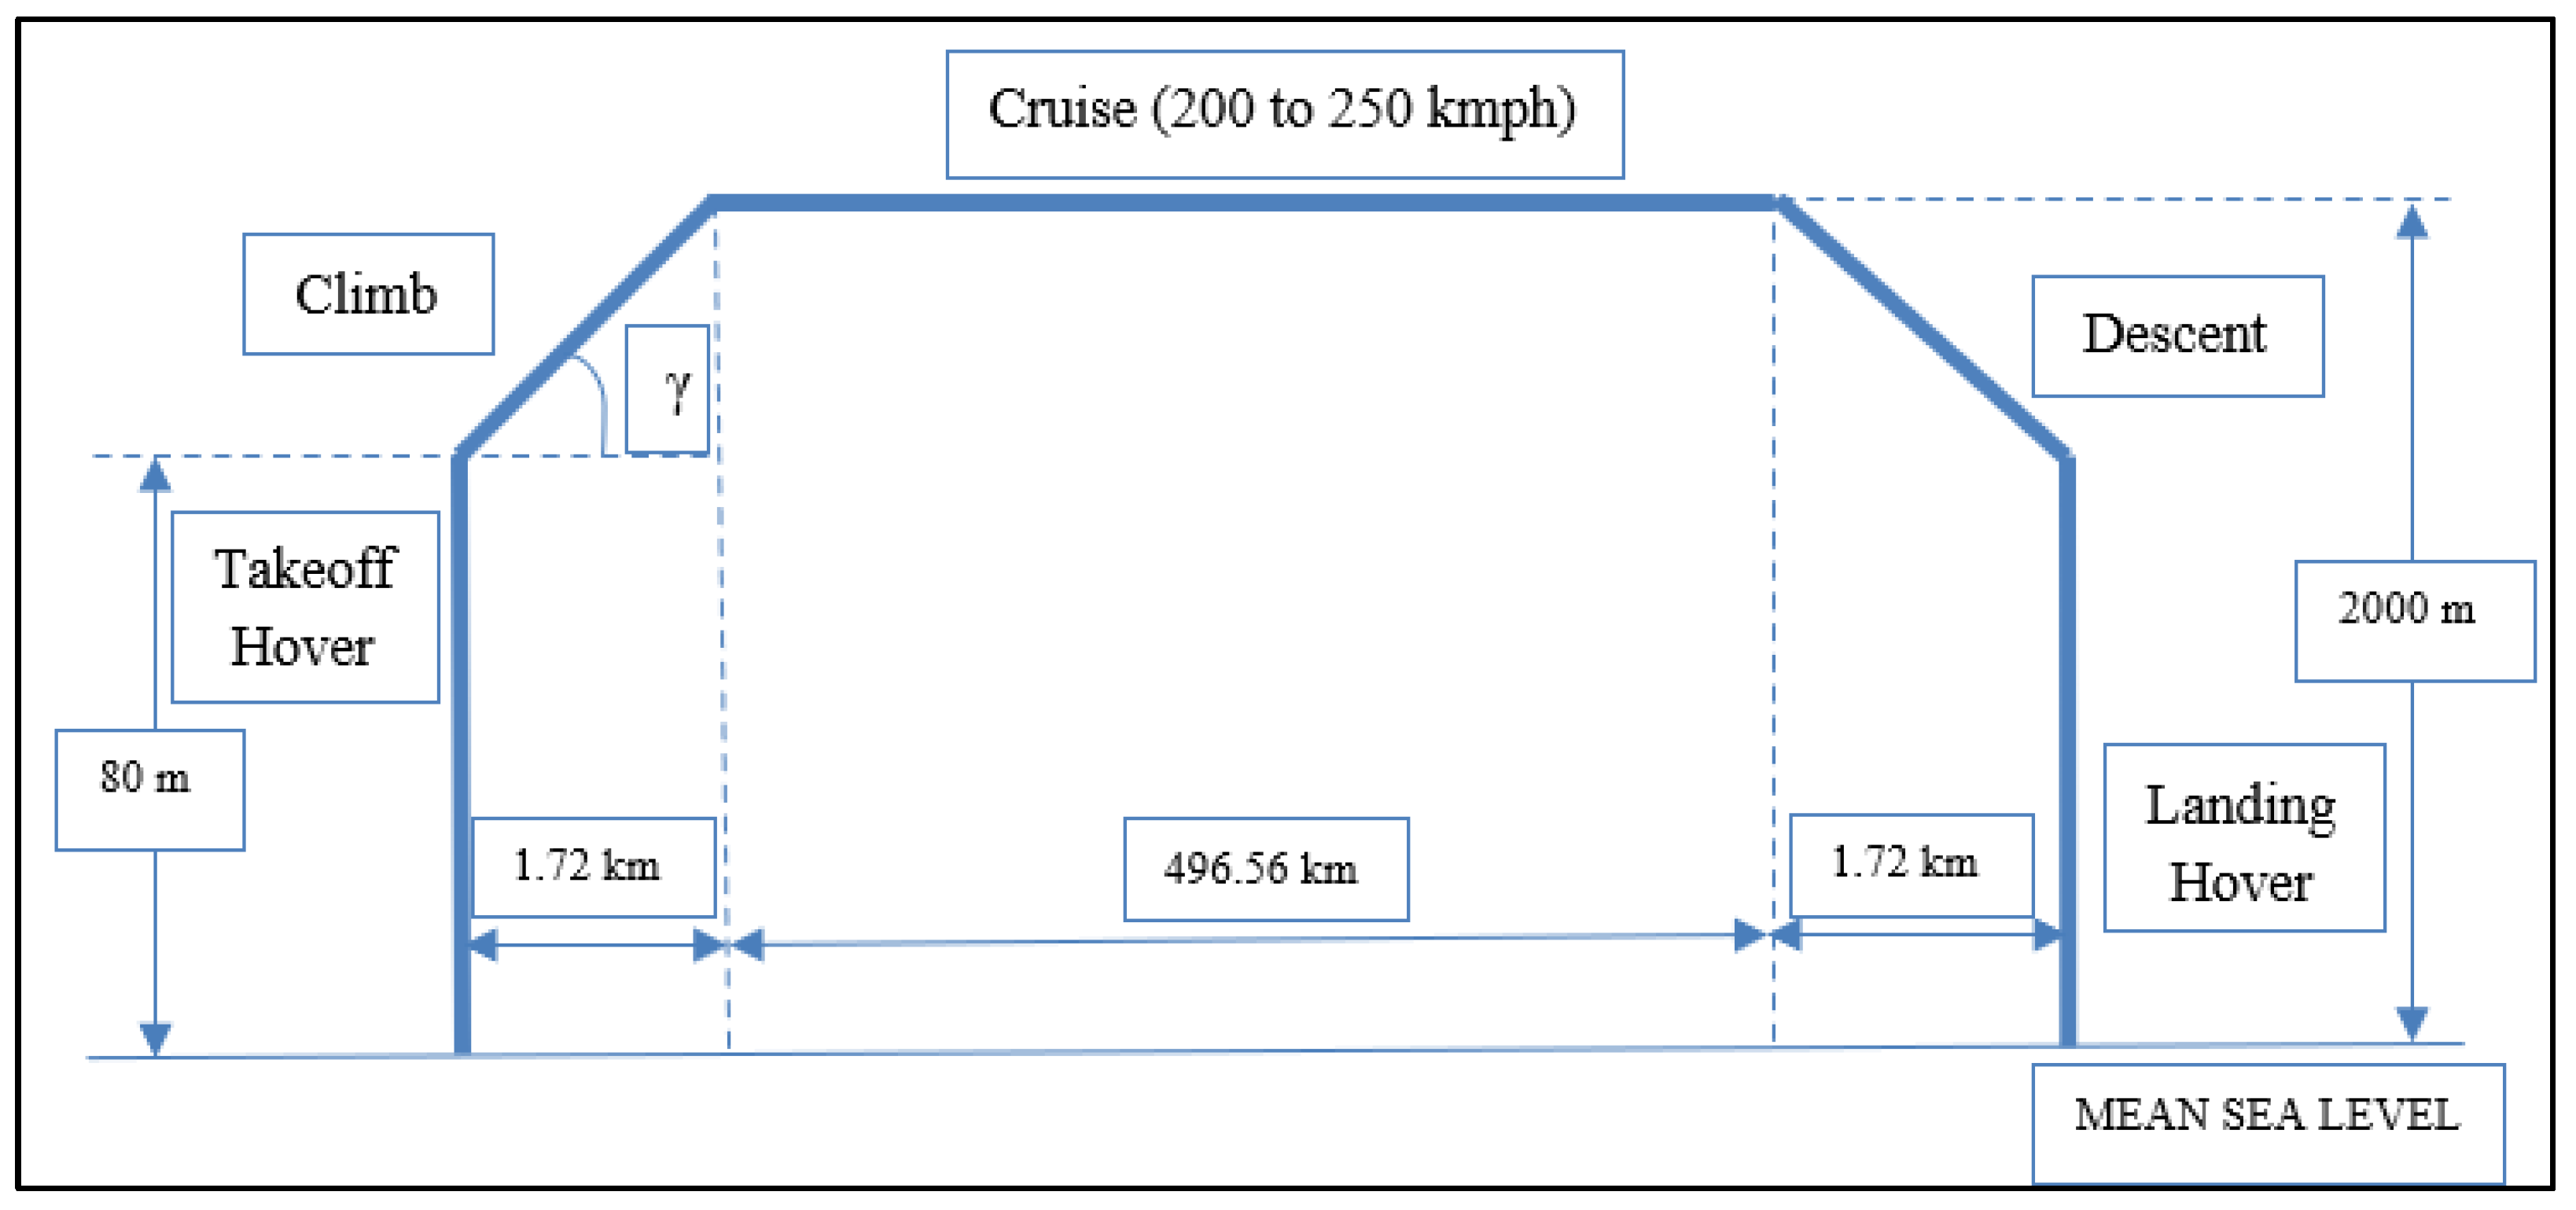
4.1. Mission Profile Planning
4.2. Initial Sizing, Methodology and Payload-Range Diagram
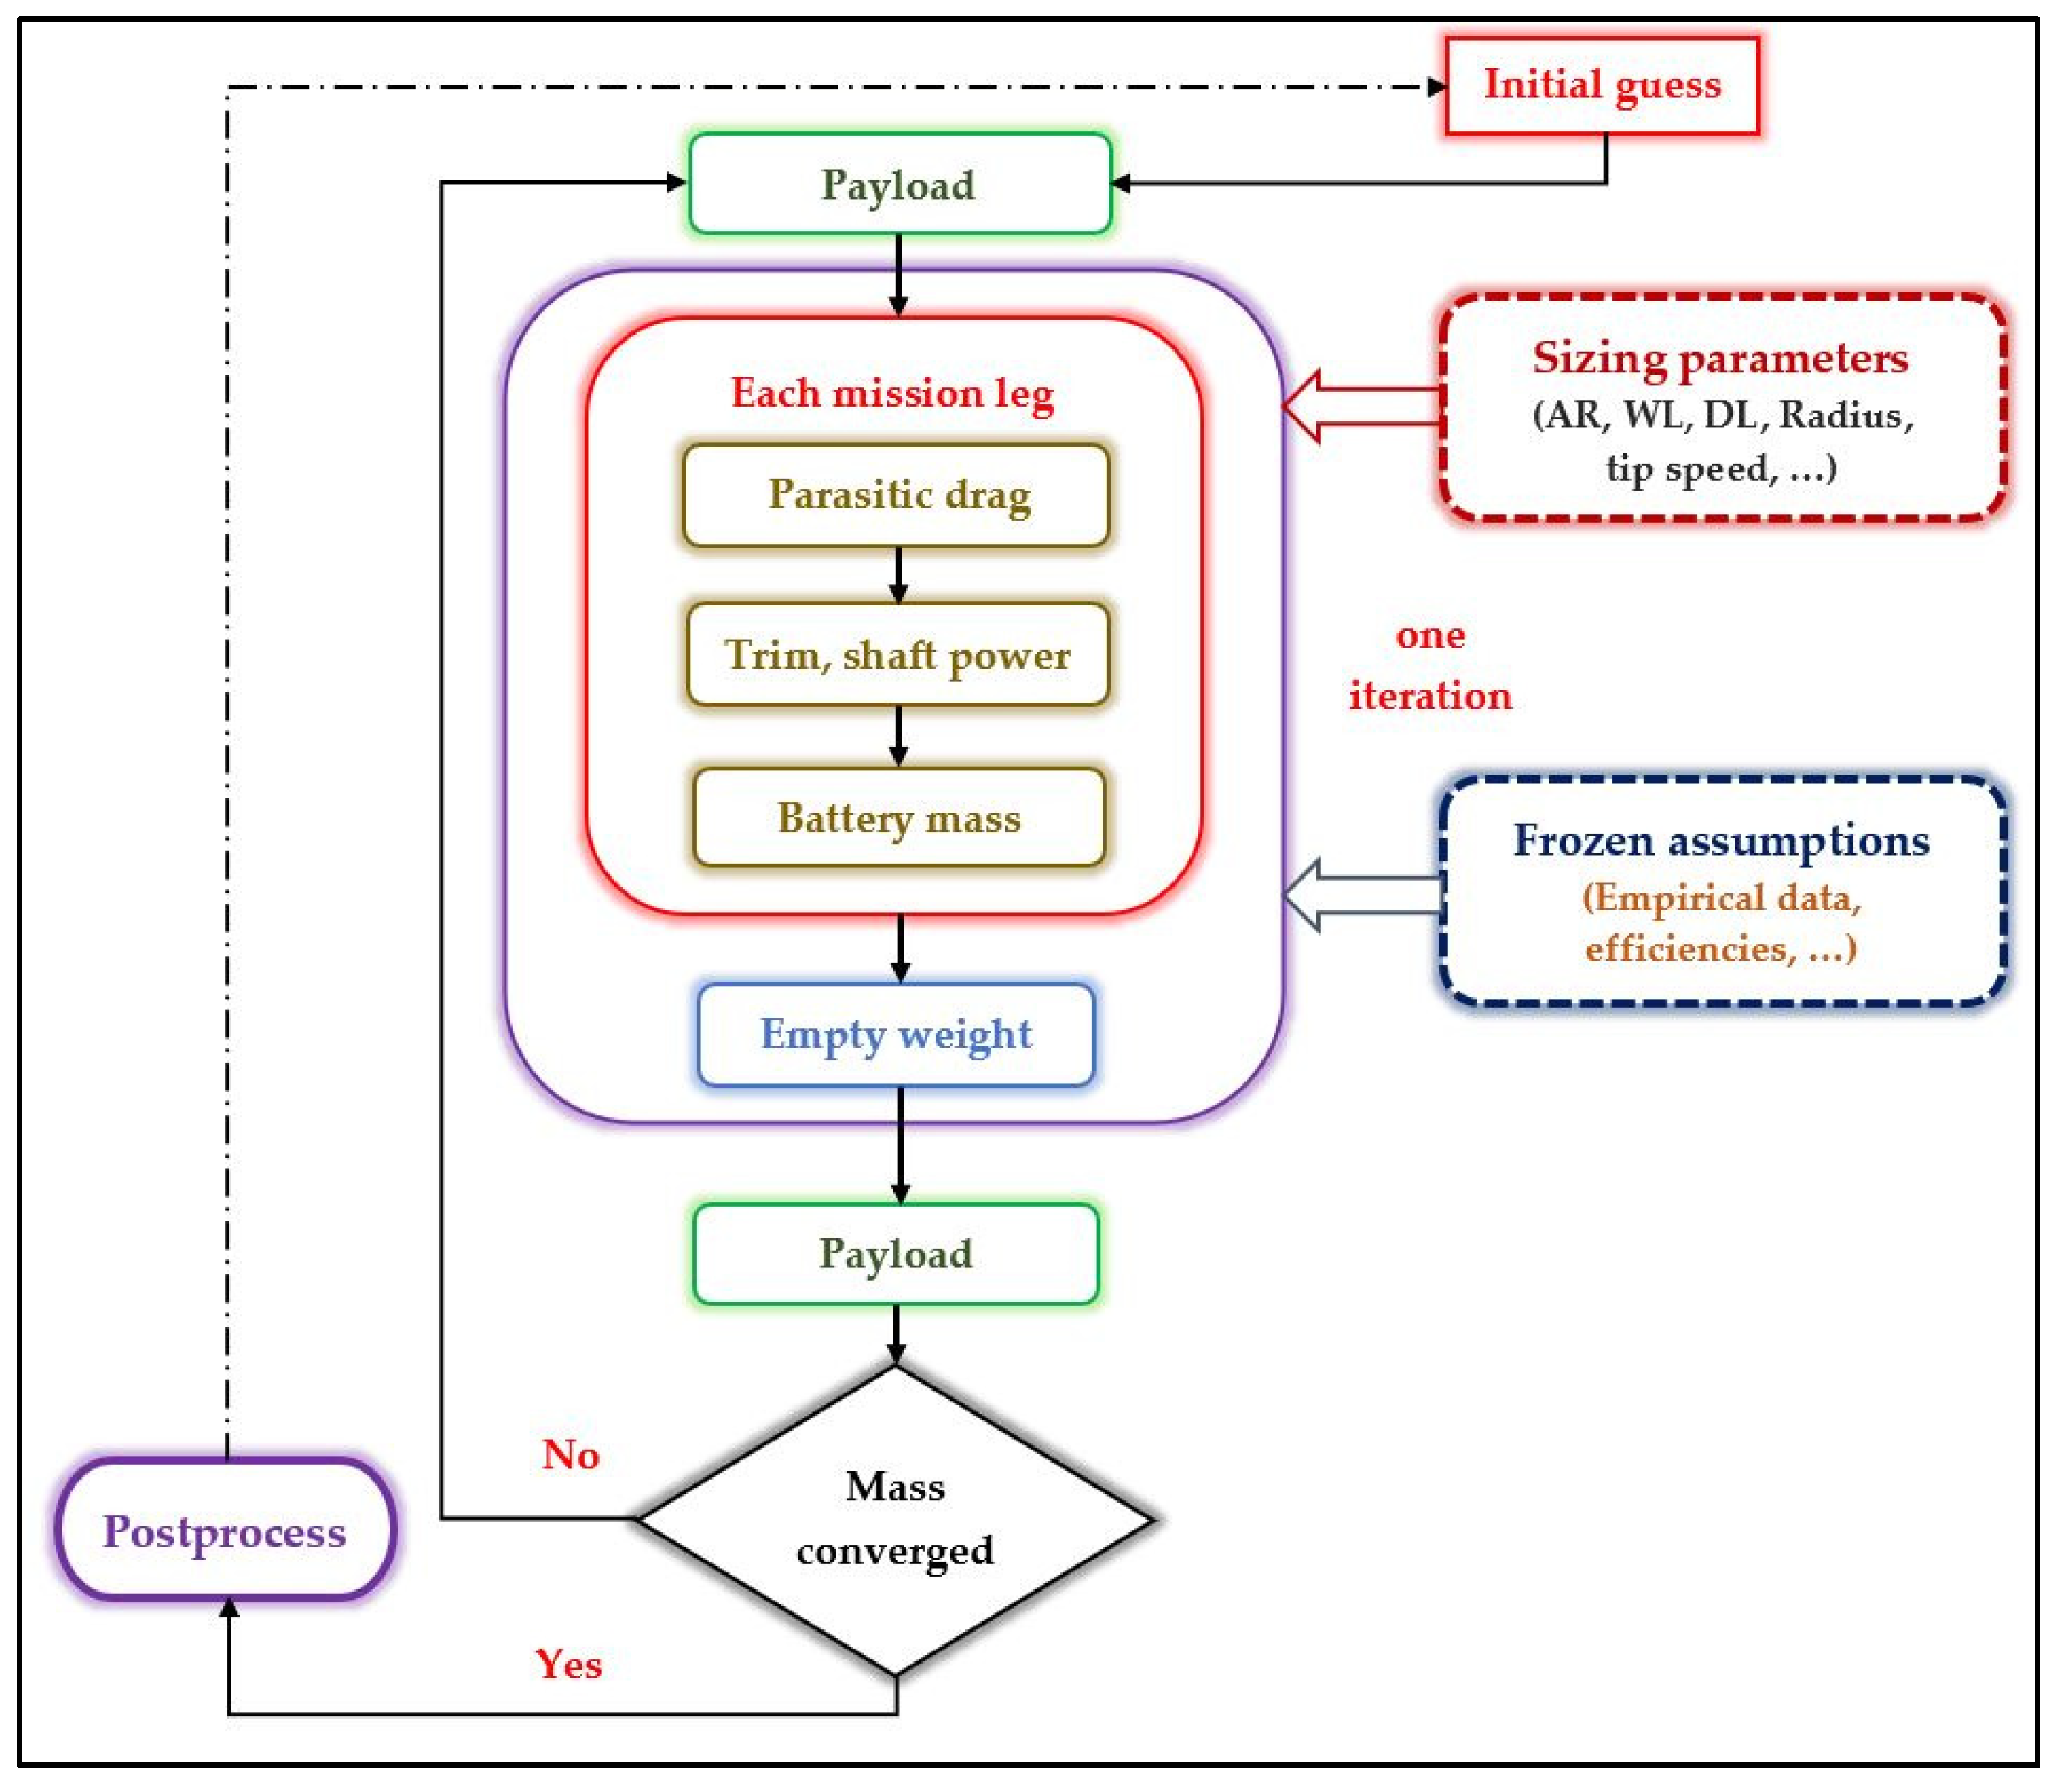
4.2.1. Methodology for Sizing
4.2.2. Iteration Process in the Estimation of the Weight of the Wing
4.2.3. Iteration Process in the Estimation of the Weight of the Fuselage
4.2.4. Iteration Process in the Estimation of the Weight of V-Tail and Flight Controls
4.2.5. Iteration Process in the Estimation of the Weight of the Landing Gear
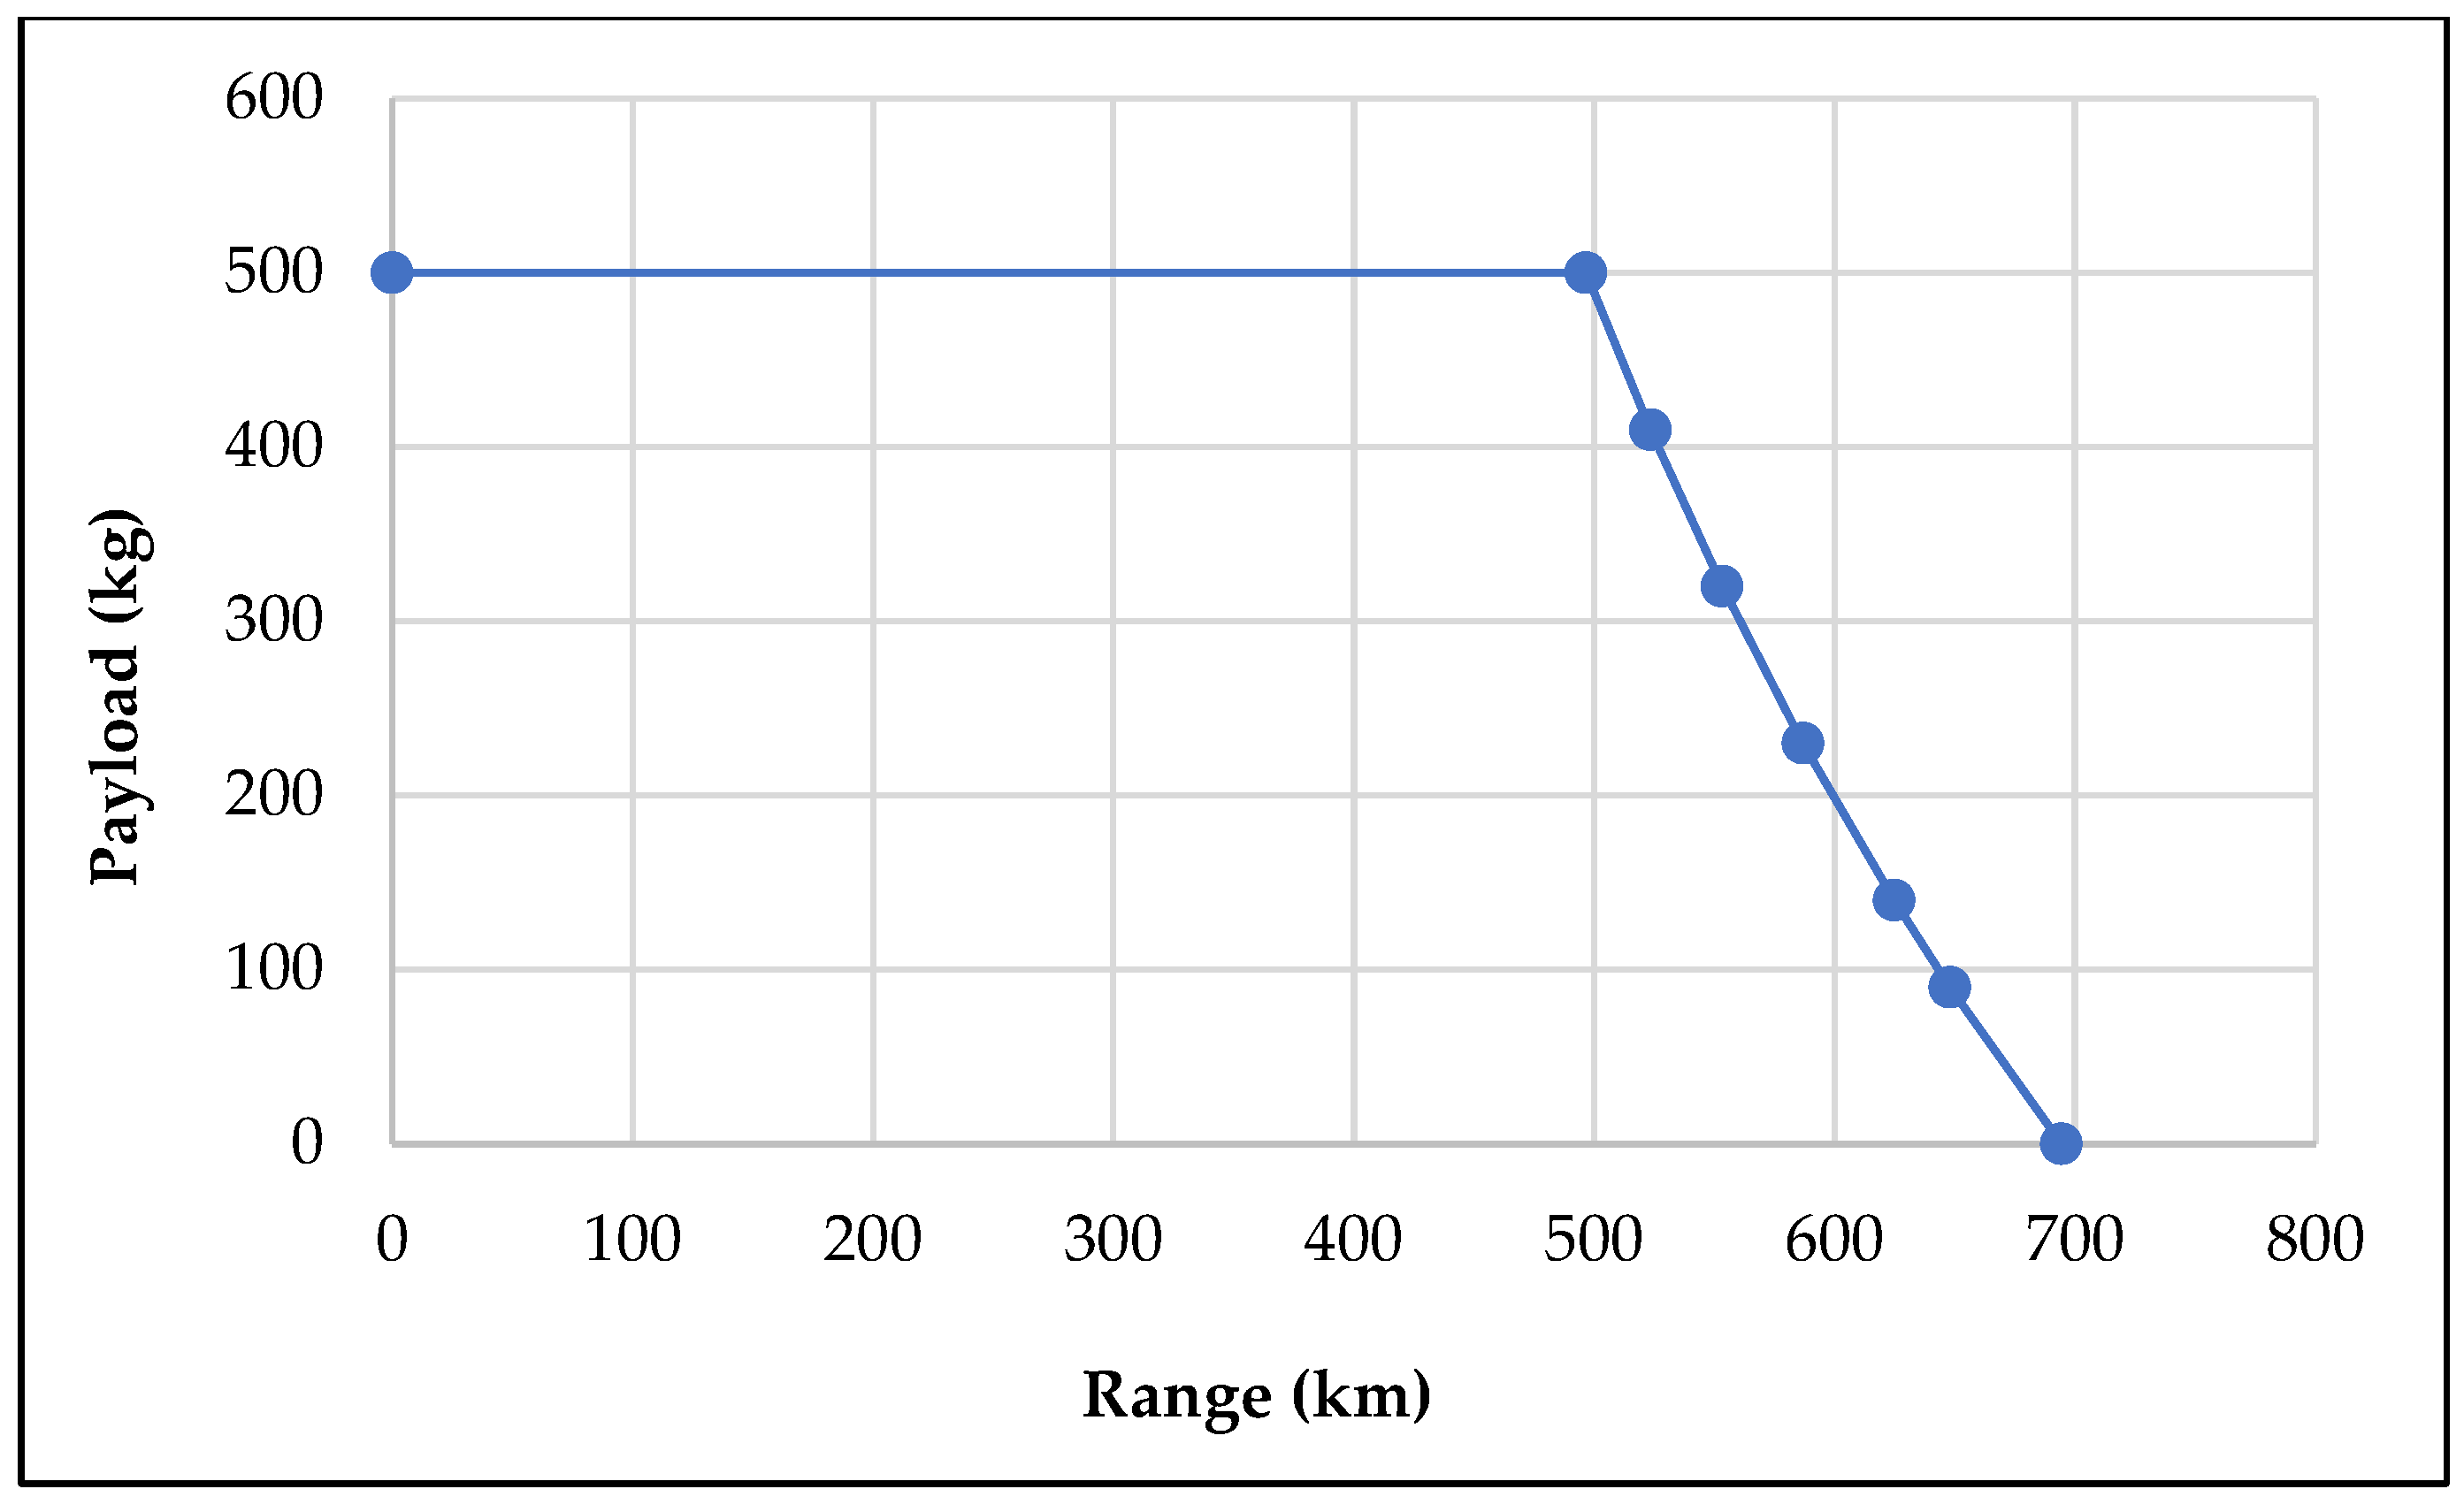
4.2.6. Payload Range Diagram
4.3. Key Design Challenges
5. Airfoil and Wing Planform Selection
- The present eVTOL aircraft is taken to be flying at 2 km altitude in International Standard Atmosphere. The cruise speed is taken as 200 km/h.
- An aspect ratio of 8 was selected to reduce the span as much as possible. This will reduce the wing bending load due to placing the rotors on the wing. This will also enable the eVTOL to land on helipads.
5.1. Airfoil Selection
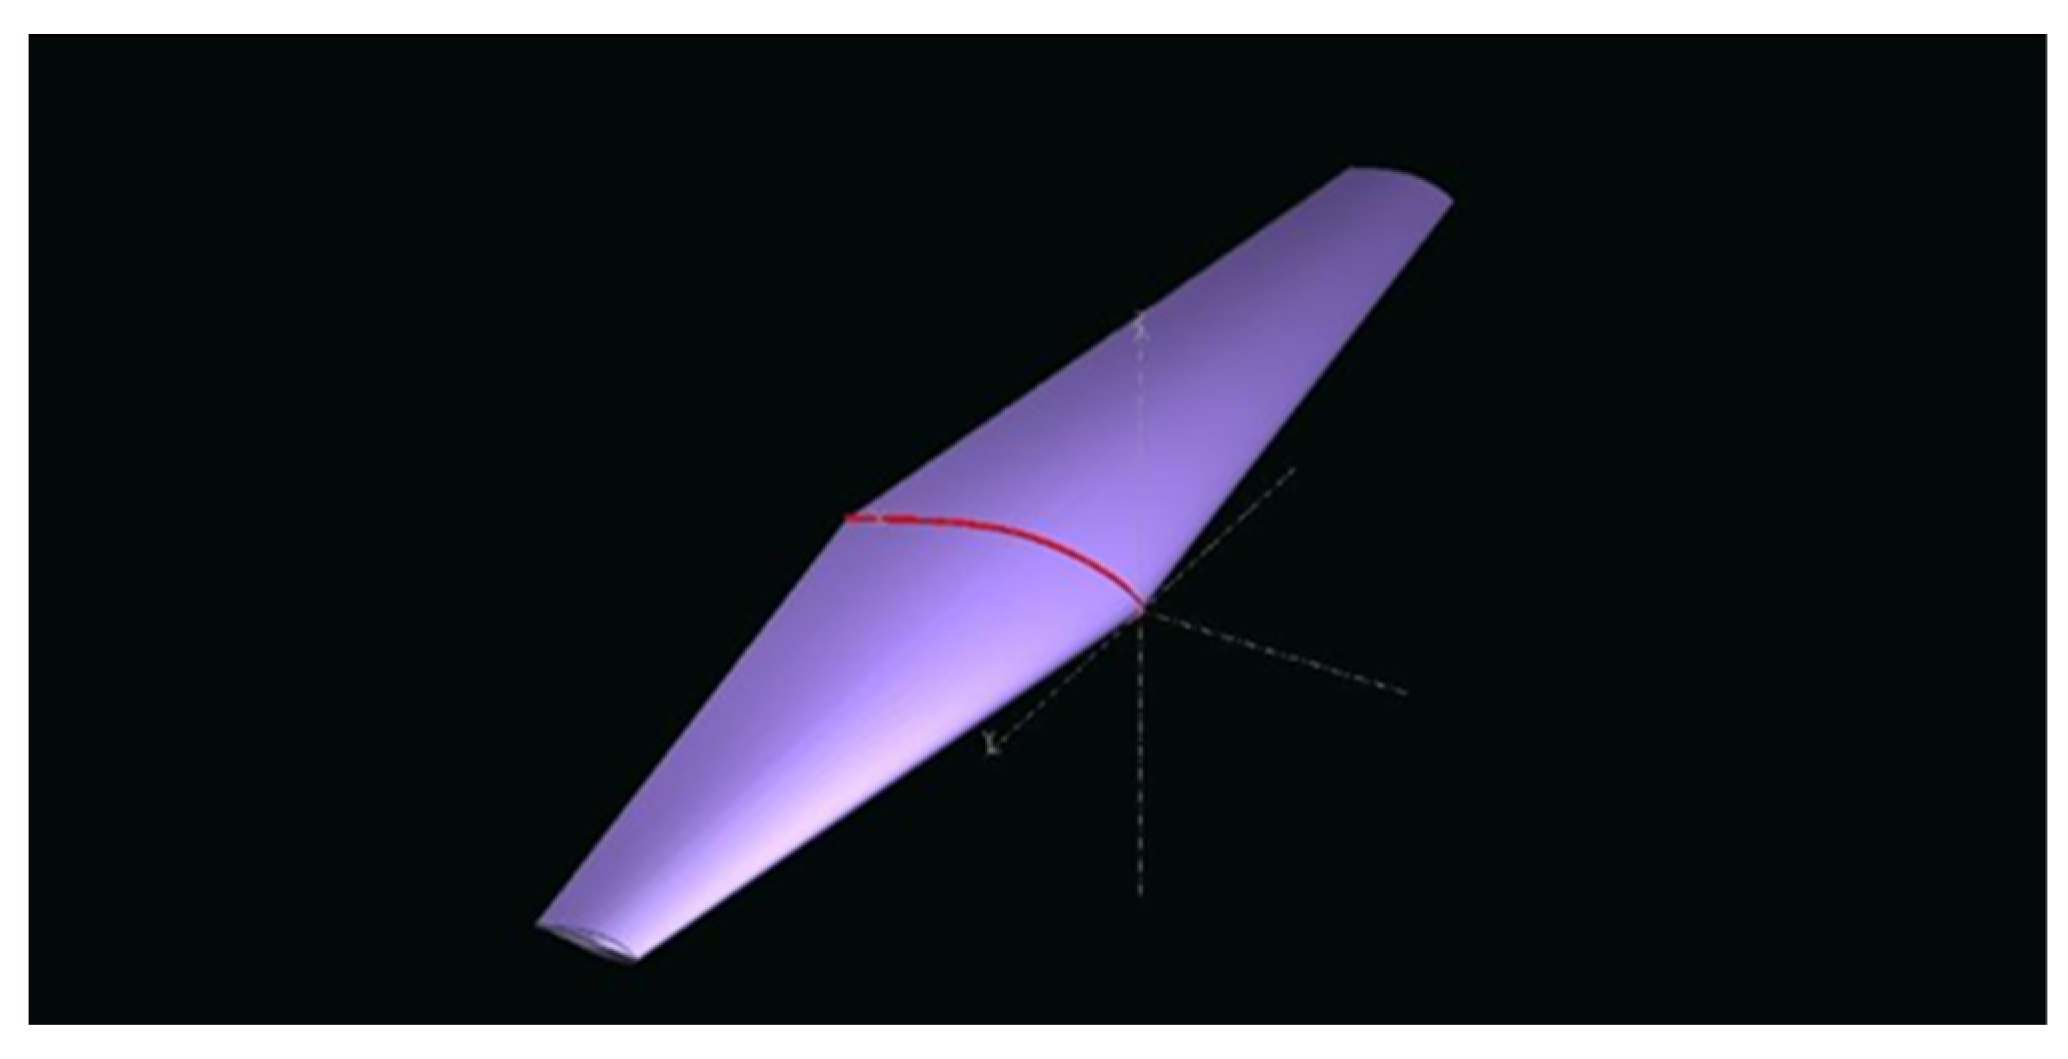
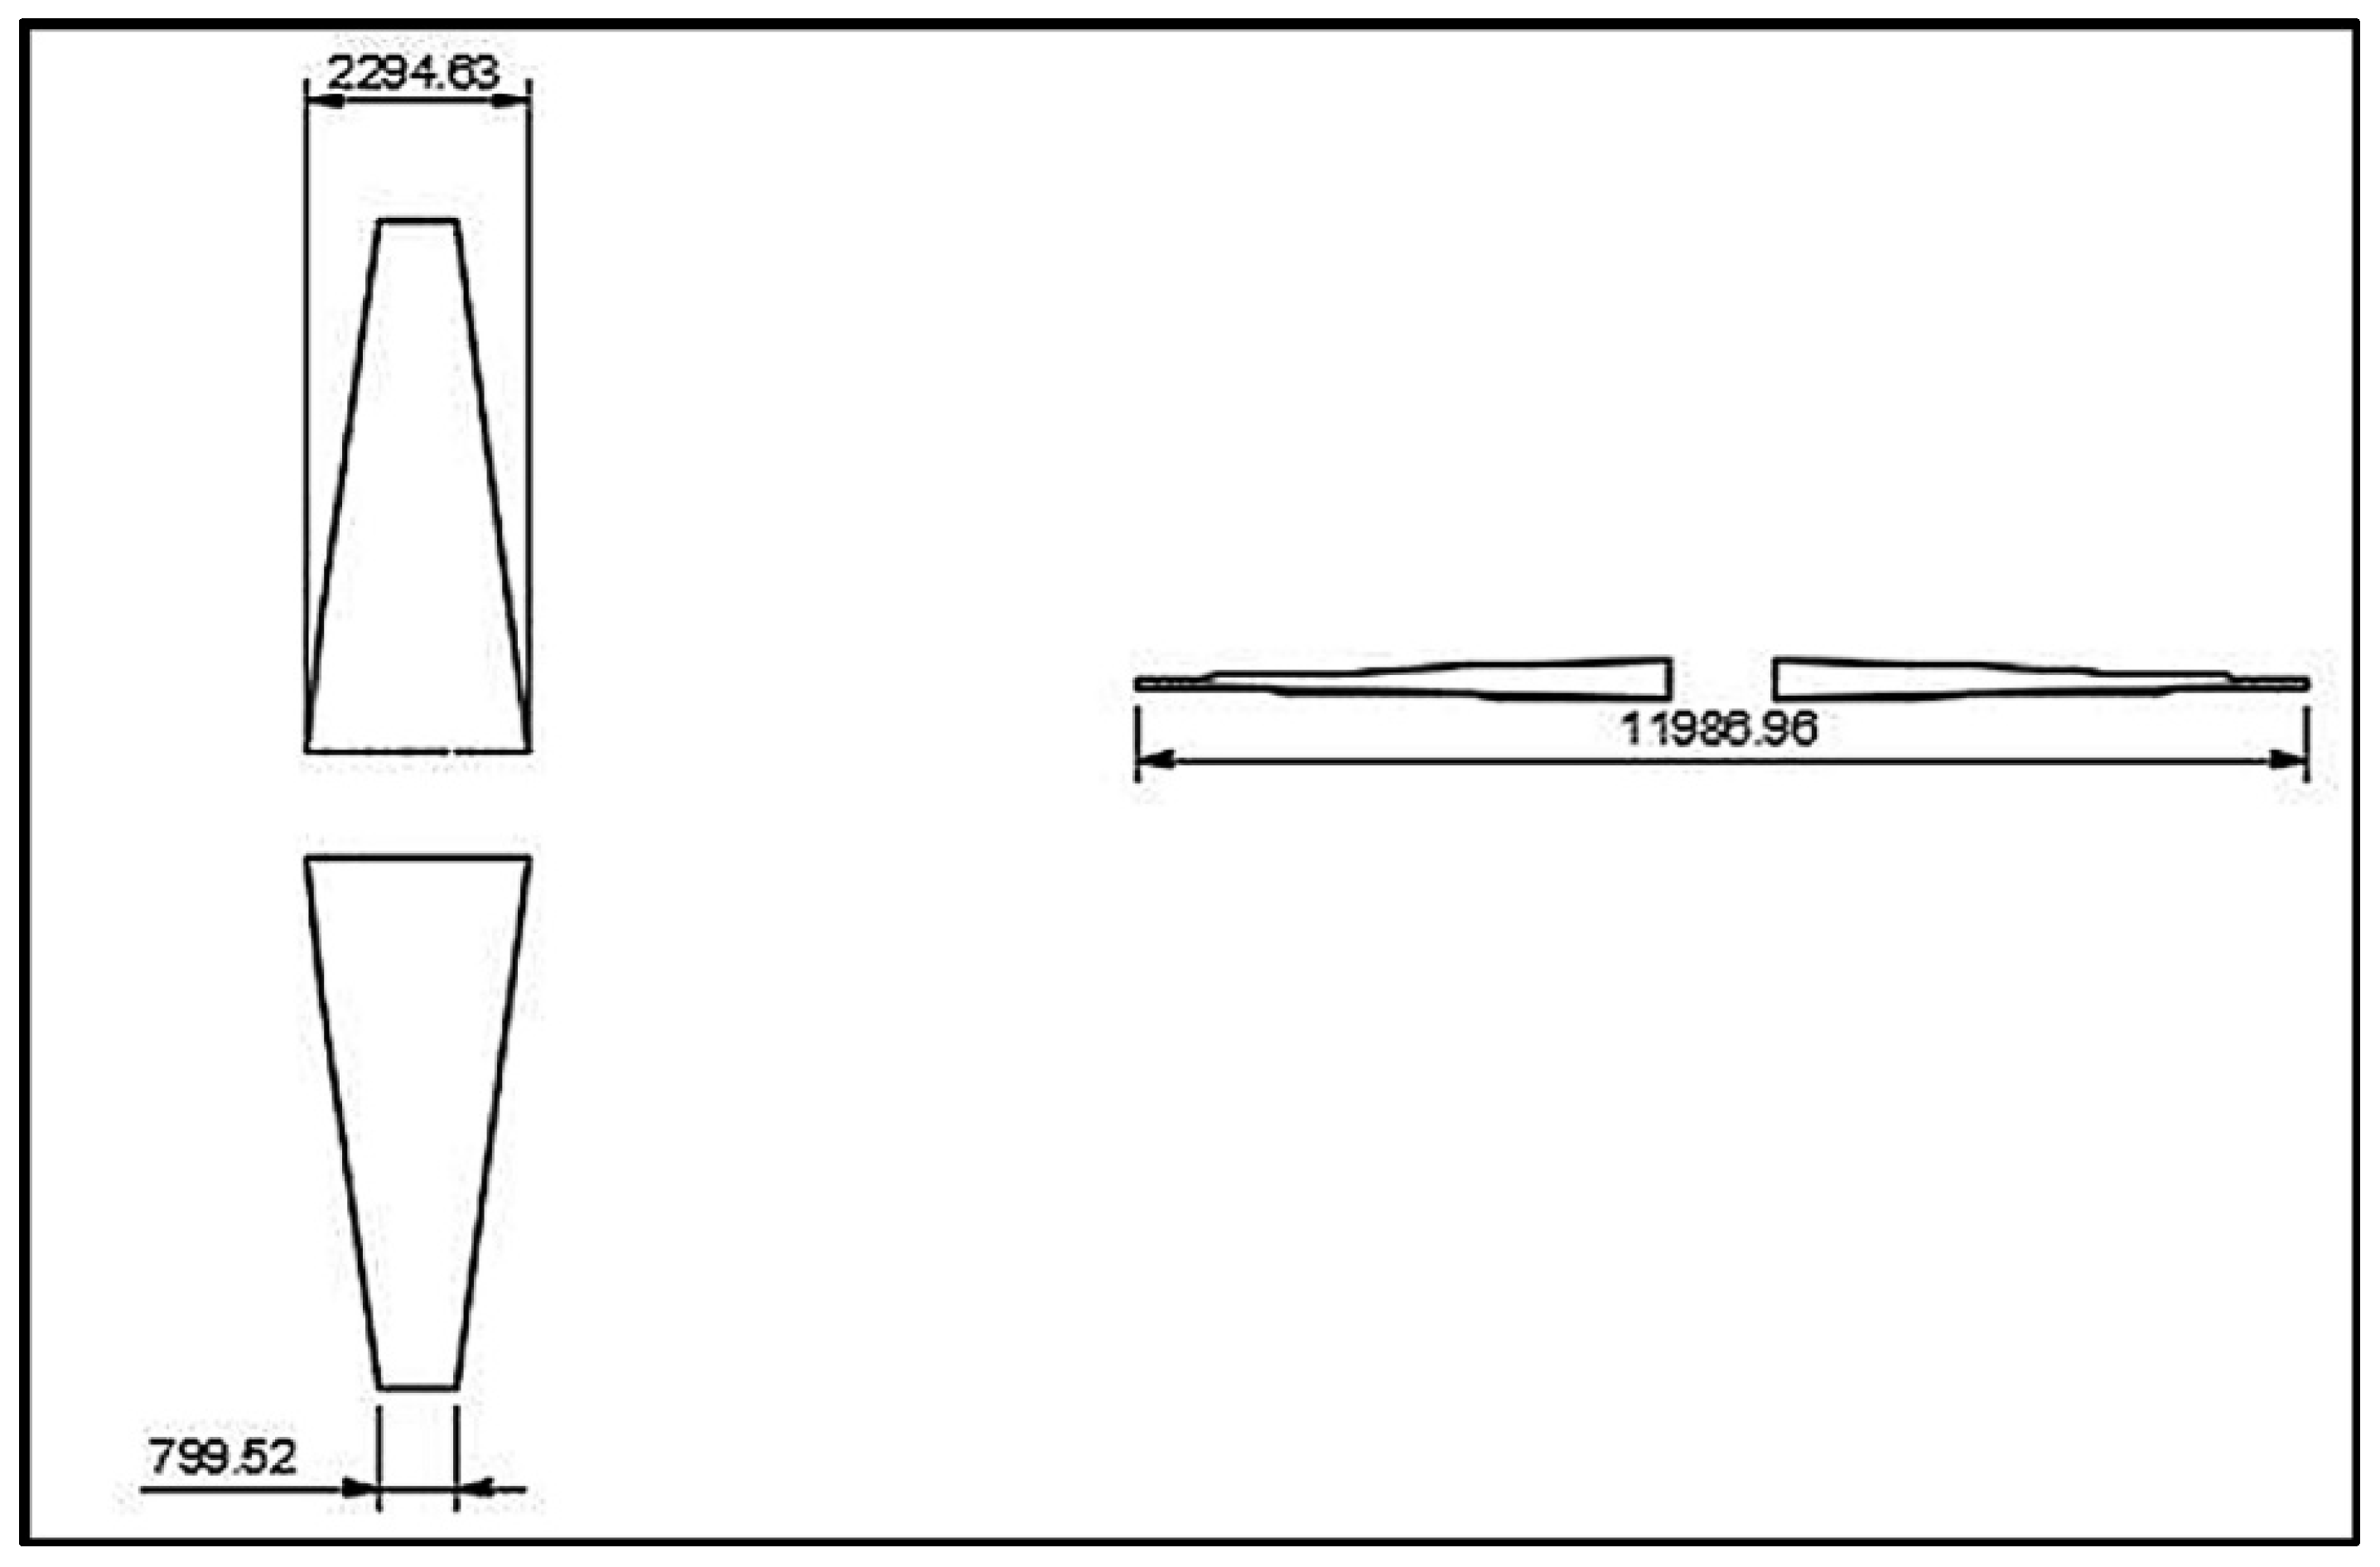
5.2. Estimation of Wing Parameters
5.2.1. Angle of Incidence
5.2.2. Twist Angle
5.2.3. Three-Dimensional Lift Coefficient
5.2.4. Taper Ratio
6. Geometric Sizing
6.1. Fuselage
- Seat width, 0.5 m;
- Aisle width, 0.5 m;
- Fuselage length, 6 m.
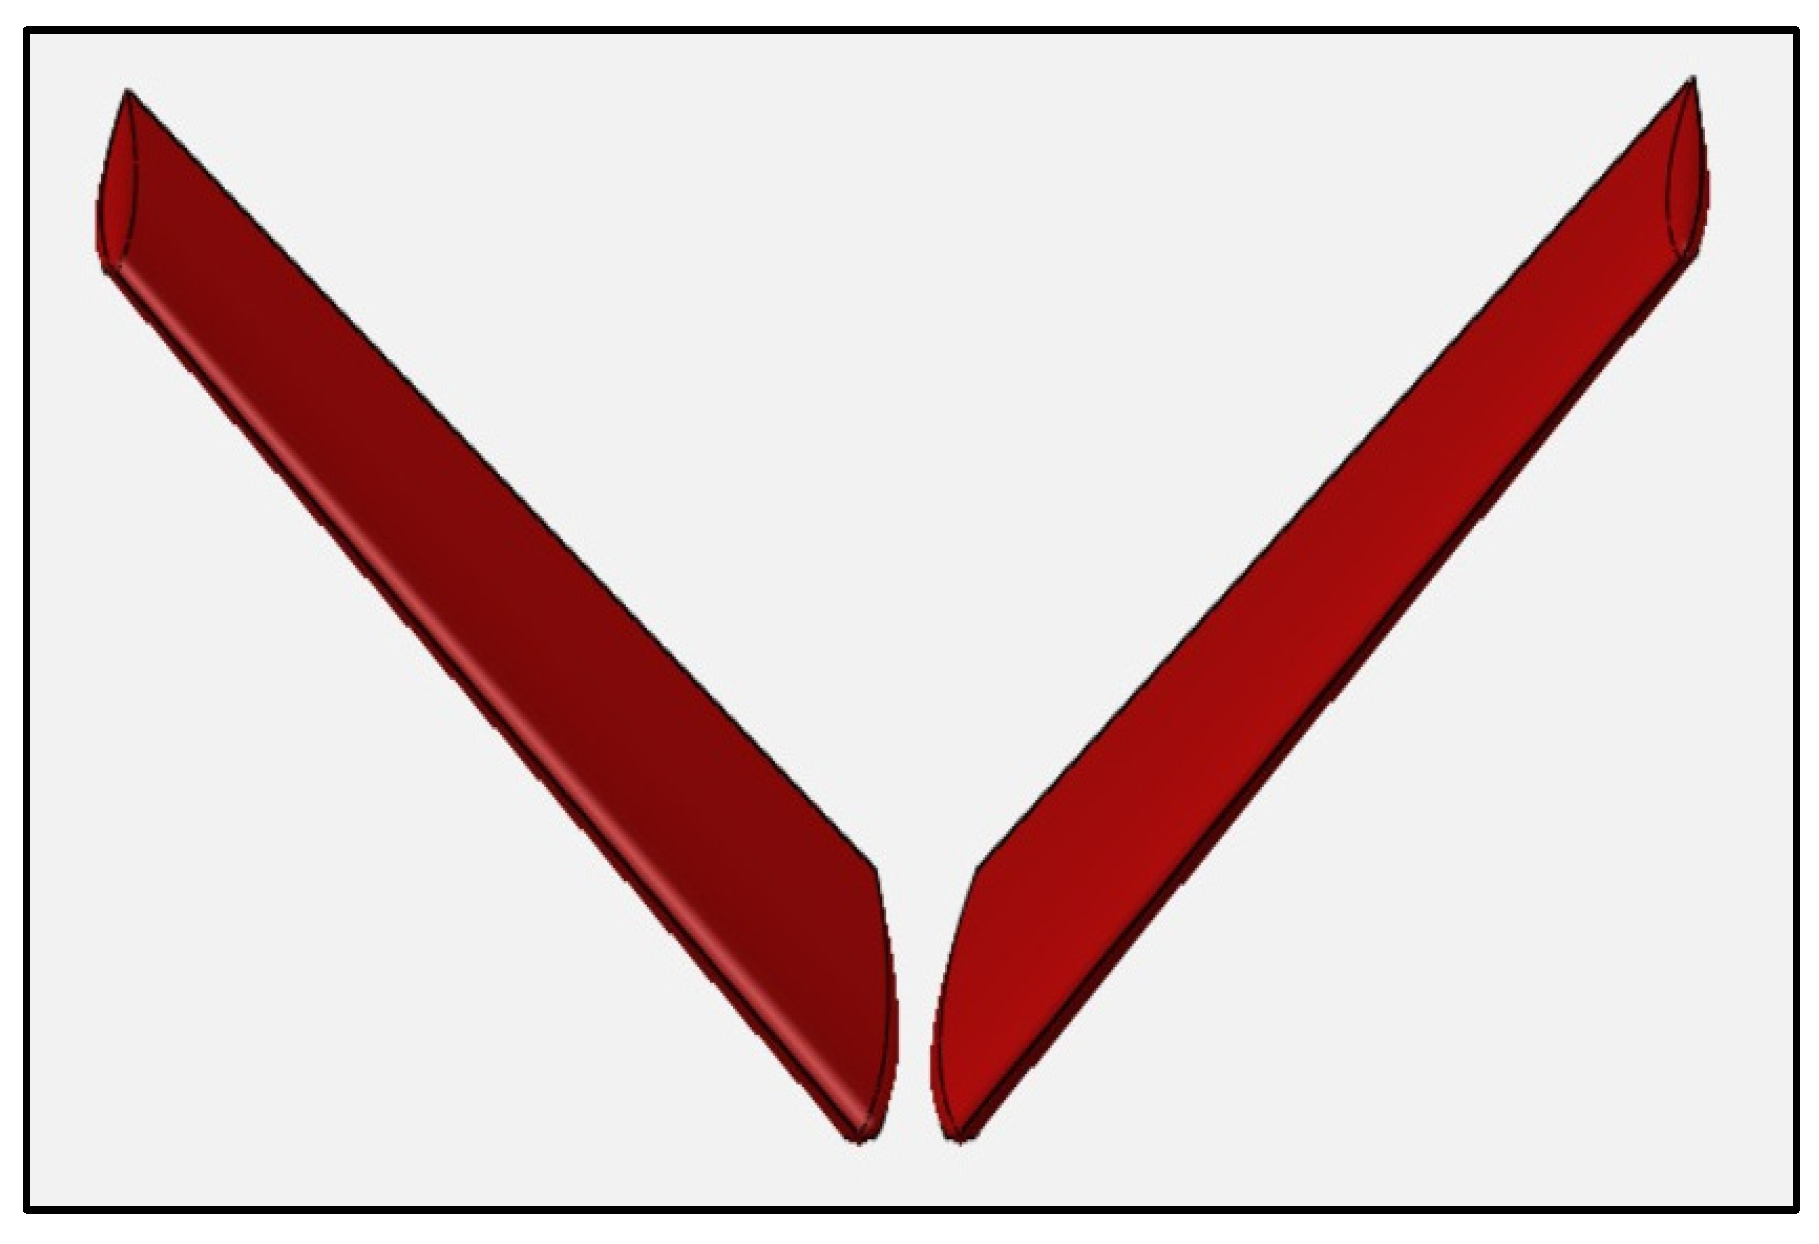
6.2. Tail Sizing and Configuration Selection
6.3. Powerplant Selection and Sizing
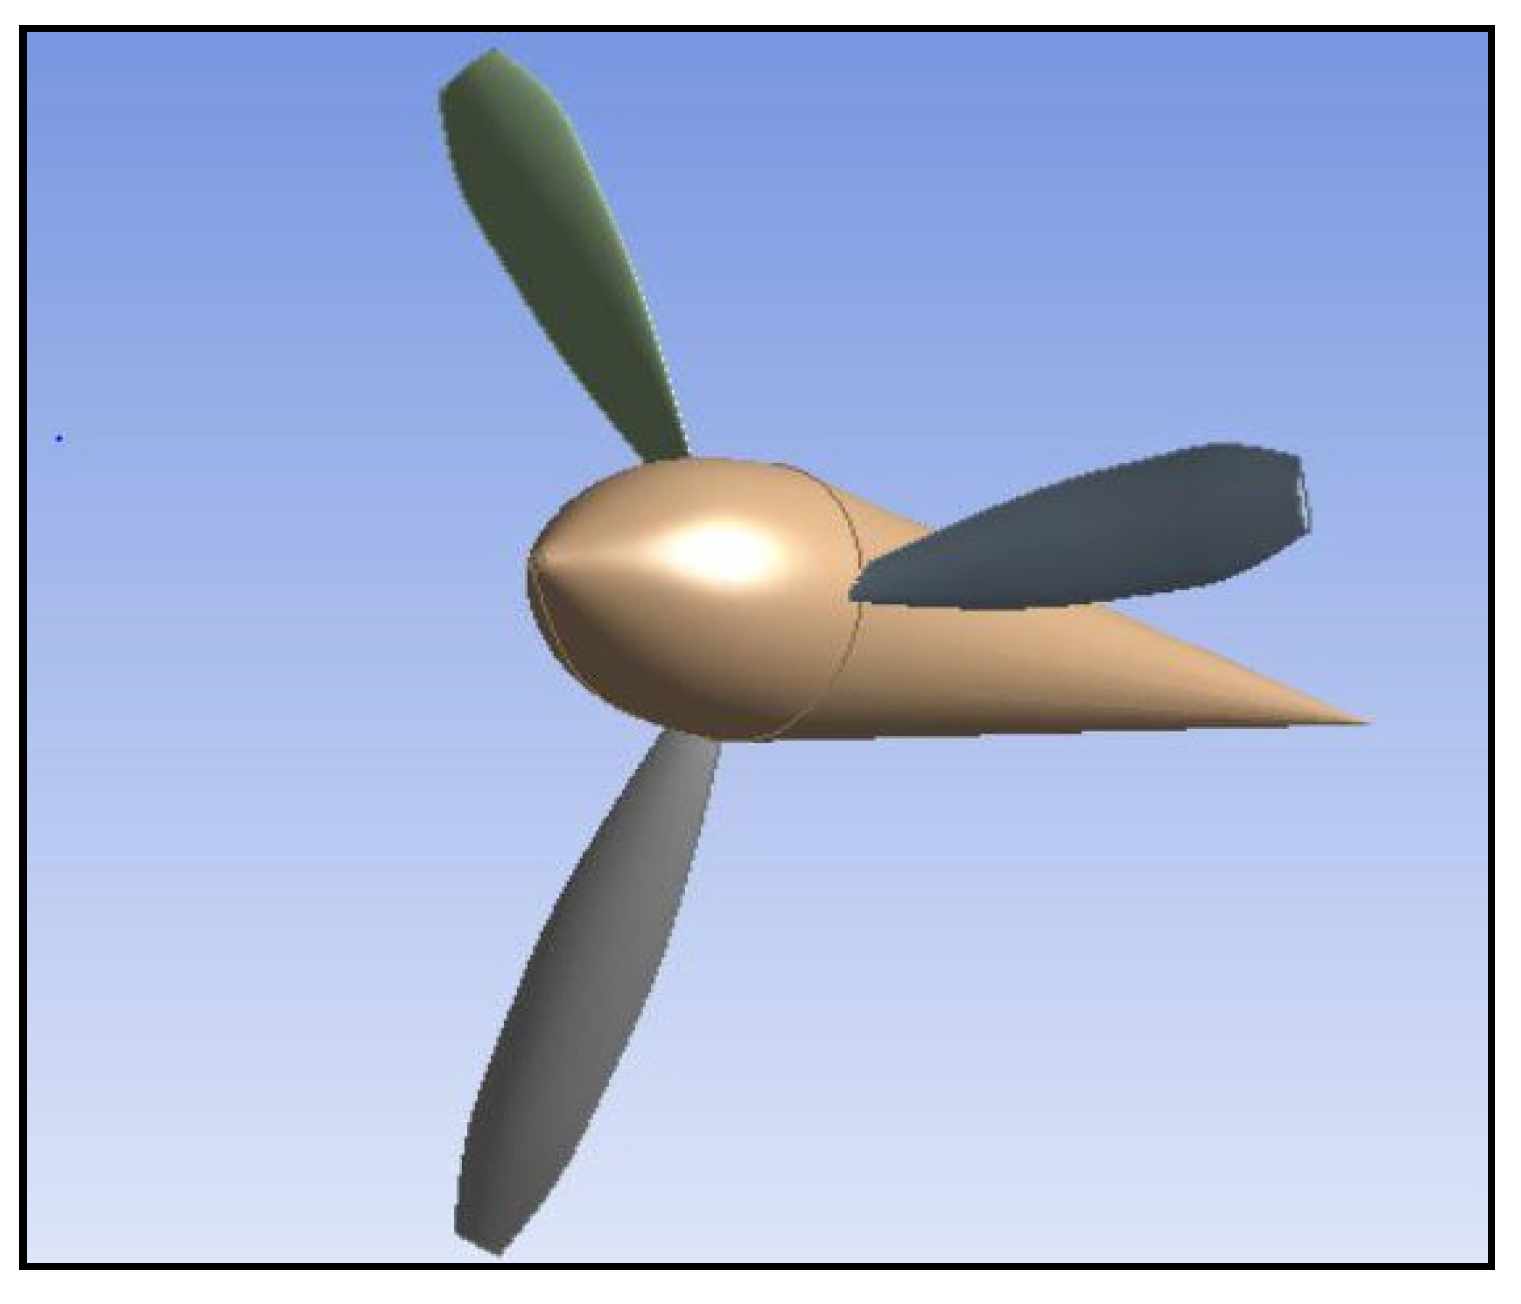
6.4. Propeller Selection
- Number of blades in one engine = 3;
- Blade diameter = 1.50 m;
- Propeller collective pitch = 5°;
- Hub diameter = 0.40 m;
- Root twist = 32°; Airfoil used: NACA 64-935;
- Tip twist = 8°; Airfoil used: NACA 64-212.
6.5. Landing Gear Sizing
- Ultimate landing load factor (NL) = limit load factor of gear (Ngear) × 1.5 = 20;
- Extended length of main landing gear (Lm) = 0.6 m;
- Extended length of nose landing gear (Ln) = 4 m;Main landing gear weight = 0.095 (NL W)0.768 (Lm/12)0.409Nose landing gear weight = 0.125 (20 × 1.5 × 1500)0.566 (Ln/12)0.845
- WMLG = 47.47 kg;
- WNLG = 9.64 kg.
6.6. Flight Controls/Avionics Sizing
- Fuselage structural length (L) = 8.23 m;
- Wing span (Bw) = 10.97 m;
- Weight of flight controls (Wflight controls) = 26.23 kg.
6.7. Cargo Mode
7. Design Parameters
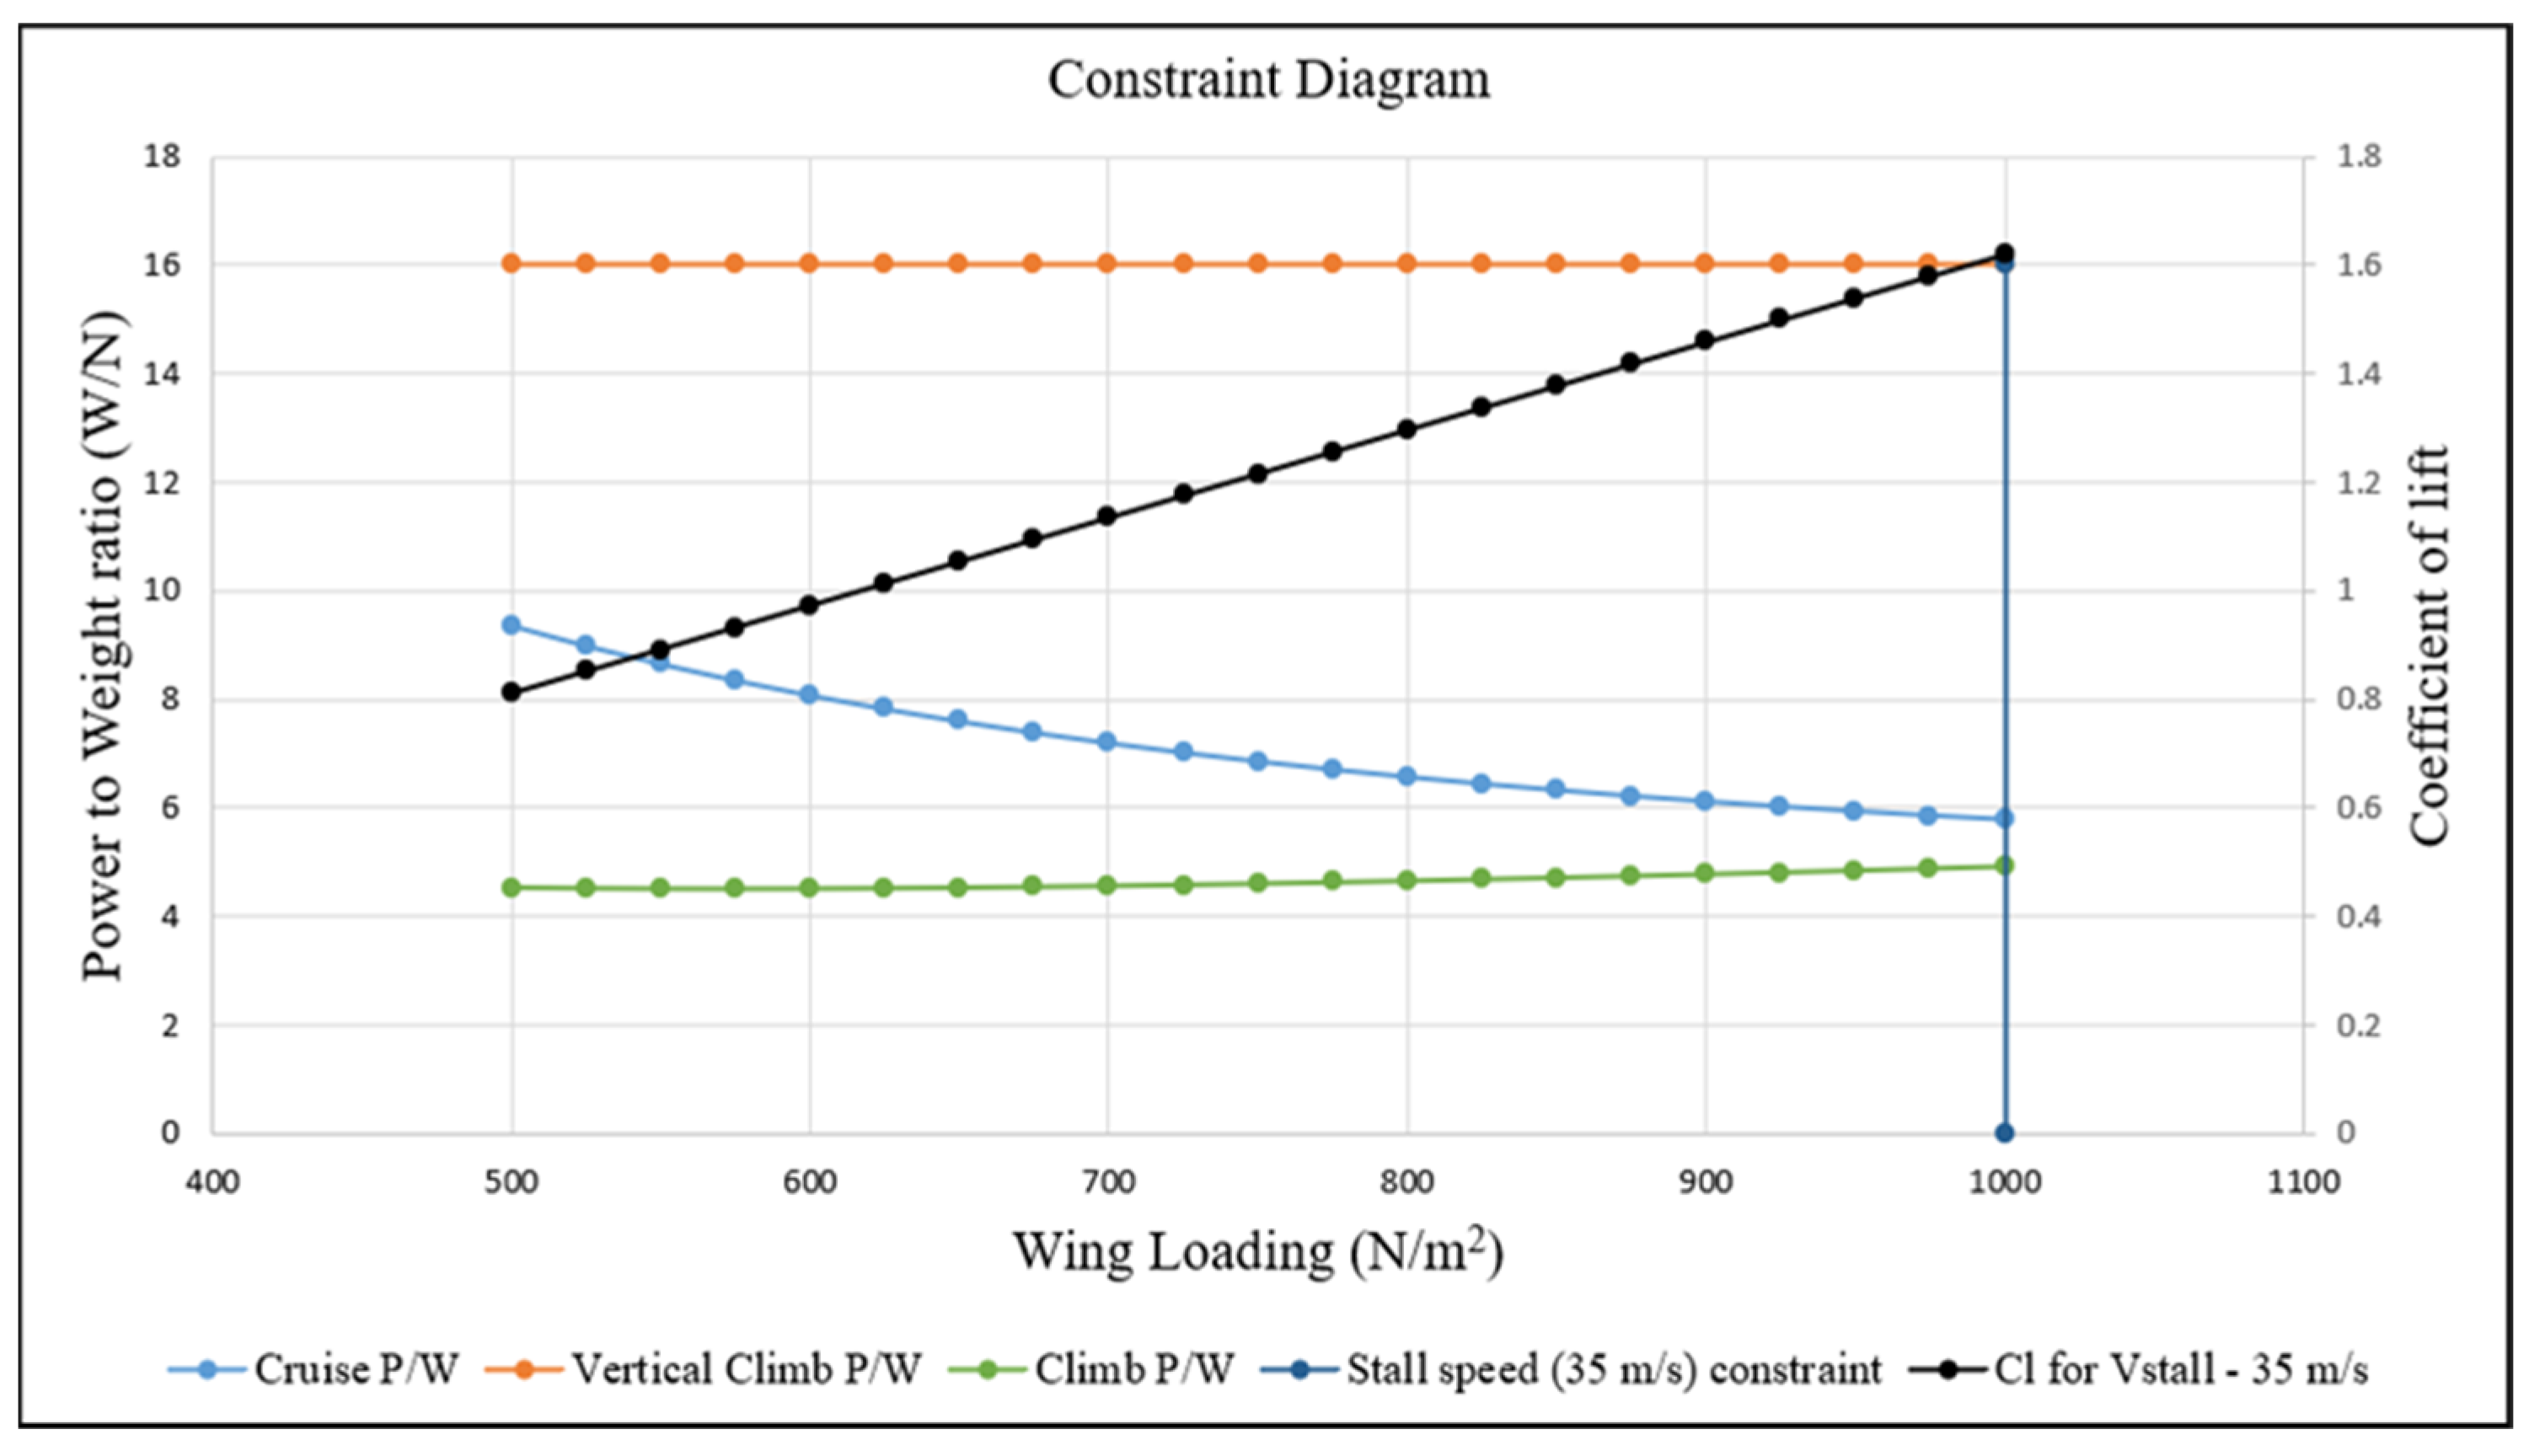
7.1. Constraint Analysis
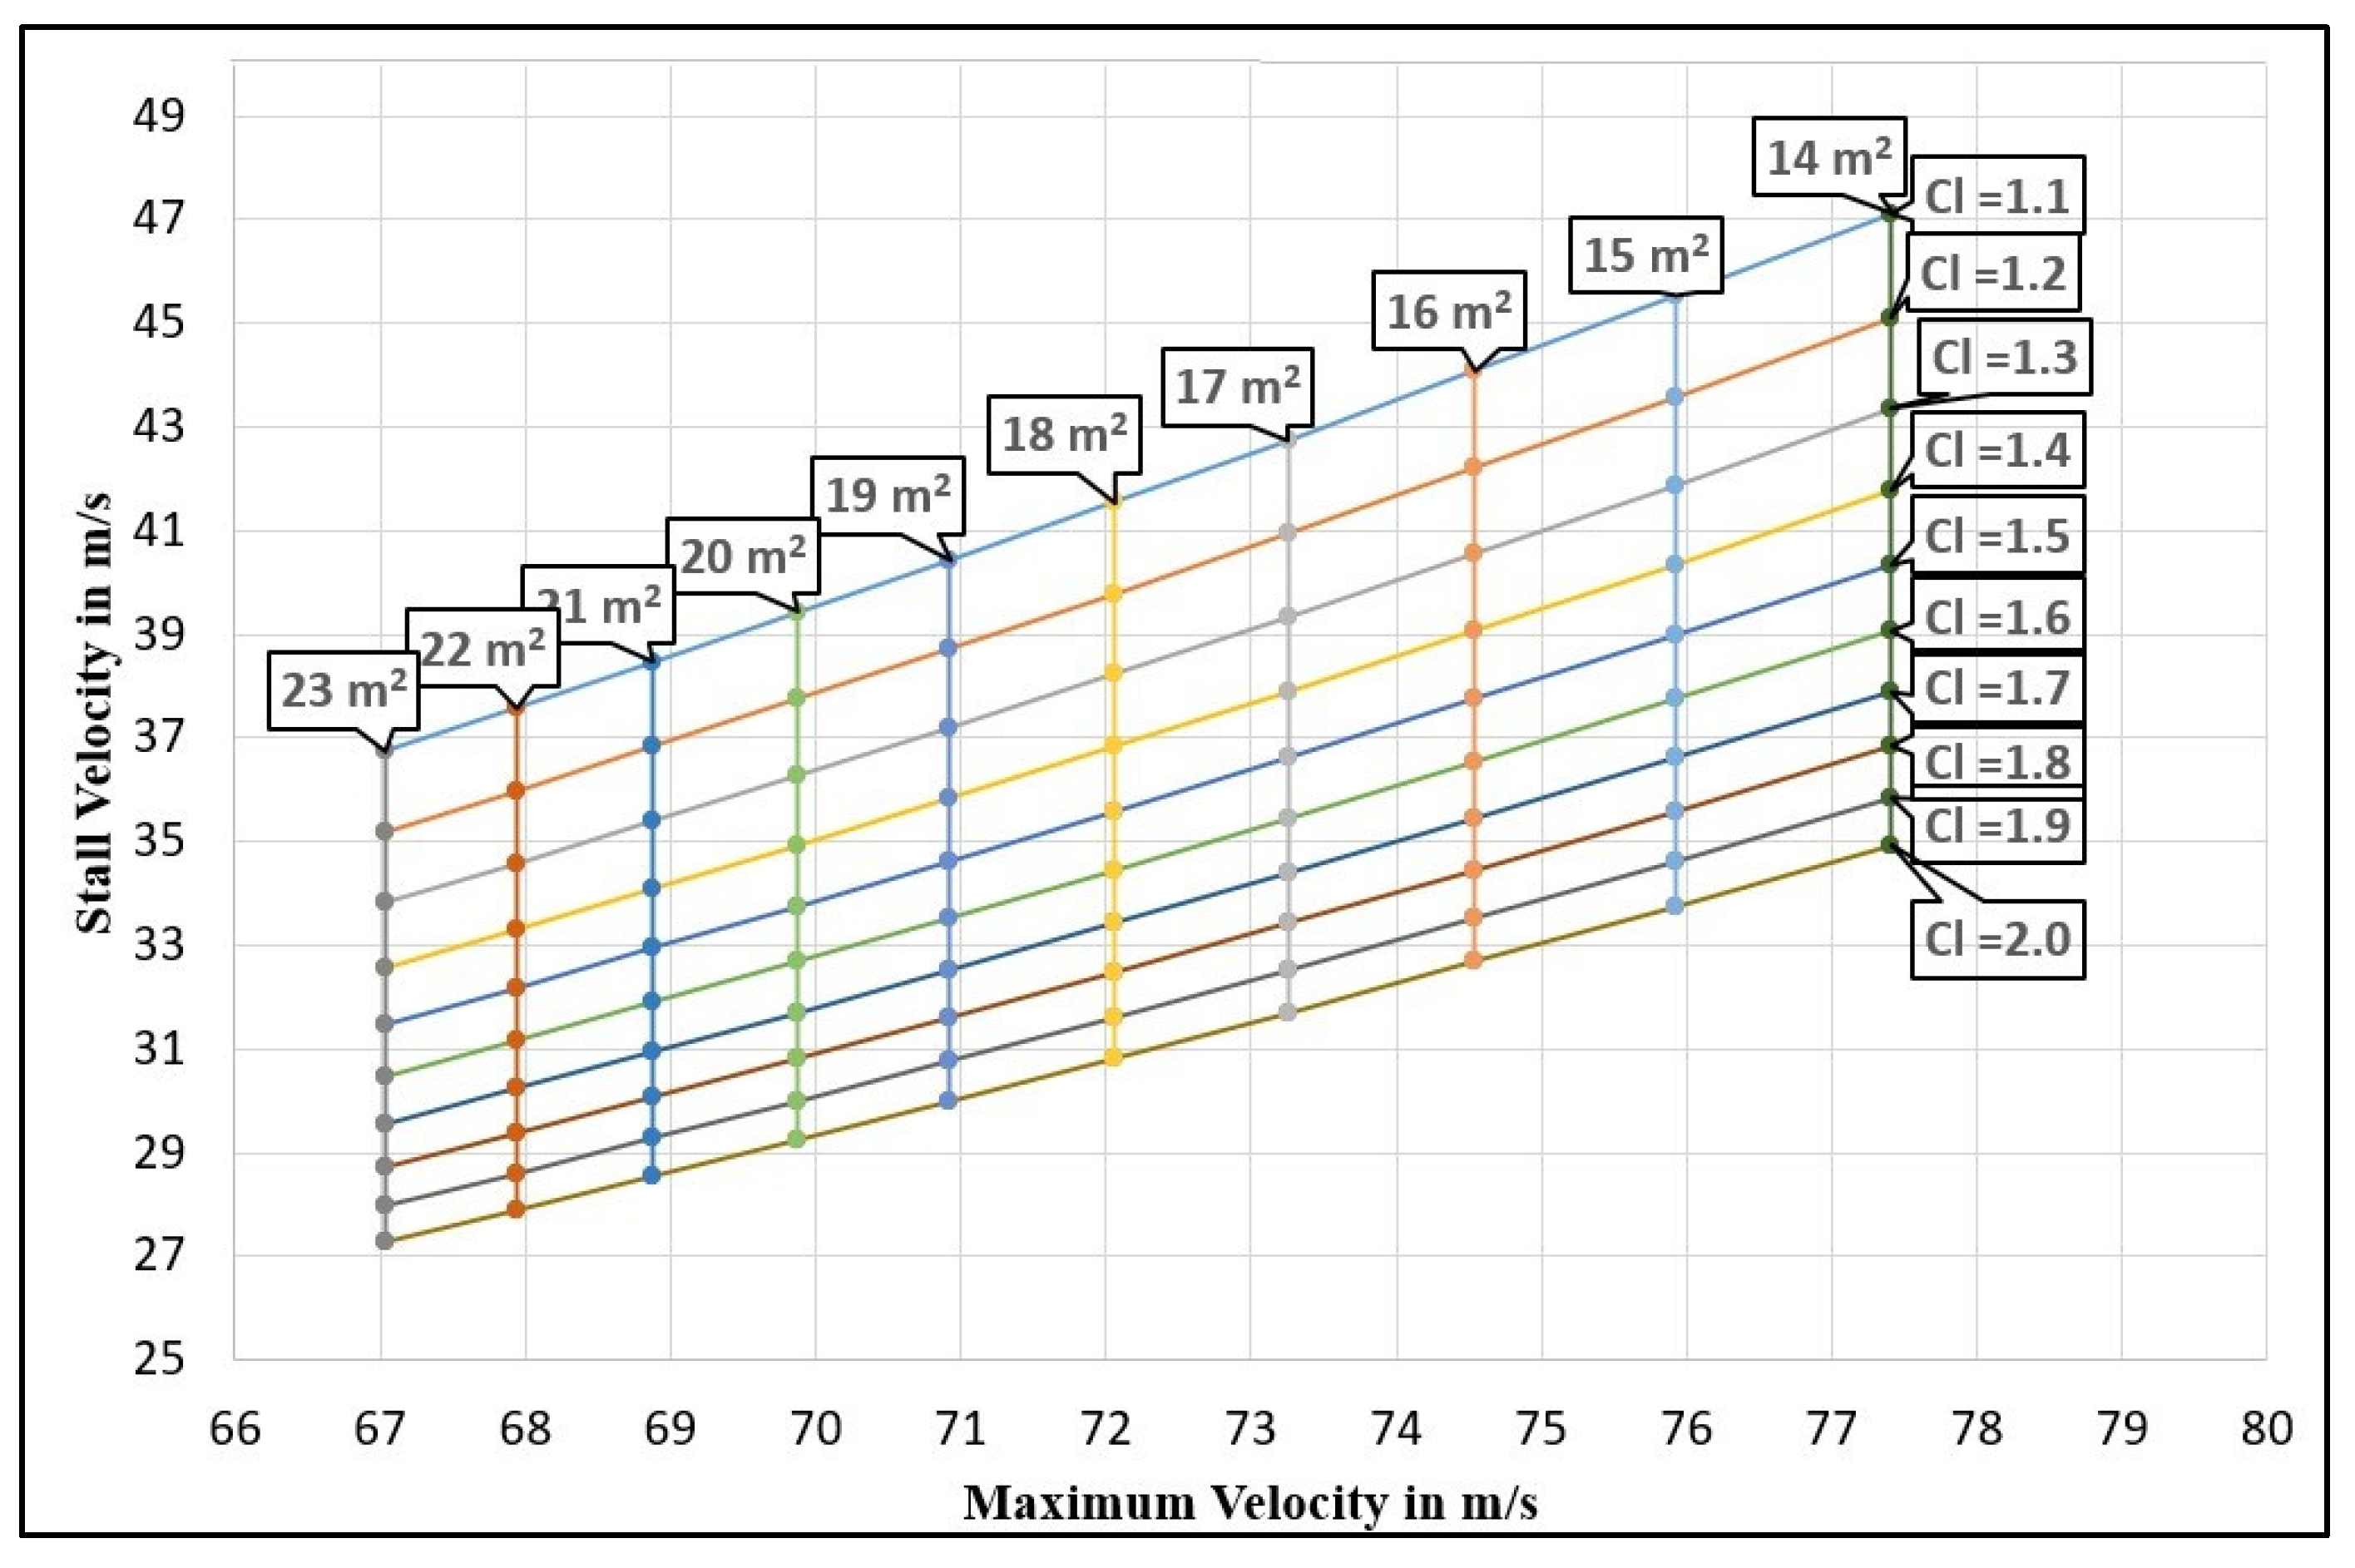
7.2. Sensitivity Analysis
- Maximum cruise speed, 73.352 m/s;
- Stall speed, 35 m/s;
- Maximum coefficient of lift, 1.6;
- Wing area, 17 m2.
8. Component Placement and Centre of Gravity Estimation
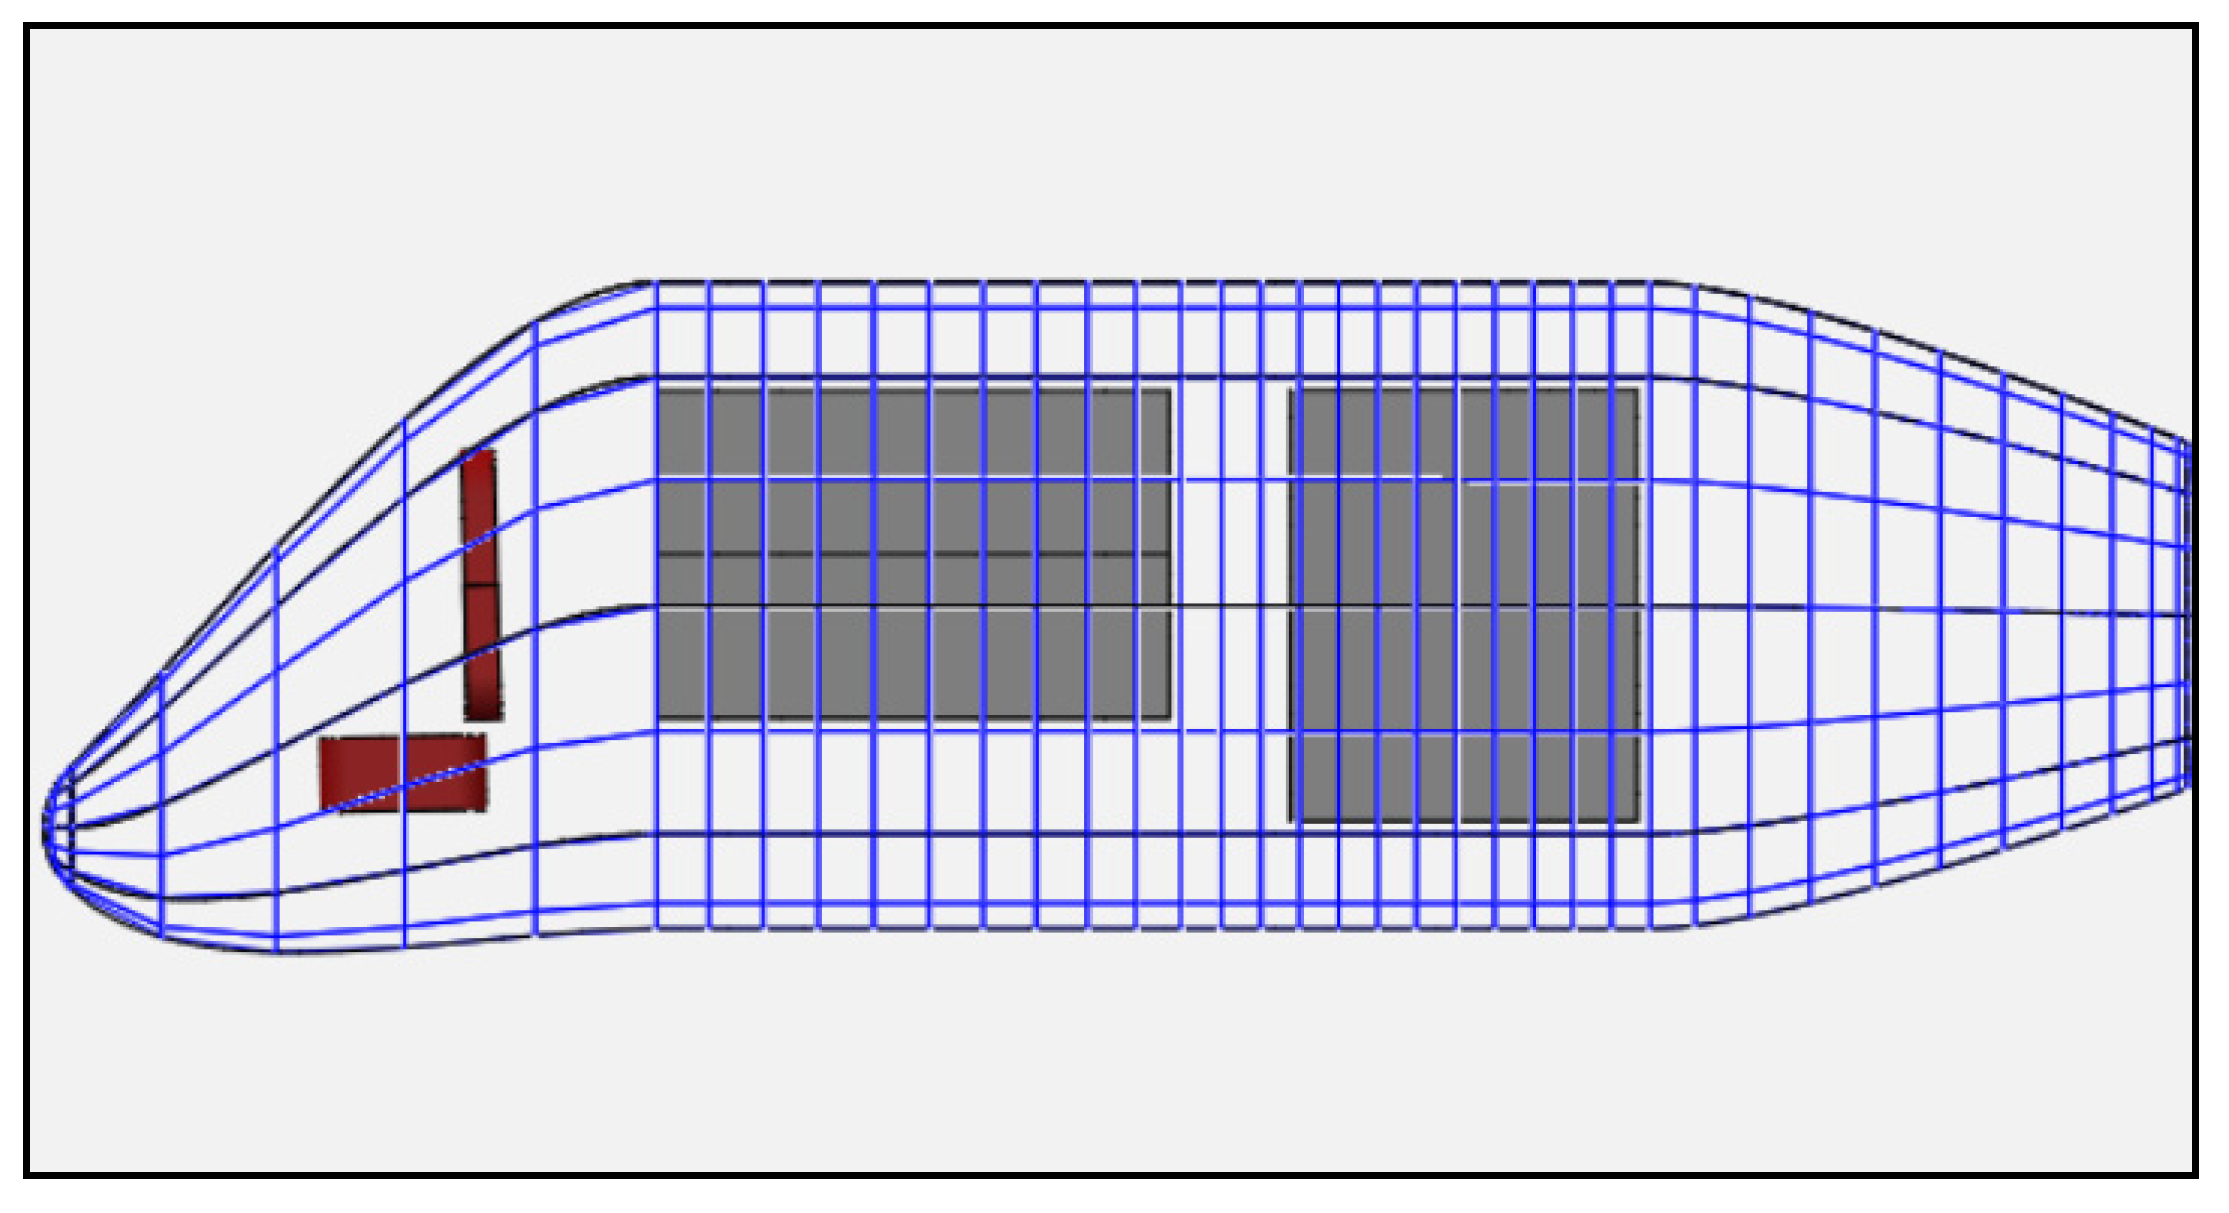
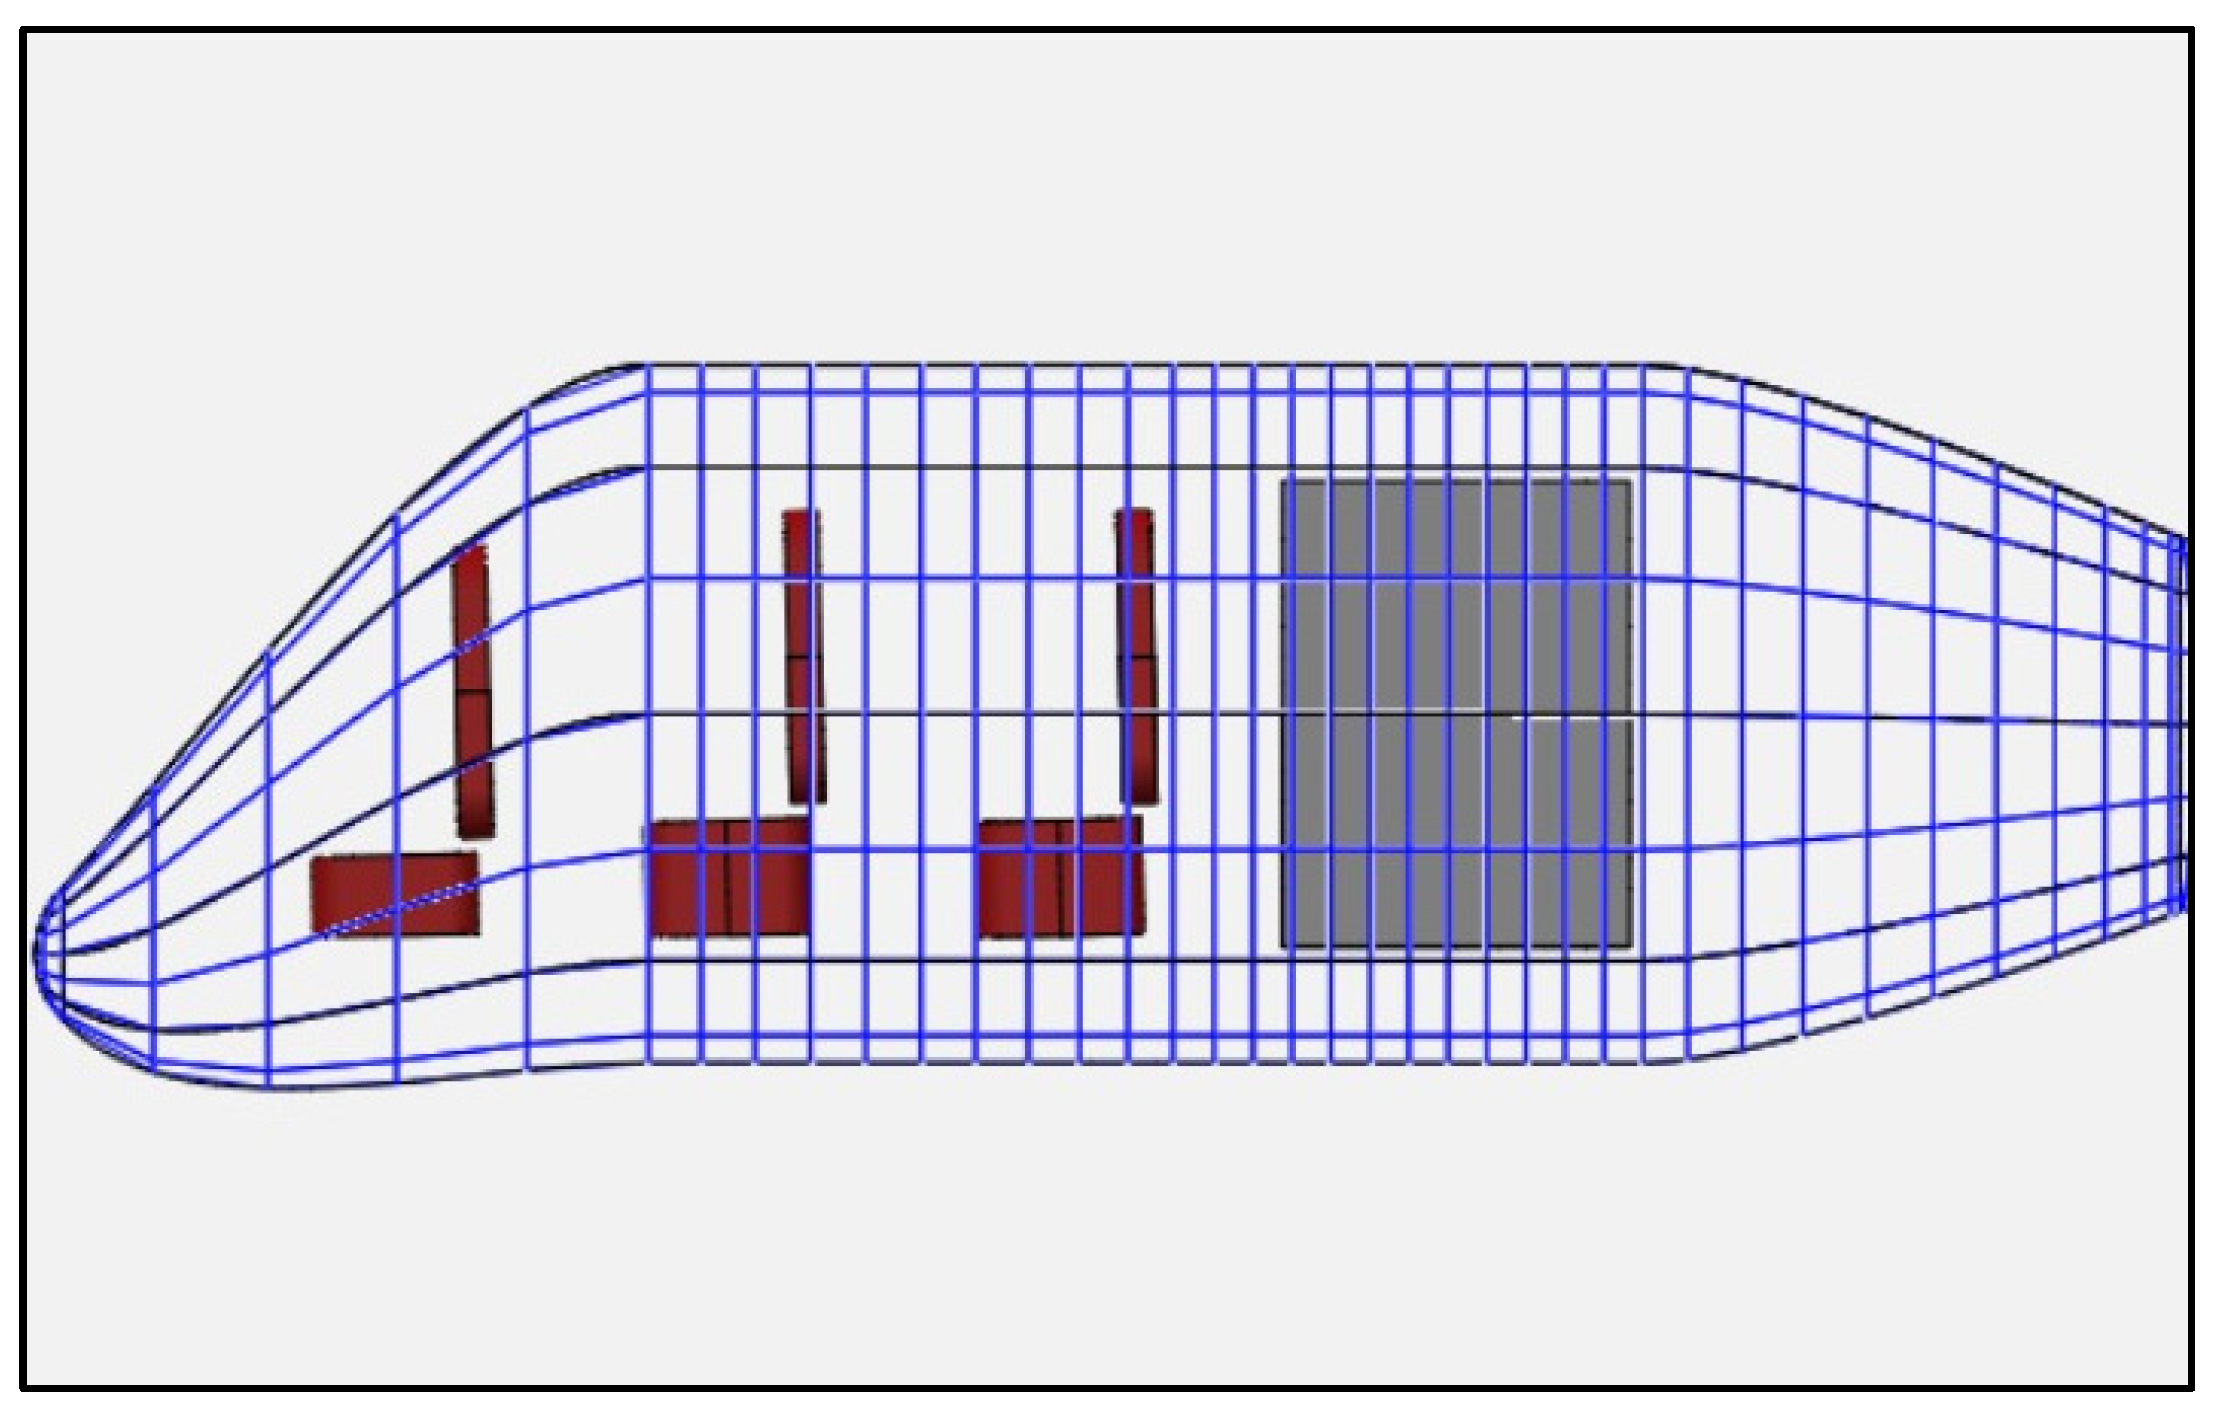
8.1. Battery Location
8.2. Electric Motor Placement
- To ensure that the crew and the passenger compartment are not within 5 degrees of the propeller disk in the event of a blade hurled towards the fuselage.
- The propeller must be as far as possible from the fuselage to avoid disturbance due to noise and aid in smooth flight.
- The span loading effect created will reduce the wing structural weight.
- The propeller hub and electric motor is able to rotate freely without any problems to facilitate various manoeuvres.
- The wing does not interfere with the thrust produced by the propeller during vertical flight.
- The fuselage drag is reduced by repositioning the fuselage away from the propeller’s wake region.
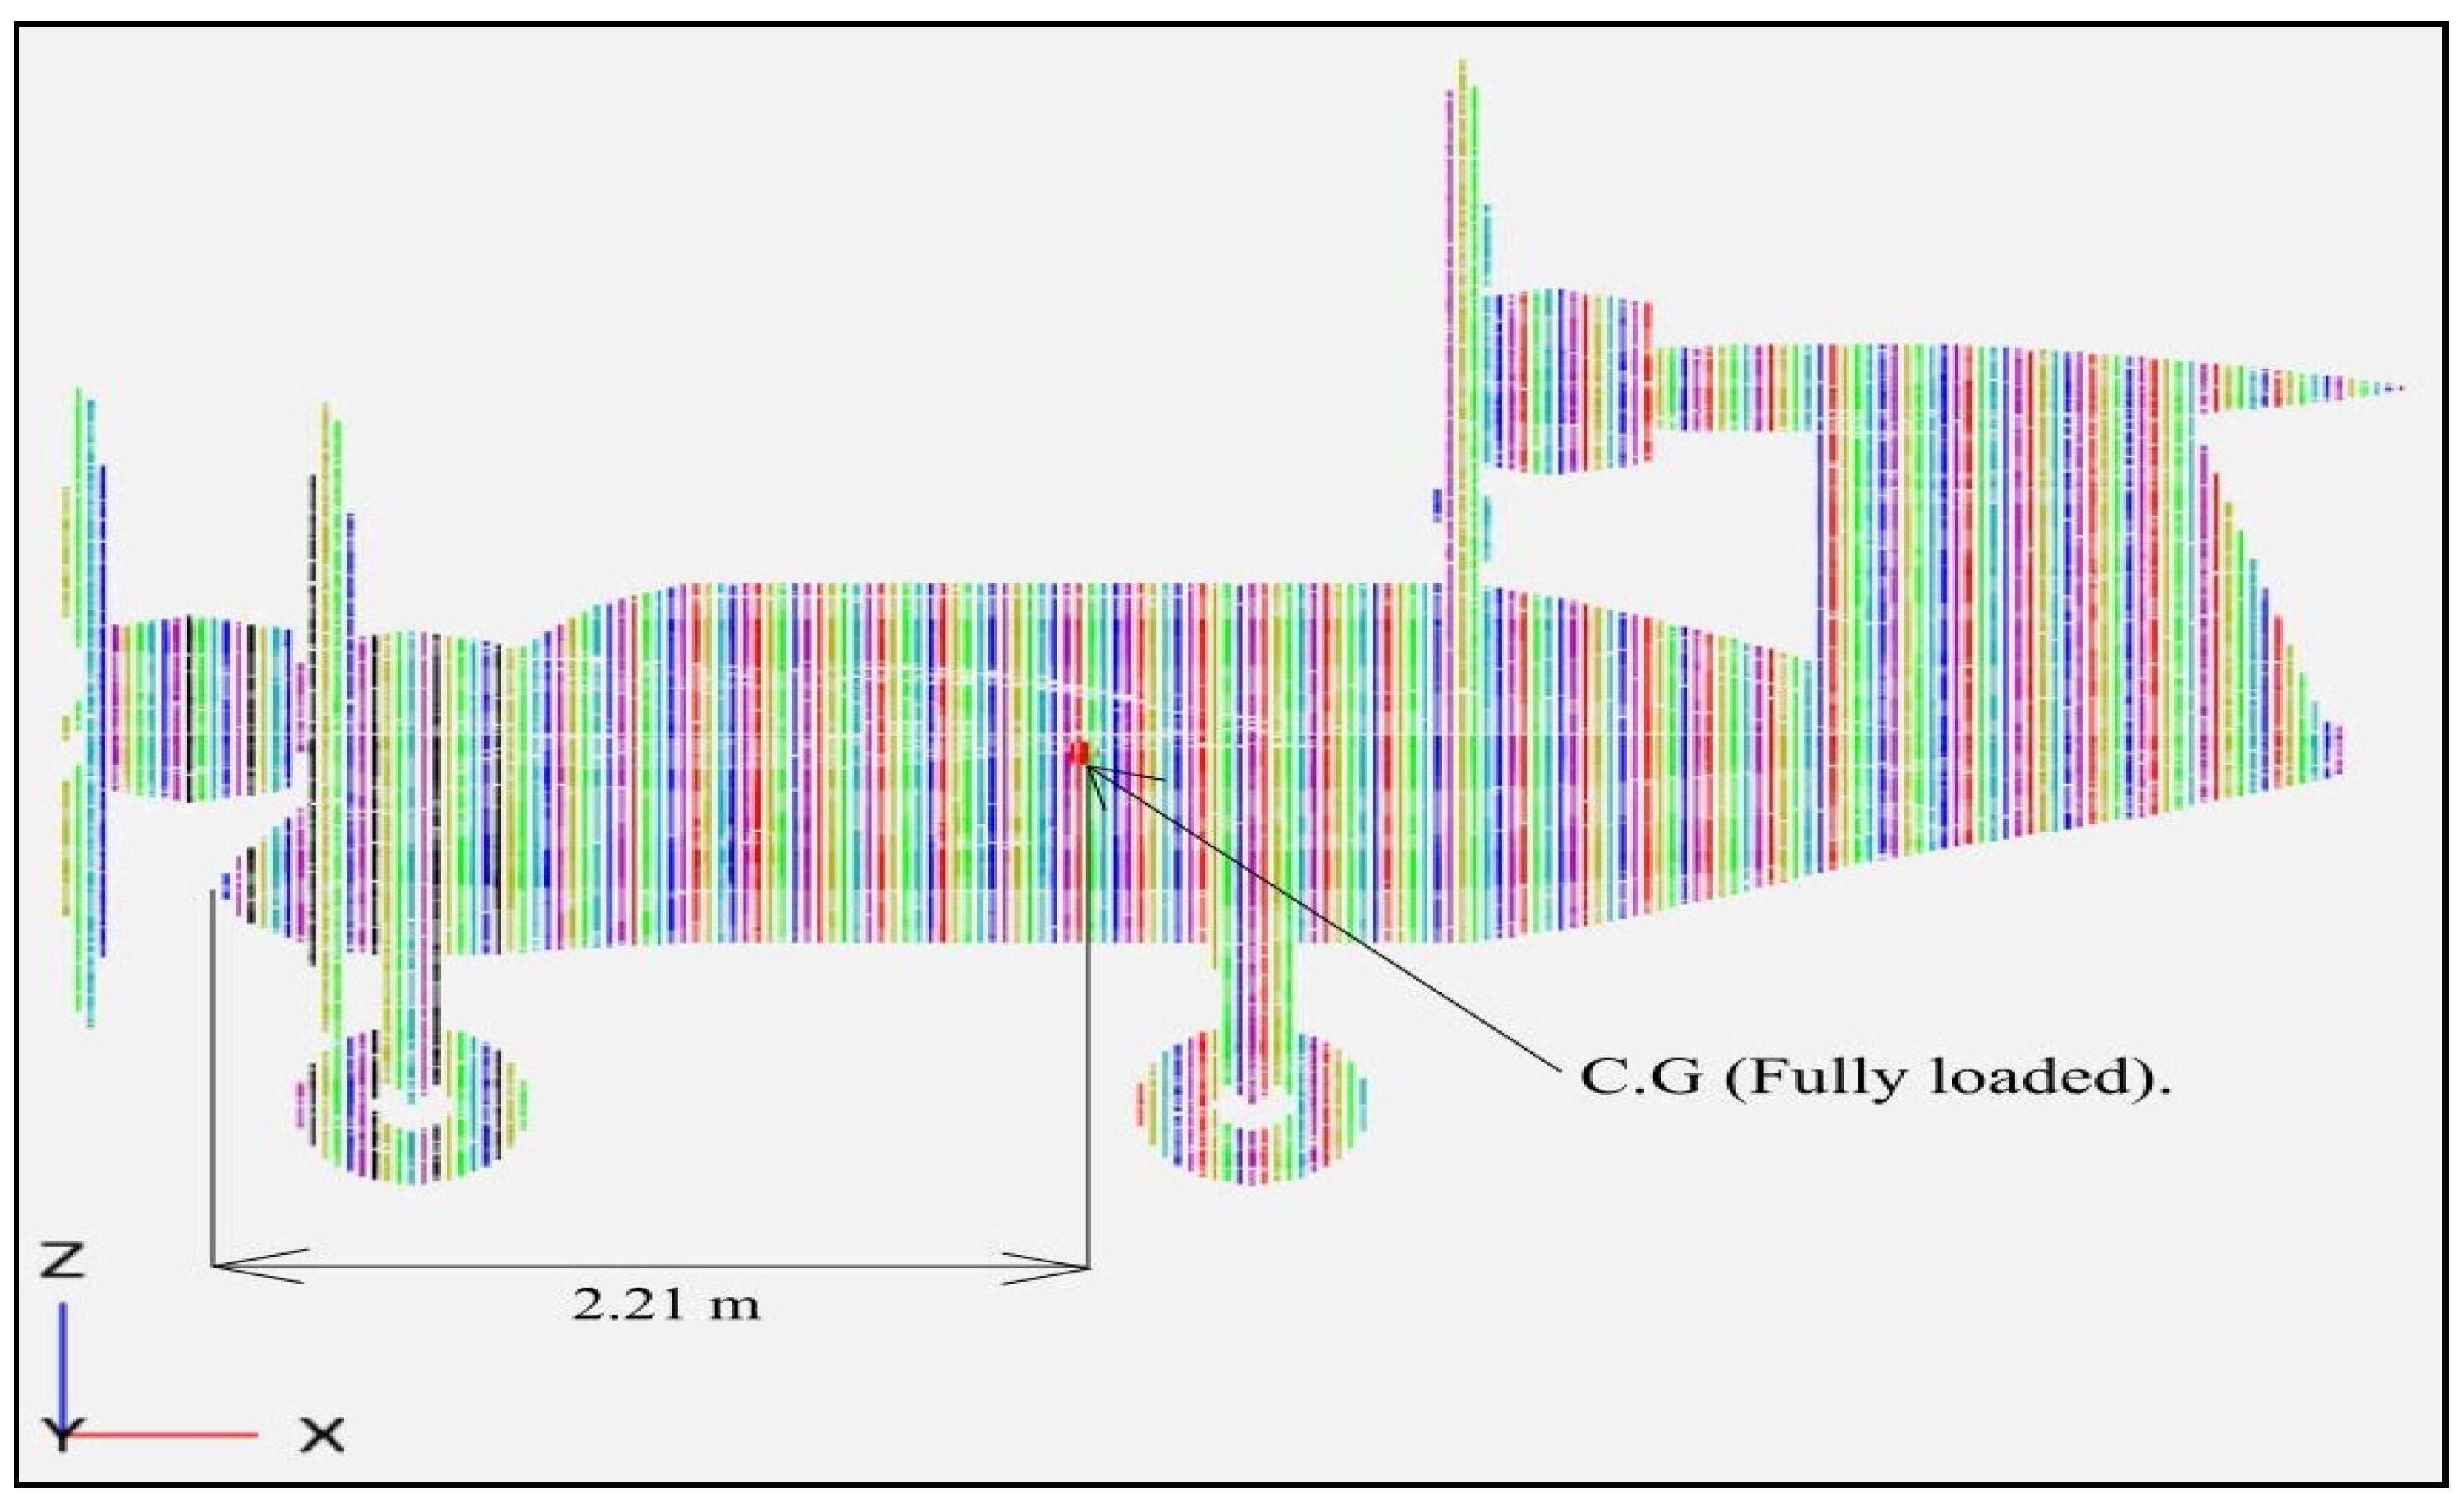
8.3. Centre of Gravity (Initial Estimate)
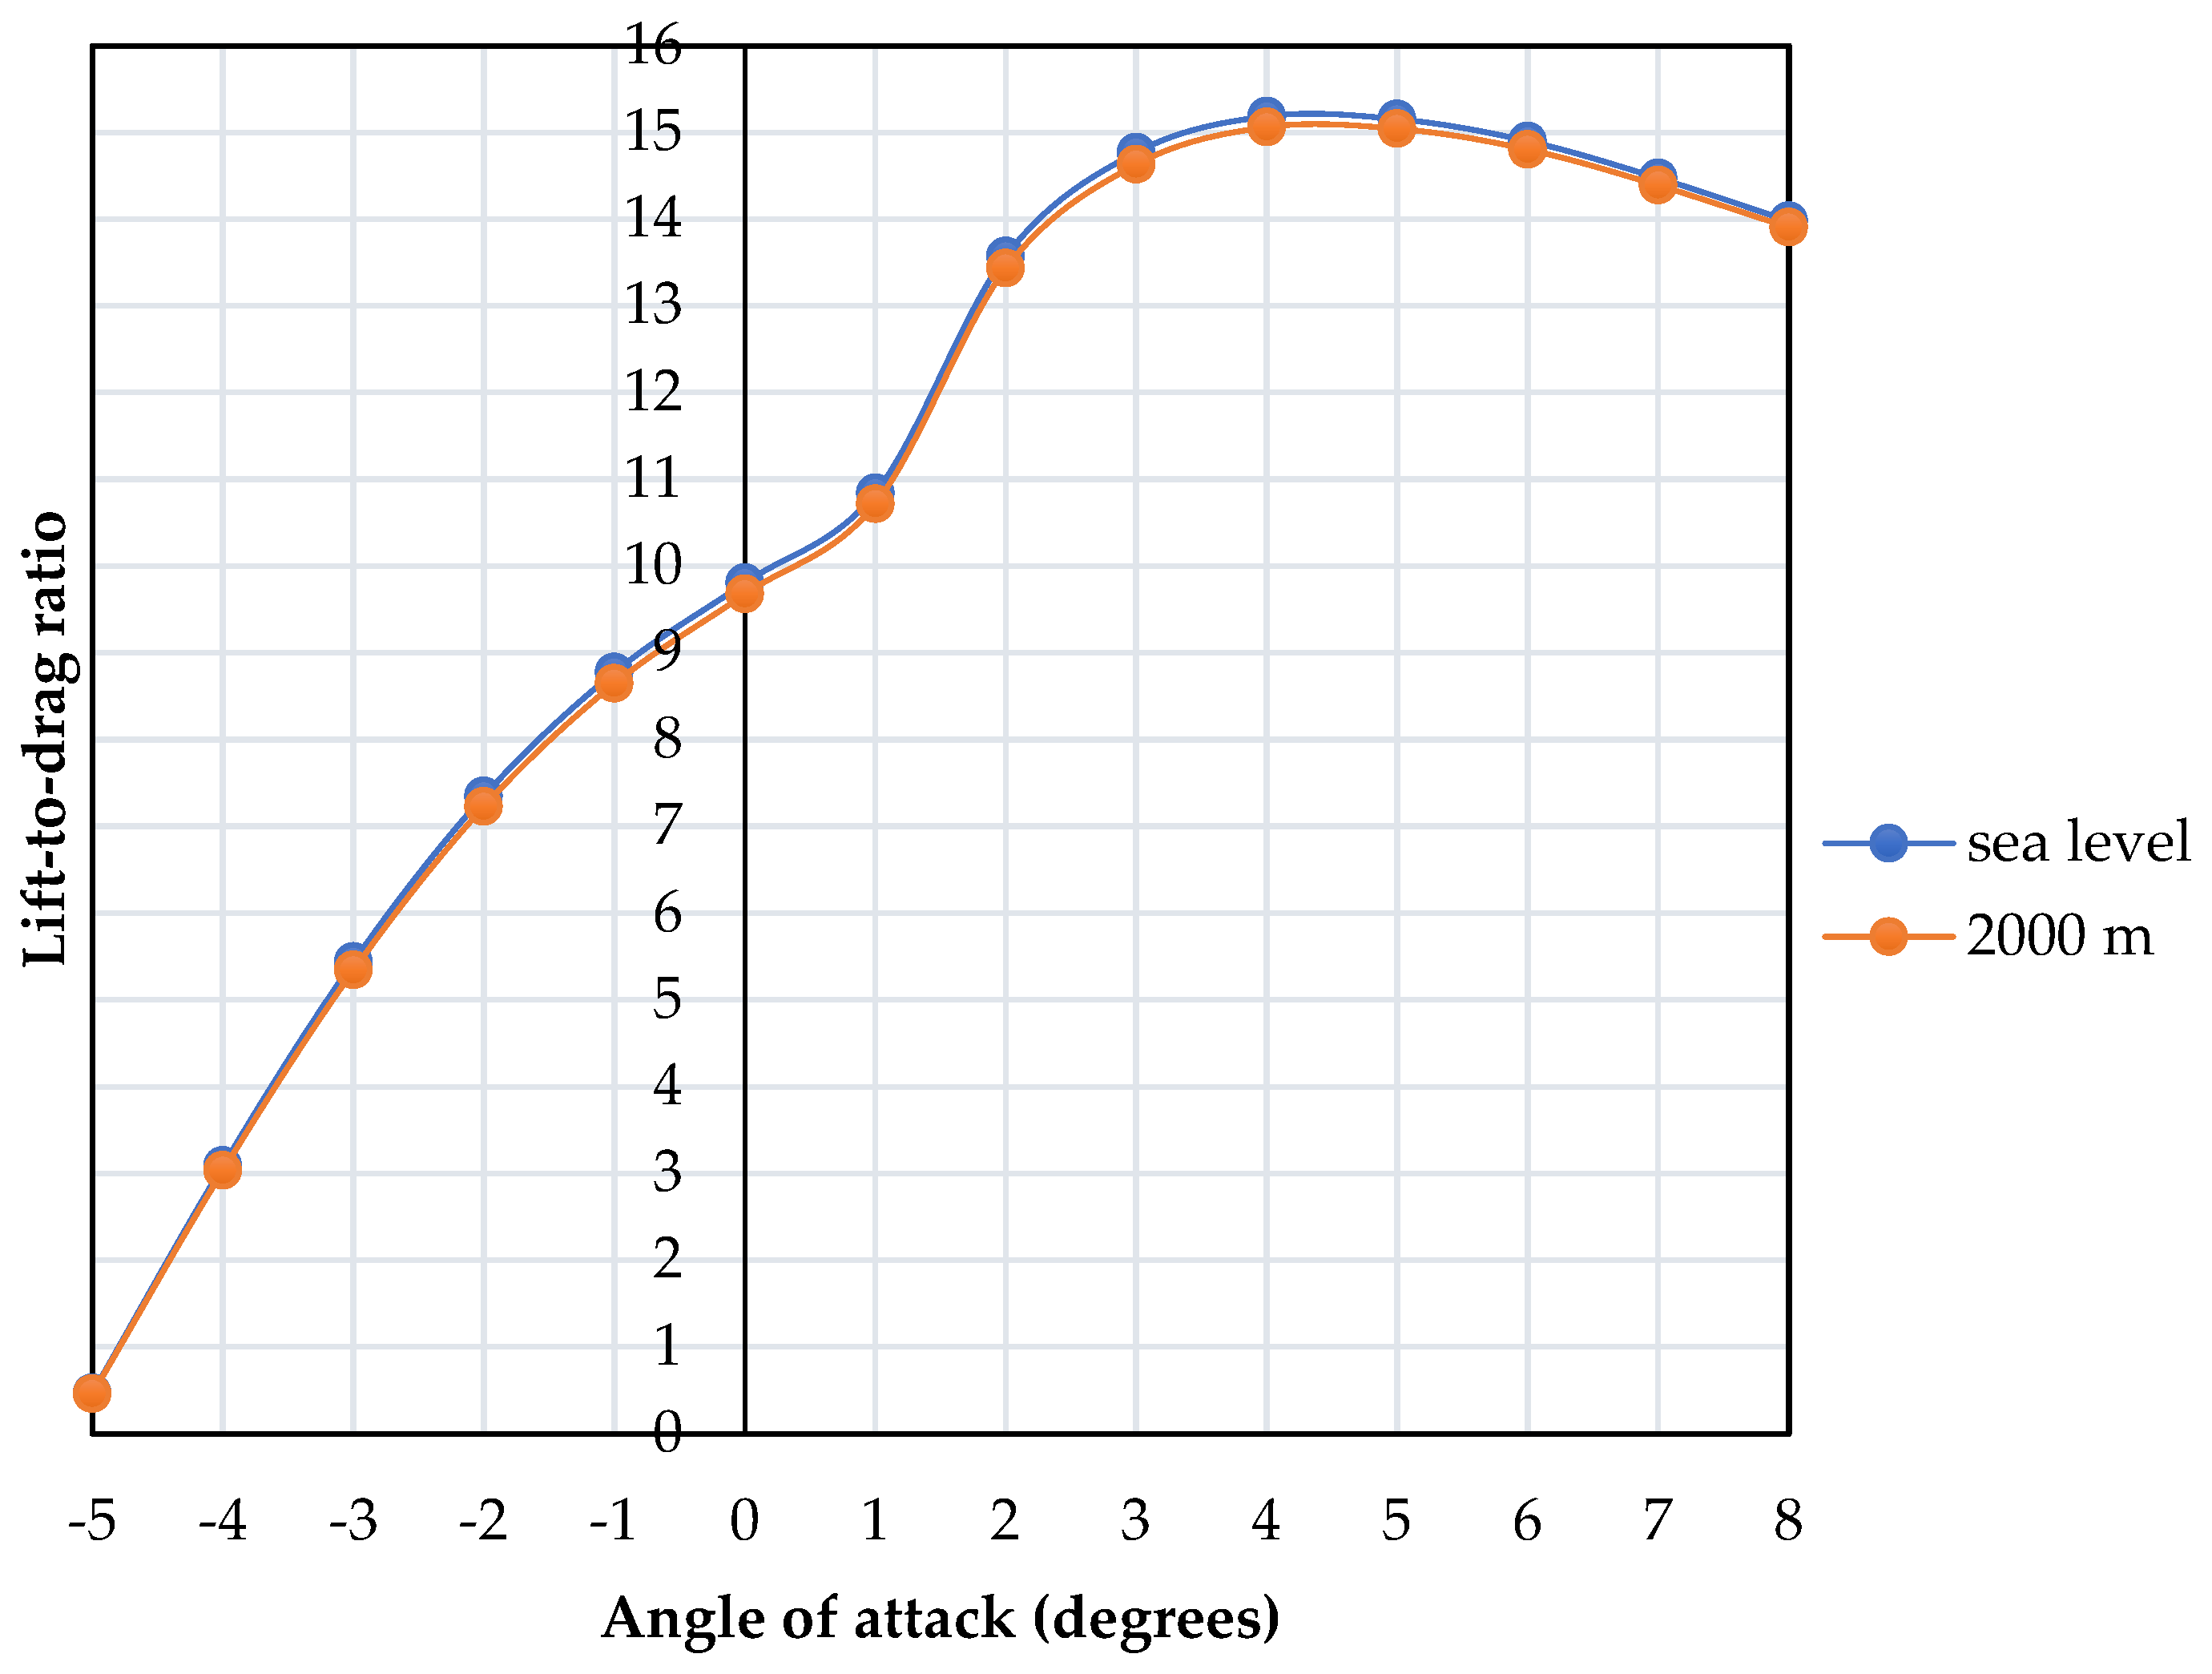
9. Aerodynamic Analysis
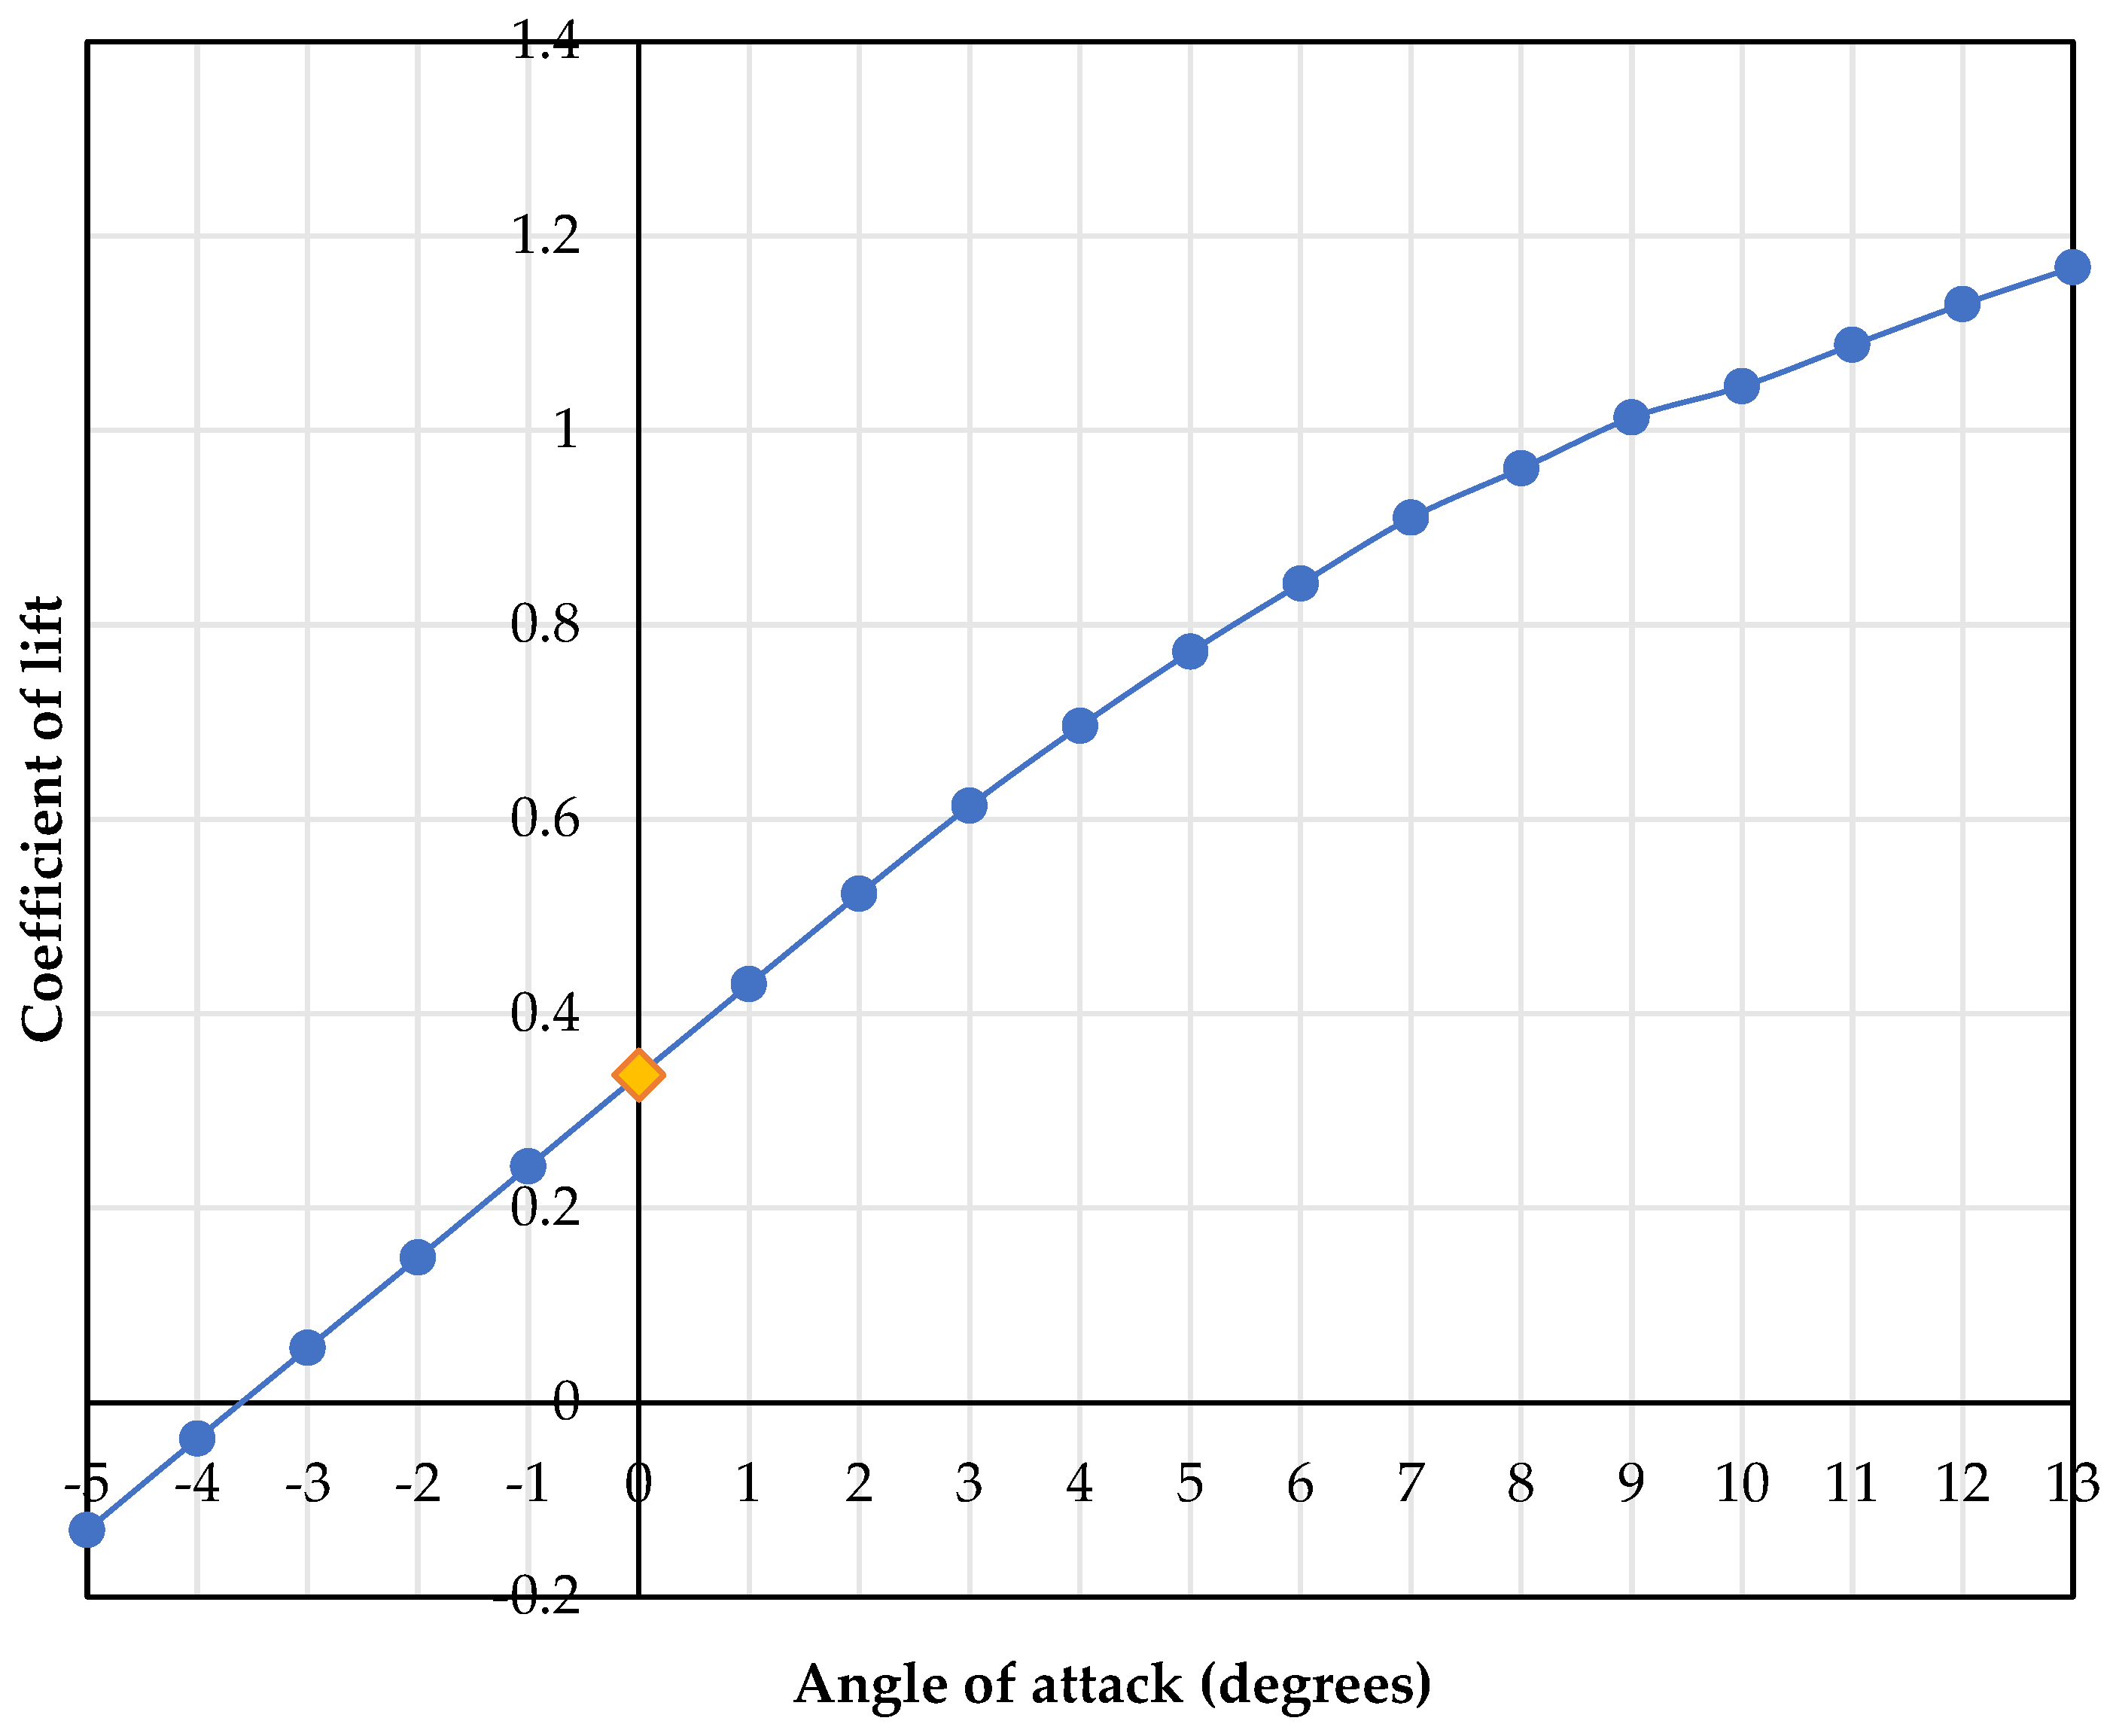
9.1. Lift Curve
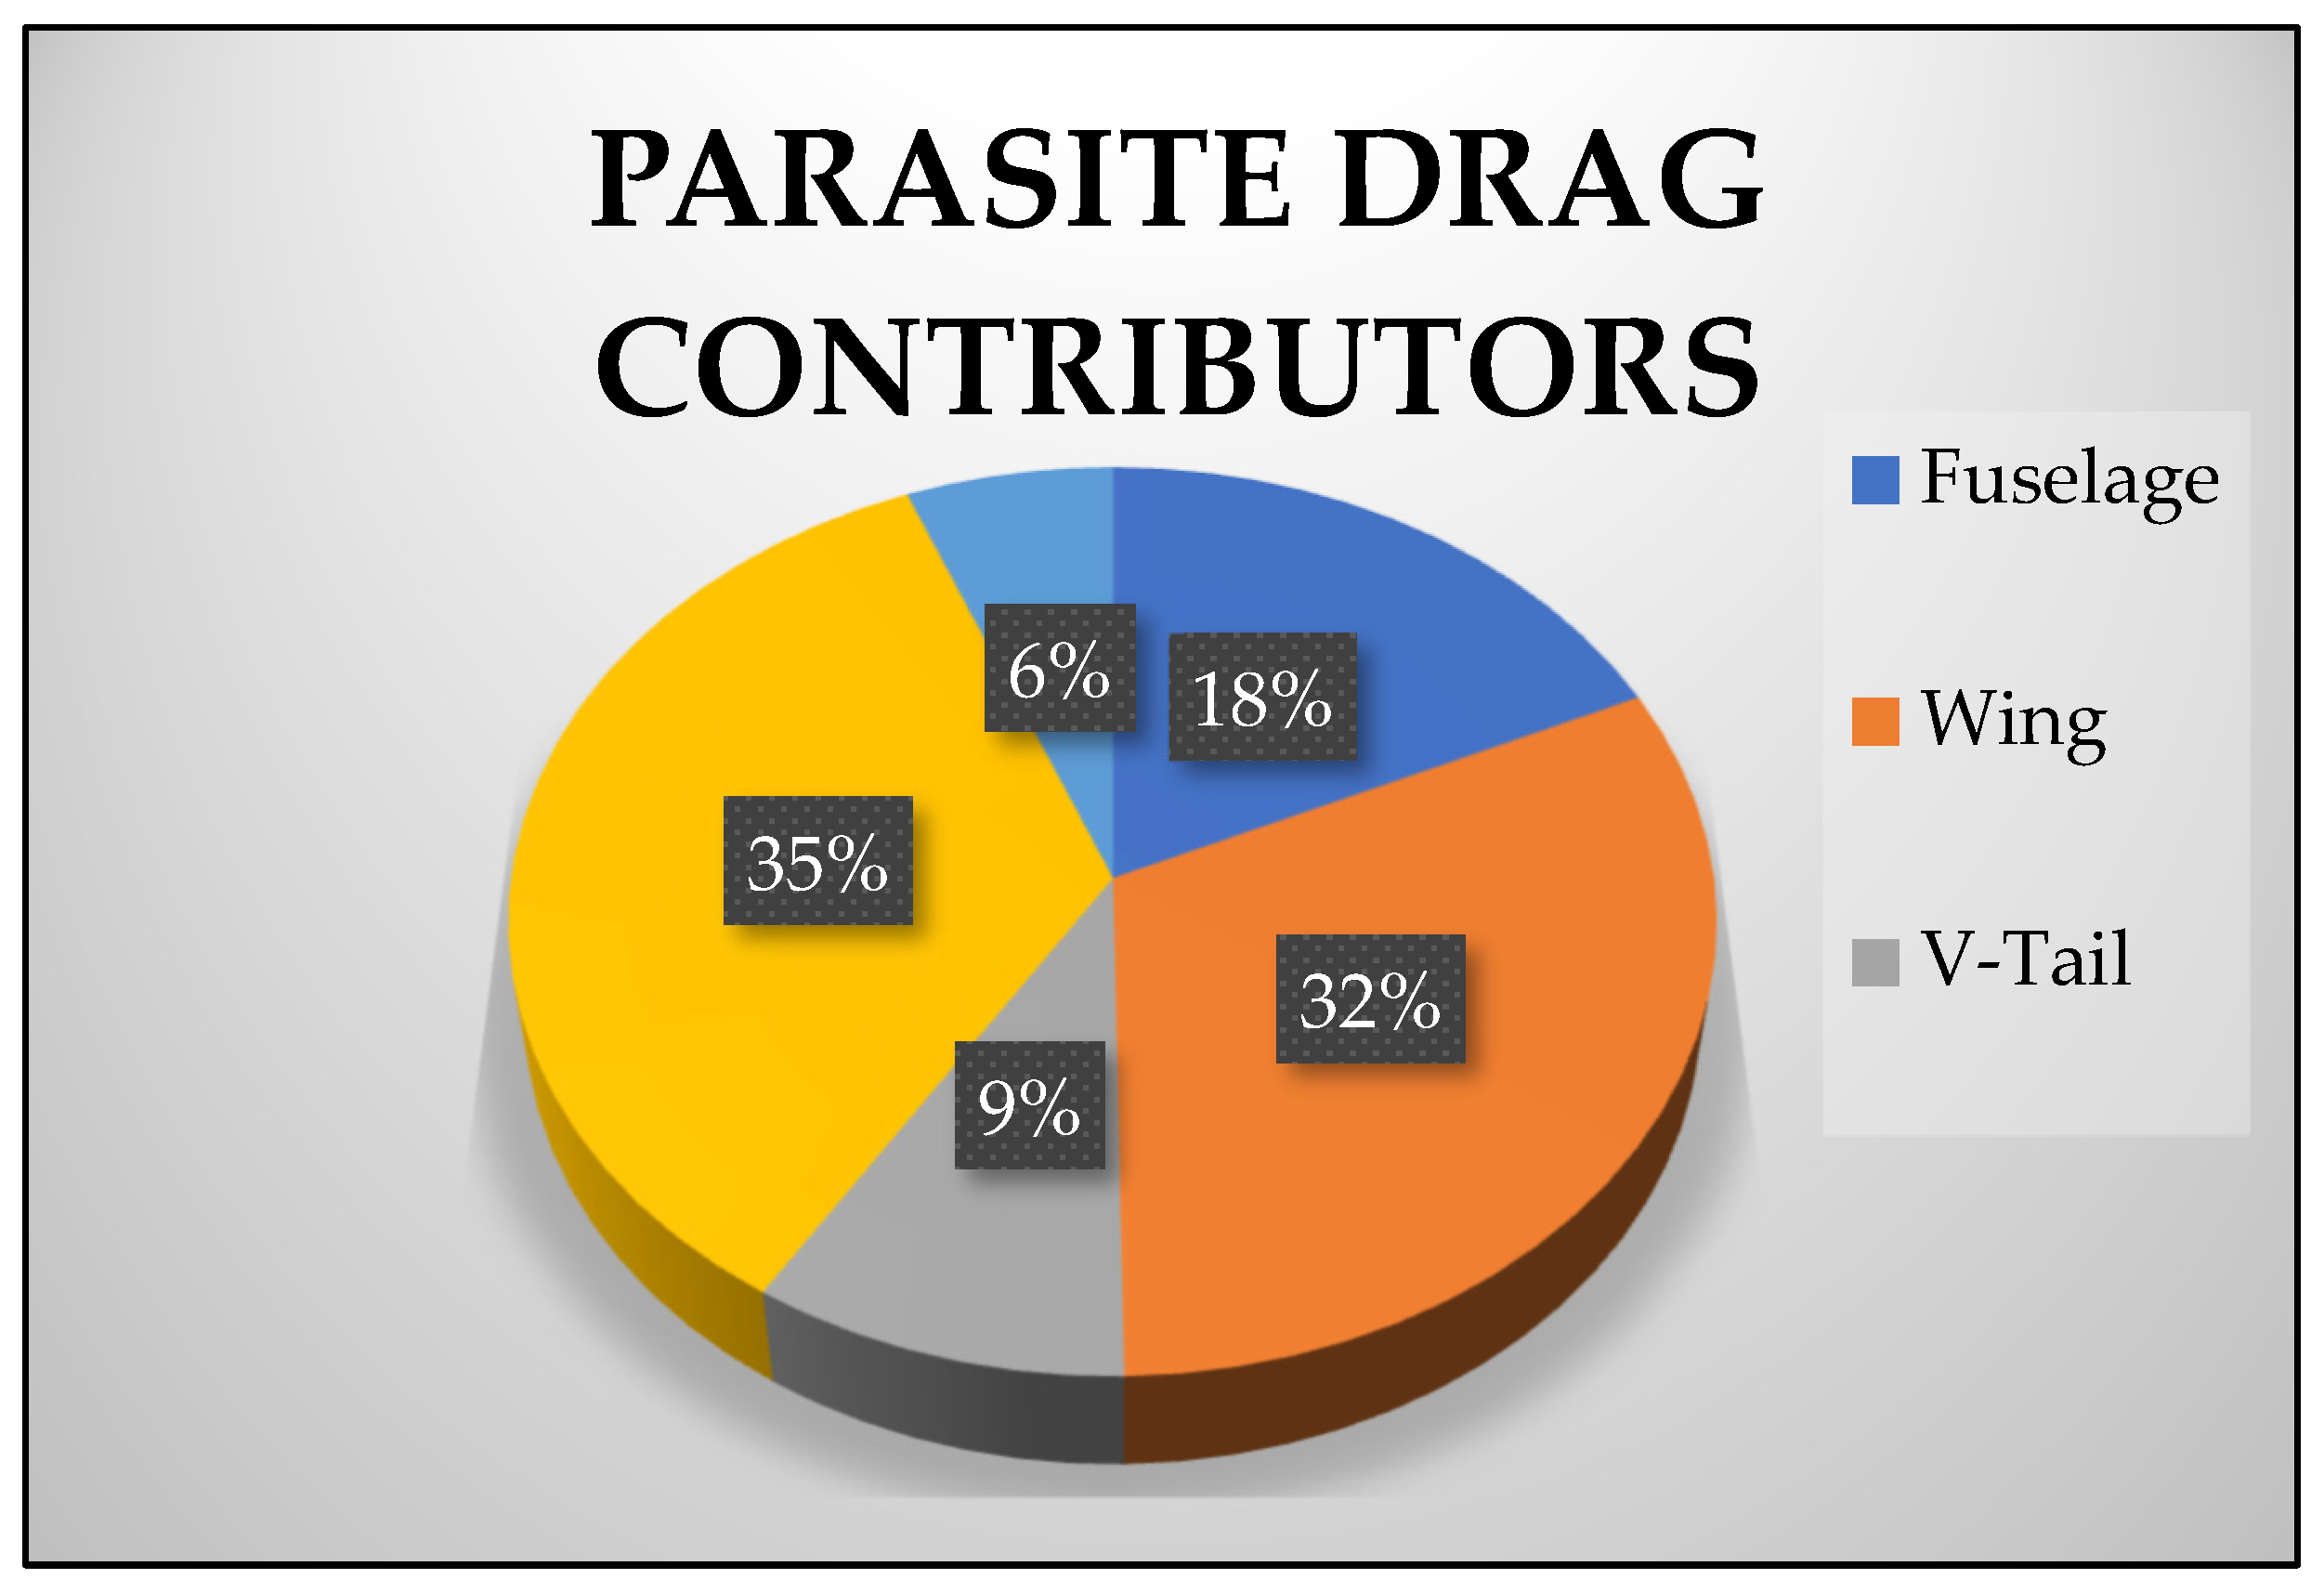
9.2. Total Parasite Drag
9.3. Calculation of Induced Drag
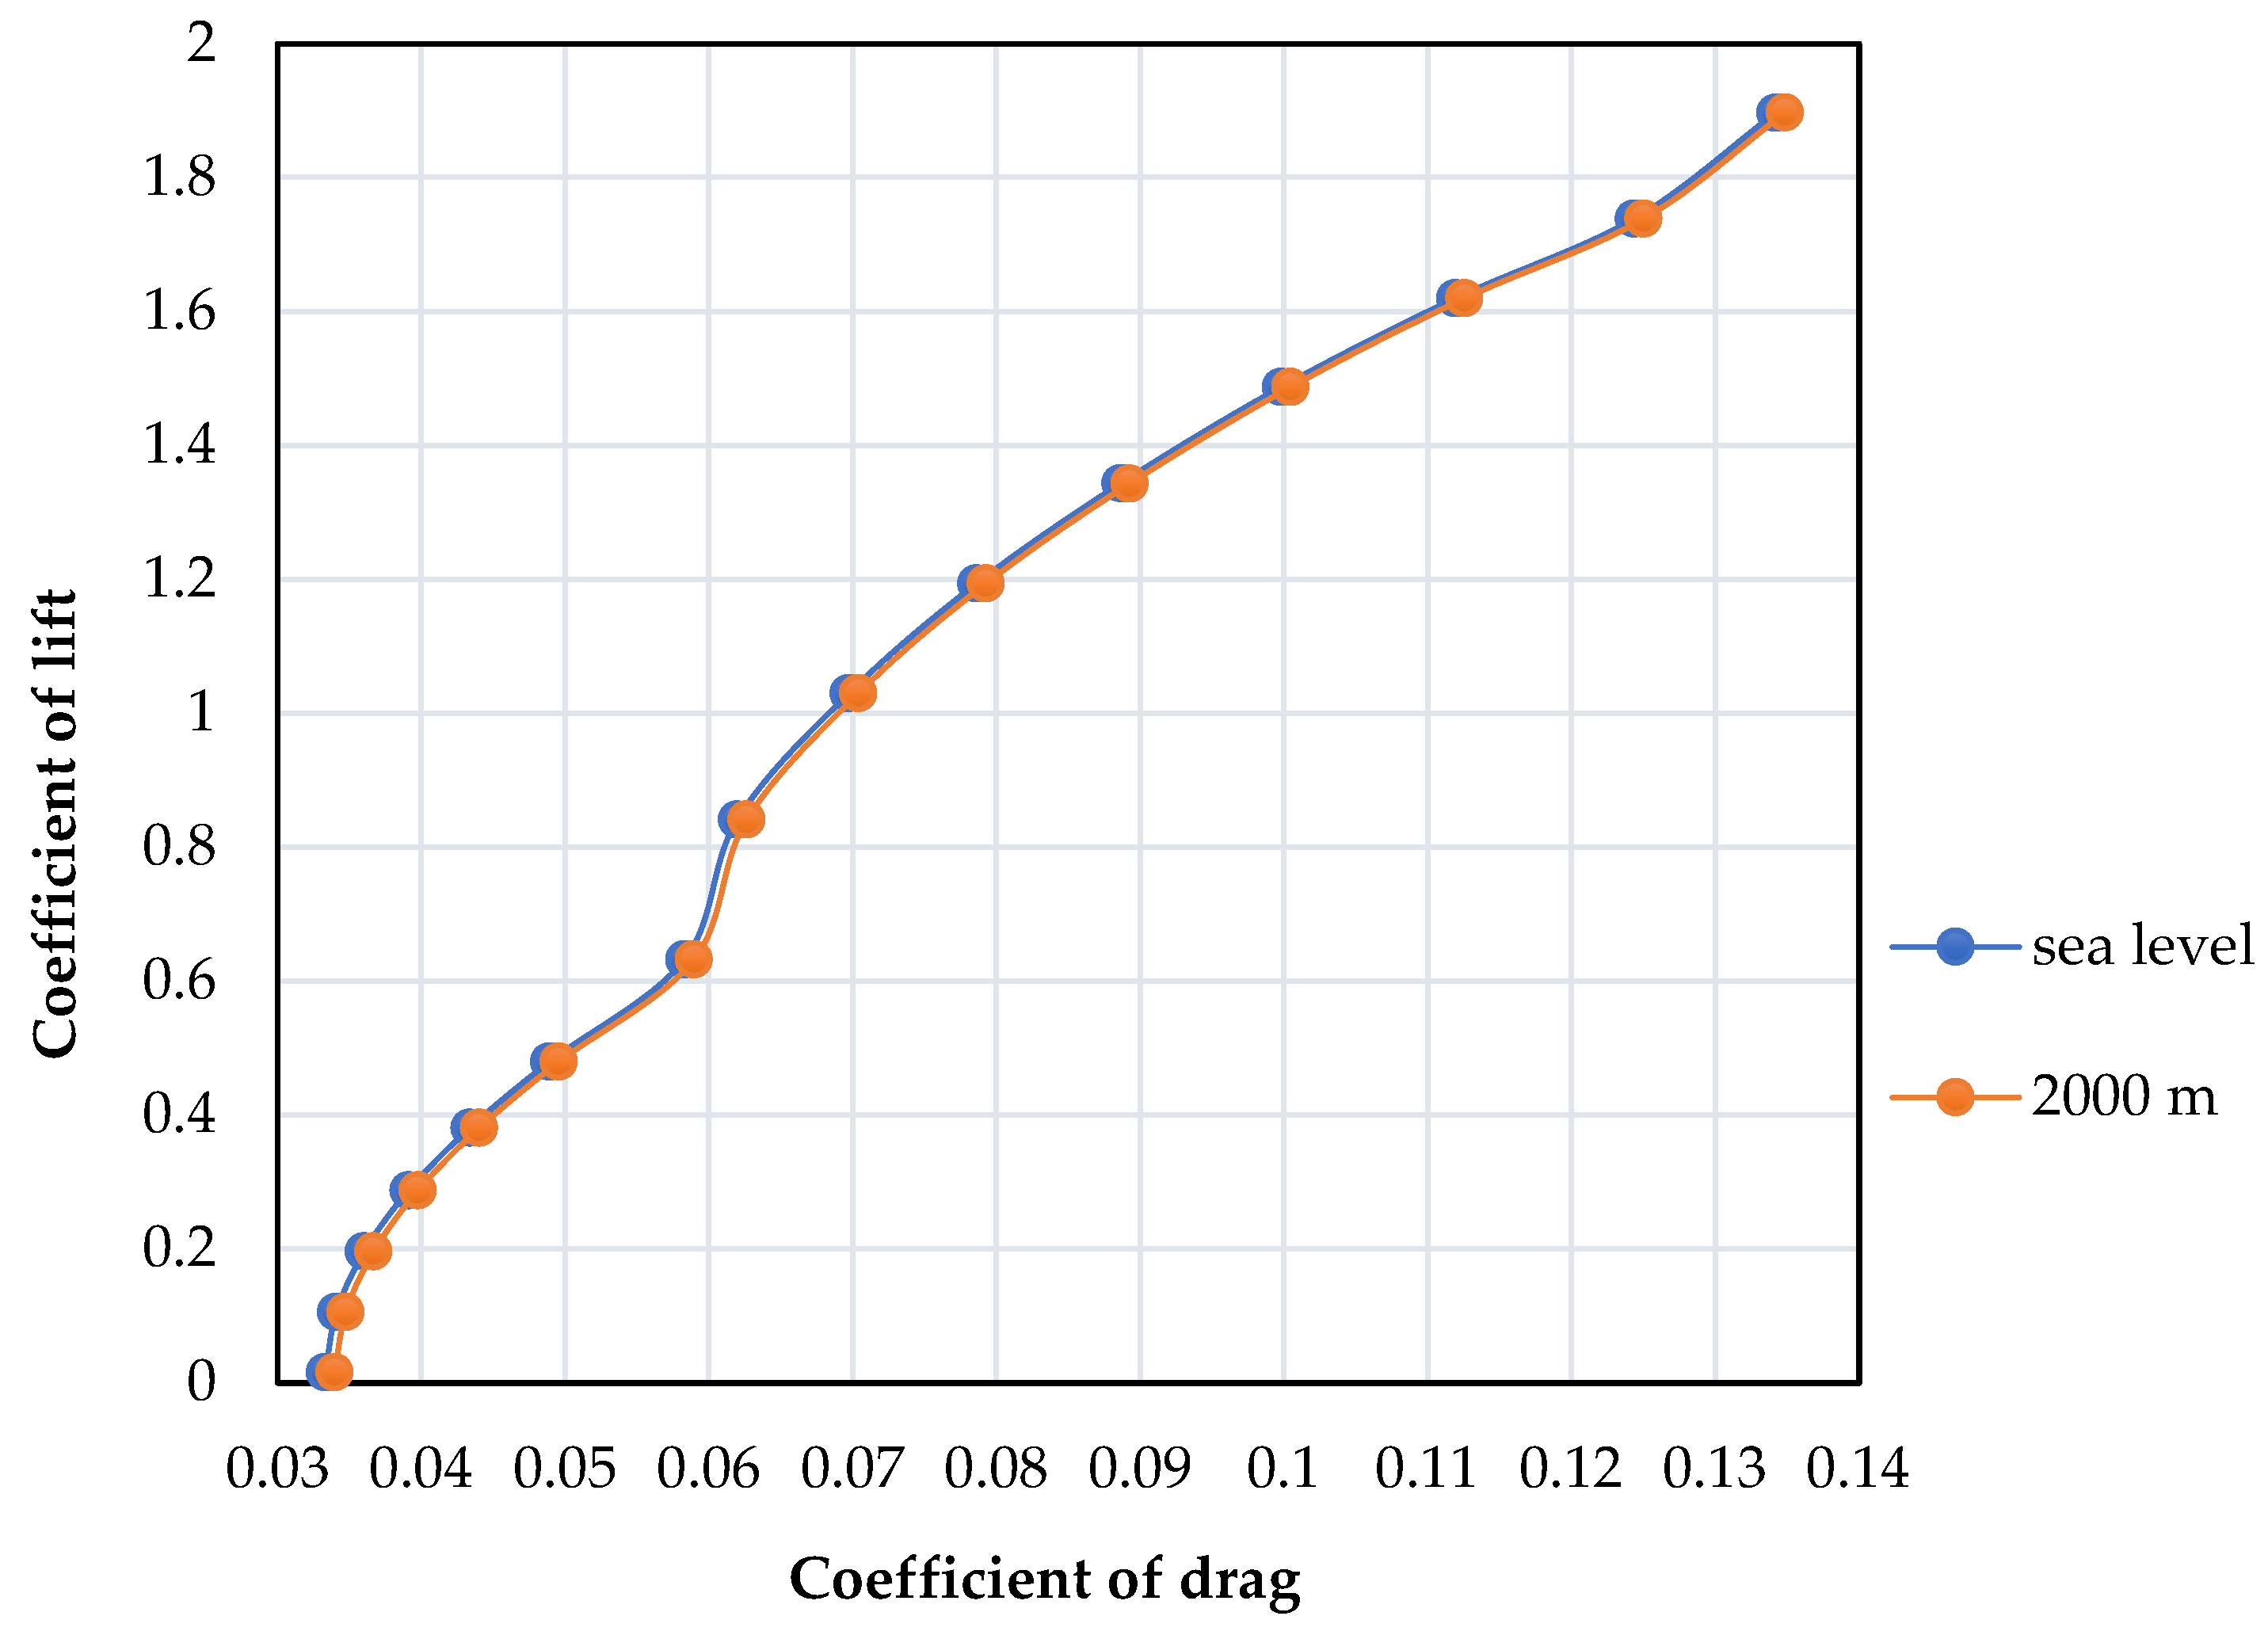
9.4. Lift Estimation
9.5. Parasite Drag
9.6. Total Drag
9.7. Thrust Calculation
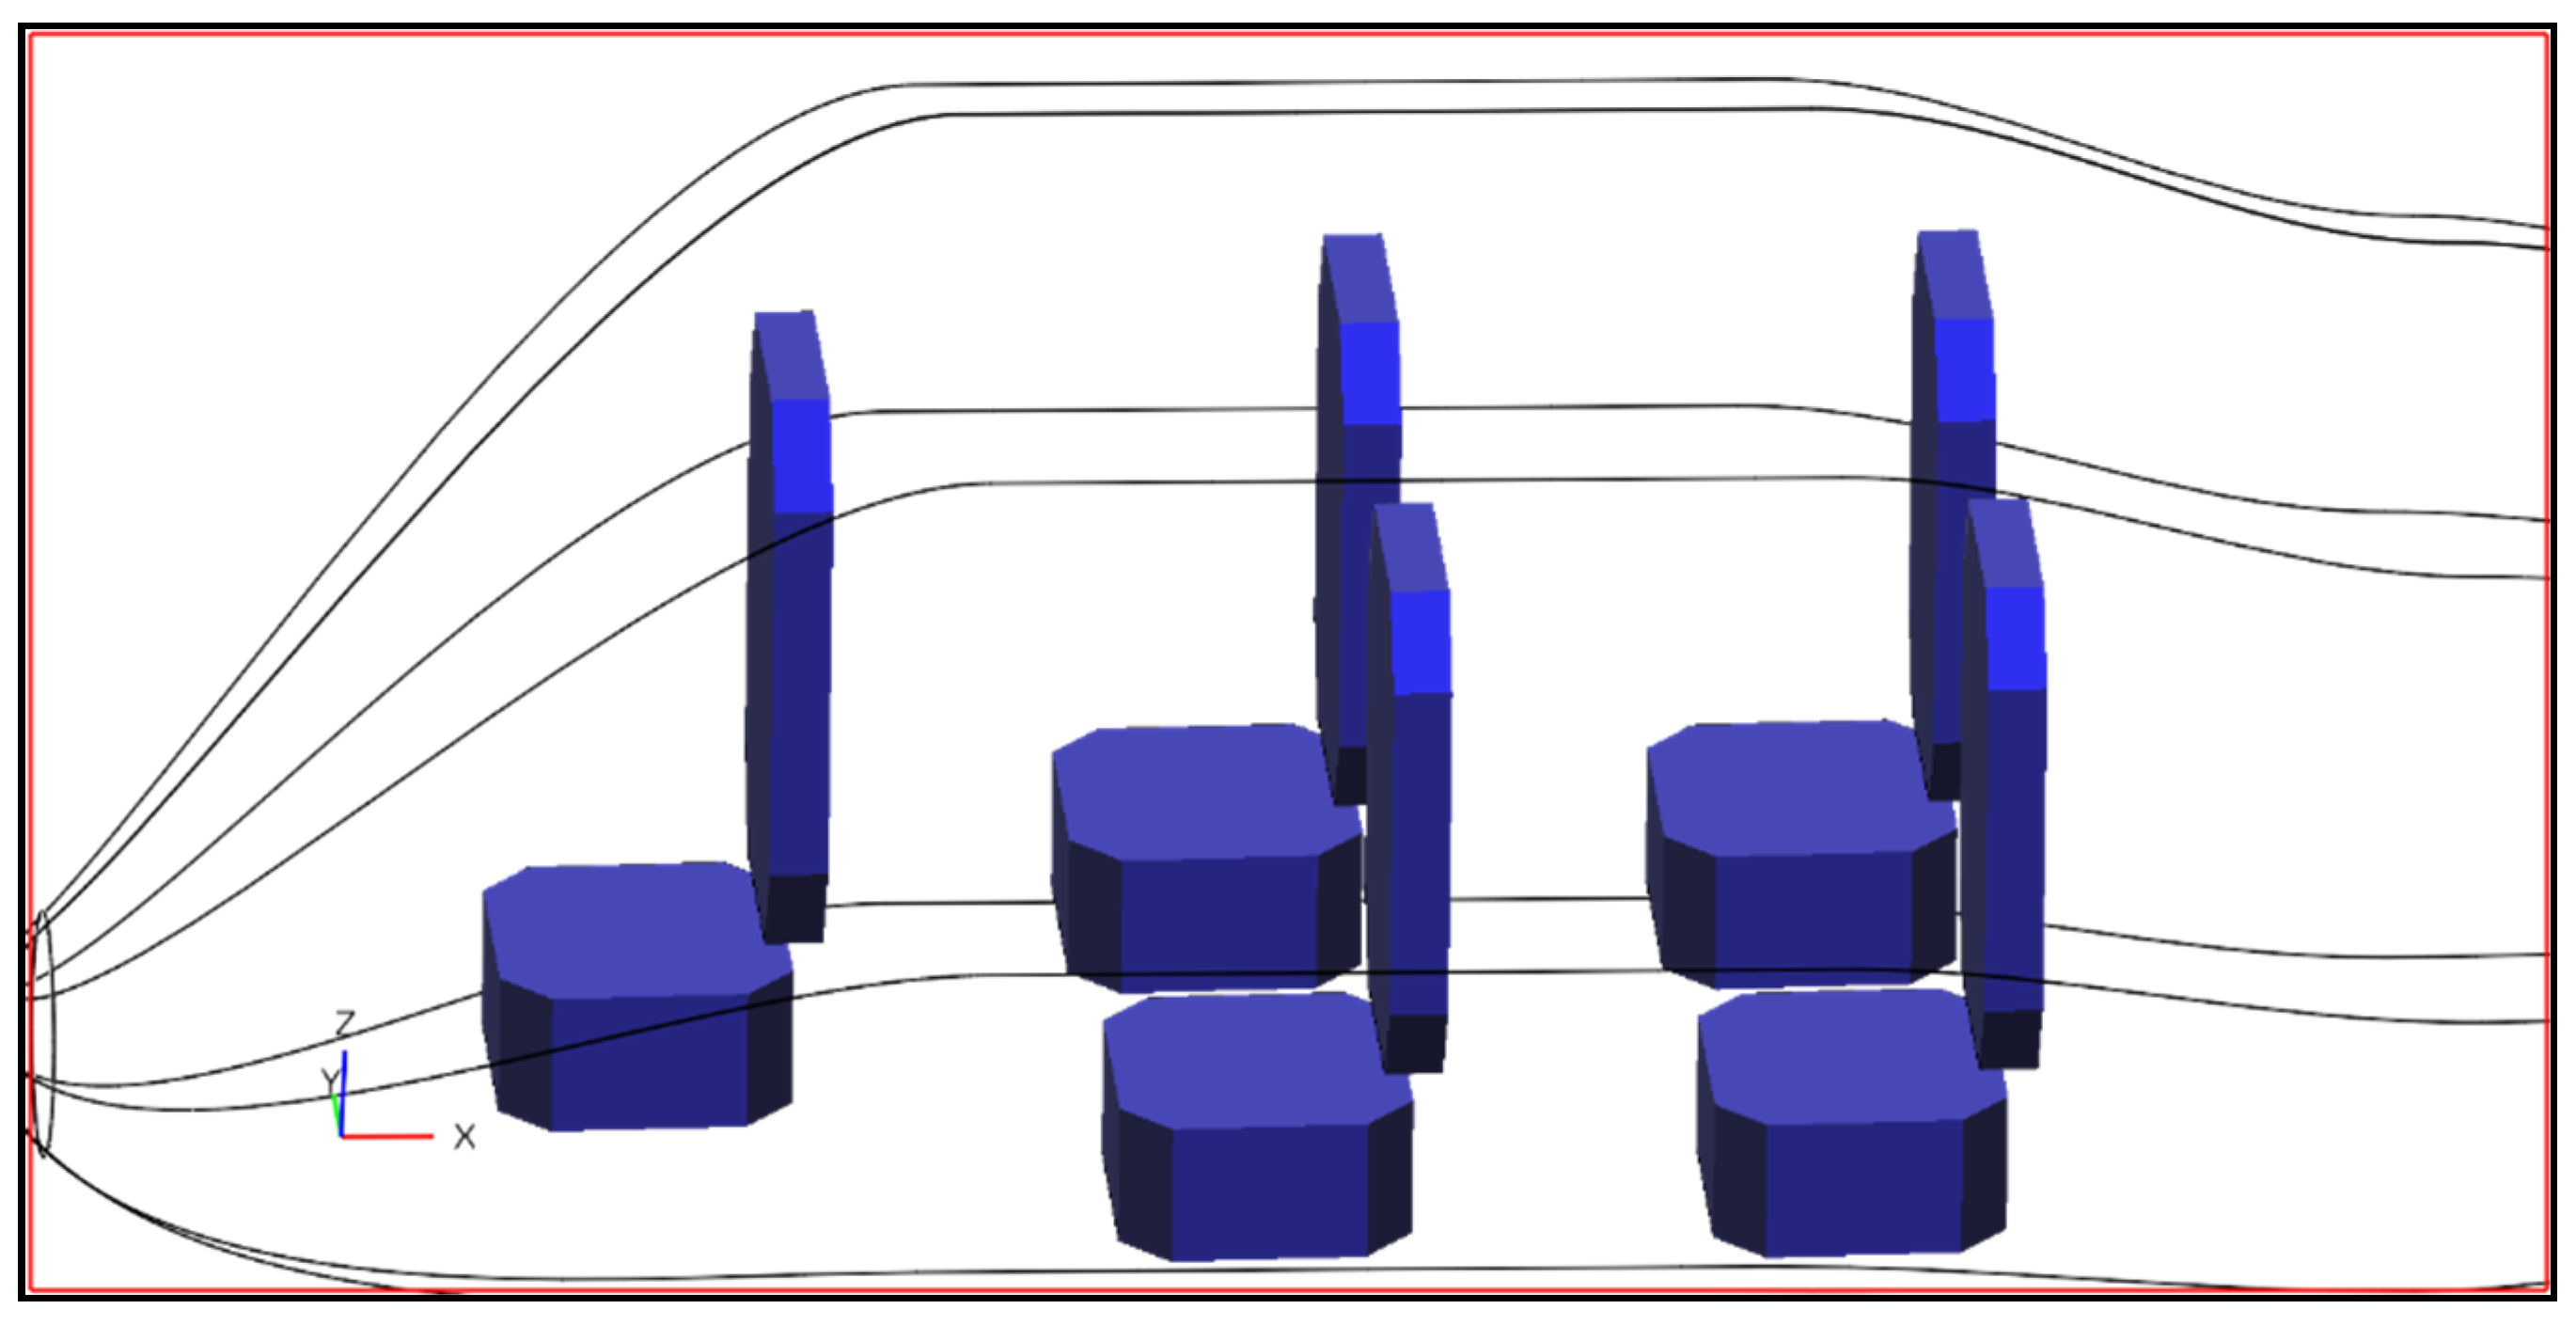
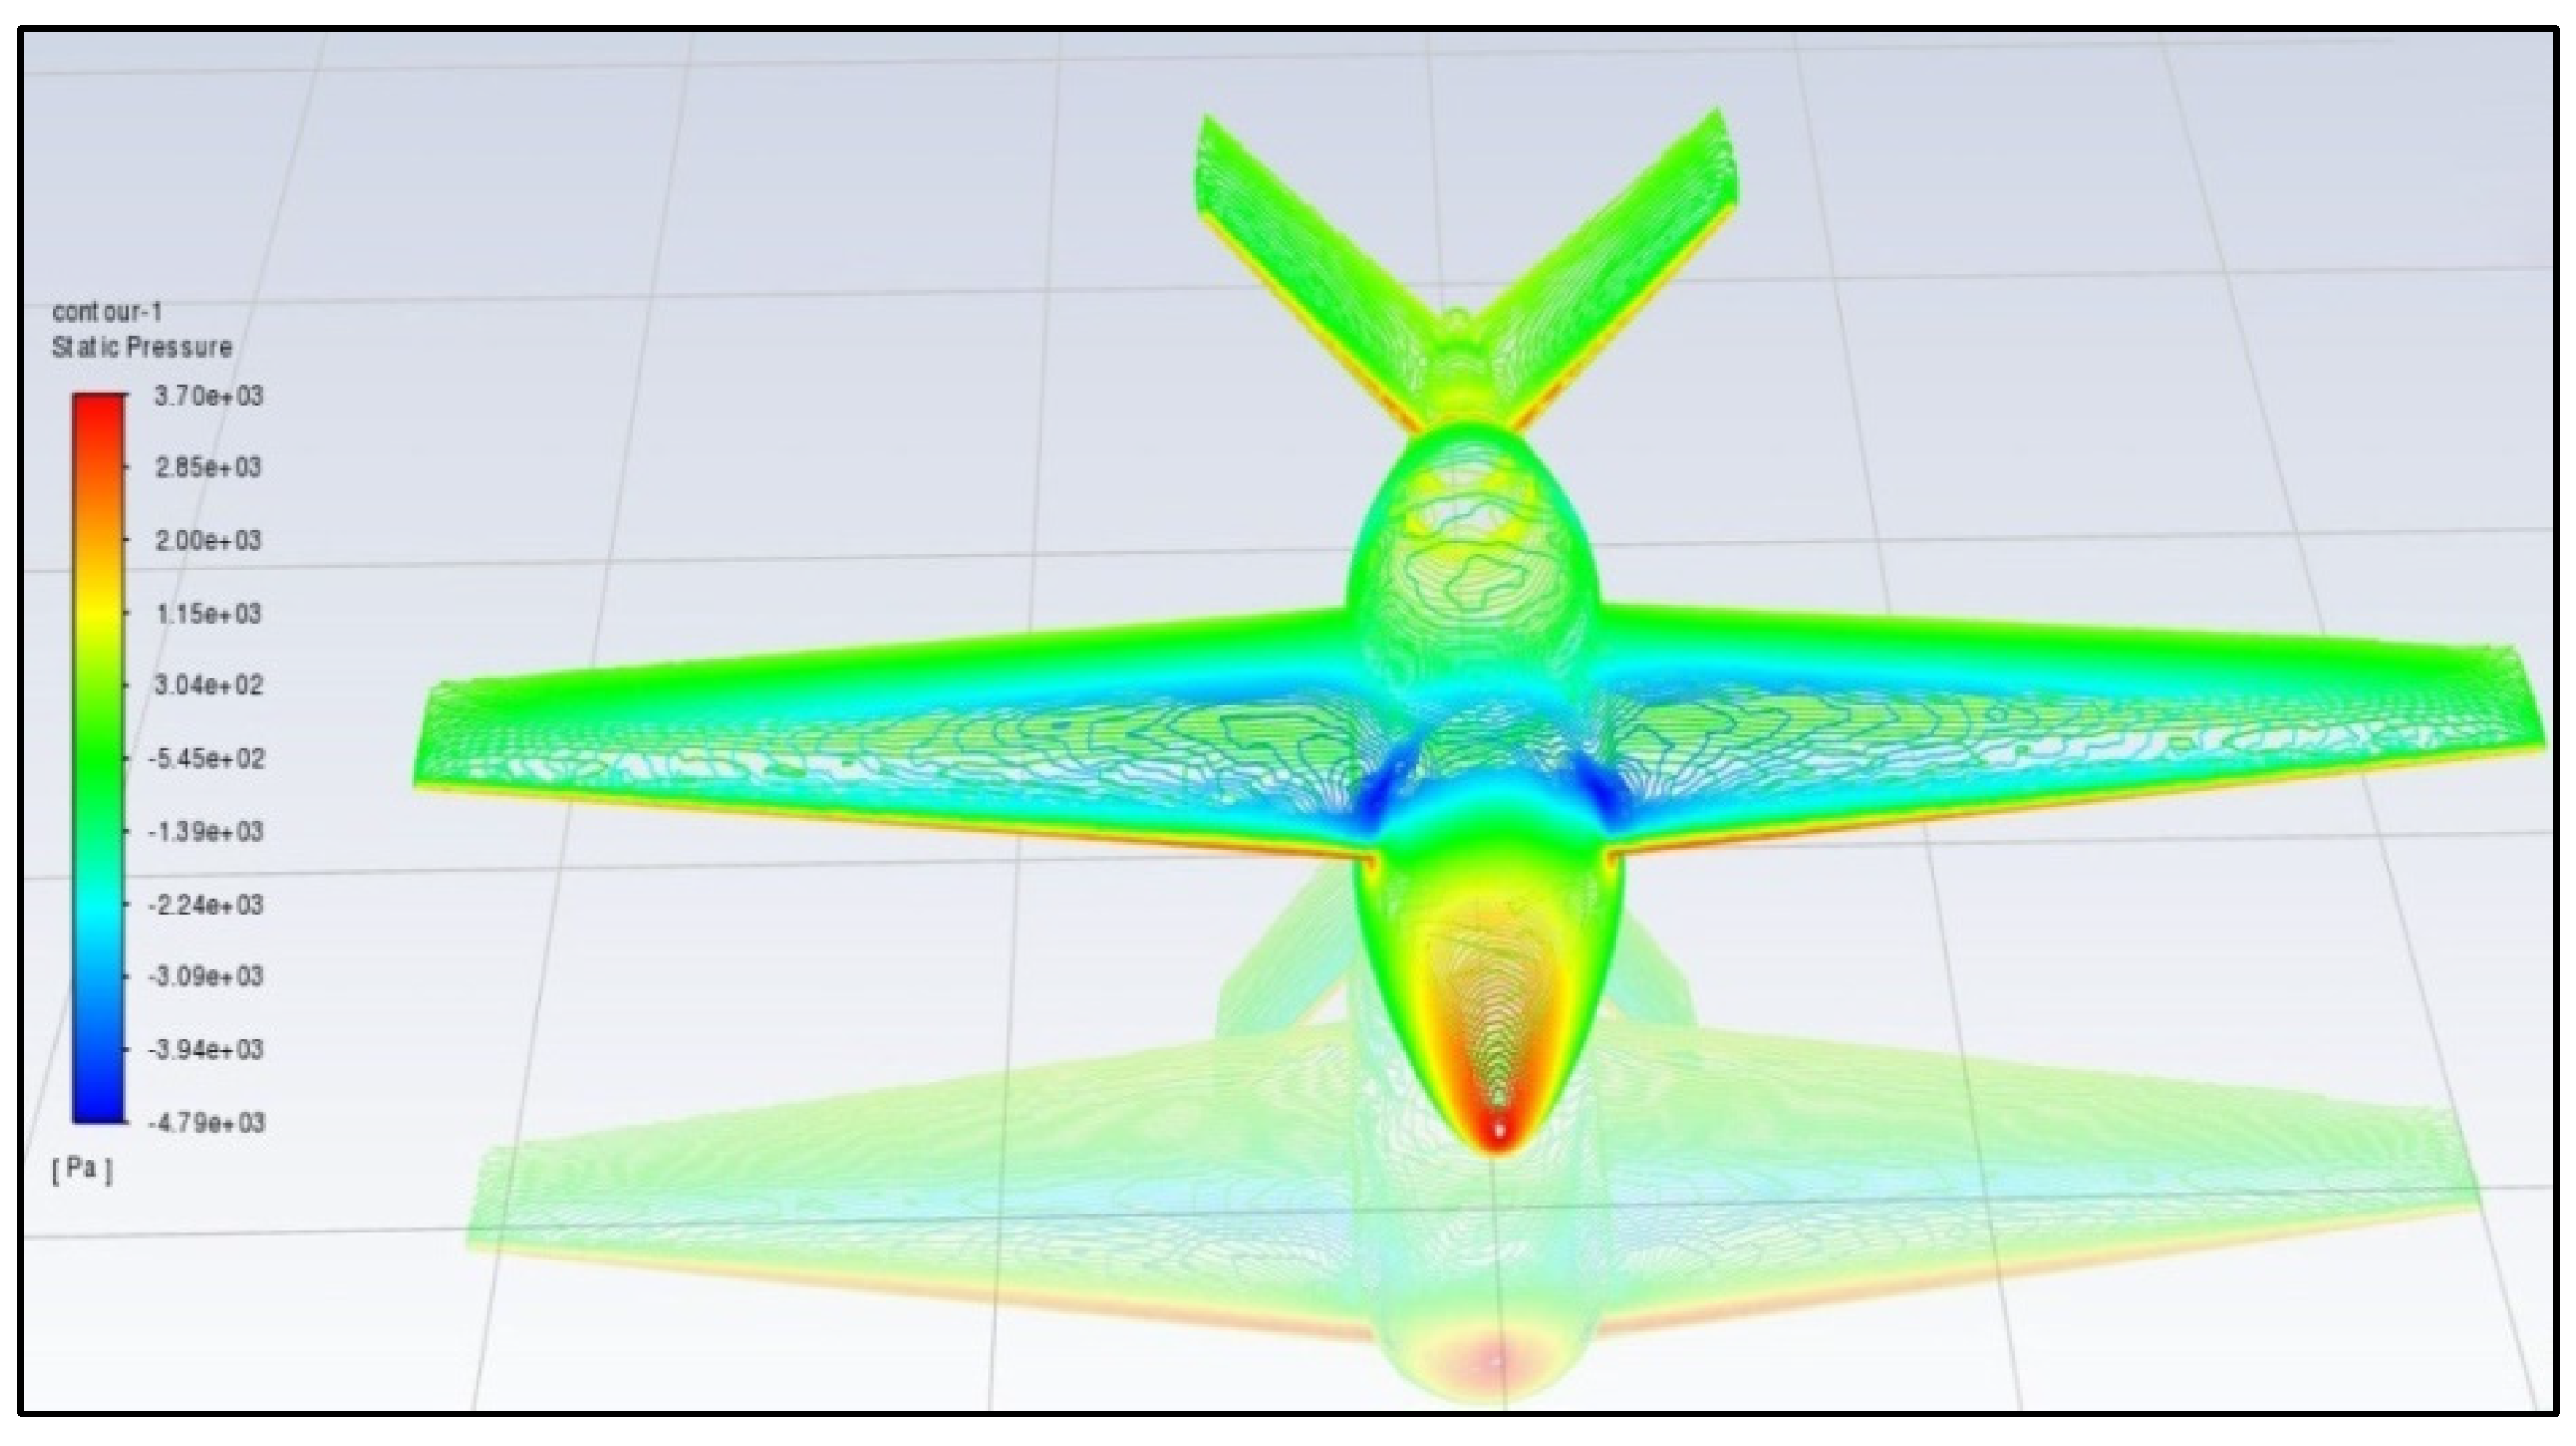
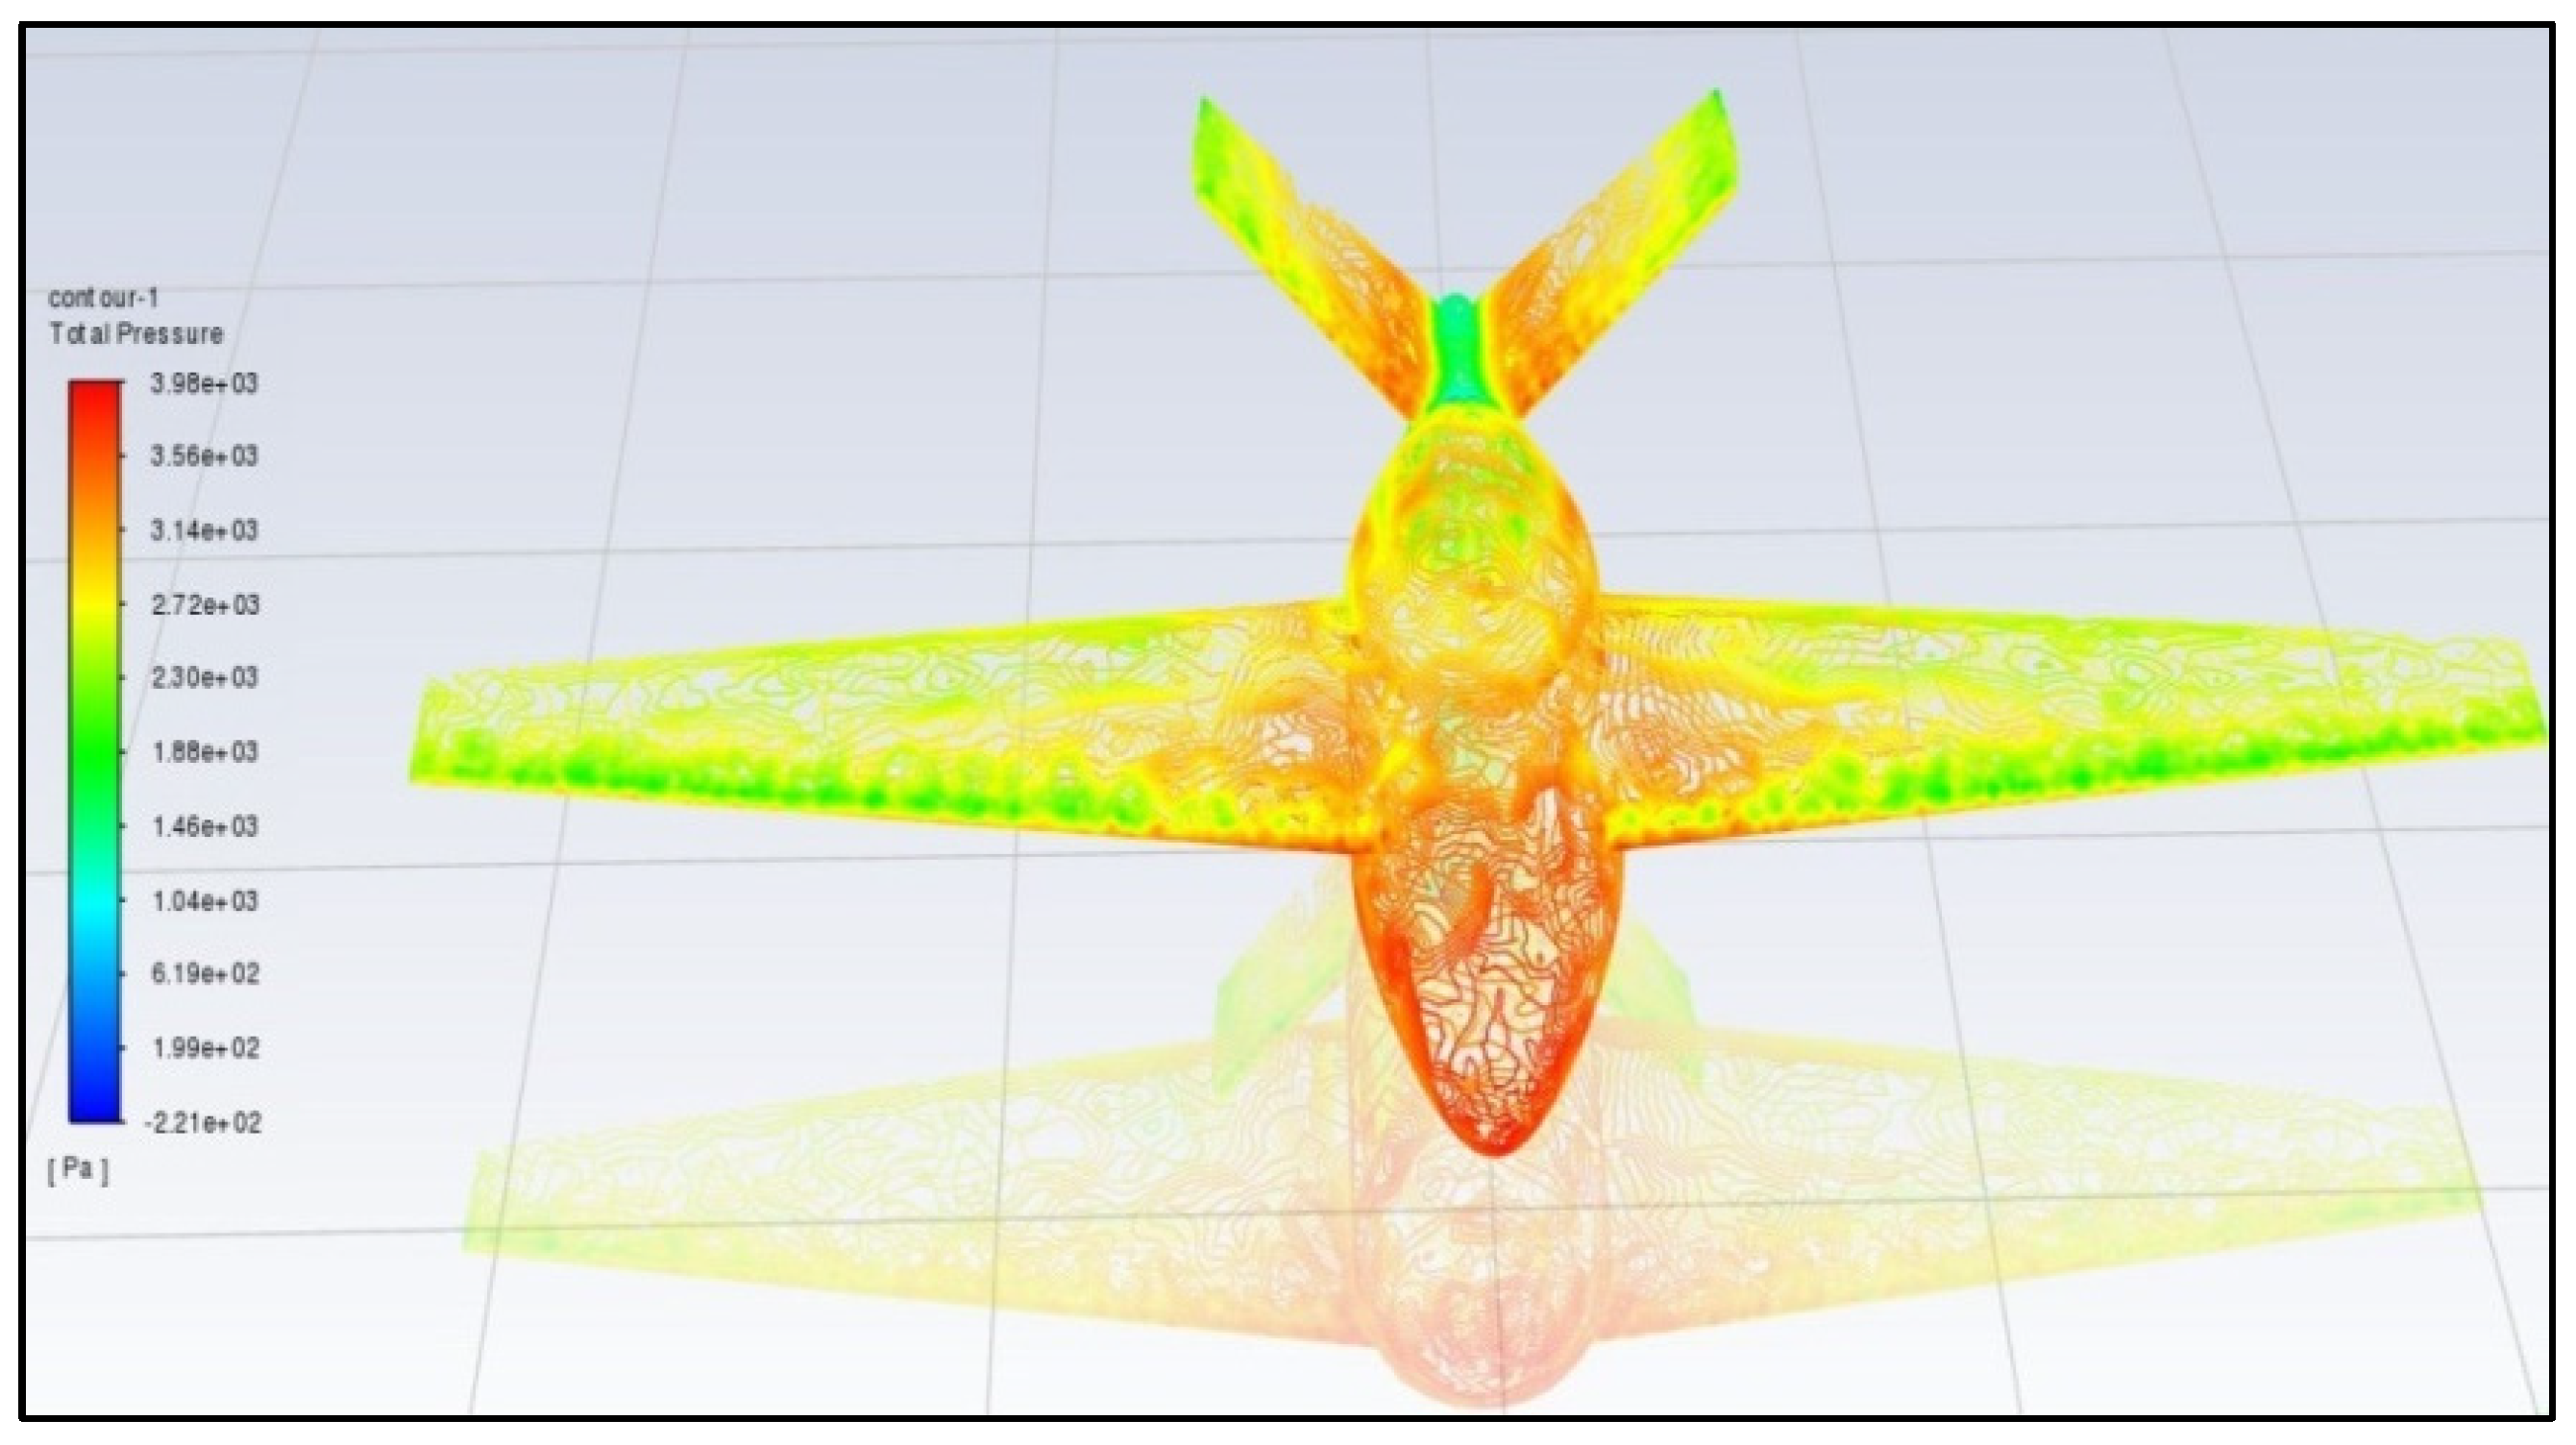
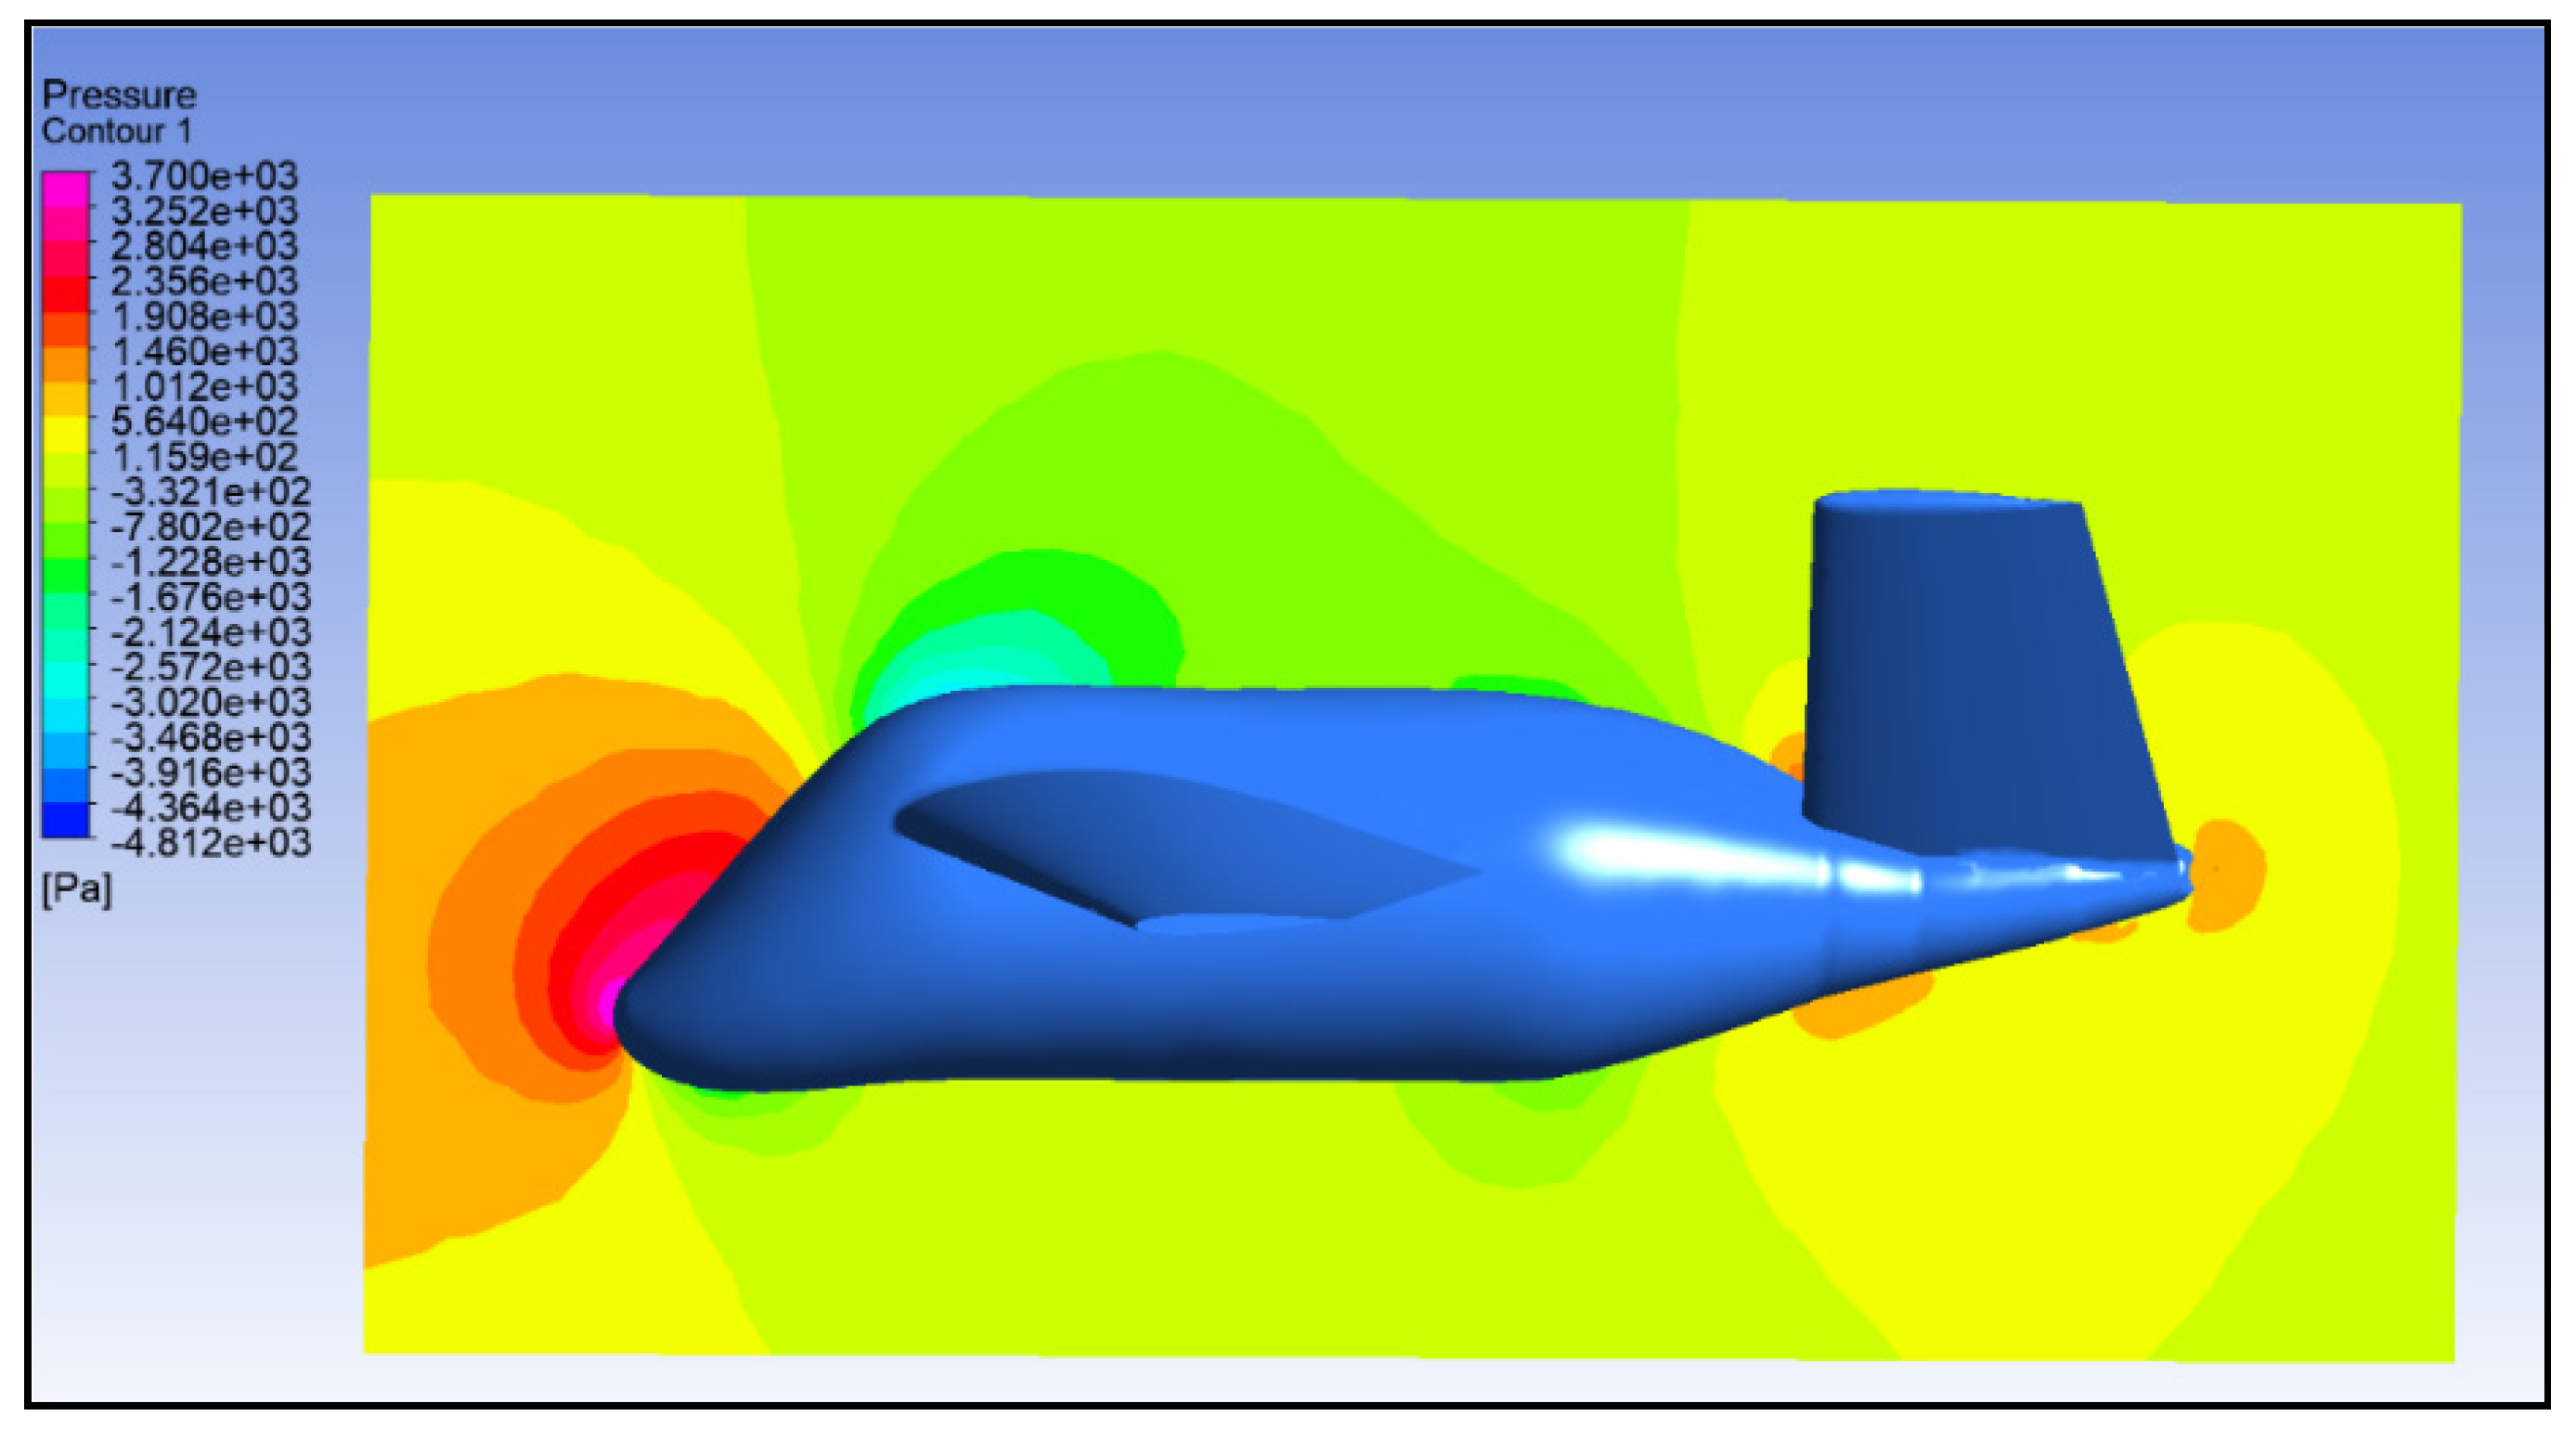
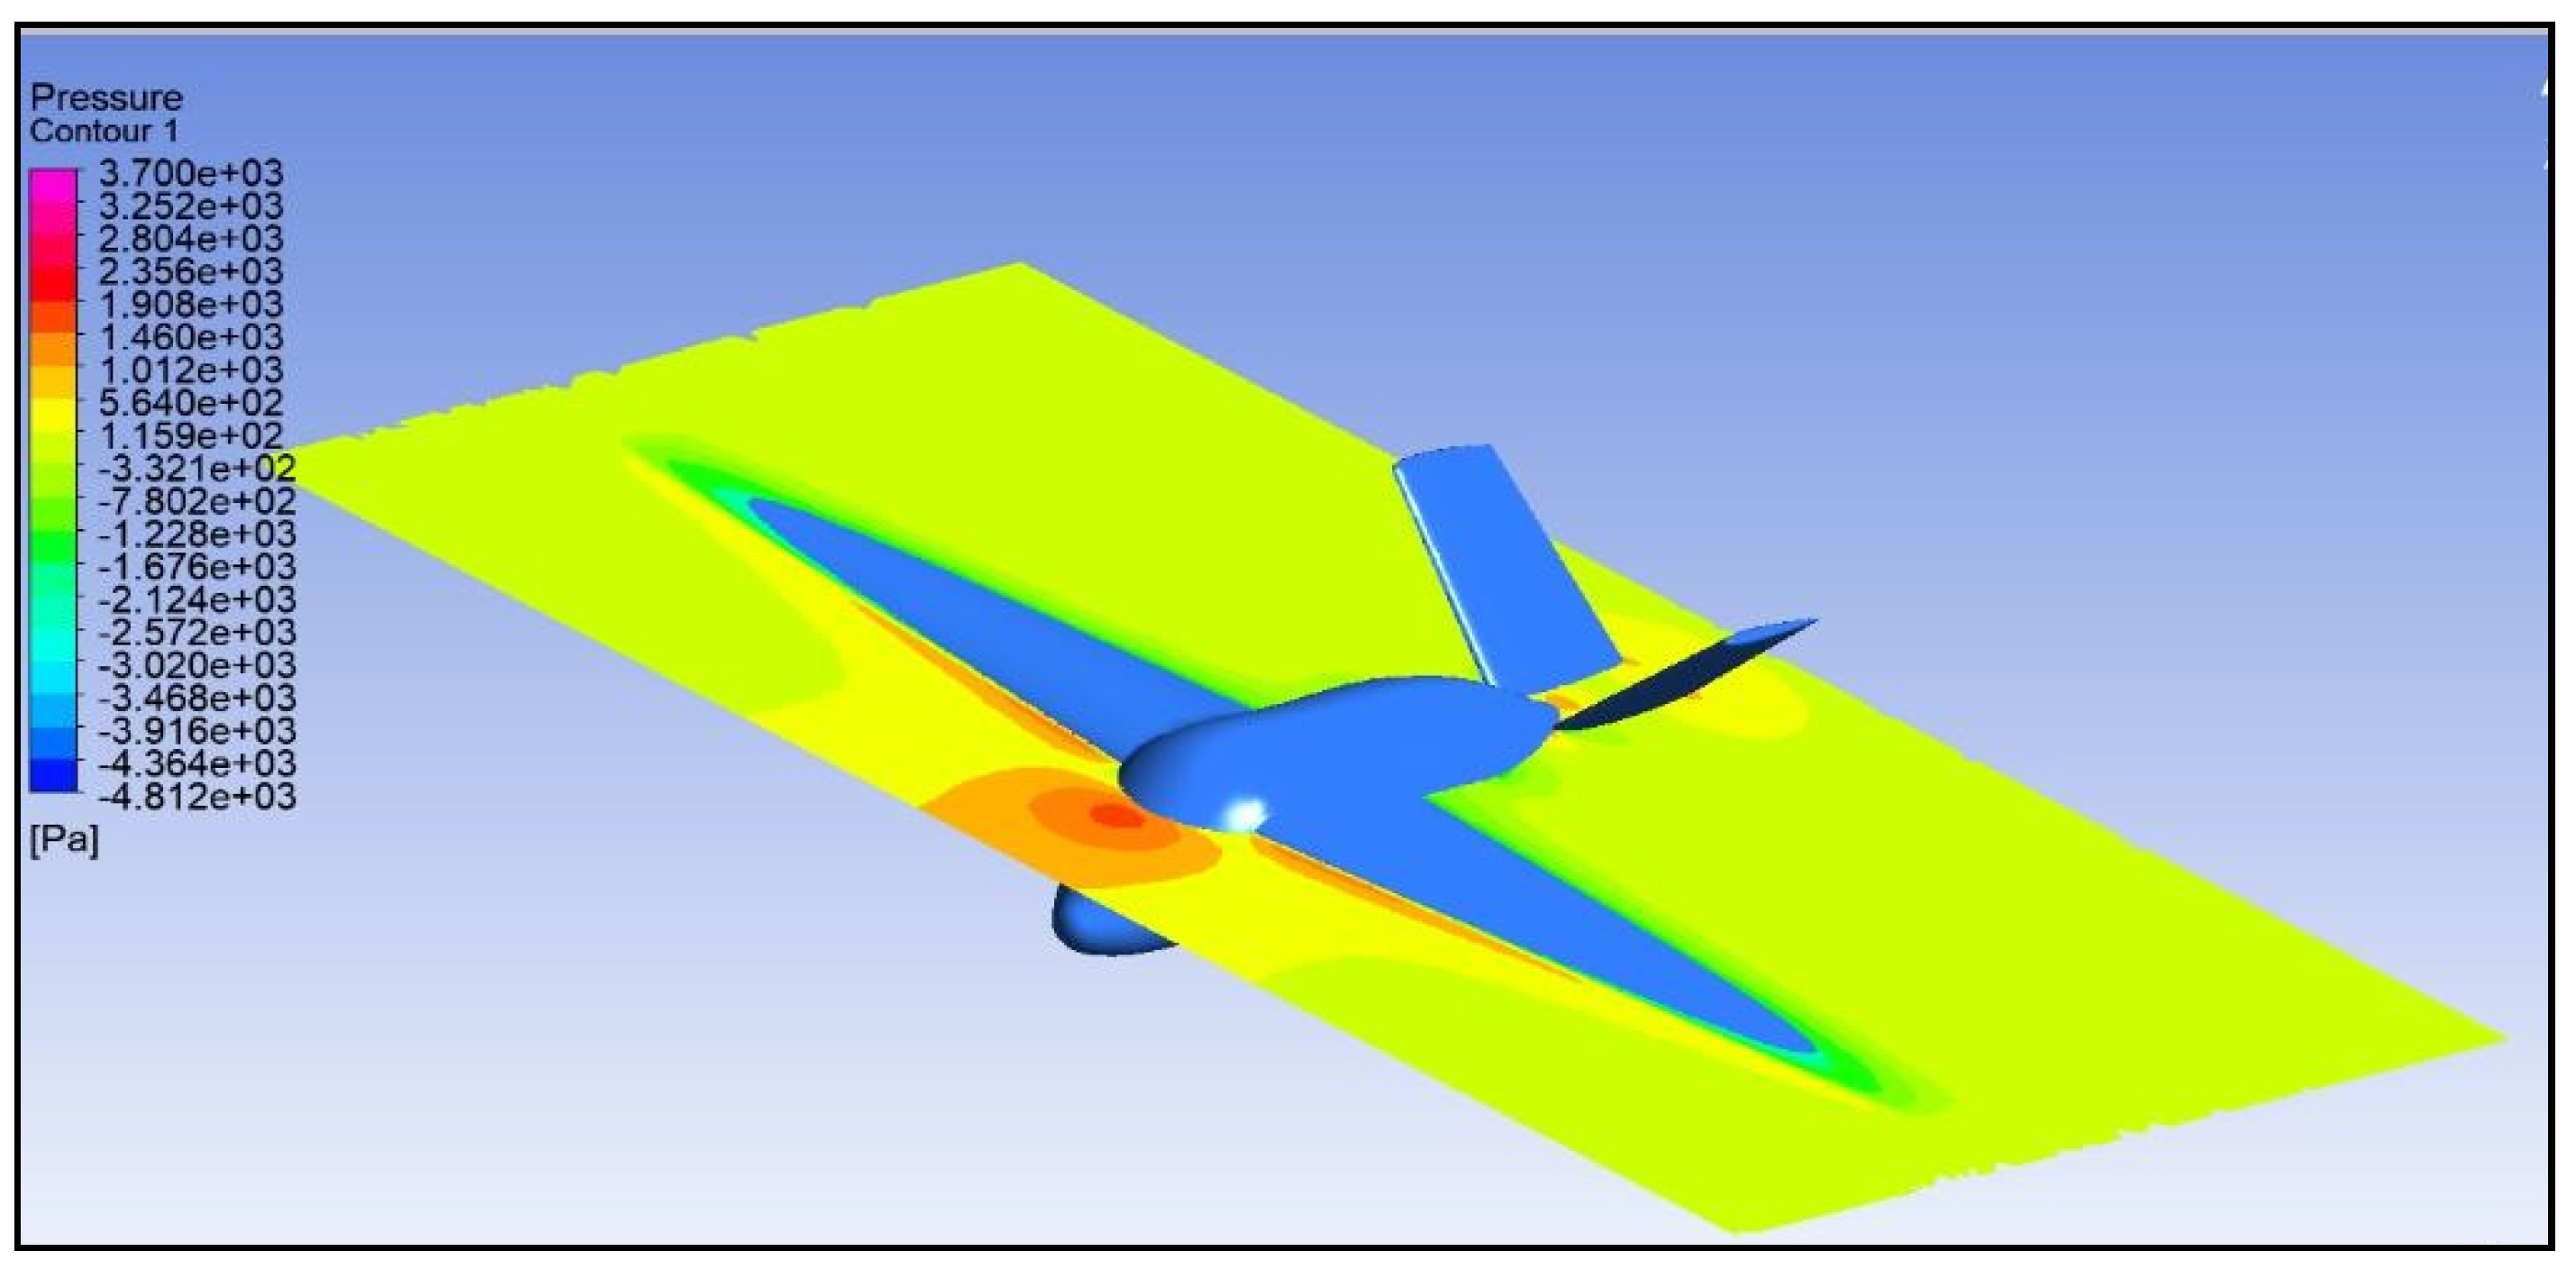
9.8. Pressure Distributions
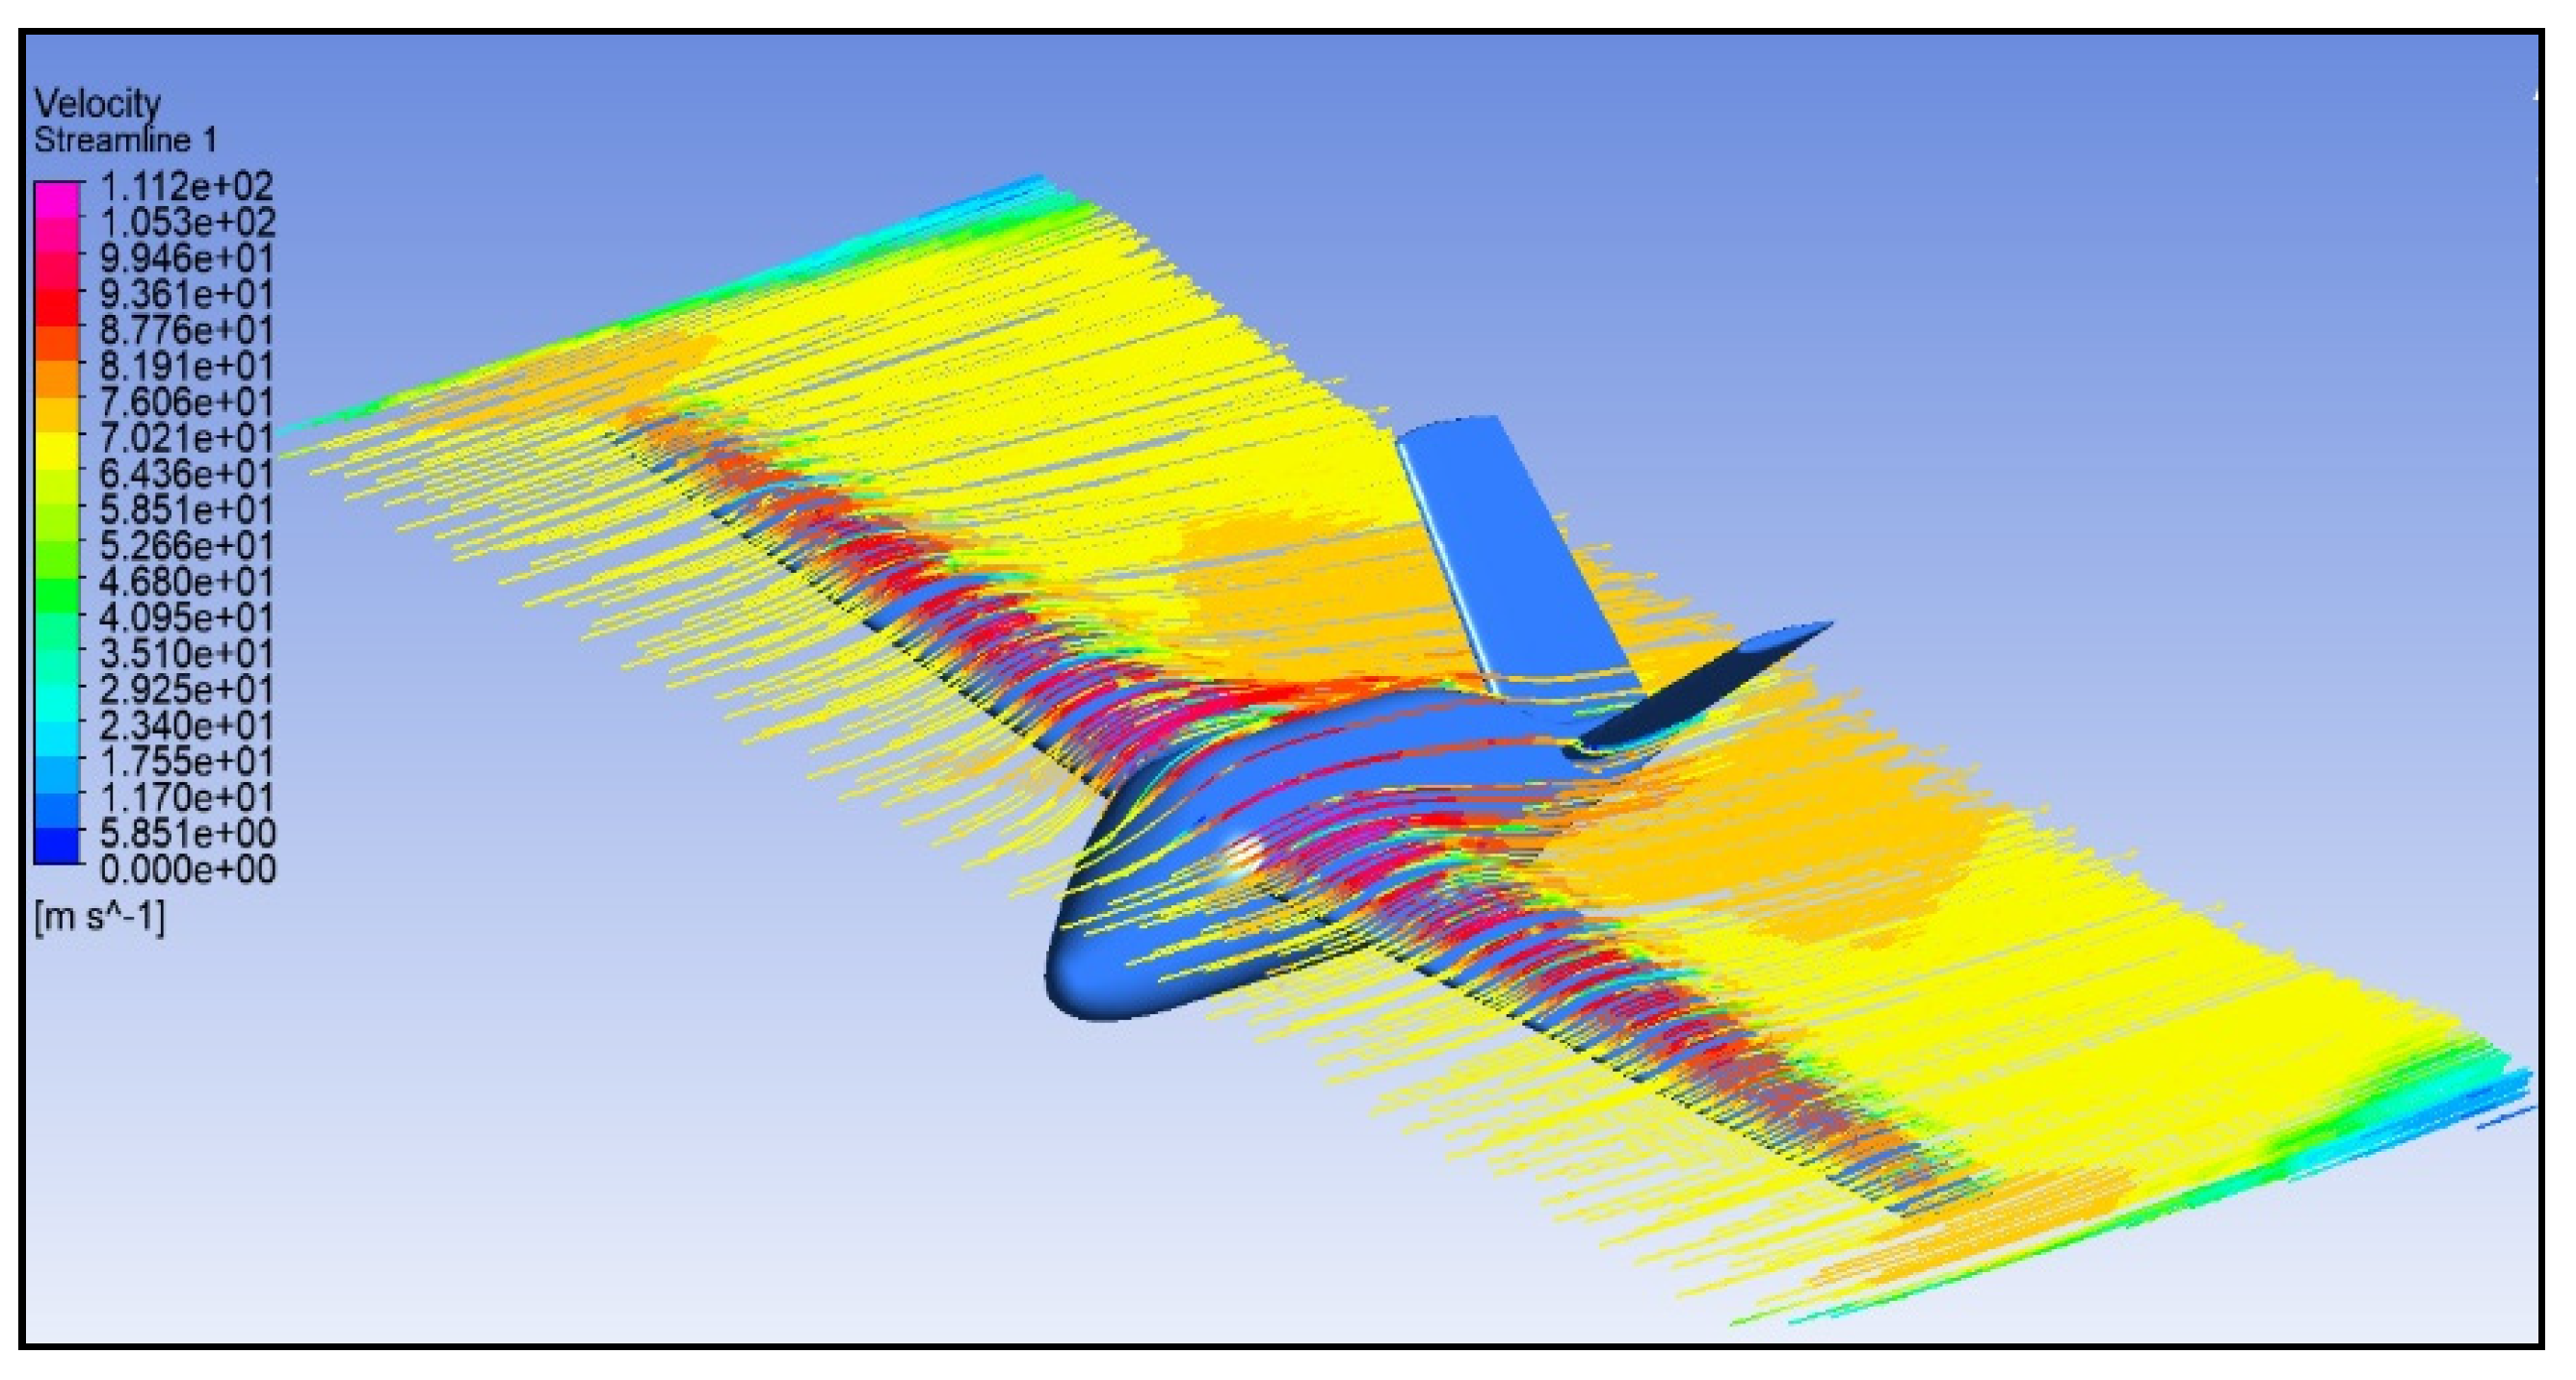
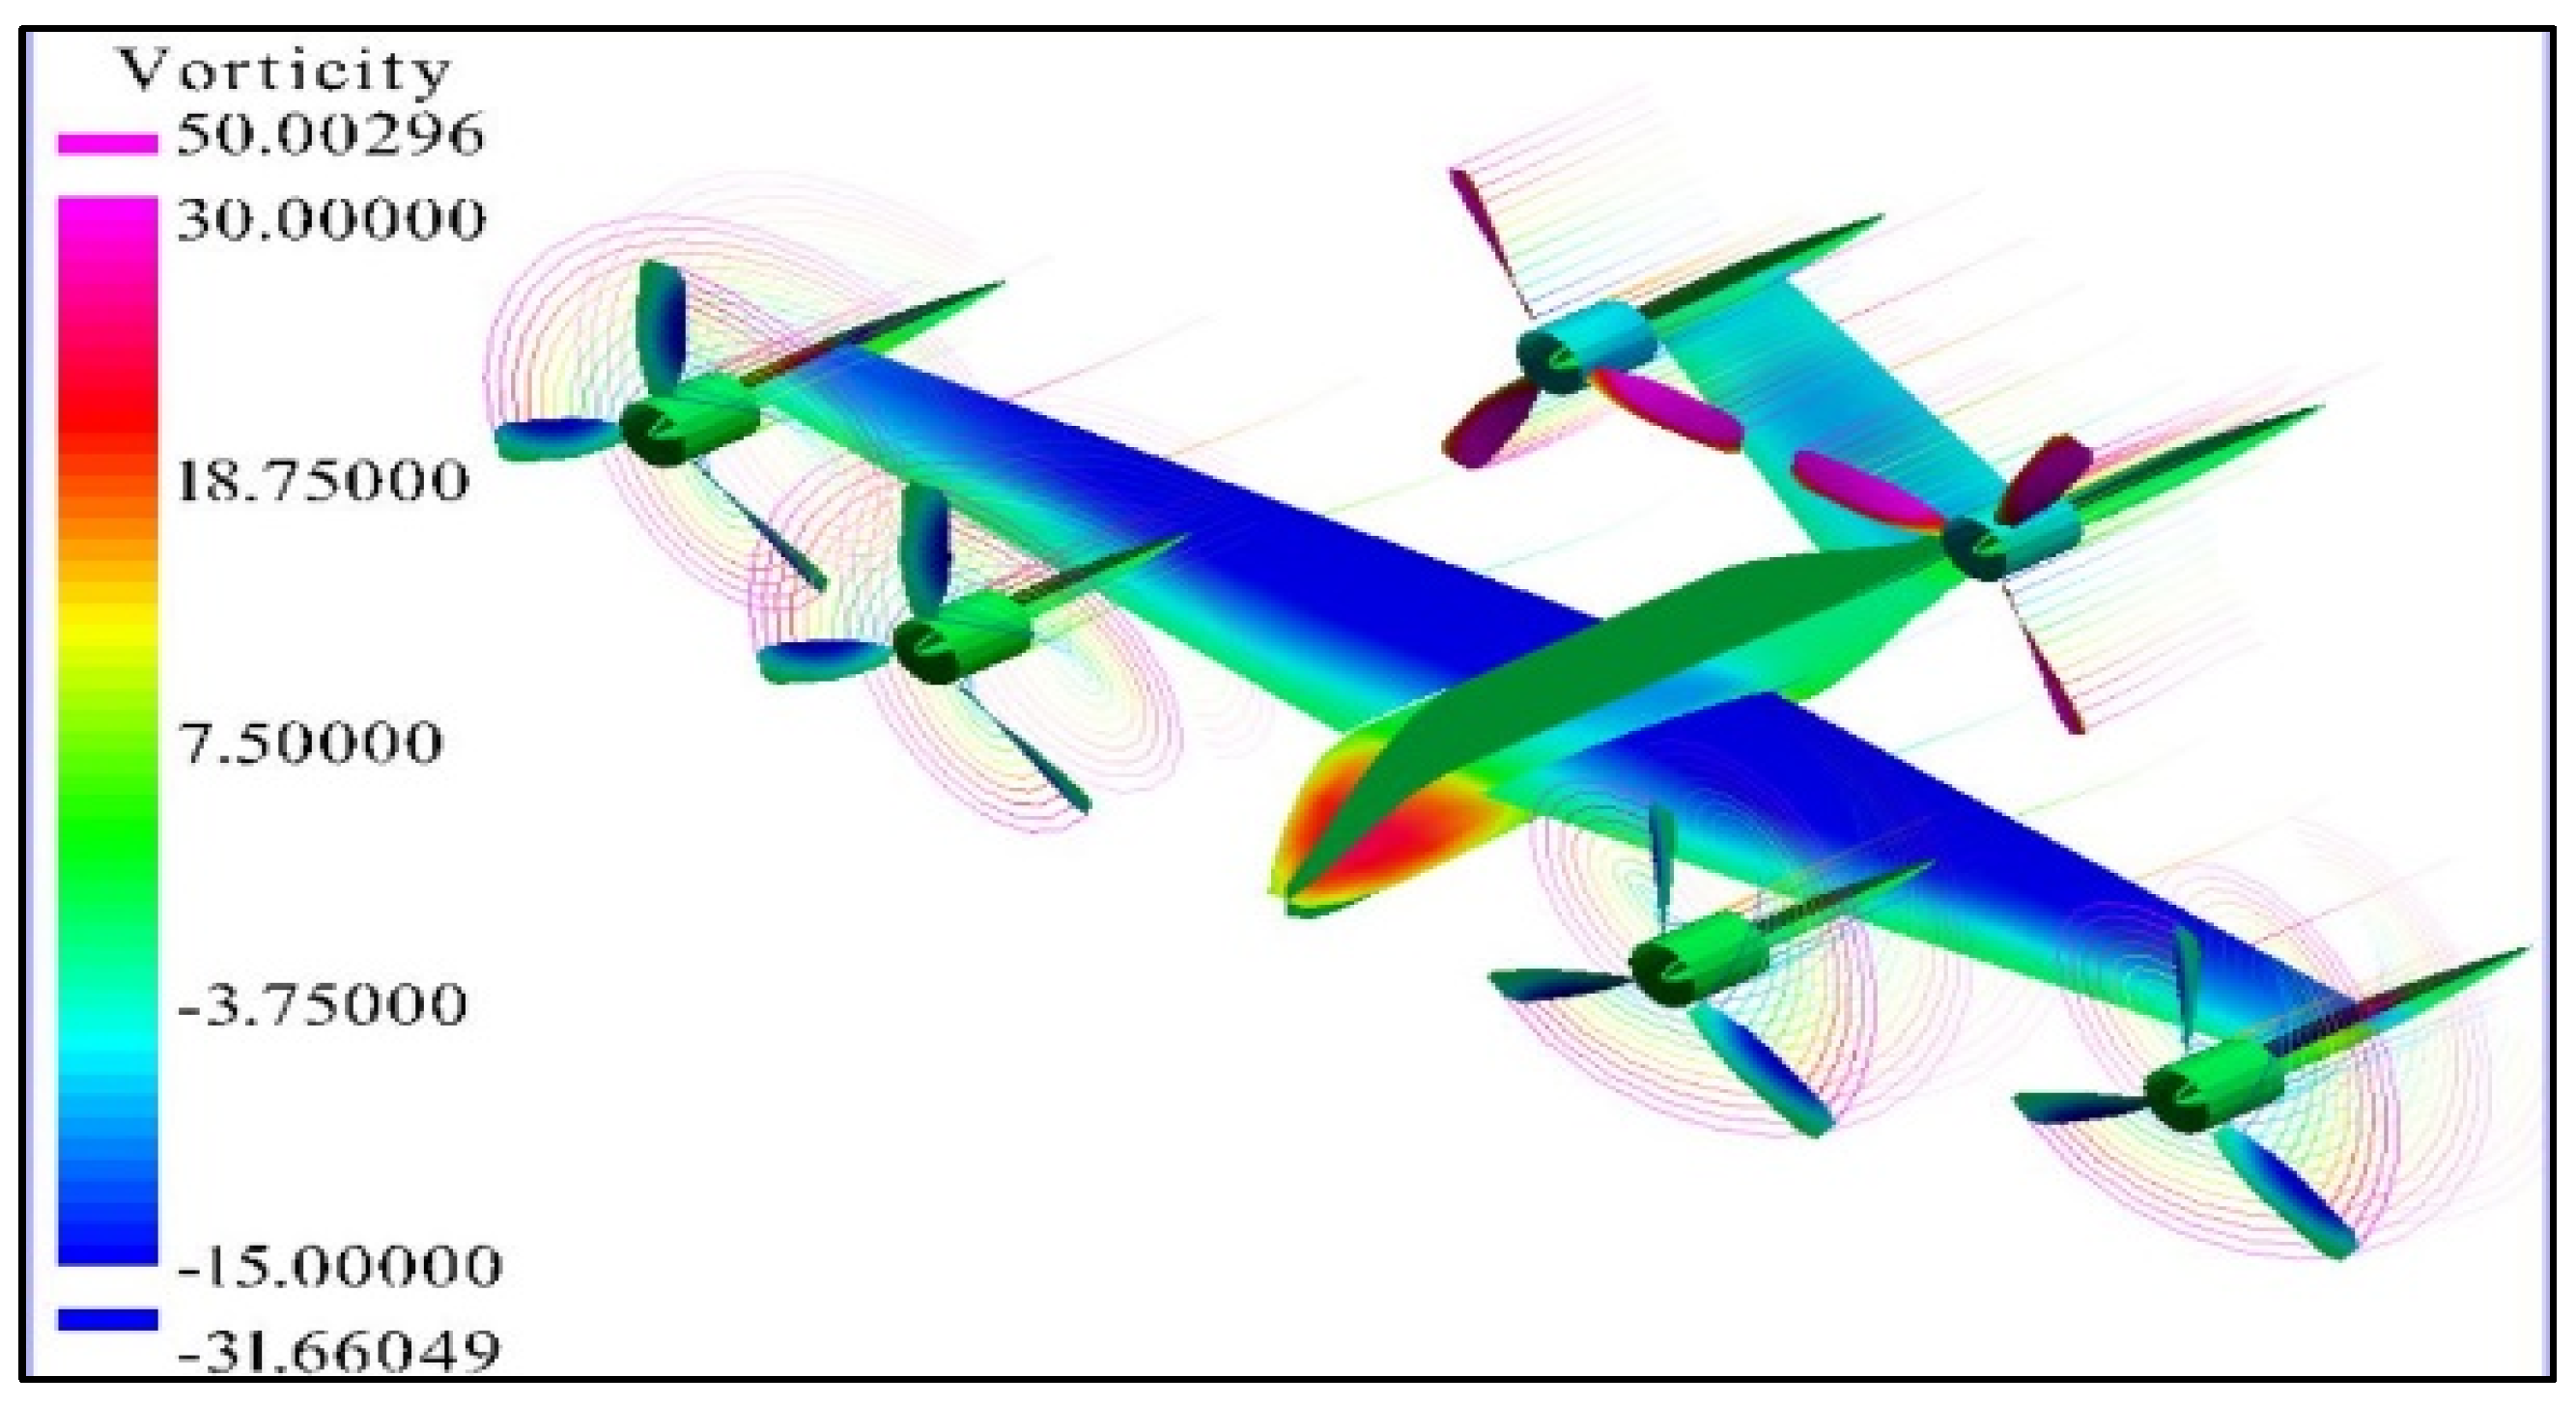
9.9. Flow Interactions
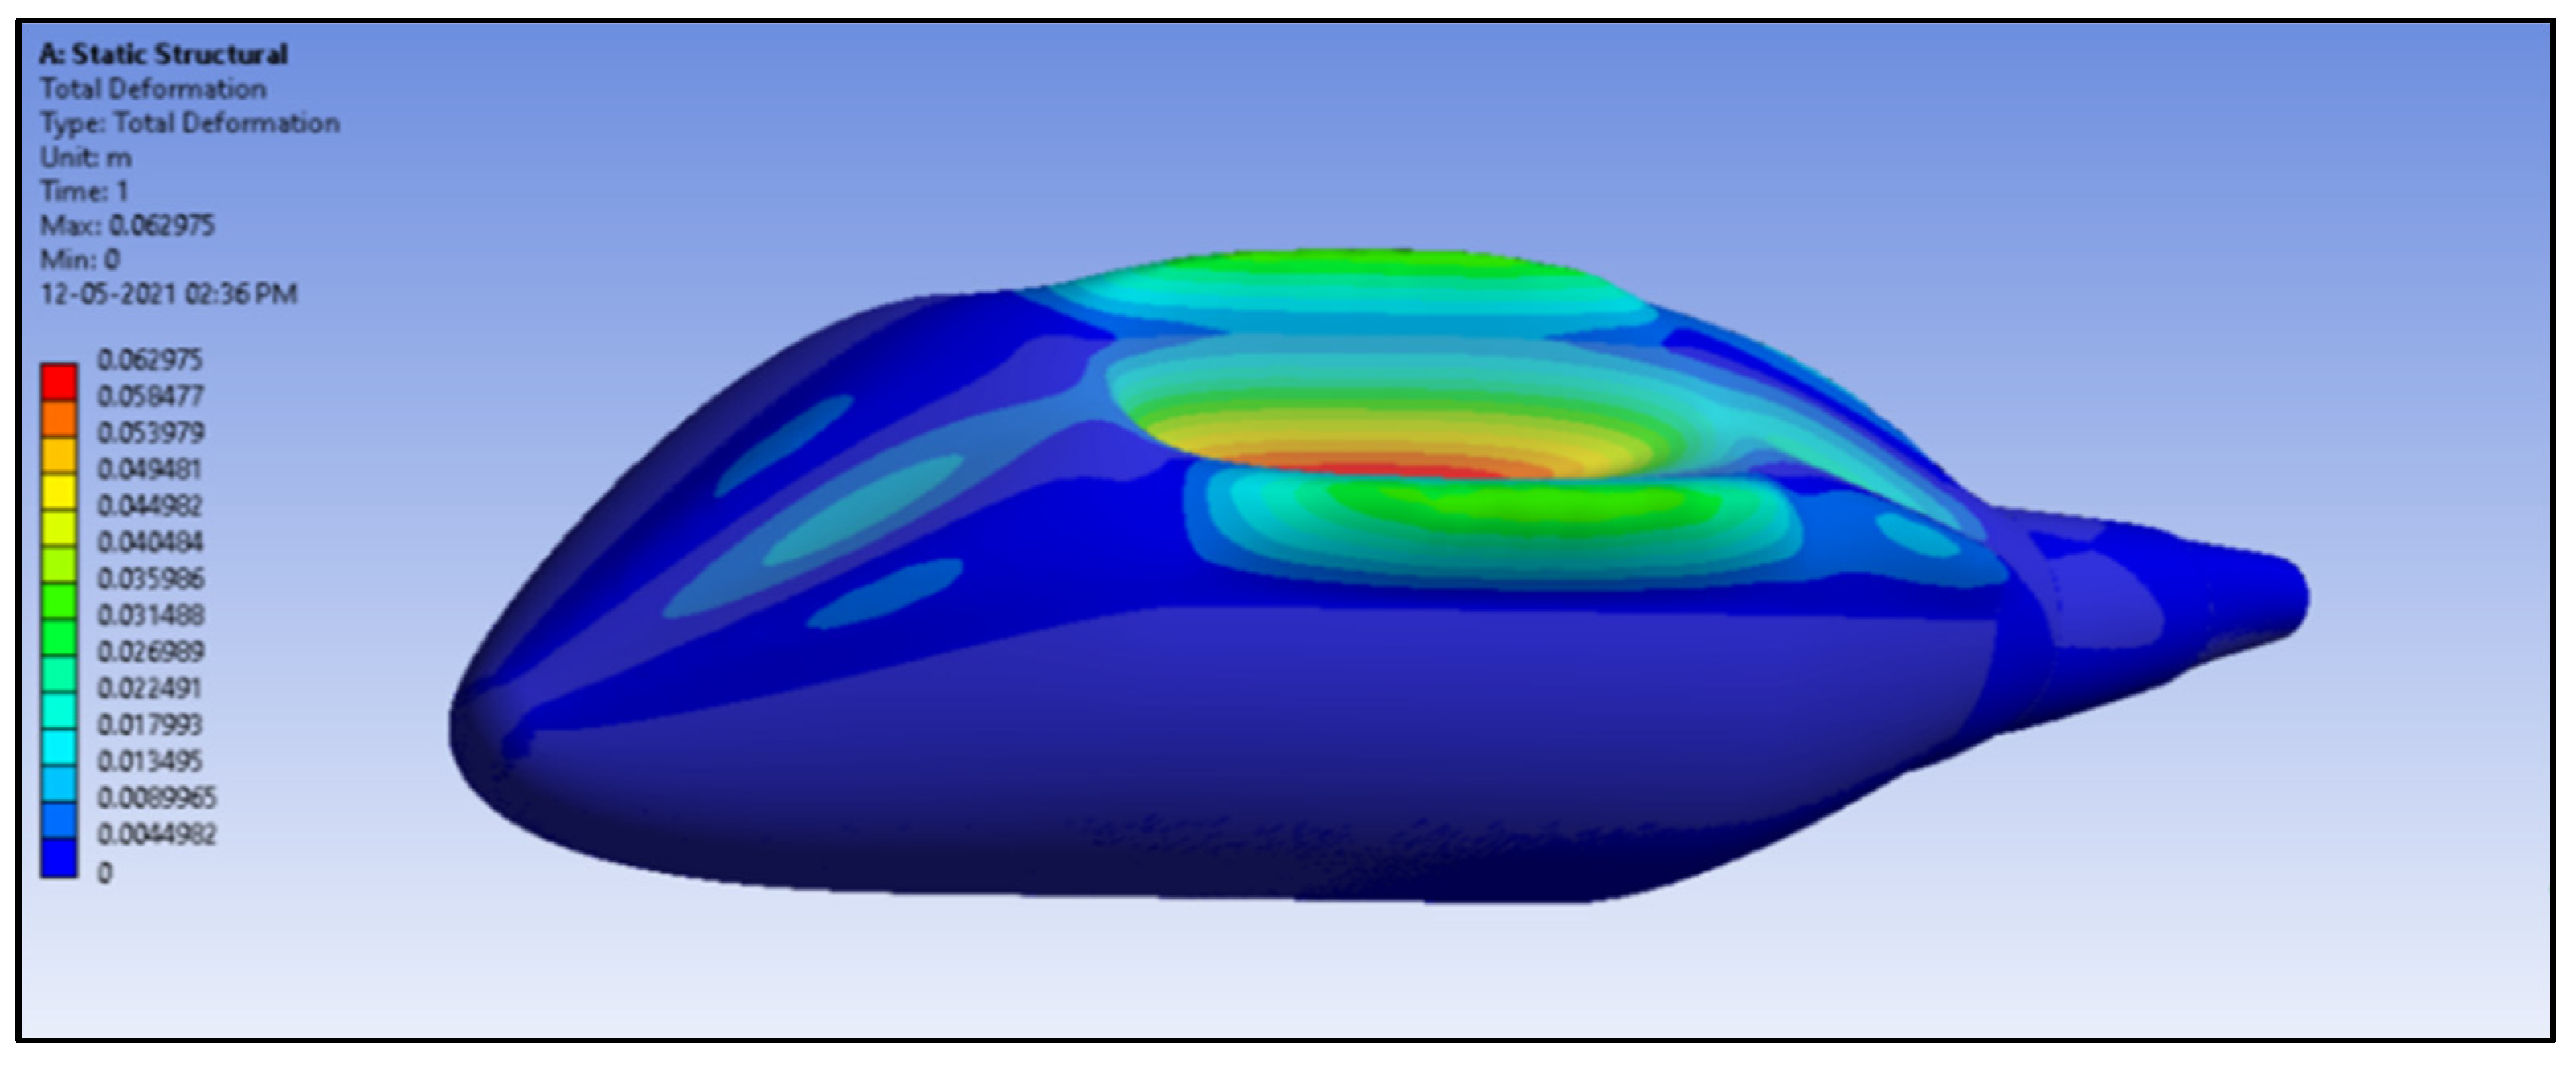
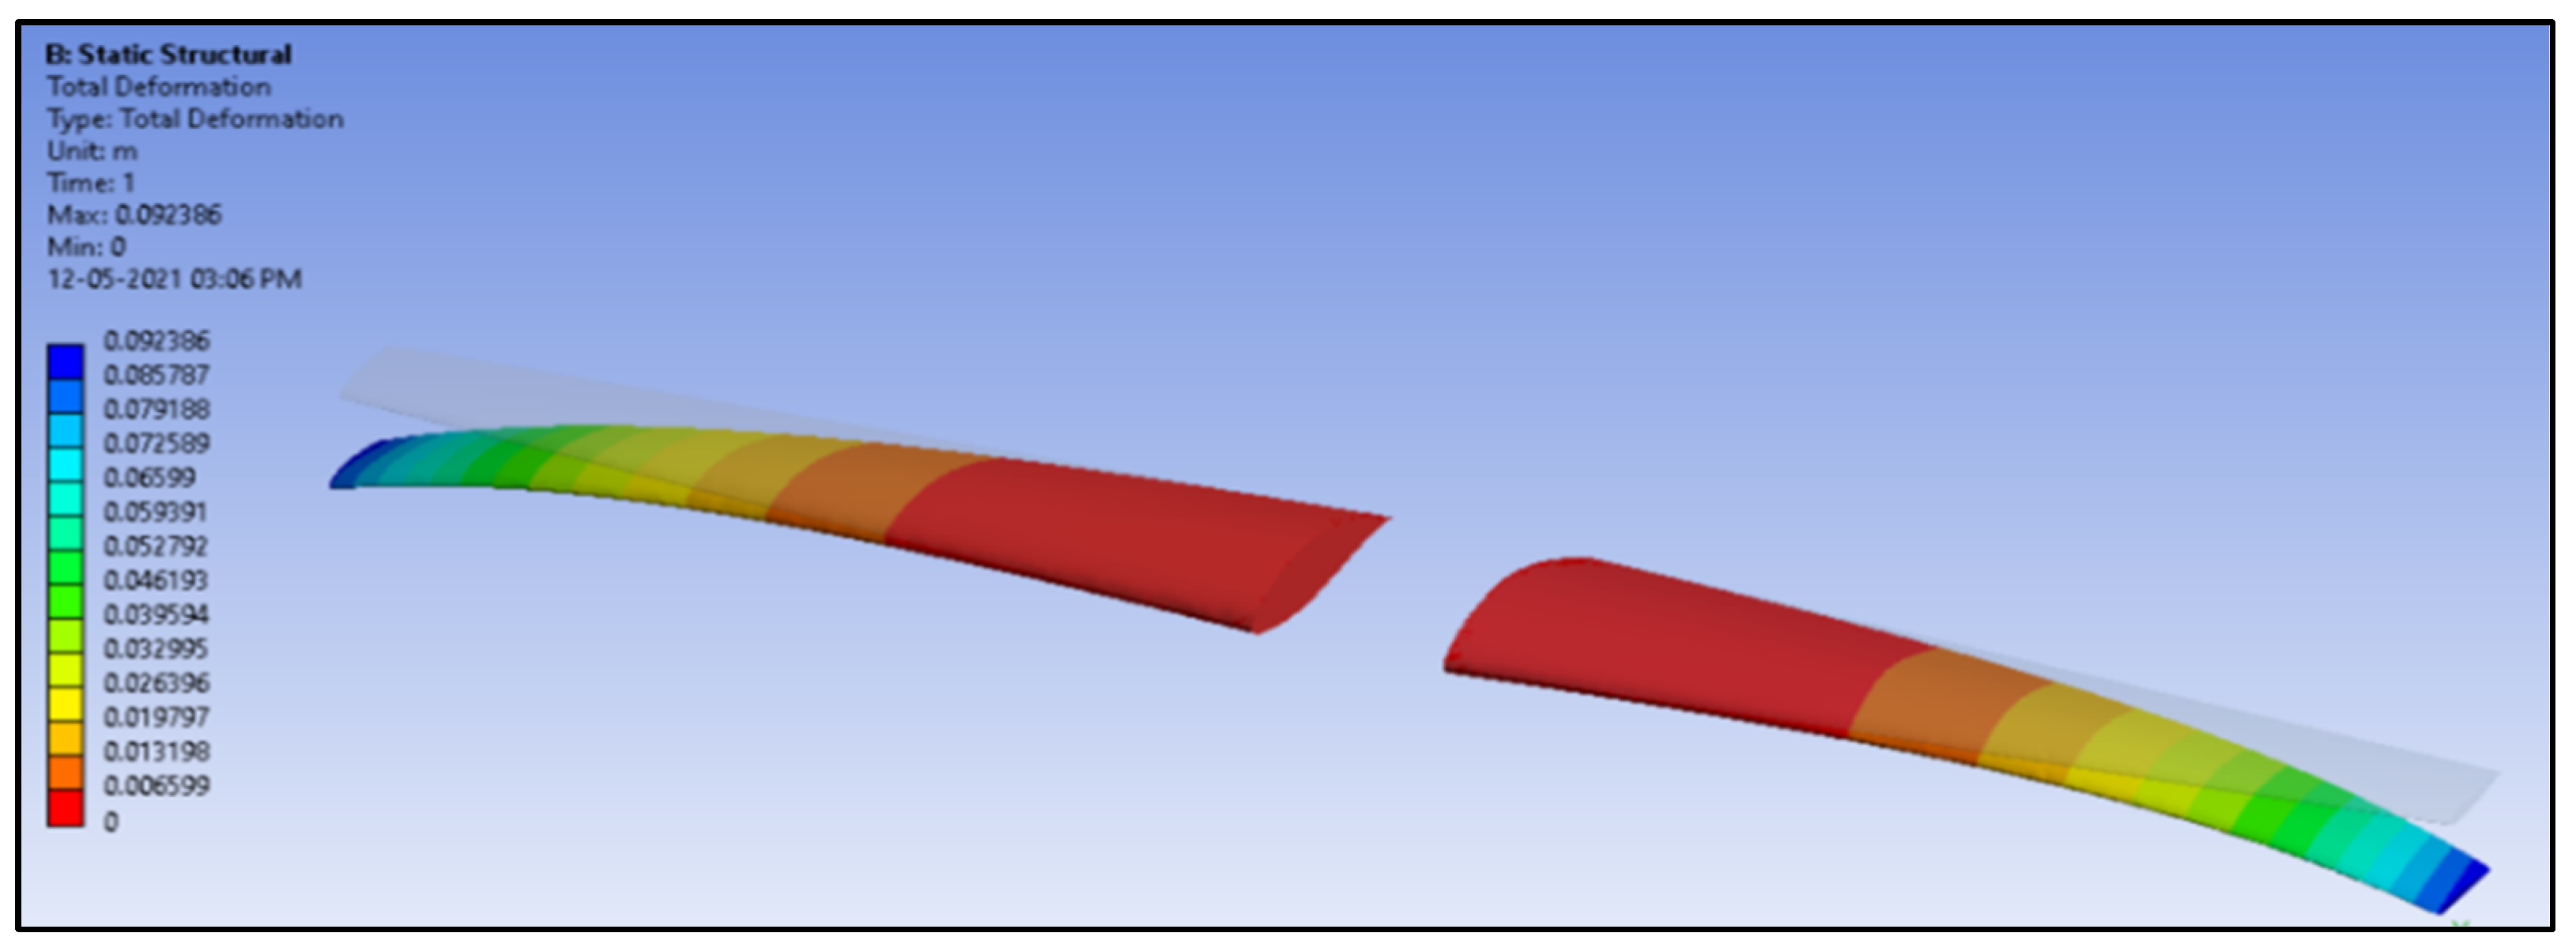
10. Structural Analysis
10.1. Structural Analysis of Fuselage and Wing Structural Members
10.2. Material Selection
11. Aircraft Performance
11.1. Vertical Take-Off Performance
- Vertical take-off: The aircraft carries out a vertical take-off from 0 to 80 metres. It has no horizontal velocity. The vertical thrust is the outcome of the six engines of the aircraft pointed upwards. The thrust produced elevates the aircraft in the hover up phase. The vertical speed is 2 m/s.
- Climb: The eVTOL aircraft transits to a state where the wings also start to produce lift. This is conducted by controlling the RPM of the tail rotors to provide enough downforce of the tail to increase the angle of attack of the aircraft. From calculations, it was assumed that the wing will produce 75% of the lift required during the climb. The rest is produced by the propellers. It is also important to note that the propellers also overcome both the drag and weight during the climb. The climb phase takes place between the altitudes of 80 m to 2000 m. The rate of climb of the aircraft is 2 m/s.
- Cruise: The eVTOL aircraft completely transits to a state where all lift required is produced by only the wing. The propellers produce the thrust required for forward flight. The cruise phase takes place at an altitude of 2000 m for a range of 496.56 km. The mean horizontal speed was taken as the cruise speed, which is 69 m/s.
- Descent: The descent phase takes place from an altitude of 2000 m to 80 m at a descent rate of 2 m/s. The mean horizontal velocity is 21 m/s. This takes place for a horizontal distance of 1.72 km.
- Hover down: The hover down phase takes place from an altitude of 80 to 0 m. The hover down speed is 2 m/s.
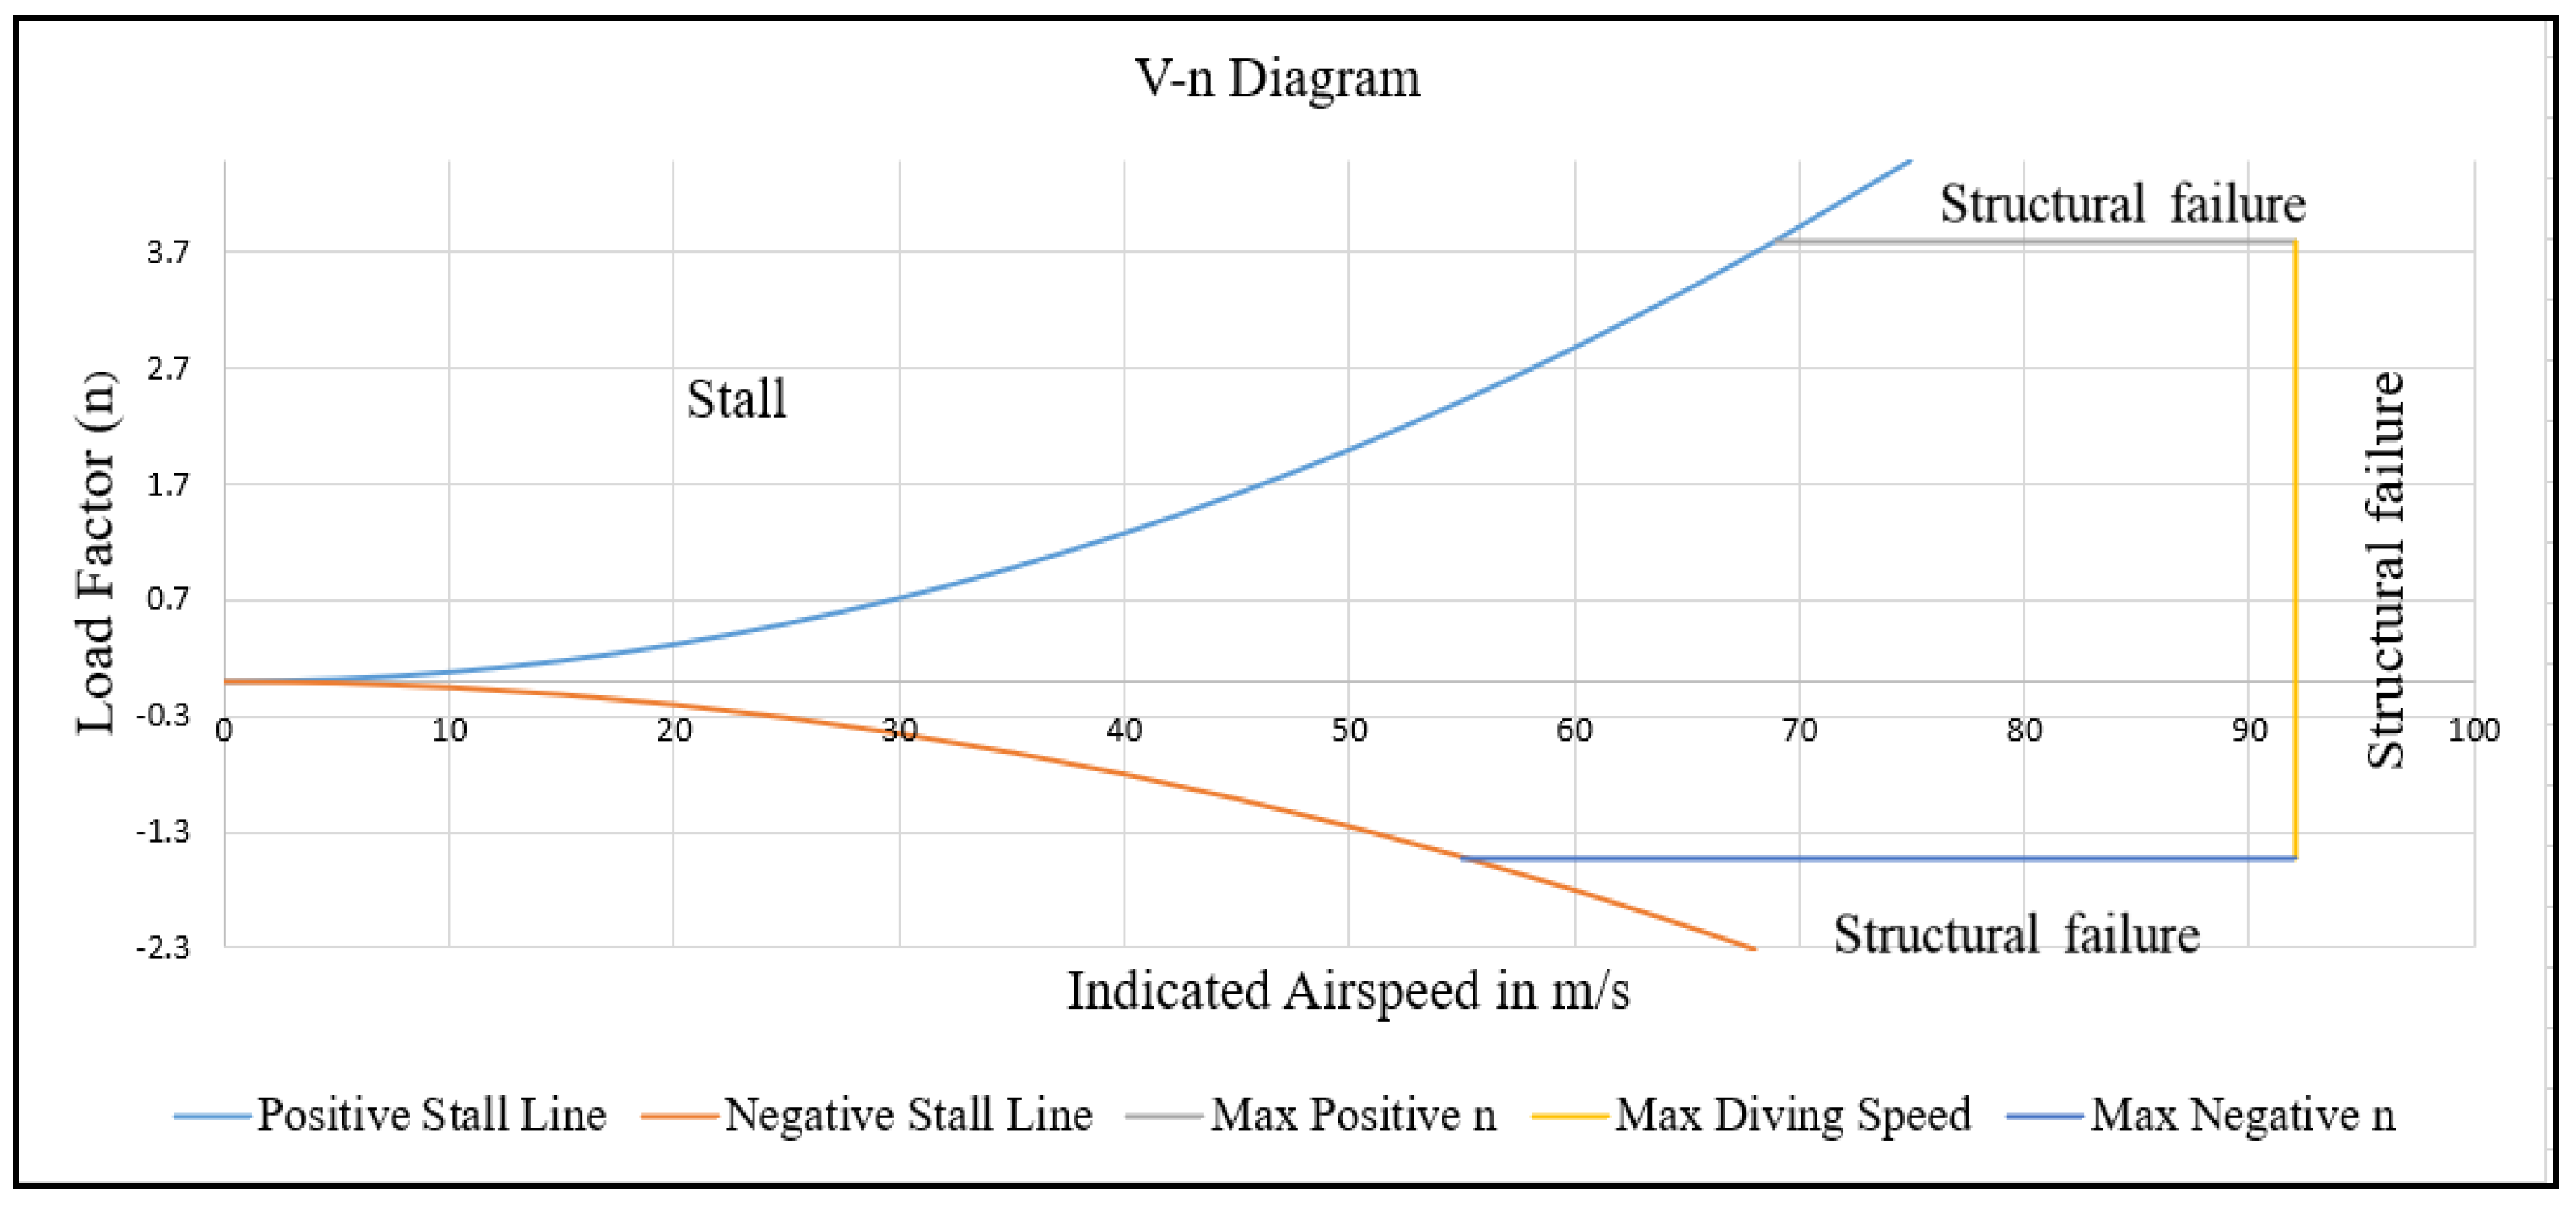
11.2. V-n Diagram
- Stall velocity, 35 m/s;
- Manoeuvring velocity, 68 m/s;
- Negative manoeuvring velocity, 55 m/s;
- Cruise velocity, 69 m/s;
- Maximum load factor n, +3.8;
- Maximum negative load factor n, −1.52.
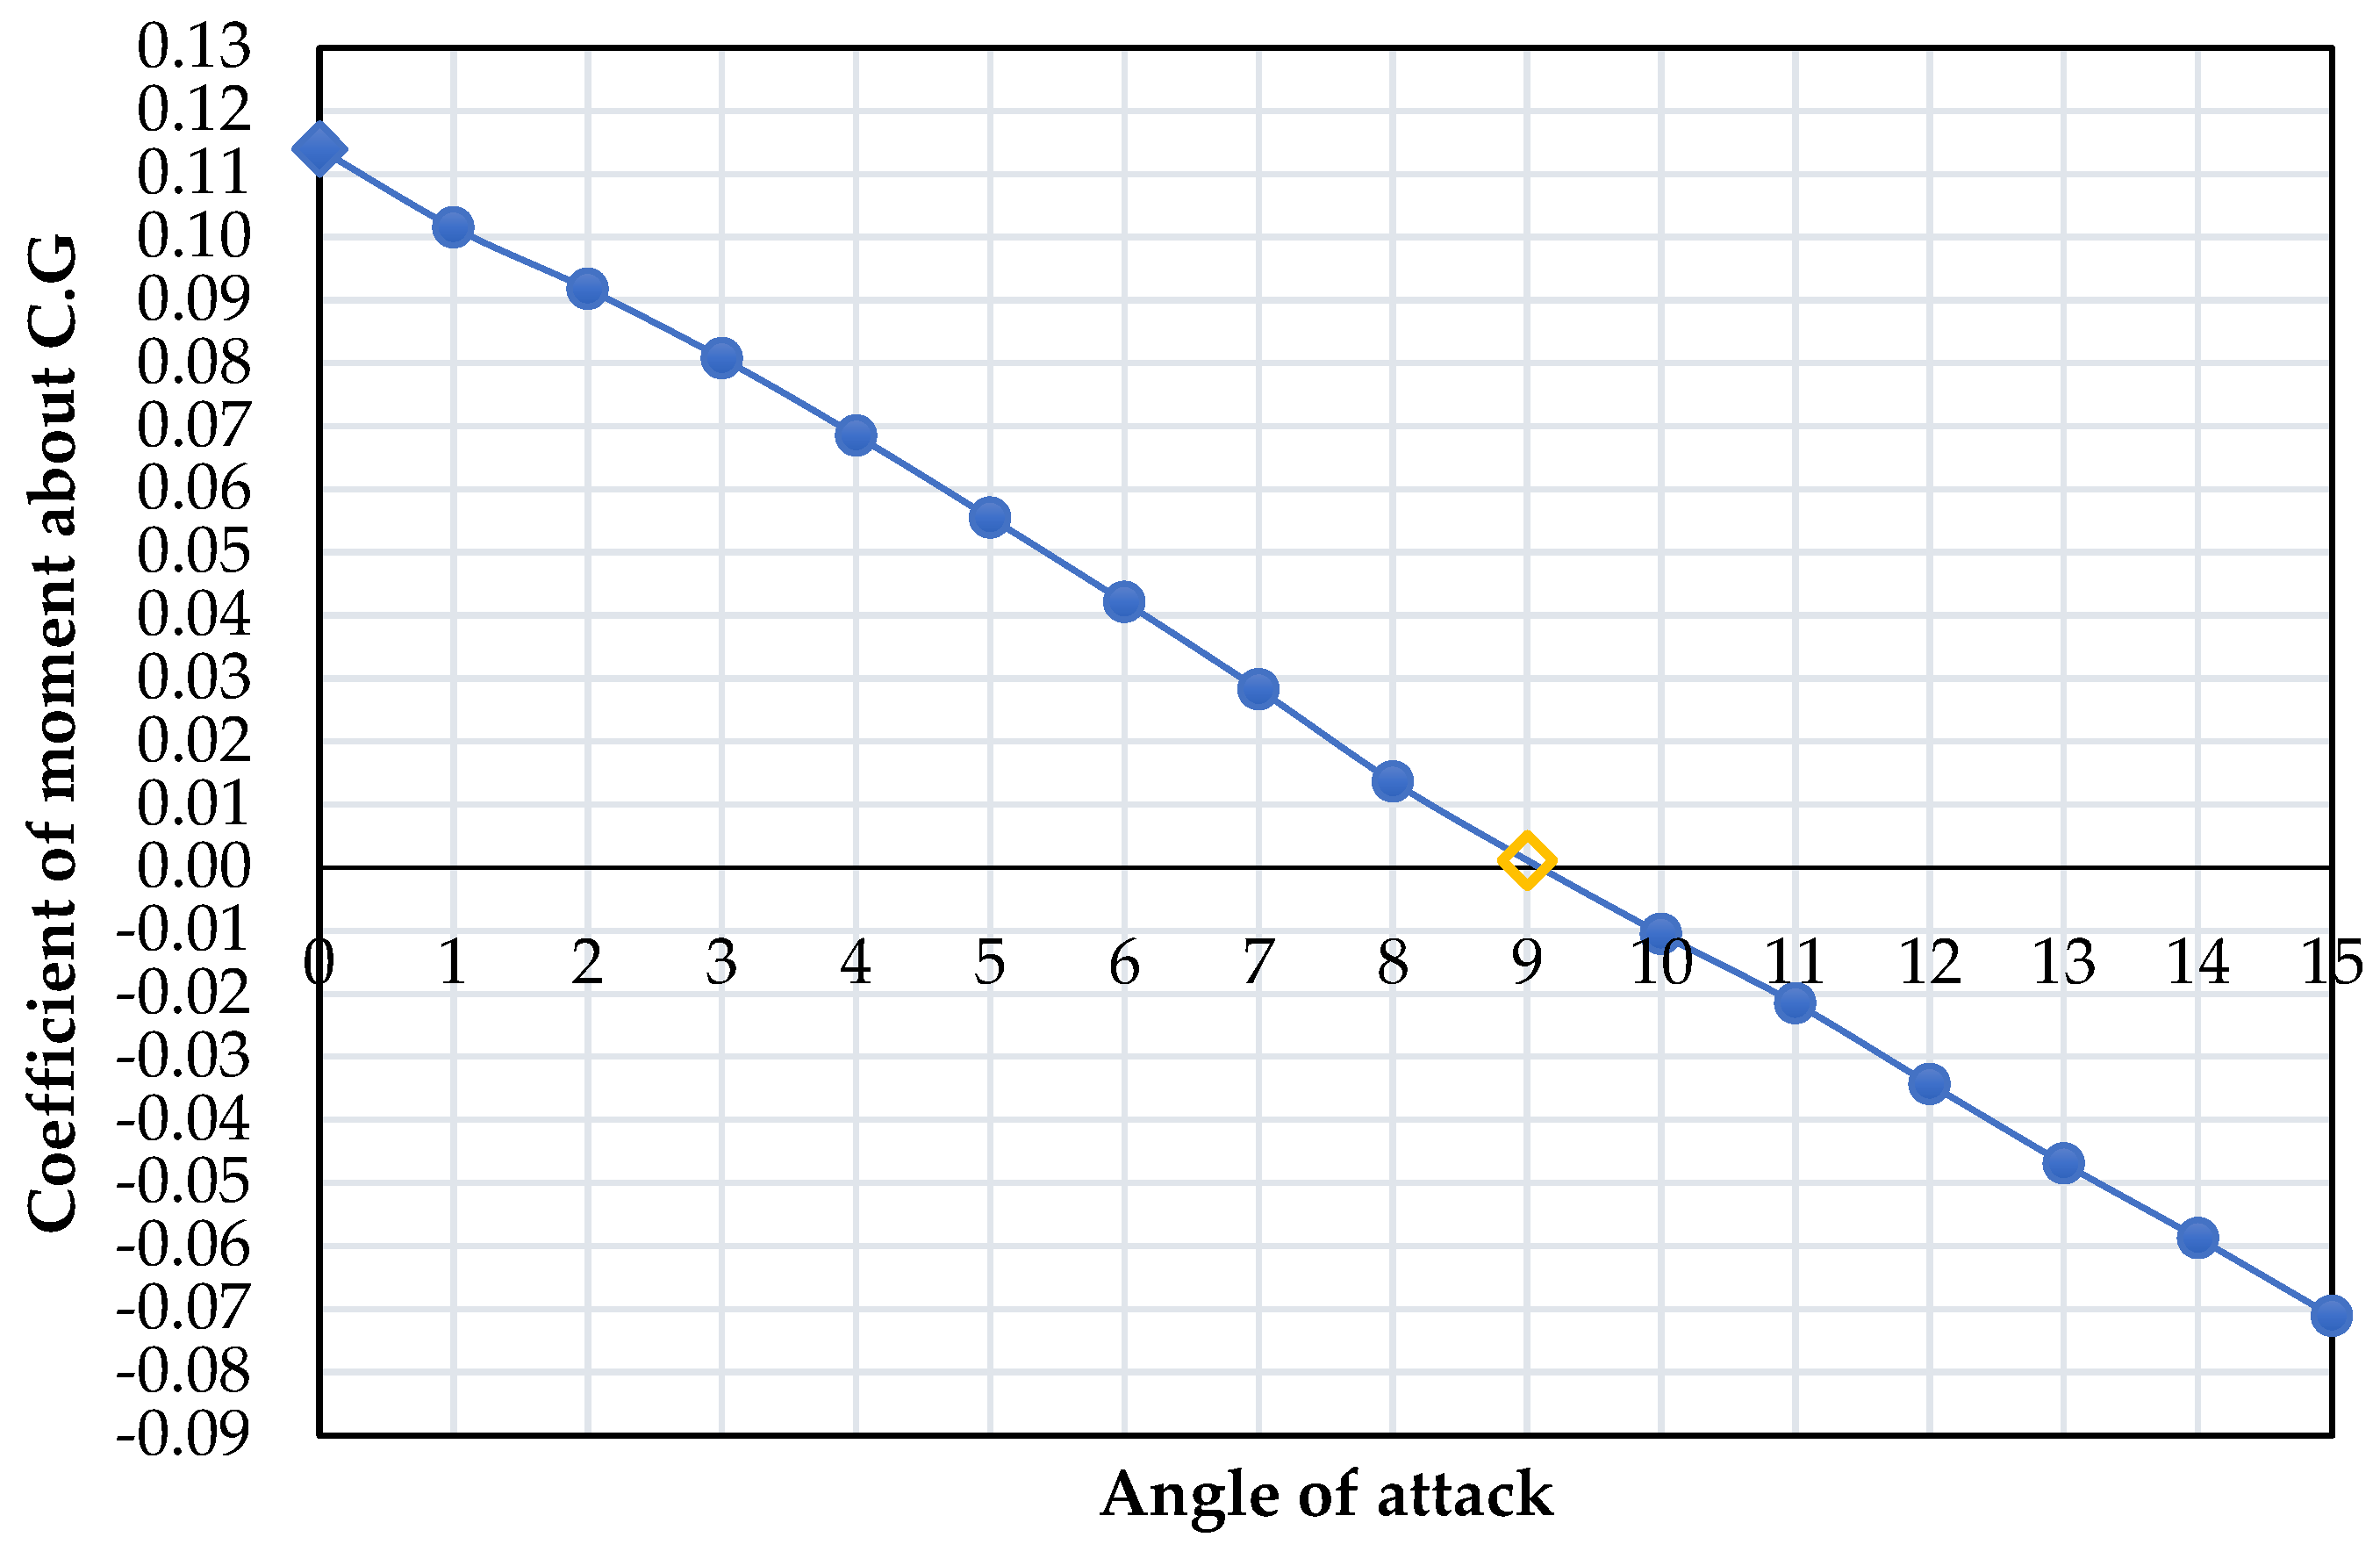
12. Aircraft Stability and Control
12.1. Longitudinal Static Stability
12.2. Lateral-Directional Static Stability
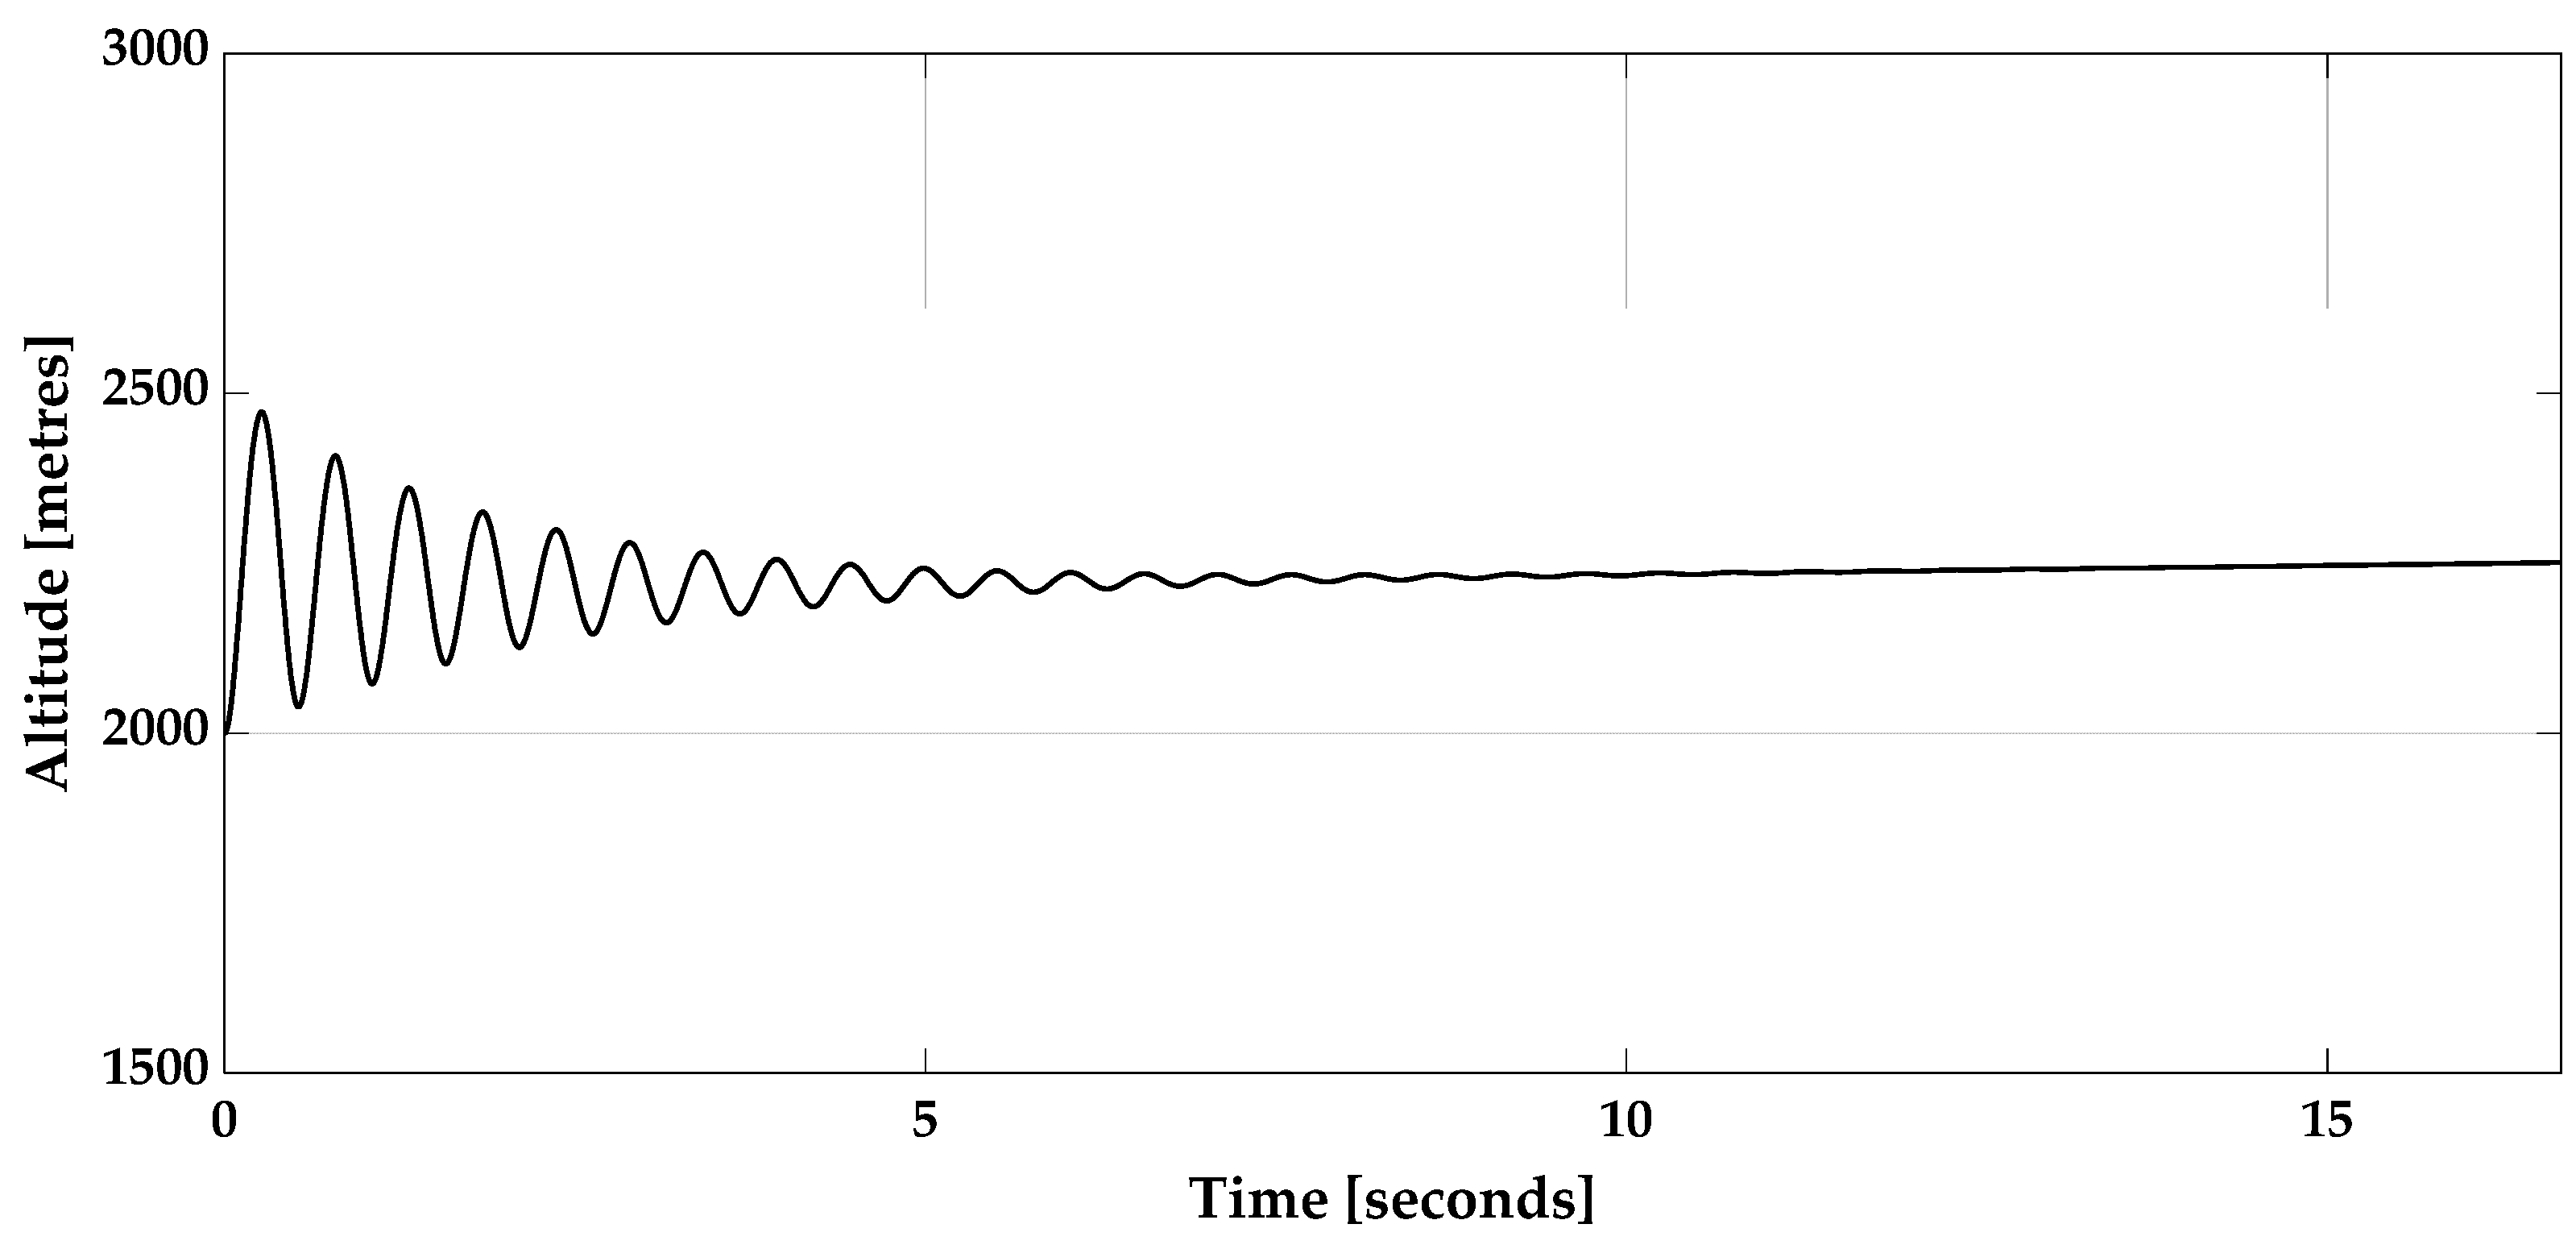
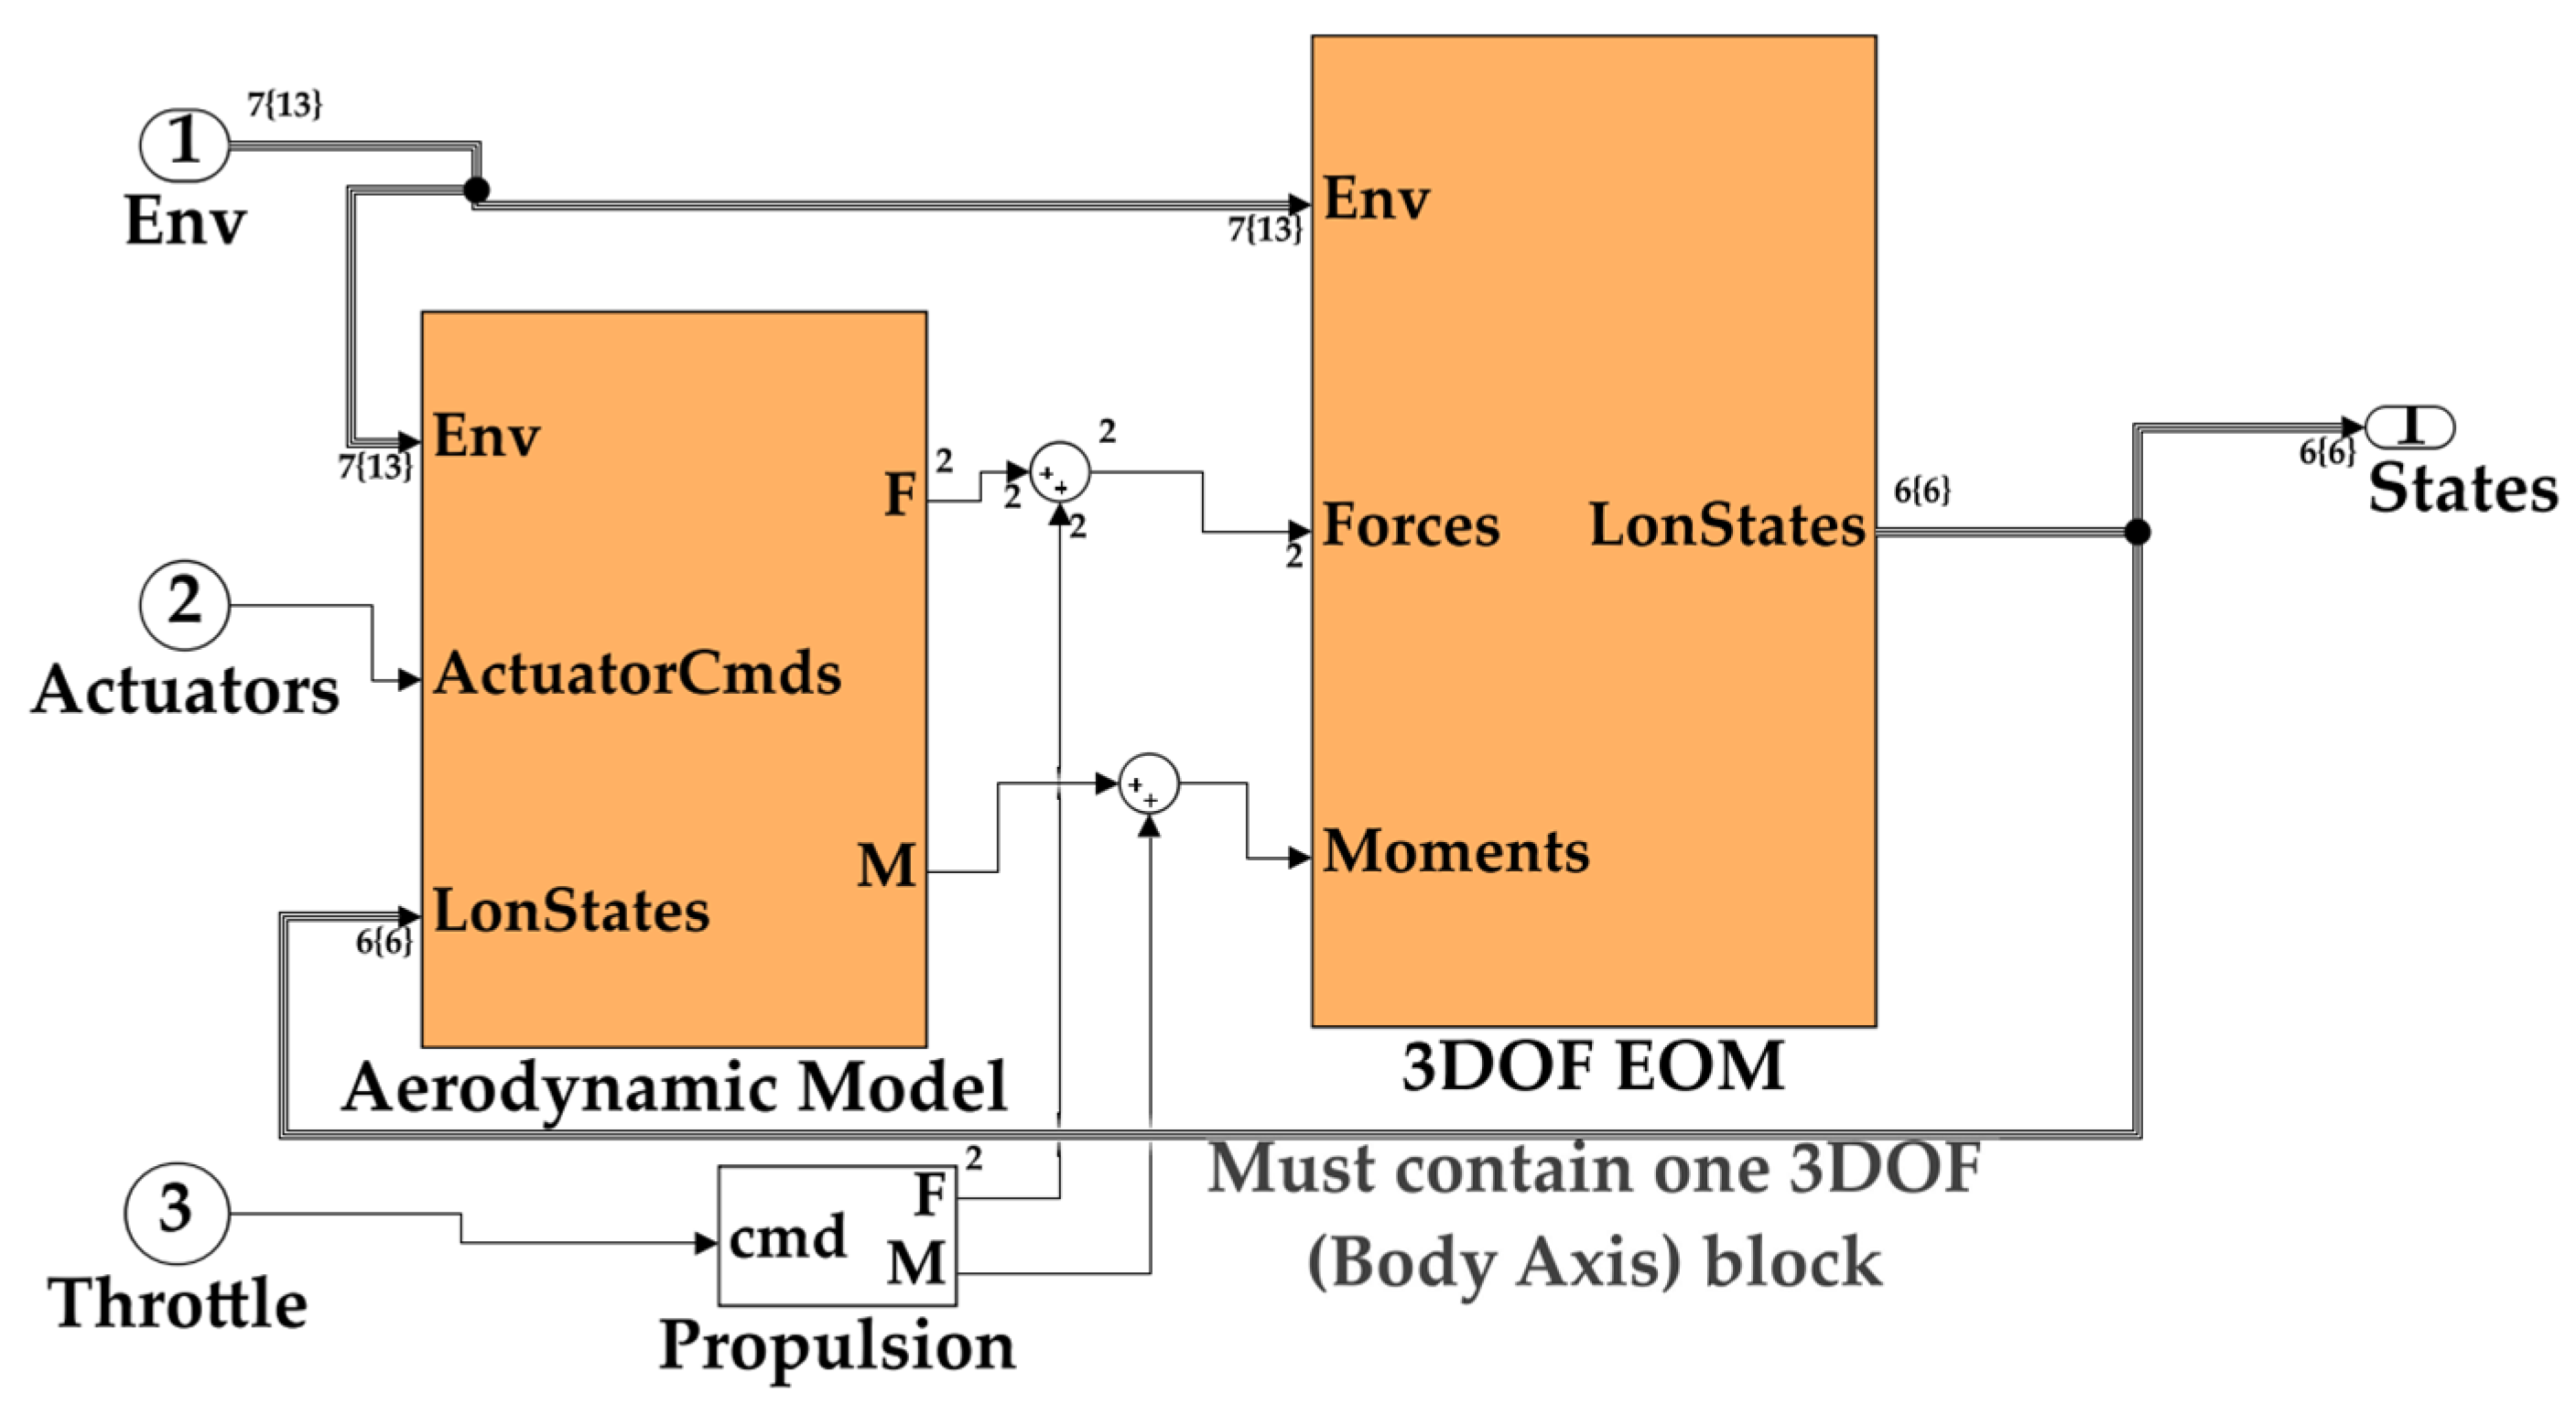
12.3. Dynamic Stability
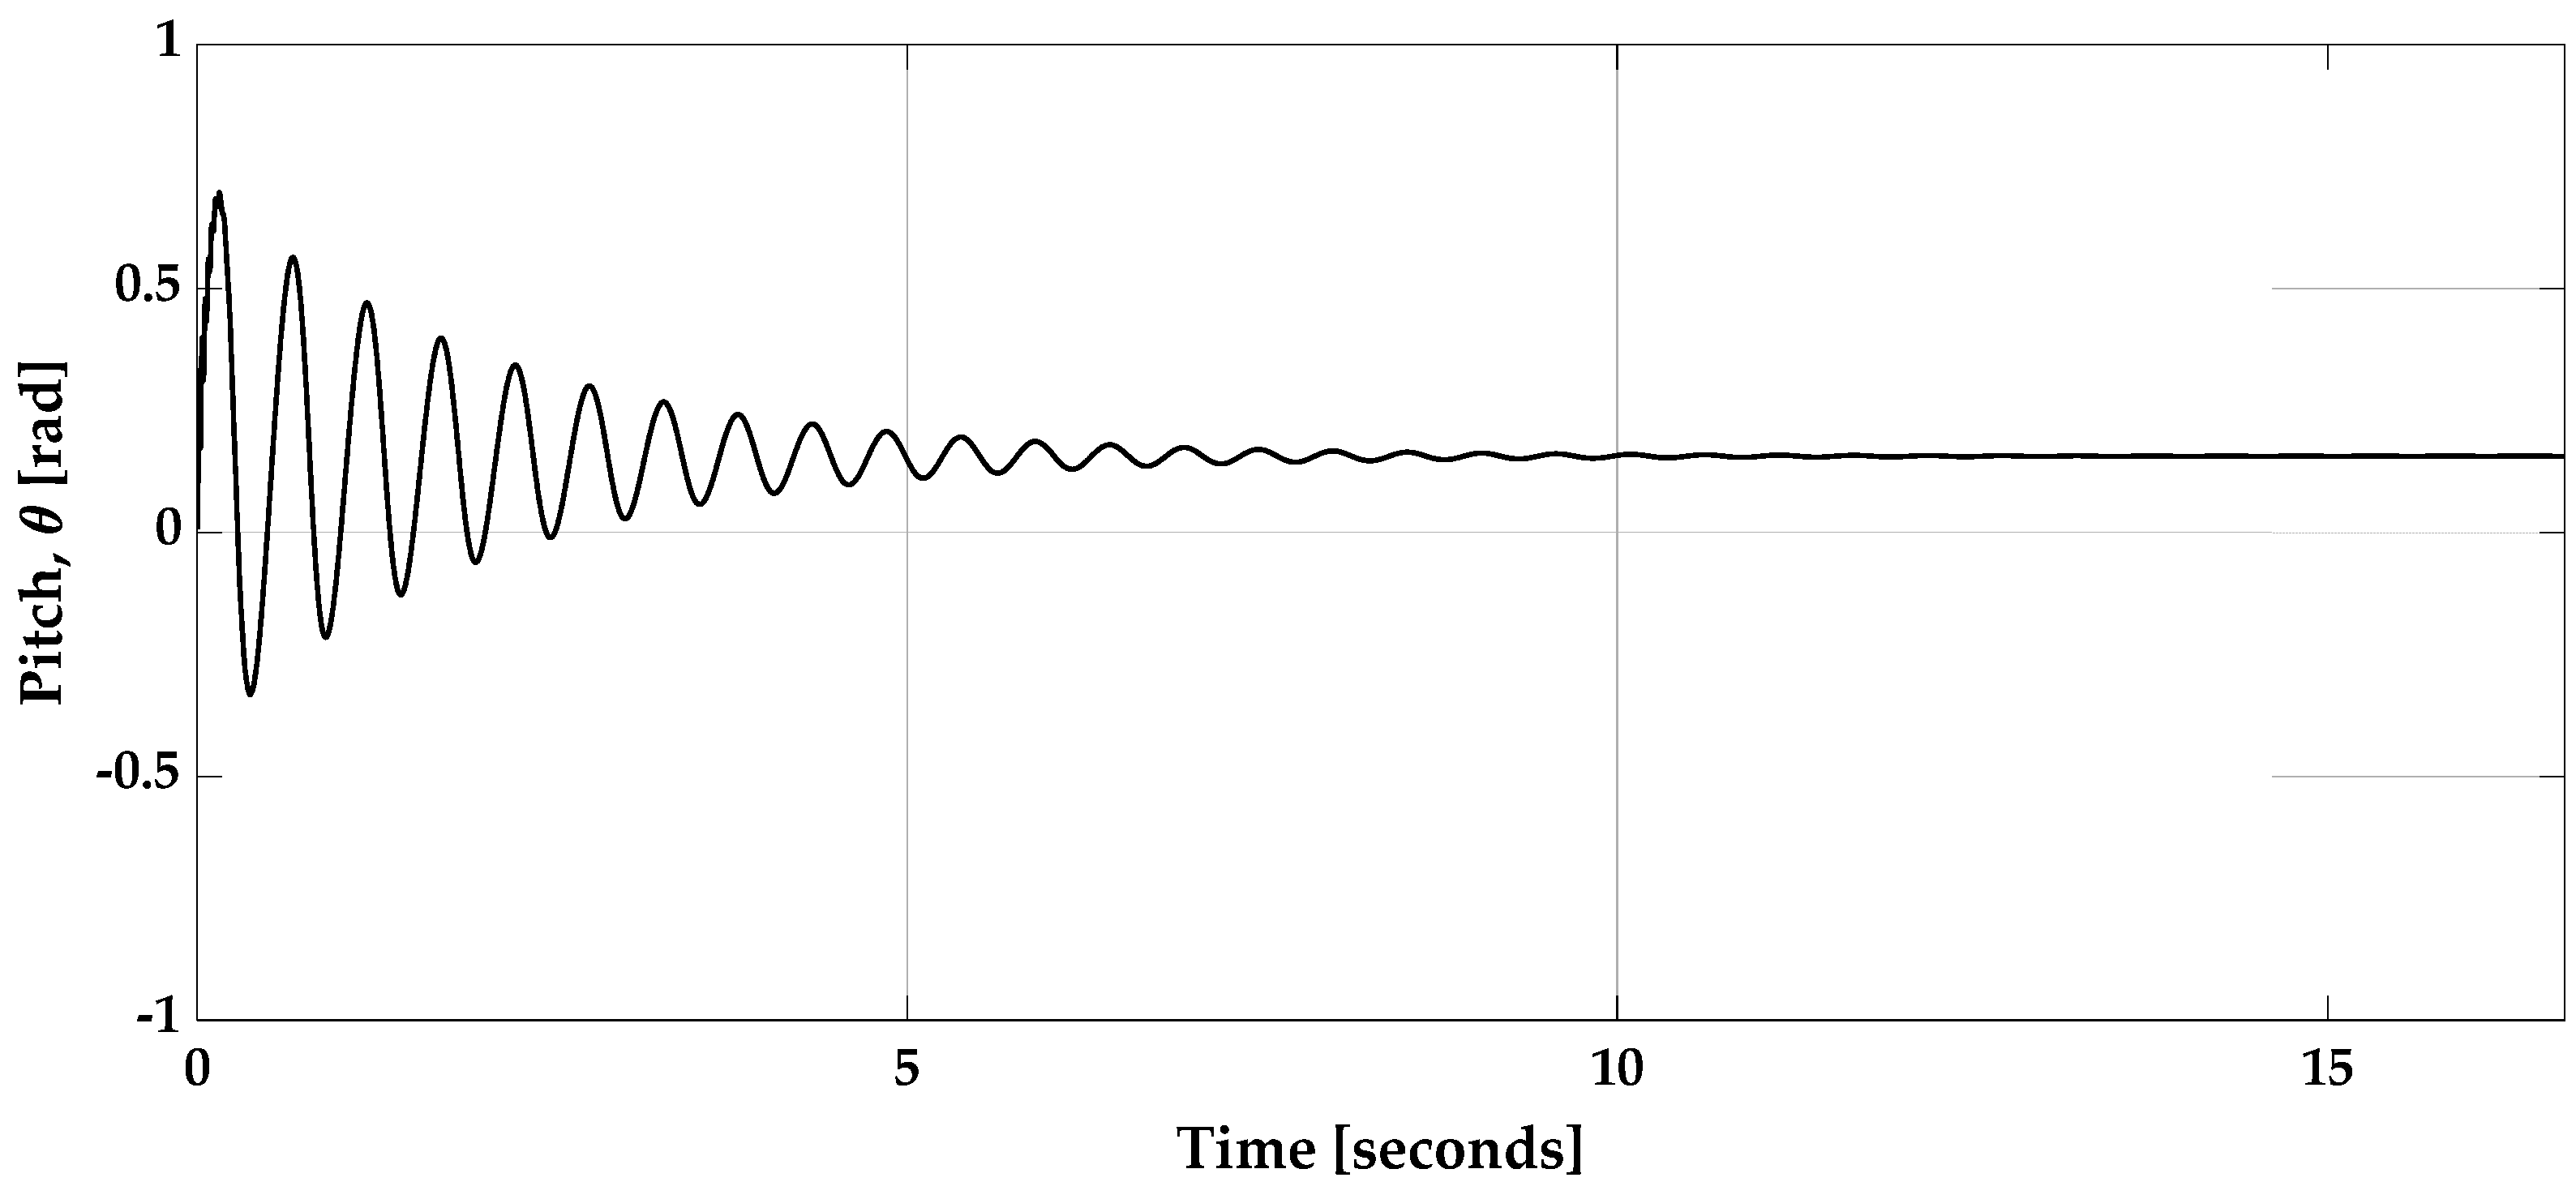
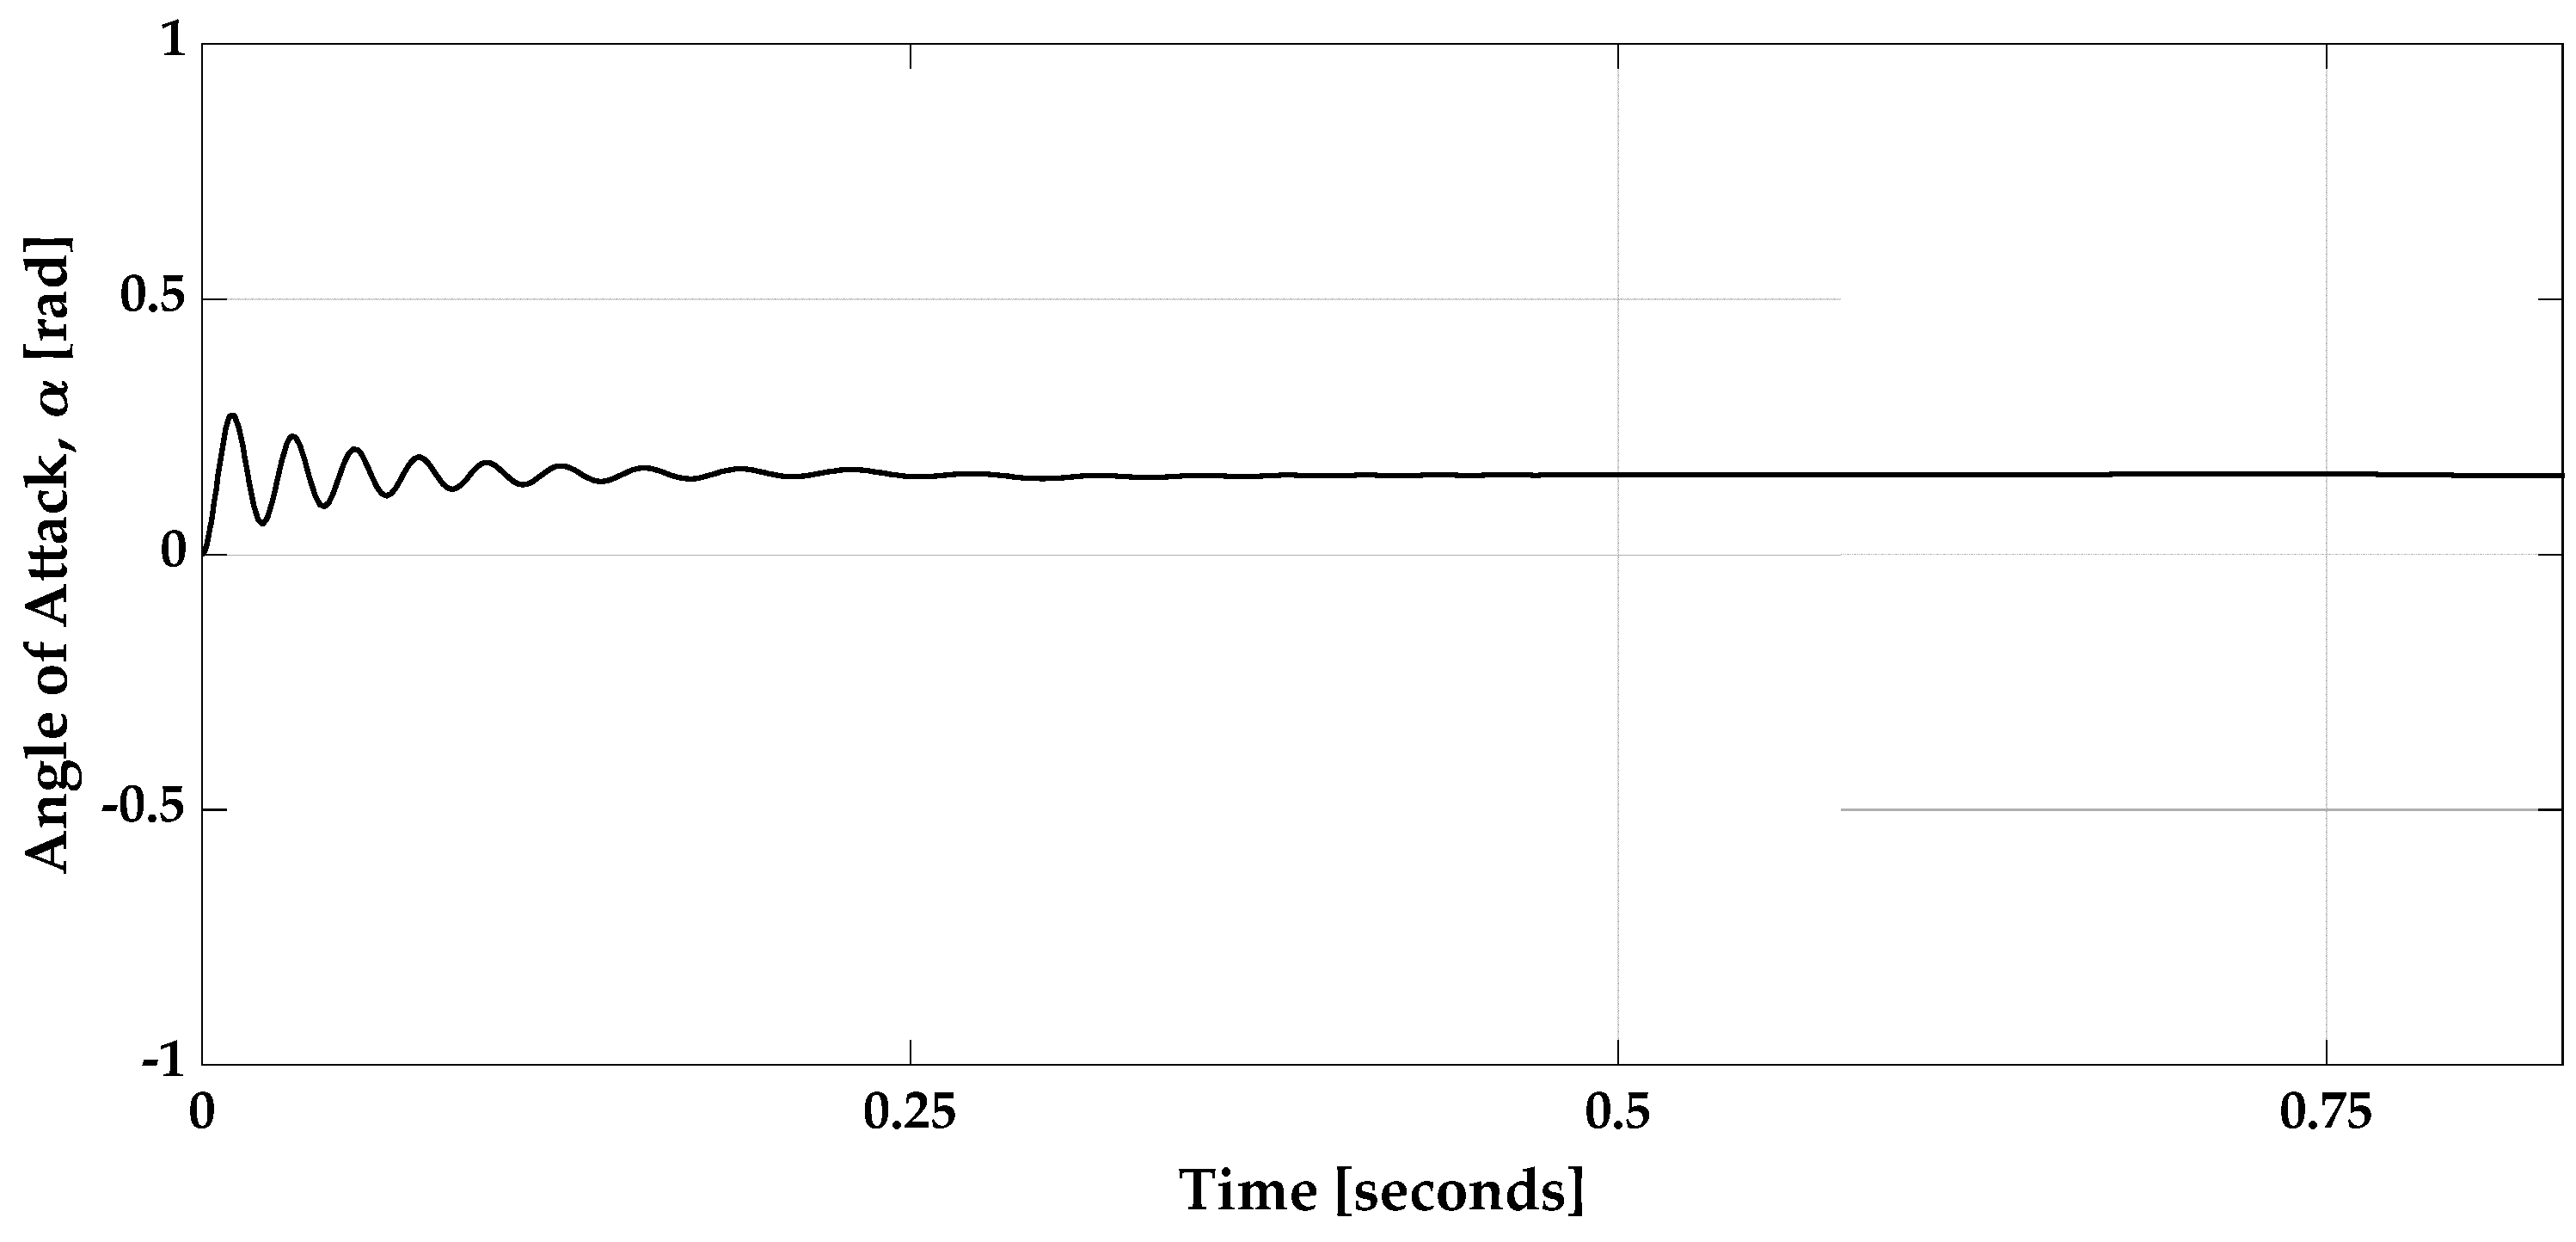
12.4. Dynamic Simulations
13. Cost Estimation and Technological Forecast
13.1. Cost Estimation
13.1.1. Cost Estimation Using Modified RAND DAPCA IV Model
13.1.2. Cost Comparison with Existing eVTOL
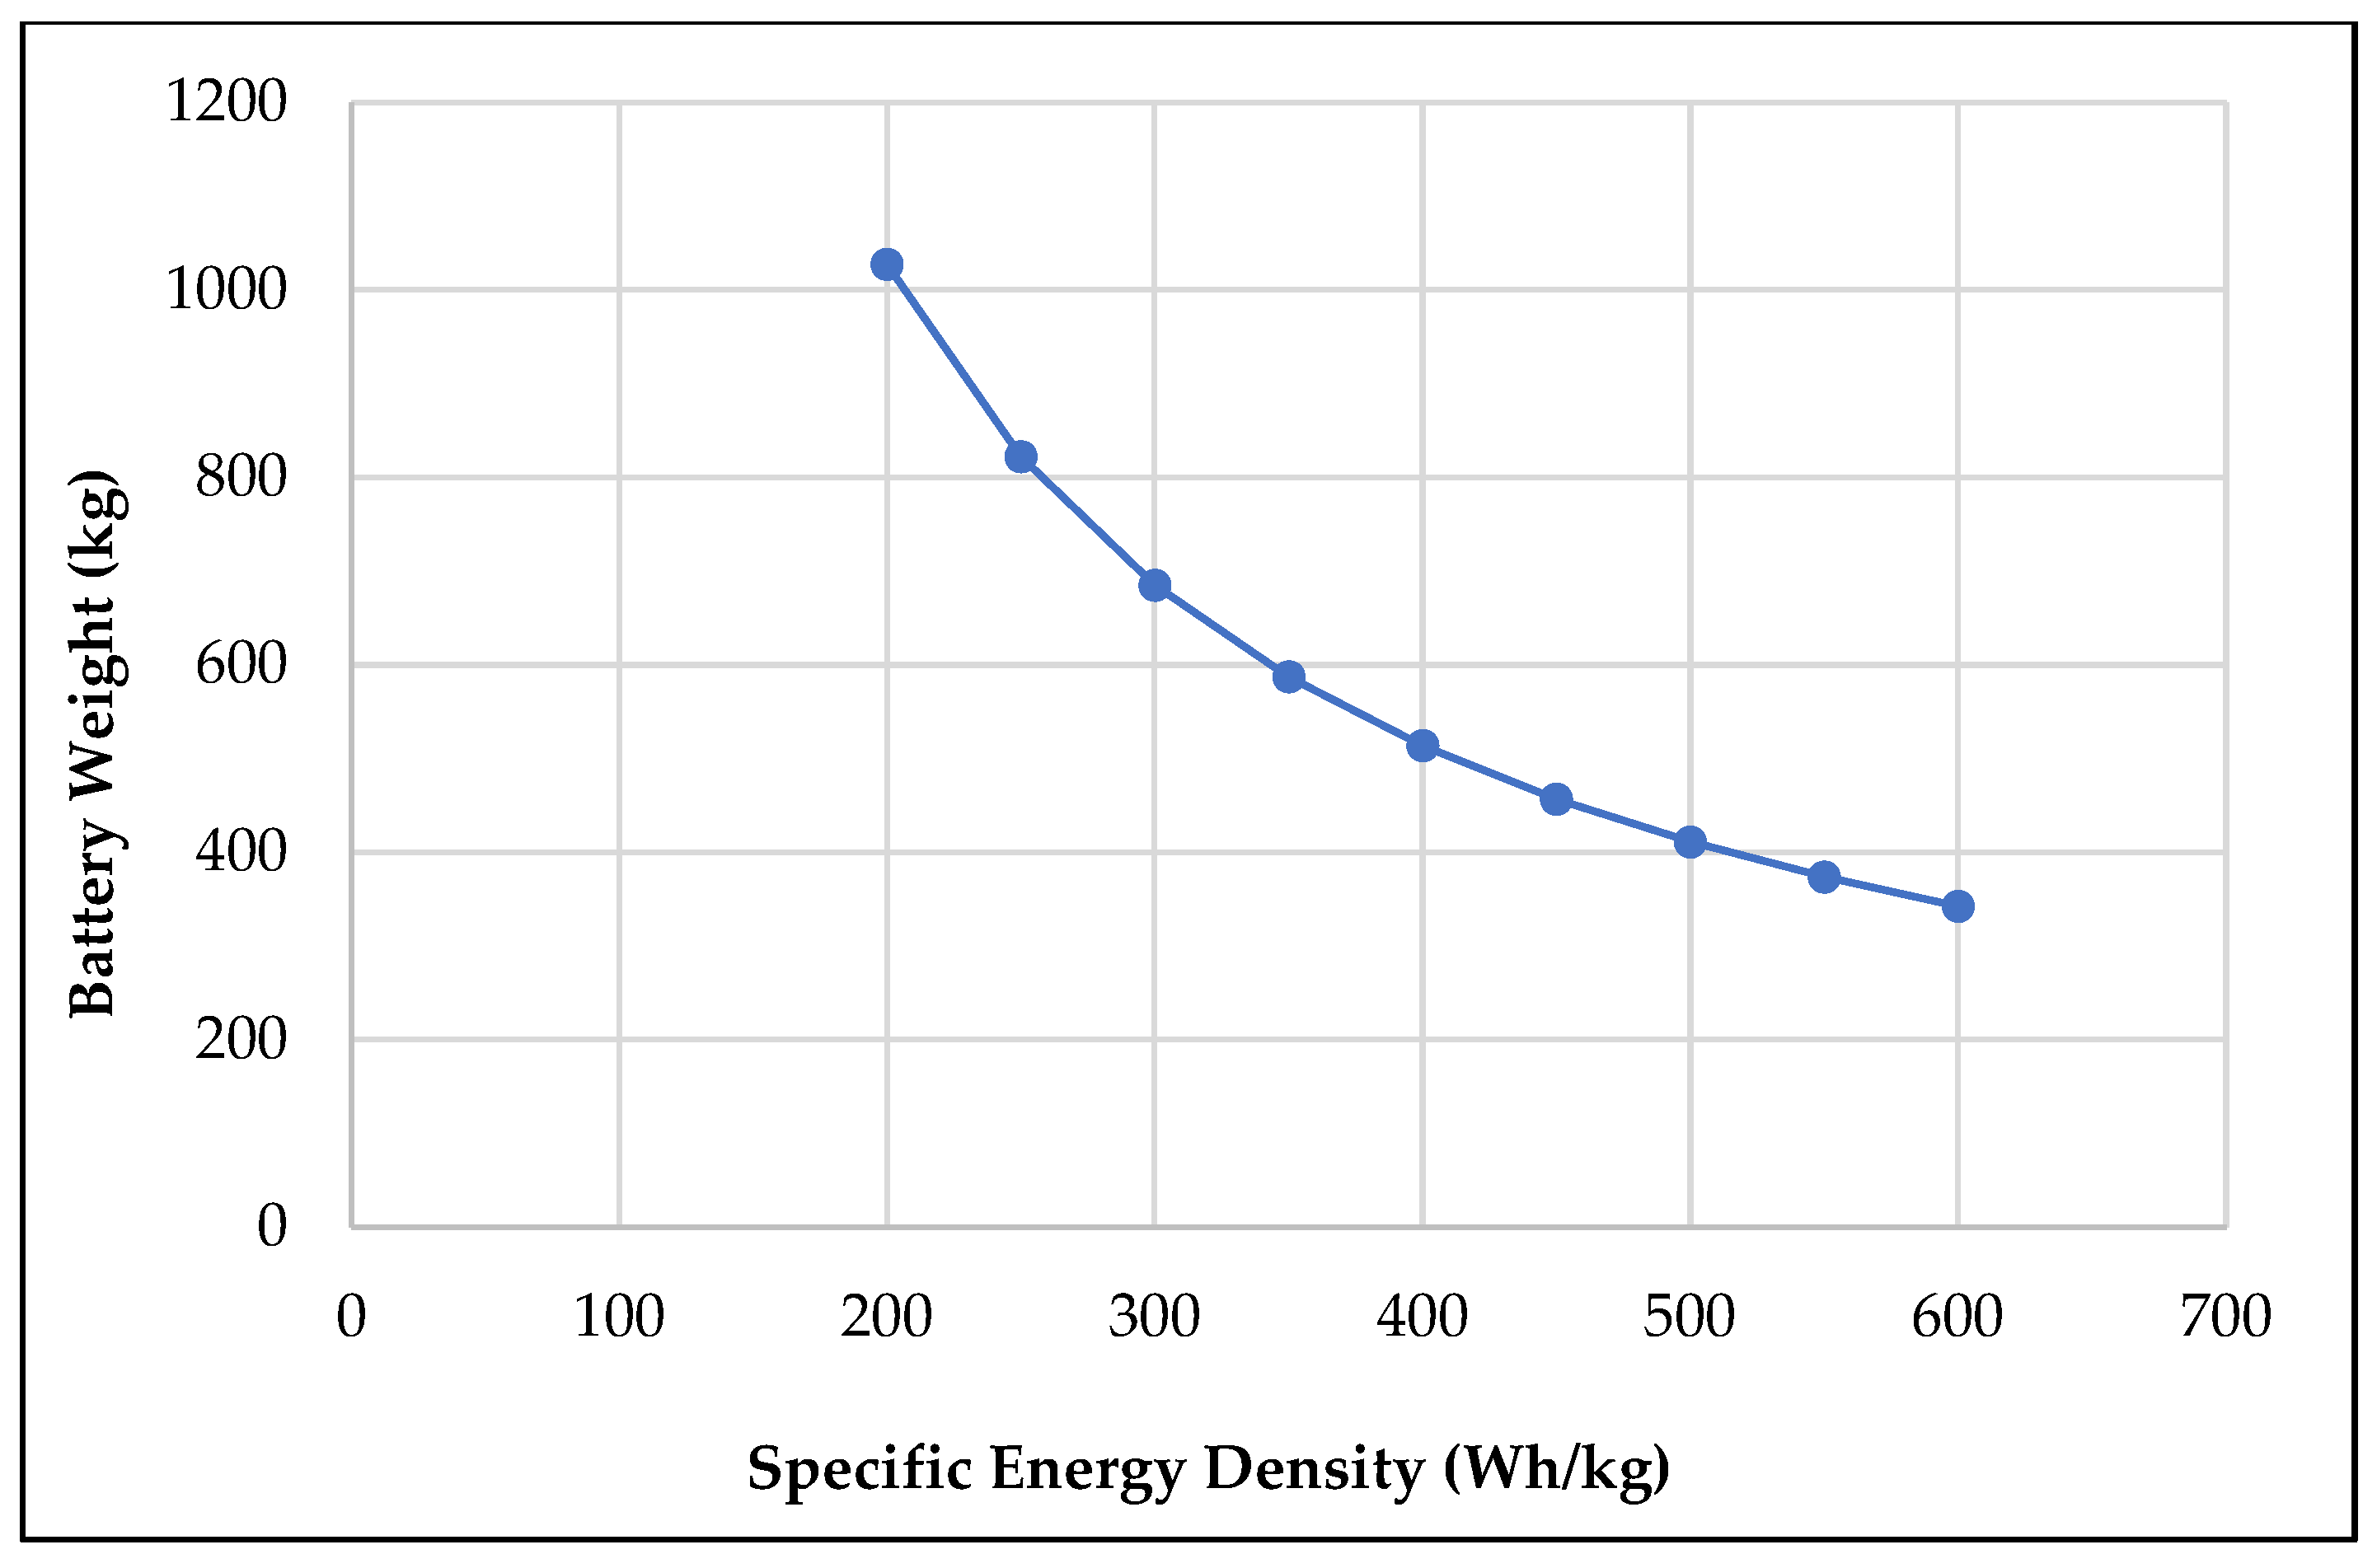
13.2. Technological Forecast in Battery and Cargo Systems
14. Relevance of Present Design and Analysis
15. Conclusions
Author Contributions
Funding
Data Availability Statement
Acknowledgments
Conflicts of Interest
References
- Kraenzler, M.; Schmitt, M.; Stumpf, E. Conceptual Design Study on Electrical Vertical Take Off and Landing Aircraft for Urban Air Mobility. In Proceedings of the AIAA Aviation Forum 2019, Dallas, TX, USA, 17–21 June 2019; ISBN 978-1-62410-589-0. [Google Scholar] [CrossRef]
- Xiao, J.; Salk, N.; Haran, K. Conceptual Design of an eVTOL Air Shuttle for Rapid Intercity Transport. In Proceedings of the IEEE Power and Energy Conference at Illinois (PECI), Champaign, IL USA, 27–28 February 2020; pp. 1–8, ISBN 978-1-72815-299-8. [Google Scholar] [CrossRef]
- Taarabt, S.A.; Bernier, A.T.; Chen, Y.; Compere, H.; Dore, A.; Fransolet, M.; Jumpertz, R.D.; Macchiaiolo, L. Graduate Team Aircraft Design Competition: Electric Vertical Takeoff and Landing (E-VTOL) Aircraft Mistral Air Taxi Team Name: The Huggy’s Birds. 2019. Available online: https://www.aiaa.org/docs/default-source/uploadedfiles/education-and-careers/university-students/design-competitions/3rd-place-grad-team-aircraft.pdf (accessed on 7 January 2021).
- Udroiu, R.; Blaj, M.-I. Conceptual design of a VTOL remotely piloted aircraft for emergency missions. Sci. Res. Educ. Air Force 2016, 18, 207–214. [Google Scholar] [CrossRef]
- Bacchini, A.; Cestino, E. Electric VTOL Configurations Comparison. Aerospace 2019, 6, 26. [Google Scholar] [CrossRef] [Green Version]
- Crawford, C.C.; Heiges, M.W.; Wasikowski, M. Analysis of Tiltwing Aircraft Configuration Potential. SAE Trans. 1996, 105, 1267–1280. [Google Scholar] [CrossRef]
- Datta, A. Commercial Intra-City on Demand of Electric-VTOL Status of Technology. Technical Report. 2018. Available online: https://vtol.org/files/dmfile/tvf.wg2.yr2017draft.pdf (accessed on 14 January 2021).
- Kundu, A.K.; Price, M.A.; Riordan, D. Conceptual Aircraft Design: An Industrial Approach; Wiley: Hoboken, NJ, USA, 2019; p. 1056. ISBN 978-1-119-50028-5. [Google Scholar]
- Farokhi, S. Future Propulsion Systems and Energy Sources in Sustainable Aviation; Aerospace Series; John Wiley & Son, Inc.: Hoboken, NJ, USA, 2019; p. 445. ISBN 978-1-119-41505-3. [Google Scholar]
- Kuhn, I.F., Jr. Purebred and Hybrid Electric VTOL Tilt Rotor Aircraft. U.S. Patent No. 8,469,306, 25 June 2013. Available online: https://patentimages.storage.googleapis.com/8f/30/10/f7104b6f2b3a76/WO2010123601A1.pdf (accessed on 21 January 2021).
- Pham, R.N. High Performance VTOL Convertiplanes. U.S. Patent No. 6,974,105, 13 December 2005. Available online: https://portal.unifiedpatents.com/patents/patent/US-6974105-B2 (accessed on 28 January 2021).
- Jain, A.; Bavikar, K.; Sanjay, A.; Gupta, M.; Gupta, B.R.; Dineshkumar, H. Baseline procedure for conceptual designing of an eVTOL for Urban Air Mobility. In Proceedings of the 2020 4th International Conference on Electronics, Communication and Aerospace Technology (ICECA), Tamil Nadu, India, 5–7 November 2020; pp. 1173–1178. [Google Scholar] [CrossRef]
- Bacchini, A.; Cestino, E. Key Aspects of Electric Vertical Take-off and Landing Conceptual Design. Proc. Inst. Mech. Eng. Part G J. Aerosp. Eng. 2020, 234, 774–787. [Google Scholar] [CrossRef]
- Palaia, G.; Abu Salem, K.; Cipolla, V.; Binante, V.; Zanetti, D. A Conceptual Design Methodology for e-VTOL Aircraft for Urban Air Mobility. Appl. Sci. 2021, 11, 10815. [Google Scholar] [CrossRef]
- Bacchini, A.; Cestino, E.; Van Magill, B.; Verstraete, D. Impact of lift propeller drag on the performance of eVTOL lift+cruise aircraft. Aerosp. Sci. Technol. 2021, 109, 106429. [Google Scholar] [CrossRef]
- eVTOL Aircraft Directory, Electric VTOL News by the Vertical Flight Society. Available online: https://evtol.news/aircraft (accessed on 6 February 2021).
- OpenVSP. Open Source Parametric Aircraft Geometry Tool. Available online: http://openvsp.org/ (accessed on 13 February 2021).
- Bartini Flying Car. Available online: https://evtol.news/bartini/ (accessed on 20 February 2021).
- Bartini Flying Car. Official Website. Available online: https://bartini.aero/ (accessed on 27 February 2021).
- Types of Landing Gear. Available online: https://www.flight-mechanic.com/landing-gear-types-landing-gear-arrangement/ (accessed on 5 March 2021).
- Ailerons. Available online: https://www.skybrary.aero/index.php/Ailerons (accessed on 12 March 2021).
- V-Tail. Available online: http://youshouldfly.com/Rhyolite_Aviation/V-Tail_info.html (accessed on 19 March 2021).
- NACA 0010. Available online: http://airfoiltools.com/airfoil/details?airfoil=naca0010-il (accessed on 26 March 2021).
- Sanchez-Carmona, A.; Cuerno-Rejado, C. Vee-tail conceptual design criteria for commercial transport aeroplanes. Chin. J. Aeronaut. 2019, 32, 595–610. [Google Scholar] [CrossRef]
- Tilt Rotors. Available online: https://en.wikipedia.org/wiki/Tiltrotor (accessed on 4 April 2021).
- Will Graf, E. Effects of Duct Lip Shaping and Various Control Devices on the Hover and Forward Flight Performance of Ducted Fan UAVs. Ph.D. Dissertation, Virginia Polytechnic Institute and State University, Blacksburg, VI, USA, 2005. Available online: http://www.dept.aoe.vt.edu/~mason/Mason_f/WillGrafMSThesis.pdf (accessed on 11 April 2021).
- FAA Report on Transport Heliports. Available online: https://www.faa.gov/documentLibrary/media/advisory_circular/150-5390-2B/150_5390_2b_part2.pdf (accessed on 18 April 2021).
- Raymer, D.P. Aircraft Design: A Conceptual Approach, 6th ed.; AIAA Education Series; Virginia Polytechnic Institute and State University: Blacksburg, VI, USA, 2018; ISBN 978-1-62410-490-9. [Google Scholar]
- Hascaryo, R.W.; Merret, J.M. Configuration-Independent Initial Sizing Method for UAM/eVTOL Vehicles. In Proceedings of the AIAA AVIATION Forum, Online. 15–19 June 2020; p. 16, ISBN 978-1-62410-598-2. [Google Scholar] [CrossRef]
- NACA 643618. Available online: http://airfoiltools.com/airfoil/details?airfoil=naca643618-ilu (accessed on 25 April 2021).
- Abbott, I.H.; Von Doenhoff, A.E. Theory of Wing Sections: Including a Summary of Airfoil Data, 1st ed.; Dover Publications: Mineola, NY, USA, 1959; p. 693. ISBN 9780486605869. [Google Scholar]
- McCormick, B.W. Aerodynamics, Aeronautics and Flight Mechanics, 2nd ed.; John Wiley & Sons, Inc.: New York, NY, USA, 1994; p. 664. ISBN 978-0-471-57506-1. [Google Scholar]
- Roskam, J. Airplane Design Part 3; Roskam Aviation and Engineering Corporation: Ottawa, KS, Canada, 1987; ISBN 978-1-884885-09-9. [Google Scholar]
- Composites in Aircrafts. Available online: https://www.compositesworld.com/articles/flying-high-on-composite-wings (accessed on 3 May 2021).
- Cinar, G.; Cai, Y.; Chakraborty, I.; Mavris, D.N. Sizing and Optimization of Novel General Aviation Vehicles and Propulsion System Architectures. In Proceedings of the 2018 Aviation Technology, Integration, and Operations Conference, Atlanta, GA, USA, 25–29 June 2018; ISBN 978-1-62410-556-2. [Google Scholar] [CrossRef]
- Brushless Motor. Available online: https://www.freerchobby.cc/products/mp154120-40kw-brushless-motor-with-85kg-thrust-for-big-drone-plane (accessed on 10 May 2021).
- Master Airscrew. Available online: https://www.masterairscrew.com/products/3-blade-16x10-propeller (accessed on 17 May 2021).
- Jeevanantham, V.; Vadivelu, P.; Manigandan, P. Material Based Structural Analysis of a Typical Landing Gear. IJISET 2017, 4, 2348–7968. Available online: http://ijiset.com/vol4/v4s4/IJISET_V4_I04_34.pdf (accessed on 24 May 2021).
- Aircraft Tire—Engineering Data. Available online: https://www.jupitor.co.jp/pdf/michelin_aircraft.pdf (accessed on 31 May 2021).
- Bachmann, J.; Yi, X.; Gong, H.; Martinez, X.; Bugeda, G.; Oller, S.; Tserpes, K.; Ramon, E.; Paris, C.; Moreira, P.; et al. Outlook on ecologically improved composites for aviation interior and secondary structures. CEAS Aeronaut. J. 2018, 9, 533–543. [Google Scholar] [CrossRef] [Green Version]
- Myagkov, L.L.; Mahkamov, K.; Chainov, N.D.; Makhkamova, I. Advanced and conventional internal combustion engine materials. In Alternative Fuels and Advanced Vehicle Technologies for Improved Environmental Performance; Elsevier: Amsterdam, The Netherlands, 2014; pp. 370–408. ISBN 978-0-85709-522-0. [Google Scholar]
- Lamitex PL-68. Available online: http://www.naplastics.com/pump-vanes-blades (accessed on 2 June 2021).
- Sound Attenuating Honeycomb. Available online: https://www.hexcel.com/Products/Honeycomb/HexWeb-Acousti-Cap (accessed on 9 June 2021).
- Anderson, J.D. Introduction to Flight, 3rd ed.; McGraw-Hill Series in Aeronautical and Aerospace Engineering; McGraw-Hill: New York, NY, USA, 1989; p. 616. ISBN 978-0-07-100496-1. [Google Scholar]
- Jenkinson, L.R.; Marchman, J.F. Aircraft Design Projects: For Engineering Students; Butterworth-Heinemann: Amsterdam, The Netherlands, 2003; ISBN 978-0-7506-5772-3. [Google Scholar]
- Detachable Fuselage Aircraft. Available online: https://www.treehugger.com/plane-detachable-fuselage-could-really-take-4855350 (accessed on 16 June 2021).
- Future of Aircraft Propulsion. Available online: https://aero-space.eu/2021/01/04/the-future-of-aircraft-propulsion/ (accessed on 23 June 2021).
- Yi, Y. Review and Future of Aircraft’s Propulsion Type. J. Phys. Conf. Ser. 2019, 1345, 032075. [Google Scholar] [CrossRef]
- Gohardani, A.S.; Doulgeris, G.; Singh, R. Challenges of future aircraft propulsion: A review of distributed propulsion technology and its potential application for the all electric commercial aircraft. Prog. Aerosp. Sci. 2011, 47, 369–391. [Google Scholar] [CrossRef]
- Technology Roadmap to 2050. Available online: https://www.iata.org/contentassets/8d19e716636a47c184e7221c77563c93/technology20roadmap20to20205020no20foreword.pdf (accessed on 30 June 2021).
- Tesla Batteries. Available online: https://www.cnbc.com/2020/06/30/tesla-and-the-science-of-low-cost-next-gen-ev-million-mile-battery.html (accessed on 1 July 2021).
- Technology Watch. Aerospace Technology Institute (ATI). Available online: https://www.ati.org.uk/wp-content/uploads/2021/09/ati-insight-03-emerging-technologies-in-commercial-aircraft-systems.pdf (accessed on 8 July 2021).


| Aircraft | Cruise Speed (km/h) | Maximum Speed (km/h) | Range (km) | Payload Weight (kg) | Power Plant | Crew | Propulsion |
|---|---|---|---|---|---|---|---|
| Vimana AAV | 244 | 280 | 900 | 400 | 200 KW Batteries | 4 | 8 propellers |
| Vertical AerospaceVA-X4 | - | 241 | 161 | 450 | Batteries | 4 + 1 | 4 propellers for VTOL and all 8 propellers for cruise |
| Rolls Royce | - | 402 | 804 | - | 500 KW Batteries | 5 | 6 propellers |
| Overair Butterfly | 240 | 322 | 161 | - | Batteries | 4 + 1 | 4 propellers |
| Hyundai S-A1 | 290 | - | 97 | - | 7 high density batteries | 4 + 1 | 4 propellers for VTOL and all 8 propellers for cruise |
| Required | 200 | 250 | 500 | 500 | Green | 4 + 1 |
| Mission Phase | Altitude | Horizontal Velocity | Vertical Velocity | Distance |
|---|---|---|---|---|
| Hover climb | mean sea level to 80 m | - | 2 m/s | - |
| Transition and climb | 80 m to 400 m | 1.2 vstall | 2 m/s to 1.2 vstall | 0 to 120 m |
| Accelerated climb (γ = 14°) | 400 m to 2000 m | 1.2 vstall to 56 m/s | 8 m/s | 120 m to 1720 m |
| Cruise | 2000 m | 56 to 69 m/s | - | 1720 m to 498.2 km |
| Decelerated descent | 2000 m to 400 m | 56 m/s to 1.2 vstall | 2 m/s | 498.2 km to 499.9 km |
| Transition and descent | 400 m to 80 m | 1.2 vstall | 2 m/s | 499.9 km to 500 km |
| Hover descent | 80 m to mean sea level | - | 1 m/s | - |
| Components | Weight (kg) |
|---|---|
| Fuselage | 240 |
| Wing | 160 |
| V-Tail | 26 |
| Landing gear | 50 |
| Battery | 513 |
| Payload | 500 |
| Motors | 120 |
| Flight Controls | 26 |
| Rotors | 20 |
| Pilot/crew | 90 |
| Other empty weight | 10 |
| Total | 1755 |
| Property | Dimensions |
|---|---|
| Span | 11 m |
| Surface | 17 m2 |
| Mean chord | 1.55 m |
| Aspect ratio | 8 |
| Taper | 0.35 |
| Chord at root | 2.3 m |
| Chord at tip | 0.8 m |
| Twist | −2° |
| Angle of incidence | 5.25° |
| Sweep at quarter chord | 0 |
| Mass | 200 kg |
| Facing | Core | Adhesive | Finishing |
|---|---|---|---|
| Phenolic resin | Honeycomb-aramid fibre | Epoxy | Polyvinyl Chloride (PVC) |
| Tail Parameters | Dimensions |
|---|---|
| Span | 4.439 m |
| Taper ratio | 0.7 |
| Aspect ratio | 3 |
| Average chord | 1.48 m |
| Dihedral angle | 45 degrees |
| Velocity (v) m/s | Coefficient of Lift (CL) | Coefficient of Drag (CD) | Lift-to-Drag Ratio (L/D) | Thrust Required (TR) N |
|---|---|---|---|---|
| 70 | 0.634 | 0.047 | 13.6 | 1226.25 |
| Type | Motor | Total Mass (kg) | Maximum Speed (RPM) | Torque (N-m) |
|---|---|---|---|---|
| BLDC | MP154120 | 20 | 9600 | 85.38 |
| Tire Selection | Main Gear | Nose Gear |
|---|---|---|
| Outer diameter [m] | 0.34 | 0.33 |
| Width [m] | 0.15 | 0.12 |
| Rim diameter [m] | 0.101 | 0.101 |
| Maximum load [kg] | 1600 | 800 |
| Inflation pressure [kPa] | 930 | 792 |
| Static loaded radius [m] | 0.13 | 0.13 |
| Control Surfaces | Length (m) | Chord (m) |
|---|---|---|
| Ailerons | 2.1 | 0.2 |
| Ruddervators | 1.99 | 0.2 |
| Flaps | 1.5 | 0.345 |
| Component | Coefficient of Parasitic Drag from Component Build-Up Method | OpenVSP Parasitic Drag Coefficient |
|---|---|---|
| Wing | 0.00965 | 0.0097 |
| Fuselage | 0.007 | 0.006 |
| V-Tail | 0.003 | 0.0038 |
| Propeller Hubs | 0.0026 | 0.00264 |
| Miscellaneous | 0.0137 | - |
| Total | 0.0359 | 0.02214 |
| Mode | Cruise mode |
| Velocity | 70 m/s |
| Pressure | 101,235 Pa |
| Altitude | Sea level conditions |
| Wing surface area | 16.8594 m2 |
| Reynold’s number | 7.42 × 10⁶ |
| Wing incidence angle | 5.25° |
| Serial Number | Mode | Altitude (m) | Velocity (m/s) | Parasitic Drag (Cd0) |
|---|---|---|---|---|
| 1. | Cruise | Sea level | 70 | 0.03008 |
| 2. | Cruise | 2000 | 70 | 0.03085 |
| Mode | Cruise mode |
| Velocity | 70 m/s |
| Projected area | 30.644 m2 |
| Reynold’s number at sea level | 7.42 × 10⁶ |
| Reynold’s number at 2000 m | 6.33 × 10⁶ |
| Total Area | 4.4643 m2 |
| Propeller Rpm | 6000 |
| Air Velocity | 70 m/s |
| Pressure | 101,235 Pa |
| Density | 1.225 kg/m3 |
| Altitude | Sea level conditions |
| Mesh Elements | 121,135 |
| Mesh Nodes | 22,016 |
| Viscous Model | K-epsilon |
| Serial Number | Load Type | Maximum Stress (GPa) | Maximum Deformation (m) |
|---|---|---|---|
| 1. | Bending | 6.7 | 0.063 |
| 2. | Shear | 0.307 | 0.011 |
| 3. | Torsion | 6.587 | 0.227 |
| Serial Number | Load Type | Maximum Stress (GPa) | Maximum Deformation (m) |
|---|---|---|---|
| 1. | Bending | 32.6 | 0.092 |
| 2. | Shear | 0.198 | 0.001 |
| 3. | Torsion | 35.8 | 0.015 |
| Mission Phase | Time (s) | Mean Horizontal Speed (m/s) | Mean Vertical Speed (m/s) | Energy (MJ) | L/D |
|---|---|---|---|---|---|
| Hover Up | 40 | 0 | 2 | 15.68 | - |
| Climb | 80 | 21 | 2 | 70 | 12.3 |
| Cruise | 7142 | 69 | 0 | 740 | 13.3 |
| Descent | 80 | 21 | 2 | 70 | 12.3 |
| Hover Down | 40 | 0 | 2 | 15.68 | - |
| Derivatives (Unit—Per Radian) | CLα | Cmα | Cmδe | Cm0 |
|---|---|---|---|---|
| Values | 8.77 | −0.718 | −3.09 | 0.114 |
| Parameter | Neutral Point | Static Margin | CG (Empty) | CG (Fully Loaded) |
|---|---|---|---|---|
| Values | 2.7 m | 29.4–41.2% | 2.0 m | 2.2 m |
| Derivatives (Per Radian) | Clβ | Cnβ | Clr | Cnr |
|---|---|---|---|---|
| Values | −0.495 | 1.153 | 0.12 | −0.063 |
| Dynamic Mode | Roots | ωn | ζ | TP | T1/2 |
|---|---|---|---|---|---|
| Phugoid | −0.015765 + 0.21582i | 0.217 Hz | 0.0728 | 29.1 s | 43.94 s |
| Short period | −2.28323 + 3.6704i | 4.32 Hz | 0.528 | 1.71 s | 0.3 s |
Publisher’s Note: MDPI stays neutral with regard to jurisdictional claims in published maps and institutional affiliations. |
© 2021 by the authors. Licensee MDPI, Basel, Switzerland. This article is an open access article distributed under the terms and conditions of the Creative Commons Attribution (CC BY) license (https://creativecommons.org/licenses/by/4.0/).
Share and Cite
Akash, A.; Raj, V.S.J.; Sushmitha, R.; Prateek, B.; Aditya, S.; Sreehari, V.M. Design and Analysis of VTOL Operated Intercity Electrical Vehicle for Urban Air Mobility. Electronics 2022, 11, 20. https://doi.org/10.3390/electronics11010020
Akash A, Raj VSJ, Sushmitha R, Prateek B, Aditya S, Sreehari VM. Design and Analysis of VTOL Operated Intercity Electrical Vehicle for Urban Air Mobility. Electronics. 2022; 11(1):20. https://doi.org/10.3390/electronics11010020
Chicago/Turabian StyleAkash, Arumugam, Vijayaraj Stephen Joseph Raj, Ramesh Sushmitha, Boga Prateek, Sankarasubramanian Aditya, and Veloorillom Madhavan Sreehari. 2022. "Design and Analysis of VTOL Operated Intercity Electrical Vehicle for Urban Air Mobility" Electronics 11, no. 1: 20. https://doi.org/10.3390/electronics11010020
APA StyleAkash, A., Raj, V. S. J., Sushmitha, R., Prateek, B., Aditya, S., & Sreehari, V. M. (2022). Design and Analysis of VTOL Operated Intercity Electrical Vehicle for Urban Air Mobility. Electronics, 11(1), 20. https://doi.org/10.3390/electronics11010020