Article

Reputation System for Increased Engagement in Public Transport Oriented-Applications

1
BISITE Research Group, University of Salamanca, Calle Espejo 2, 37007 Salamanca, Spain
2
Data Management Group, Universitat Politècnica de Catalunya, Jordi Girona 1-3, 08034 Barcelona, Spain
3
AETHON Engineering Consultants, 25 Em. Benaki Str, 10678 Athens, Greece
*
Author to whom correspondence should be addressed.
Electronics 2021, 10(9), 1070; https://doi.org/10.3390/electronics10091070
Submission received: 30 March 2021 / Revised: 22 April 2021 / Accepted: 28 April 2021 / Published: 30 April 2021

Abstract

:
Increasing user engagement is one of the biggest challenges when a new application is developed. An engaged user is one who finds a product valuable; highly engaged users generate profit. This study focuses on increasing user engagement in a transport application, via a user reputation score feature. The score is to reward application users and activity organisers, as well as to motivate beginners by offering a high reputation score in the first days of use. The algorithms are based on exponential and logarithmic functions, and were first tested on synthetic data. Real-world tests have shown that the algorithms behave as expected, but the COVID-19 pandemic created a disturbance which prevented any user from achieving the maximum score and many users from registering altogether. Data show positive results, although the real number of users is not sufficient to certify a correct behaviour. Further tests will be carried out when transport activities return to normal.

1. Introduction

The vast amount of data generated on the Internet can be converted into highly valuable information if a proper analysis is carried out. Analysing and filtering the information is especially necessary in cases where the user can interact directly with the content offered in the service. Analysis mechanisms, like those applied in recommender systems, are capable of extracting knowledge in systems that manage large volumes of information. This type of system ensures a satisfactory user experience by providing users with the content they are looking for. New innovative solutions have been proposed in recent years to improve urban transport. Mobility services such as bike-sharing, car-sharing, intermodal public transport and the concept of “Mobility as a Service” (MaaS) are effectively shifting demand away from private vehicles [1]. Moreover, smartphone penetration rates are increasing all over the world, facilitating iteration with public transport users via an application. Applications can become an important element of a city, improving citizens’ experience and increasing the quality of tourism [2]. As a result, the development of a new app can provide new functionalities and enhancements to a city’s infrastructure.
In recent years, mobile apps with user-generated content have become highly popular (TripAdvisor, Amazon, BlaBlaCar, ResearchGate, etc). The trust-building mechanisms of these apps have been enhanced so that a stranger on the internet can be seen as a “trustman” [3], based on the ideal “in truth we trust”. Therefore, these apps expand the source of trustworthy information from a few acquaintances to the whole app community, which is of great value to users [4].
Smartphones have the ability to assist users with the completion of tasks (utilitarian), to entertain them (hedonic) and to connect them with others (social) [5]. These three incentives can boost user engagement in a mobile app. Furthermore, a good balance between short-term rewards and medium-term rewards must be found, so that a gradual engagement is achieved. Otherwise, if the user does not perceive an increase in value or perceives a high initial value but no lasting value, then app engagement will lower considerably [6].
When users perceive high value and user engagement is high, the app community can grow on the principles of the gift economy—where valuables are not sold, but given, without an explicit agreement for immediate or future rewards. Webpages like Wikipedia have proven this concept to be highly effective and successful among the internet community [7].
The My-TRAC application has been developed to provide new public-transport-oriented functionalities. Its value lies in presenting practical alternatives to the use of private vehicles by enabling citizens to make better use of public transport. The application creates a healthy user community and a trustworthy source of information.
The main objective of this article is to propose a reputation algorithm to facilitate recommendations on a series of trip-related activities, such as the purchase of tickets, selection of the most appropriate means of transport, tourist activities, etc., which the users will be able to use as a guide while planning their trips.
This work is organised as follows: a review of existing reputation systems is presented in Section 2. Section 3 describes the proposal. Section 4 presents the assessment made with synthetic data and the pilot data. Finally, Section 5 presents the conclusions.

2. Background

Advisory systems provide advice and help solve problems that are normally solved by human experts [8]. In any community, individuals whose opinion is considered more important are normally trusted more. The knowledge of human experts can then be extracted and coded to automatise the process. Reputation systems are a kind of advisory system that allow users to rate each other in online communities so as to build trust through reputation [9].
Numerous proposals for reputation algorithms have been put forward over the years. They are generally quite context-dependent. This is because each problem entails the study of the best solution and, in most cases, it is not enough to have one generic proposal or to apply a specific proposal to a different problem. It is always necessary to adapt the approach to the new problem. From the analysis of the state of the art, it can be inferred that context-dependent solutions generally perform better than those that do not consider the context [10]. Additionally, some platforms have been designed to ease the development of such systems, as an essential part of any developing Smart City [11,12].
The subsections that follow present different existing reputation systems can be divided into groups of academic and commercial proposals.

2.1. Academic Proposals

Among the scientific proposals in the state of the art, two of them stand out (PageRank and EigenTrust). PageRank is the most popular of all the reputation algorithms, presented in [13] and used previously by Google to order the websites in its search engine in an objective and mechanical way. Four years later, researchers from Stanford University proposed an algorithm for reputation management in peer-to-peer (P2P) networks, called EigenTrust and described in [14]. With its application, they managed to minimize the impact of malicious peers on the performance of a P2P system.
PathTrust [10], has been presented more recently. It is based on a model that exploits the graph of relationships among the participants of virtual organizations. Its authors indicate that the system is based on the two previous algorithms (PageRank and EigenTrust); however, they are not directly applicable because their personalization is very limited.
Below is a brief description of how each algorithm works, along with its advantages and disadvantages.
  • PageRank [13]: Advantages: This algorithm converges in about 45 iterations. Its scaling factor is roughly linear in log ( n ) . It uses graph theory to link the pages. An important component of PageRank is that its calculation can be personalized. PageRank can estimate web traffic and can predict backlinks. Disadvantages: PageRank is based on random walks on graphs. This algorithm assumes the behaviour of a “random surfer”, but if a real Web surfer ever gets into small loops of web pages, the PageRank will have false positives. This method of random surfer assumes that periodically the surfer “gets bored” and jumps to another random page;
  • EigenTrust [14]: Advantages: This reputation system is among the most well-known and successful reputation systems. It satisfactorily solves different problems existing in P2P systems, which is the context in which the algorithm was designed. Disadvantages: The main drawback of this system is its reliance on a set of pre-trusted peers, which causes nodes to centre around them. As a consequence, other peers are ranked low despite being honest, marginalizing their role in the system [15];
  • PathTrust [10]: Advantages: This model of reputation (using the trust relationships amongst the participants) is resistant against the attack of faking positive feedback. A group of attackers collaborates to boost their reputation rating by leaving false, positive feedback for each other. In this model of reputation, this will only strengthen the trust relationship among the attackers, but will not necessarily strengthen the path of the attacker to an honest inquirer, such that their reputation does not affect the honest inquirer. Another benefit of exploiting established relationships in member selection is the formation of long-term relationships. Disadvantages: The trust relationship between two participants is formed on the basis of past experience with each other. A participant leaves a feedback rating after each transaction, and these ratings are accumulated to a relationship value. Therefore, one user can boost a positive or negative feedback.

2.2. Commercial Proposals

Currently, the most important reputation system proposals are those used by commercial applications. Generally, commercial reputation systems directly focus on assigning users a reputation score within that commercial system (for example, the reputation systems of TripAdvisor, Waze, Amazon and BlaBlaCar).
The conclusion drawn from the review of the state of the art is that all the existing reputation system proposals, especially those of commercial systems, focus exclusively on their context. This implies that a specific algorithm has to be designed to obtain good results. To do this, it is essential to identify the factors and the extent to which they have a direct influence on reputation.
In the same way, although each type of parameter has its weight, which defines its impact on the final score, each occurrence of the parameter may affect the associated factors differently. It is, therefore, necessary to determine how the score assigned to each occurrence of a parameter evolves over time.
Moreover, in the majority of the analysed commercial proposals, the user must know the highest possible reputation level that can be reached in the system. This allows them to understand the relevance of the different scores.

3. Proposal for User and Users’ Choices Reputation Algorithm

My-TRAC is an app devoted to the research and development of user-centric services that enhance the passengers’ multimodal door-to-door experience. This helps citizens develop greater confidence in, and adhesion to, multimodal transport services. Furthermore, My-TRAC improves adaptation to the users’ needs through the provided data, statistics and trends from the passengers’ experiences while using the proposed platform. An example of the user interface can be found in Figure 1.
This section describes the algorithms used on My-TRAC to assign a reputation score to each user and each user choice, activity or Point Of Interest (POI), representing their ranking within the system. The two algorithms share a common basis; however, each is used for a different purpose: one calculates the users’ reputation and the other one calculates the reputation of the choices made by users. Therefore, each algorithm uses different factors and metrics. As a result, each subsection describes either the part dedicated to the users’ reputation algorithm or the users’ choices’ reputation algorithm.
The proposed model is based on a mixture of exponential and logarithmic functions to create a system of distributed trust, a idea not yet fully explored in the literature. For example, the most common research lines base their mapping functions on the definitions of clever distances [16], graph analysis [13] or the definition of a set of rules affecting to the trust relationships among users [10]. The main advantage of the current proposal is that the mapping functions can be easily adapted or extrapolated to new systems, by just analysing the importance of the considered features and selecting a suitable function for those parameters, resulting in a higher versatility than other works.
This section is structured as follows: the factors identified as essential to determine a user’s reputation in the system are presented below. Then, the metrics associated with each of the individual factors are shown, followed by the description of the mechanism that provides the initial score, which is the output of both algorithms. Finally, the proposed adaptive weight mechanisms of both algorithms are described. They adapt the weight of the factors according to the dynamic characteristics of the application where the algorithms are applied. Thus, the role of this mechanism is to re-establish the limits of each factor over time, as the number of users or the number of existing ratings changes with time, providing an adequate maximum score.

3.1. Mathematical Description of the Reputation System

The reputation system is based on a combination of logarithmic and exponential functions to map the inputs onto their corresponding reputation. Metrics are related to each of the identified factors. Therefore, each metric determines the reputation score provided by its corresponding factor and each factor has its own metric. Besides, metrics affect the overall reputation, as it is calculated as the sum of the scores of all the factors. Each metric provides a final score which is calculated as the percentage reached by that user over the total weight of each factor, and these final scores are added to obtain the user/activity reputation.
The number of instances required to reach the maximum score is established for each factor. In addition, the slope of any of the parameter functions determines how fast or how slowly the value for that parameter increases. In this case, the slope parameter refers to the steepness, incline, or grade of the function. It has been established that the evolution is not linear, just like ResearchGate’s calculation of its “RG Score”. Thus, the growth in the score of a specific factor will either be logarithmic or exponential, following Equations (1) and (2).
s c o r e P a r a m e t e r i = y m a x i m u m × log ( s l o p e × x x m a x i m u m + 1 ) log ( 2 + s l o p e )
The logarithmic equation shown in Equation (1) is useful in cases where the slope should be greater in the initial instances and then gradually decrease in subsequent instances. For example, to encourage new users to rate activities, the first few ratings the user gives will have a considerable effect on their reputation, however, the user will not be able to continue gaining reputation at the same rhythm after producing a considerable amount of ratings. Instead, further ratings will have a smaller impact on the reputation of the user. Logarithmic growth is regulated by the s l o p e variable of the equation, whereas the maximum number of instances is regulated by x m a x i m u m . This factor will be dynamic due to the usage characteristics of the social network. Therefore, in the case of ratings provided by users, the maximum score x m a x i m u m can take a value of 200, meaning that a user with more than 200 ratings will obtain a 100% initial score, which will greatly contribute to the final score. In cases where the usage patterns of the application imply that users give a large number of ratings, the factor x m a x i m u m is adjusted dynamically, so that x m a x i m u m = 2 × a v g R a t i n g s B y U s e r . Finally, the factor y m a x i m u m can reach 1, so that each factor will have a score between 0 and 1.
s c o r e P a r a m e t e r j = y m a x i m u m × ( x x m a x i m u m ) s l o p e
The exponential equation shown in Equation (2) is useful for factors in which the weight of the initial instances is lesser and becomes more important in the system as the number of instances grows. For example, a user that opens the application three times does not notice a significant increase in their reputation in the system; however, a user who opens the application 200 times is considered a regular user, and therefore obtains a pertinent reputation.
Although the mathematical approach described above is not directly based on any existing work to determine reputation, these types of equation are well known and widely used in the literature for multiple purposes.
Mathematically speaking, the most similar proposed work can be found in [17], where the authors present a trust management system based on reputation mechanisms. The mechanisms proposed in this paper base the evolution of reputation on the number of assessments that follow a logarithmic distribution.

3.1.1. User Reputation Mathematical Model

User reputation is calculated using a mixture of exponential and logarithmic functions. These are selected in order to maximise user engagement, providing them with fast rewards for some easy tasks (logarithmic growth) and slow rewards until they complete a challenging task (exponential growth).
All the equations related to the users can be found in Table 1.
The following variables are used as input:
  • c d a t e refers to the current date.
  • r d a t e refers to the registration date.
  • n v a l u a t i o n s refers to the number of valuations of the user.
  • n u s e s refers to the number of times the user opened the app.
  • n r o u t e s refers to the number of routes the user has chosen to travel.
The following variables are the obtained outputs:
  • s 1 is the initial score of days registered.
  • s 2 is the initial score of the list of valuations.
  • s 3 is the initial score of the number of uses of the application.
  • s 4 is the initial score of number of chosen routes.
M represents the number of occurrences of a given parameter to provide the maximum value/weight that it is capable of providing over the total reputation (w).They refer to maximum and weight, respectively. Both are static (but editable) variables obtained from the database. The subscript indicates to which factor they are related.
The final score S is defined as shown in Equation (3):
S = i = 1 4 s i
The pseudocode of this procedure can be found below in Algorithm 1.
Algorithm 1 User Reputation Calculation.
1:
def f_log(x, x_max, slope = 100):
2:
     return log(slope × (x/x_max) + 1)/log(2 + slope)
3:
def f_exp(x, x_max, slope = 2):
4:
     return pow((x/x_max), slope)
5:
reputation = f_log(User.valuations, Maximum.valuations) × Weight.valuations
+ f_exp(User.uses_app, Maximum.uses_app) × Weight.uses_app
+ f_log(User.tickets_purchased, Maximum.tickets_purchased) ×
Weight.tickets_purchased + (User.days_registered/Maximum.registration) ×
Weight.registration + f_log(User.groups, Maximum.groups) × Weight.groups
6:
if reputation > 100 then
7:
      reputation = 100
8:
else if reputation < 0 then
9:
      reputation = 0
This novel proposal could provide commercial systems with the following advantages: (i) dynamic adaptation of the reputation to the information of the system (non-linear growth), (ii) dynamic adaptation at parameter level, varying the specific weight that each parameter has on the final reputation, (iii) engaging the users with well-modelled changes in its reputation score.
To this end, mechanisms similar to those used in well-known proposals, that have been proven to work well (such as the one presented in [17]), have been integrated with the peculiarities of My-TRAC, which determine the information to be used.

3.1.2. Users’ Choices Reputation Mathematical Model

The users’ choices (activities and POIs) reputation are calculated using a mixture of linear and logarithmic functions. They are selected in order to maximise users’ engagement, providing the users’ choices with fast rewards initially, and then basing the rewards on the average star rating received.
All the equations related to users’ choices can be found in Table 2.
The following variables are used as input:
  • r a u s e r k , i is the rating of the k-th user on the i-th activity. The number of users who rated this activity is defined as n.
  • r e u s e r k is the reputation of the k-th user who rated the activity. The number of users who rated this activity is defined as n.
  • n d a y s is the number of days since the activity was created.
  • n v i e w s is the number of views of the activity.
The following variables are the obtained outputs:
  • s 1 is the initial score of N-star ratings weighted average.
  • s 2 is the initial score of the number of views of the activity.
M and w are static (but editable) variables obtained from the database. They refer to maximum and weight, respectively. The subscript indicates which factor they are related to.
The final score, S, is defined as shown in Equation (4):
S = j = 1 2 s j
The pseudocode of this procedure can be found below in Algorithm 2.
Algorithm 2 Activity Reputation Calculation.
1:
def f_log(x, x_max, slope = 100):
2:
      return log(slope × (x/x_max) + 1)/log(2 + slope)
3:
def f_exp(x, x_max, slope = 2):
4:
      return pow((x/x_max), slope)
5:
numerator = 0
6:
denominator = 0
7:
for activity in ratings_database do:
8:
      numerator += activity.rating × activity.reputation_user
9:
      denominator += activity.reputation_user
10:
avg_rating_reputation ← numerator / denominator
11:
reputation = f_log(Activity.views, days_registered × Maximum.views, 50) ×
Weight.views + f_exp(avg_rating_reputation, Maximum.average_rating) ×
Weight.average_rating
12:
if reputation > 100 then
13:
      reputation = 100
14:
else if reputation < 0 then
15:
      reputation = 0

3.2. Updating the Parameters and Their Weights

The information on My-TRAC is not static; instead, it evolves over time. This obliges the metrics that are part of the reputation algorithms to adapt to the information. For this reason, it is crucial to implement mechanisms that update configurable factors in each of the metrics.
For example, during the pilot stage, when the application begins to obtain real user data, the system will start from zero. In the beginning, a lower number of instances of each factor will be required to obtain a significant final reputation score of a user/activity. The number of instances required will be much higher after a year of system functioning.
According to the number of instances of each one of those factors, the metrics that make up the algorithm can be adapted and the values can be updated automatically or manually. Both the weight that the parameter has on the final reputation and number of occurrences that a parameter must have to obtain the maximum score can be updated.
Regarding the weight of the parameter in the final reputation, it is set a priori but can be changed at any given point in order to correct certain anomalies or to encourage desired behaviours. On the other hand, there are two ways of updating the number of occurrences that a parameter must have to obtain its maximum score:
  • Manually: when an expert administrator/developer decides that it should be changed for some reason.
  • Automatically: depending on the evolution of the information on the platform. For example, the rating an activity has in the system will not remain the same; it is going to change over time and, according to its evolution, the maximum weight of this parameter in the system can increase or decrease (if it receives many ratings, its weight will decrease).
In the first version of the model, the system’s automatic adaptation has not been evaluated because the data we are using at this stage are not sufficient to test it effectively.

4. Evaluation and Results

The evaluation of the proposed algorithms has been tested using two complementary methods: creation of synthetic data and deployment of a pilot program. Synthetic data are meant to simulate the behaviour of users when the app has gained popularity and is already established, and the pilot phase provides a clear picture of how the algorithms will behave in the beginning of the application deployment phase.
The only way of evaluating the correct functioning of the algorithm with the synthetic data is the following: to analyse whether the obtained output behaves as expected and then draw conclusions as to whether the reputation score assigned to different users corresponds to the initial idea, as a function of the values of each of the parameters affecting the reputation score.
Due to the initial lack of available data of real users, synthetic data were generated in order to evaluate the proposed method. A total of 2000 simulated users were randomly generated considering the following attributes:
1.
Gender of users (i.e., male, female).
2.
Age group: Three age groups were considered (i.e., 16–30, 31–50, 51–90).
3.
Volume of performed actions. Two possibilities: users that performs a small number of actions and users that performs many actions.
4.
Type or category of the performed actions. Six major categories of actions were defined for the generated dataset: sports, eating, history, dancing, cinema, shopping.
Considering the above attributes, the generated dataset contained information about the demographics of the users and the number of actions performed for each category. The generation of a synthetic user is carried out by the data generator, which randomly chooses the gender, the age group, and the volume of actions and based on the number of actions performed by the mean users of the category that the user is applied to. The generator randomly calculates (based on a uniform distribution) the number of actions of the generated user for each of the six types of action.
Pilot data were used to analyse the real-world behaviour of the models, in a initial phase. As a result, it is expected that many users register but do not make any usage of the app. As the functionalities of the app are still limited, user engagement is likely to be lower than in the real application.
The evaluation of the obtained results is a subjective task; however, it is important to verify that the algorithms behave as expected. Section 4.1 describes the tests carried out related to the artificially generated users and their results. Section 4.2 describes the real-world experiment and its results.

4.1. Reputation Models Evaluation—Synthetic Data

When creating the synthetic dataset, the aim is to simulate the behaviour of real users and users’ choices in the most realistic possible way. This method will provide an a priori idea of how well the system works.

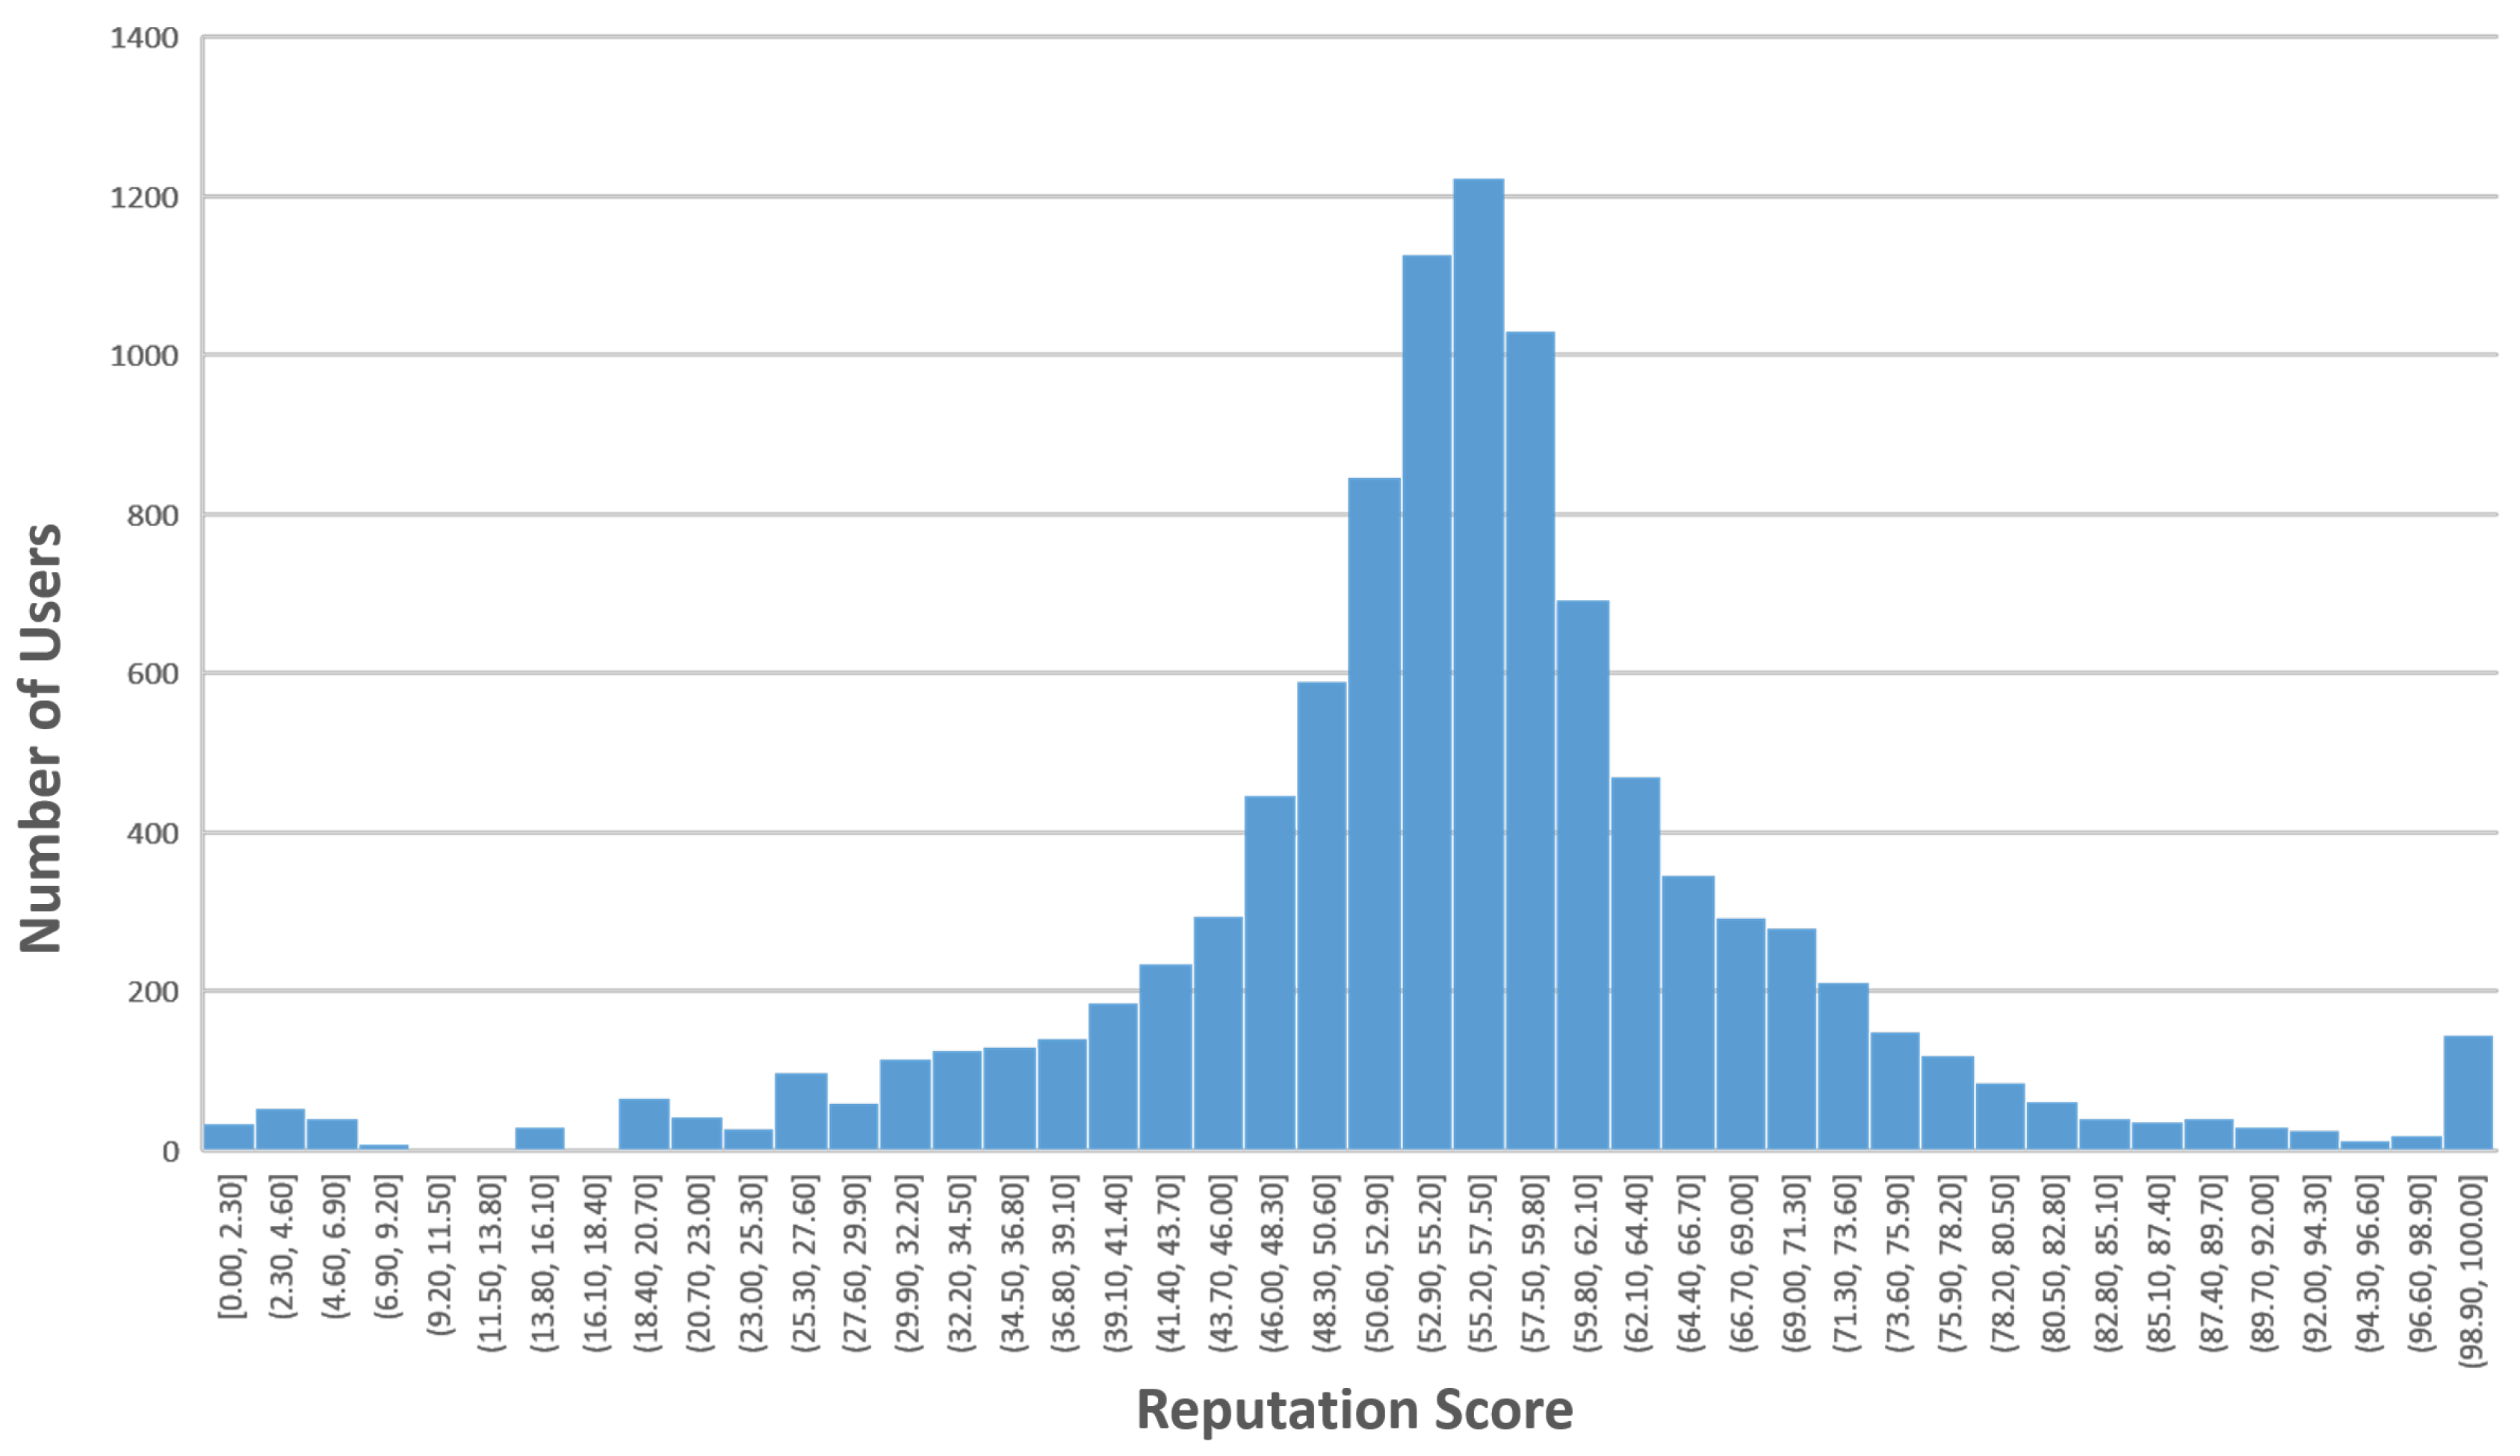
4.1.1. Users’ Reputation Evaluation

Evaluation methodology. This simulation aims to model the use of the system by users. Therefore, no inactive users will be generated, even though, in a real system, they could become the majority.
In this way, there will be a set of users who use the system a lot, a larger set who use it frequently and an even larger one who use it sporadically. This has involved the creation of three ranges of usage possibilities when creating the data.
This distribution of users is easily observed by analysing the scoreboard of the commercial applications that made their scoreboard public. For example, on Waze [18], one of the tools analysed in Section 2, a user with 100,000 points can reach the maximum level “Waze Royalty”, which means they are among the 1% most active users in the country, while the top users listed on the scoreboard have more than one million points.
Results.Figure 2 shows the distribution of reputation among system users. On the x-axis, there are reputation intervals, and on the y-axis, the number of users with a reputation within those intervals.
The resulting scores present a Gaussian distribution which denotes a desirable behaviour—this is the distribution that would be expected from many natural phenomena.

4.1.2. Users’ Choices Reputation Evaluation

Evaluation methodology. On the other hand, the users’ choices reputation algorithm, which determines the reputation of the activities and POIs included on My-TRAC, has also been evaluated using synthetic data.
In this case, the only case-specific restrictions that have been applied when generating the synthetic dataset are:
  • The identifier is a unique integer from 1 to 1000.
  • The inclusion date is between 1 September 2017 (start of the project) and 18 December 2018 (the date on which the evaluation was carried out).
  • The number of views of an activity is higher than its number of ratings.
Results. The distribution of the reputation of the 1000 synthetically created activities is shown in Figure 3, which shows, on the x-axis, the reputation values of the activities and on the axis, and the number of activities that there are in the different reputation intervals.
It can be observed that there is no activity with a reputation of less than 21, because the synthetic data were created to test the performance of the models with active users and successful activities. These circumstances are not expected to exist in reality, where it is expected that there may be activities that receive no ratings at all during the pilot stage.

4.2. Reputation Models Evaluation—Pilot Study

Evaluation methodology. The previously designed reputation models have been evaluated in the pilot phase. A variation in the initial model has been designed and its joint use with the Social Market (another functionality of My-TRAC) is proposed. The Social Market is a means of encouraging use of the application, as it enables the users to exchange the points they have obtained for rewards. The system allows the user to earn free tickets as a reward, in exchange for a set number of points. The number of obtained points is directly related to the user’s reputation. It is designed to encourage the user to make more frequent use of the application.
It is necessary to remember that there are reputation models for both users and activities. However, a specific variation in the user reputation model has been designed for the current phase and integrated in the Social Market.
Thus, the version of the reputation model that has undergone major evaluation and been tested by the users in the pilot phase is the original proposed model, with a slight variation. What is different is that the date on which the users register does not affect their reputation.
In the initial version of the model, a very active user who has been registered for a few days would have a greater reputation than a user who has been registered for much longer and who has also used the features of the application (used it sometimes, for example). There are two main reasons for designing a variant for the pilot model:
1.
The duration of the pilots is the same for all users and if a user has used the application more times than another user, they should get a higher reward, independently of the date of registration.
2.
If the date has a negative effect on the user’s reputation, i.e., the more time passes, the less reputation the user will have if they do not participate. This would cause the user’s points on the Social Market to decrease even though the user has not spent them. This is an undesirable situation for the evaluation of the model.
Therefore, the score obtained by the users in this phase is a decimal value between 0 and 100, where 0 is the initial reputation value for a user who has just registered, and 100 points can be reached by carrying out repeated interactions with the application. For example, every time an activity or POI is valued, a certain reputation value is assigned according to the previously defined metrics.
These points can be redeemed at the Social Market, where each user’s points will be updated periodically at 0:00 (CET) each day. The points on the Social Market have been updated periodically to control possible fraudulent behaviour by users who create multiple accounts, automate actions and obtain rewards illegally at the time. In this way, the development team can act as a moderator if this type of behaviour is detected and proceed accordingly, for example, by deleting the user’s account for non-compliance with the terms and conditions of use.
However, although the score that users have been able to visualize throughout the pilot phase is the score that is provided with the user reputation version created for integration with the Social Market, this section of the document also presents the results that would have been obtained with the reputation version not linked to the reward points and the users’ choice reputation models version. Thanks to this, it is possible to check how the models operate in the presence of real data, although, after carrying out the evaluation, it can be anticipated that the volume of information that has been collected is again insufficient.
Results. Due to the pandemic, strict mobility restrictions have been implemented, affecting the information that have been collected; this is different from the information we would have expected under normal circumstances.
More specifically, there are 171 valid users out of a total of 206 (which means that 35 decided to delete their account). It can be seen in the results presented below that not all of them have interacted with the tool. This was expected, as it commonly happens in any type of application, as some users download the application and register but never use it.
The pilot was open to everyone who wanted to register, and an advertising campaign was carried out in The Netherlands, Athens (Greece) and Barcelona (Spain) to encourage participation.
The results and evaluation of each of the data models are presented below.

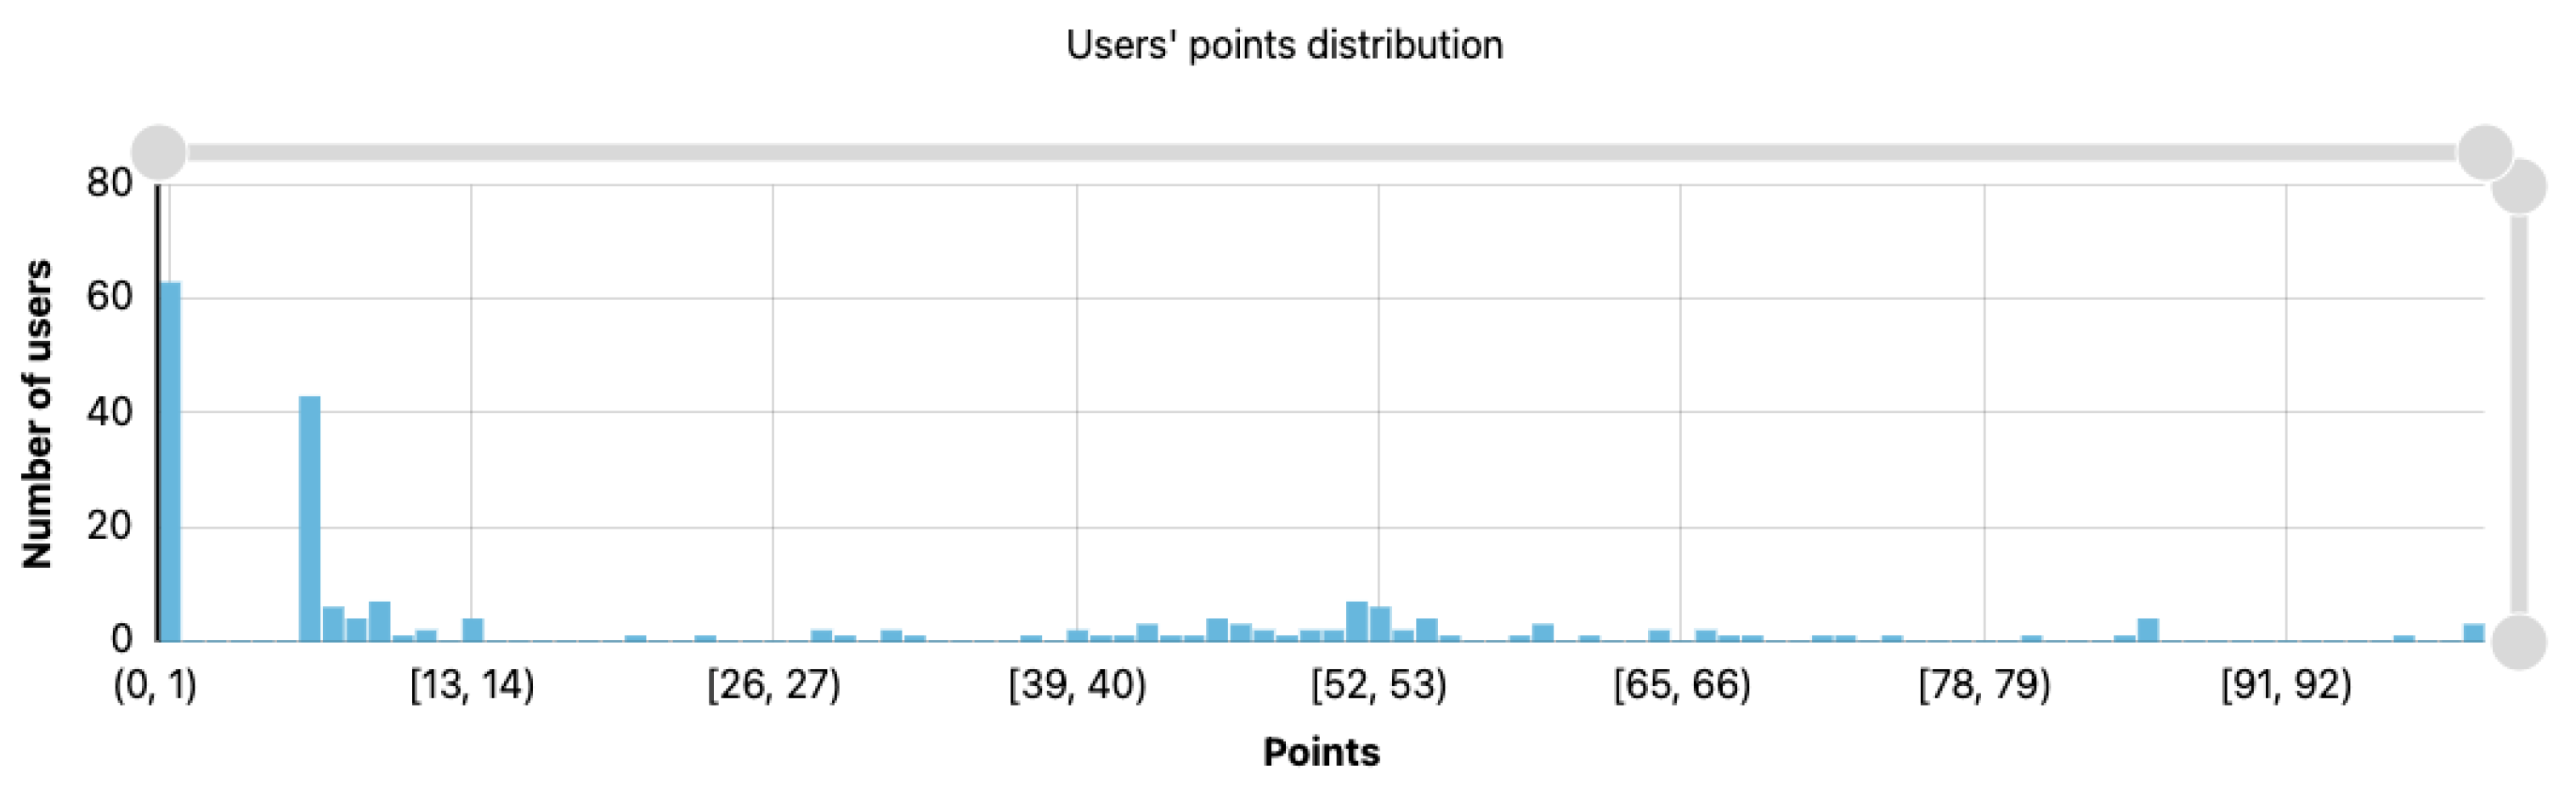
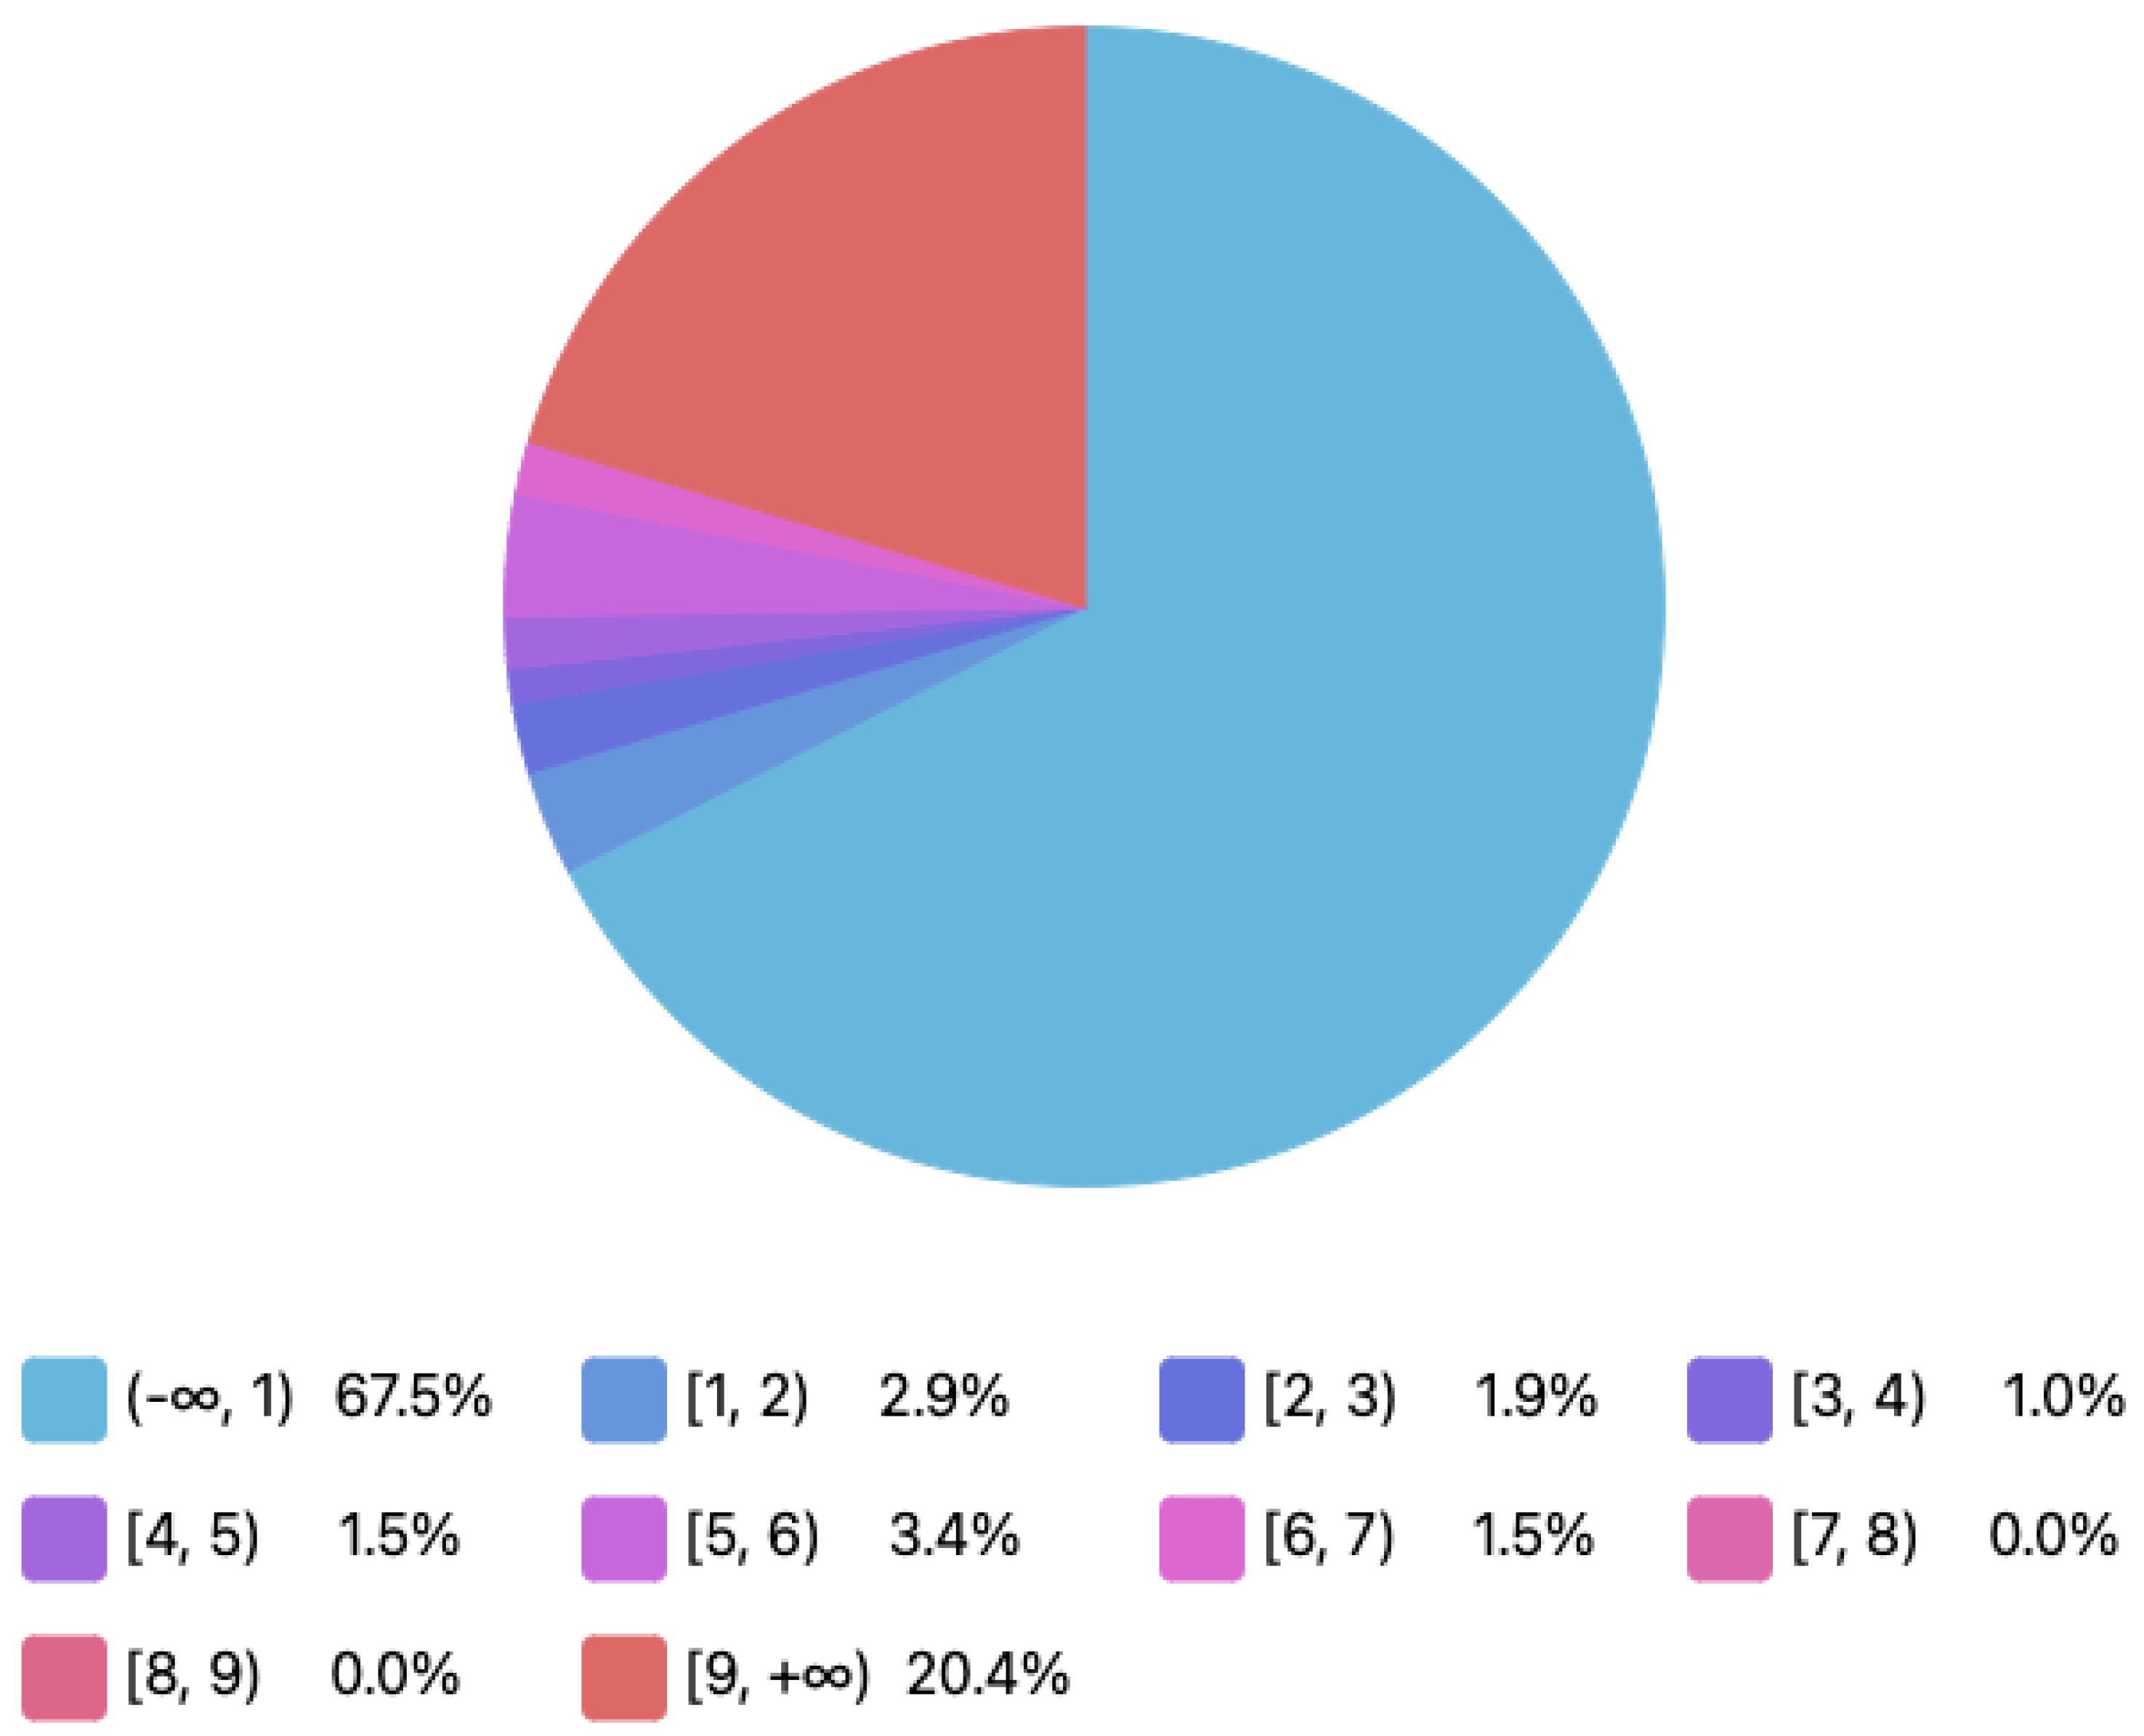
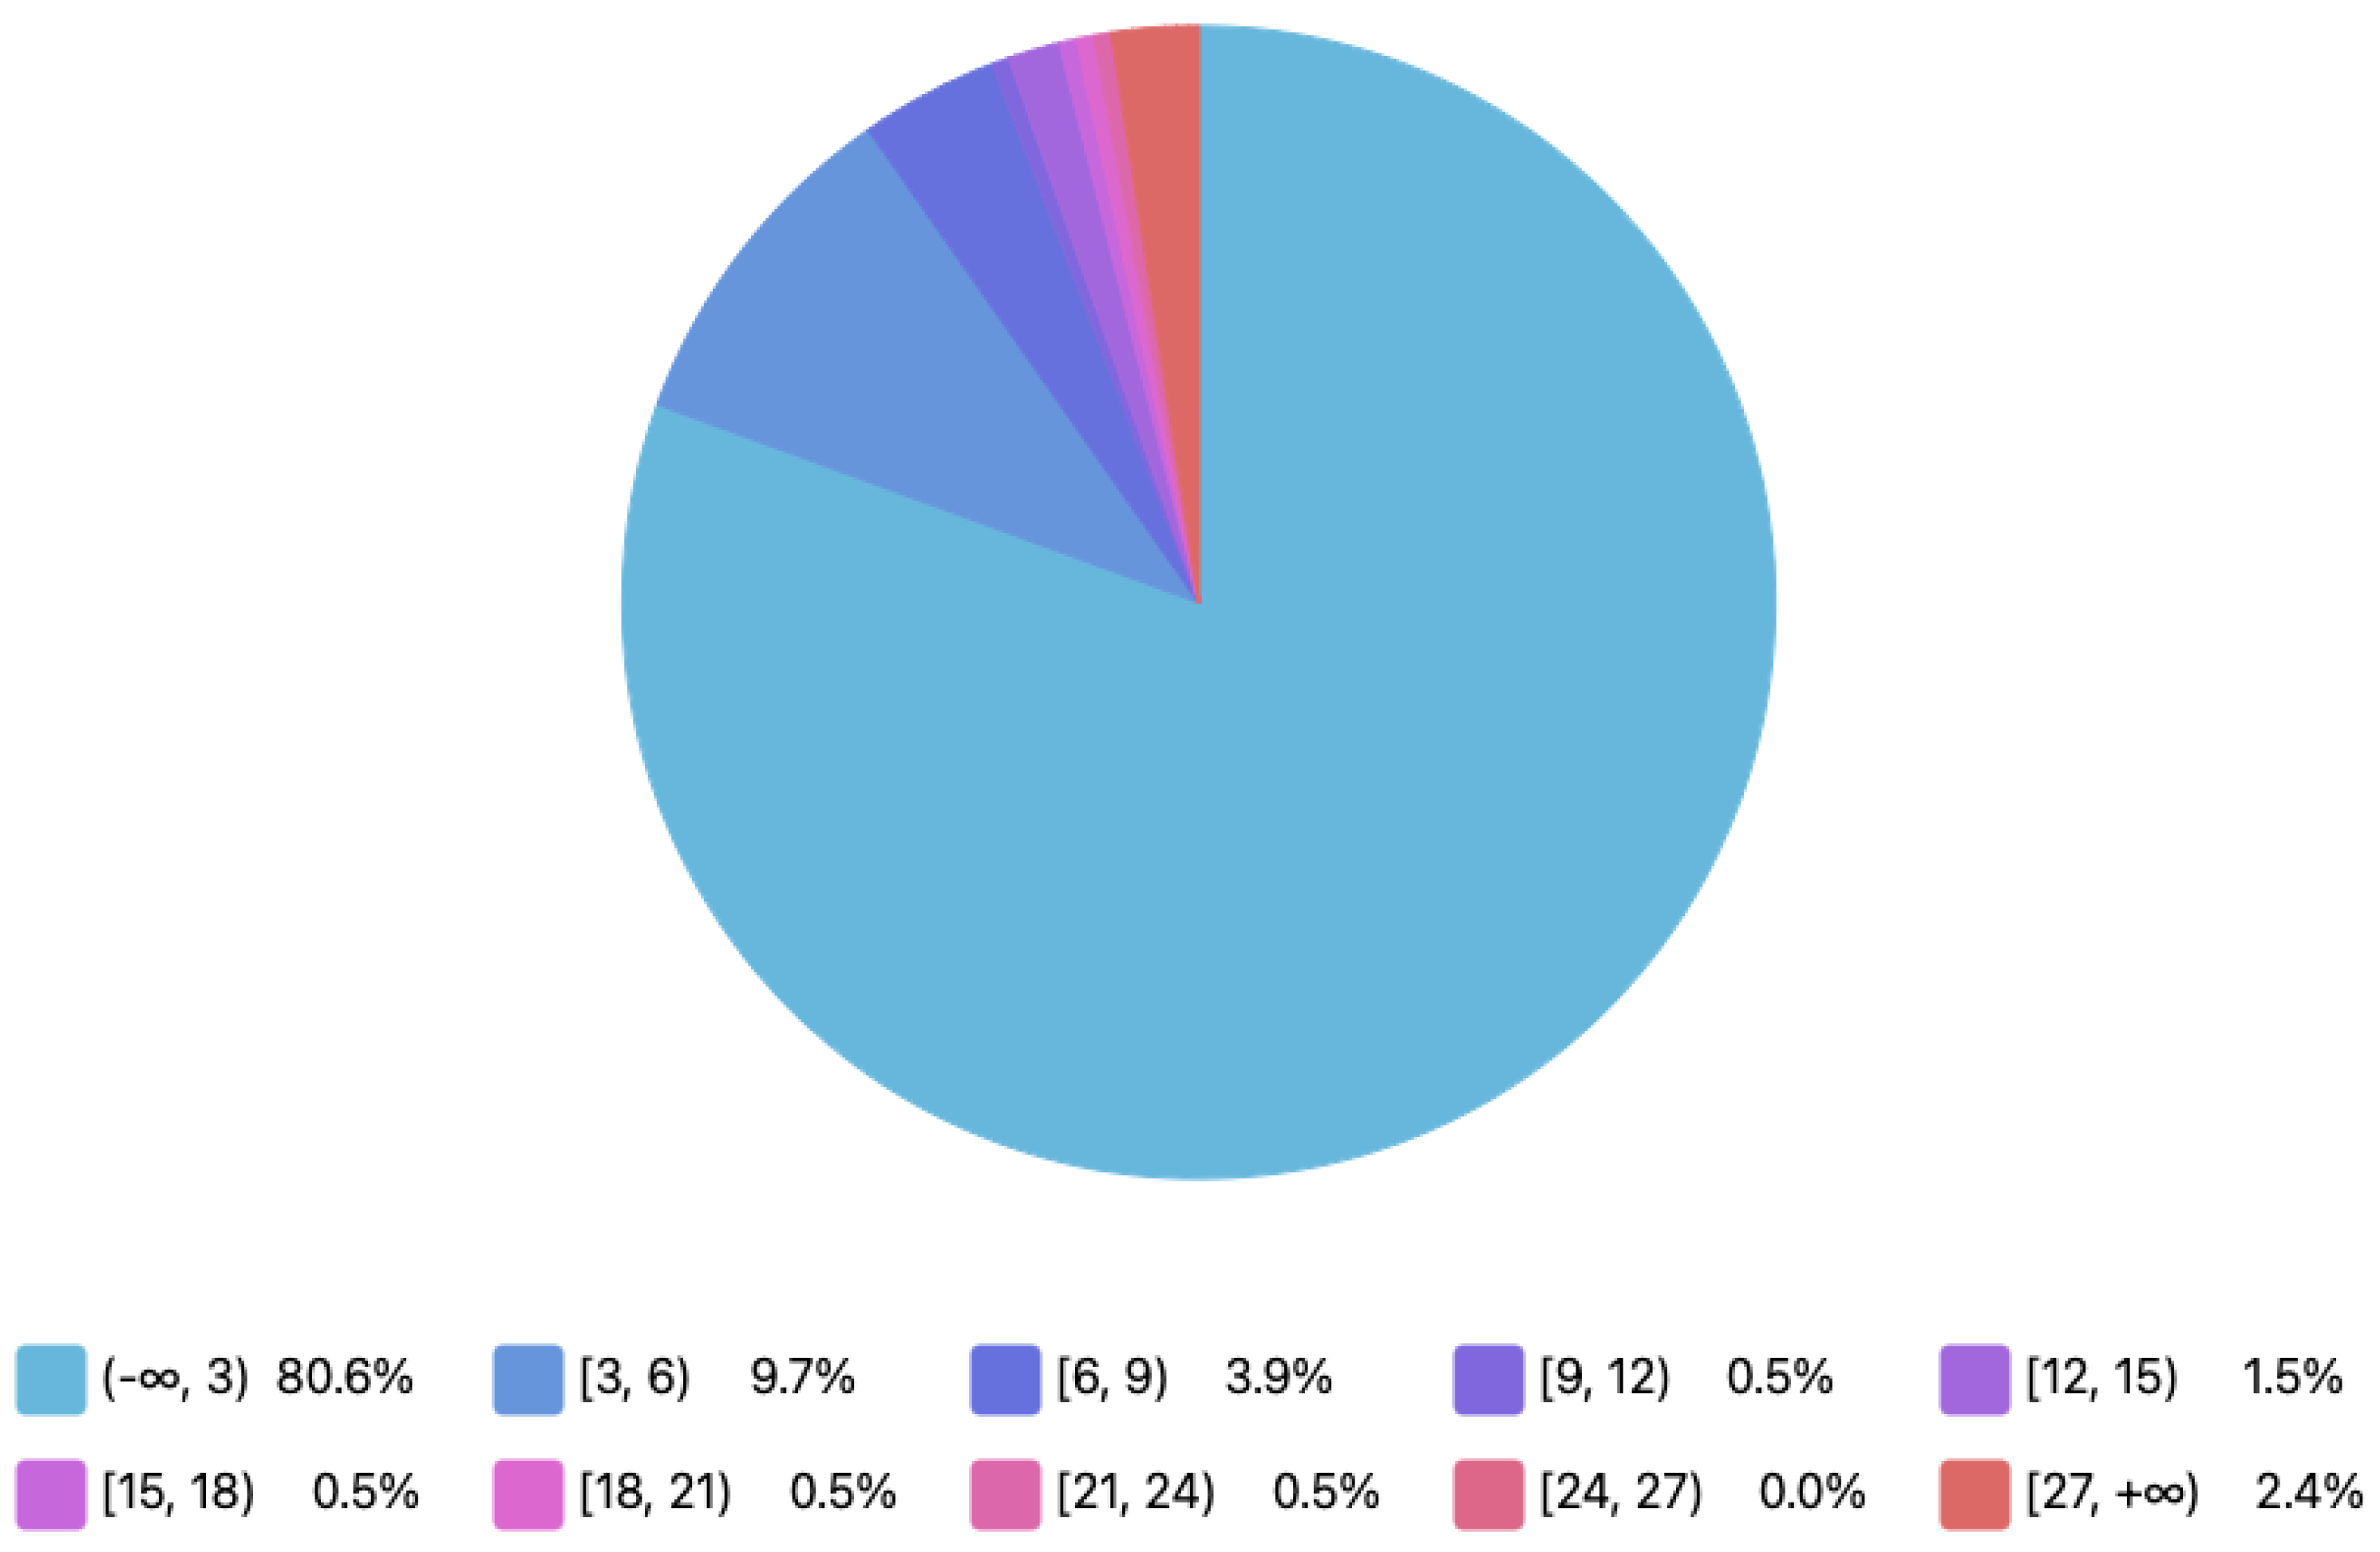
4.2.1. User Points (Social Market Version)

The results of the adapted version of the model for the Social Market reward points calculation, are presented below. They were obtained after carrying out the pilots with different graphs incorporated in the panel of the analysis tool mentioned above.
Figure 4 shows the distribution of the points allocated for the total number of users (206), i.e., both active and non-active users, grouped by ranges of 10 units.
It can be seen that there is a set that encompasses the majority of users (123), and this distorts the results. This is due to the fact that the majority of users have not interacted with the application at all or hardly at all.
To analyse this situation in greater detail, Figure 5 shows the same type of graph as the prior one, but, in this case, the groupings of points are made by unit rather than in groups of 10.
It can be seen that there are 63 users with the minimum value of reputation, which implies that they have registered and have not carried out any more activities, while there are 43 users who have obtained the score that corresponds to a one-time use of the application.
Let us consider the users who have not interacted in any way with the application as non-active users, thus providing 143 active users, and proceed to analyse the results again. Figure 6 again shows a graph with the distribution of users according to their points grouped in ranges of 10.
As with all users, the group of very inactive users still stands out, as they almost have not interacted with the tool, so if we filter the graph by leaving out the first range of values (from 0 to 10), we obtain a graph that is a better representation of the behaviour of the "average" users of the application, as shown in Figure 7.
As mentioned above, the number of users who have participated in the pilots was not significant enough to draw relevant conclusions regarding the functioning of the reputation models; however, a very similar behaviour to the one expected can be observed, which was obtained by generating synthetic data following a series of criteria intended to represent the real behaviour of users. The expected results are represented in the document by the graph shown in Figure 2.
It can be seen that the pursued objective has been achieved: the users who initially participate add points to their reputation score with relative ease until they reach the average values. It becomes more difficult for a user to go above the average reputation values, motivating users to continue to use the app to increase their score, thus increasing their loyalty.
However, a certain number of users were expected to have the highest score and this was not achieved, possibly because users have not been able to travel as much as expected due to the restrictions caused by the COVID-19 pandemic and because 100% of the app’s functionality is still not available.
An analysis of user activities was carried out, which provided points to better understand the type of activity carried out by the users of the app. For example, Figure 8 shows the points awarded to users according to the number of times they have used the app.
It can be seen that 67.5% of the users obtained a reward of between 0 and 1 points for using the app, i.e., they were less active, while 20.4% of the users obtained between 9 and 10 points (the maximum) for using the app.
A similar analysis can be made for the score given to users depending on the number of times they have requested a route and followed it. This analysis is shown in Figure 9.
In this case, it can be seen that 80.3% of users were awarded between 0 and 3 points for following suggested routes, while only 2.4% of users obtained between 27 and 30 points (the maximum) for having followed suggested routes. This clearly shows that very few users used this functionality (40 to be exact).

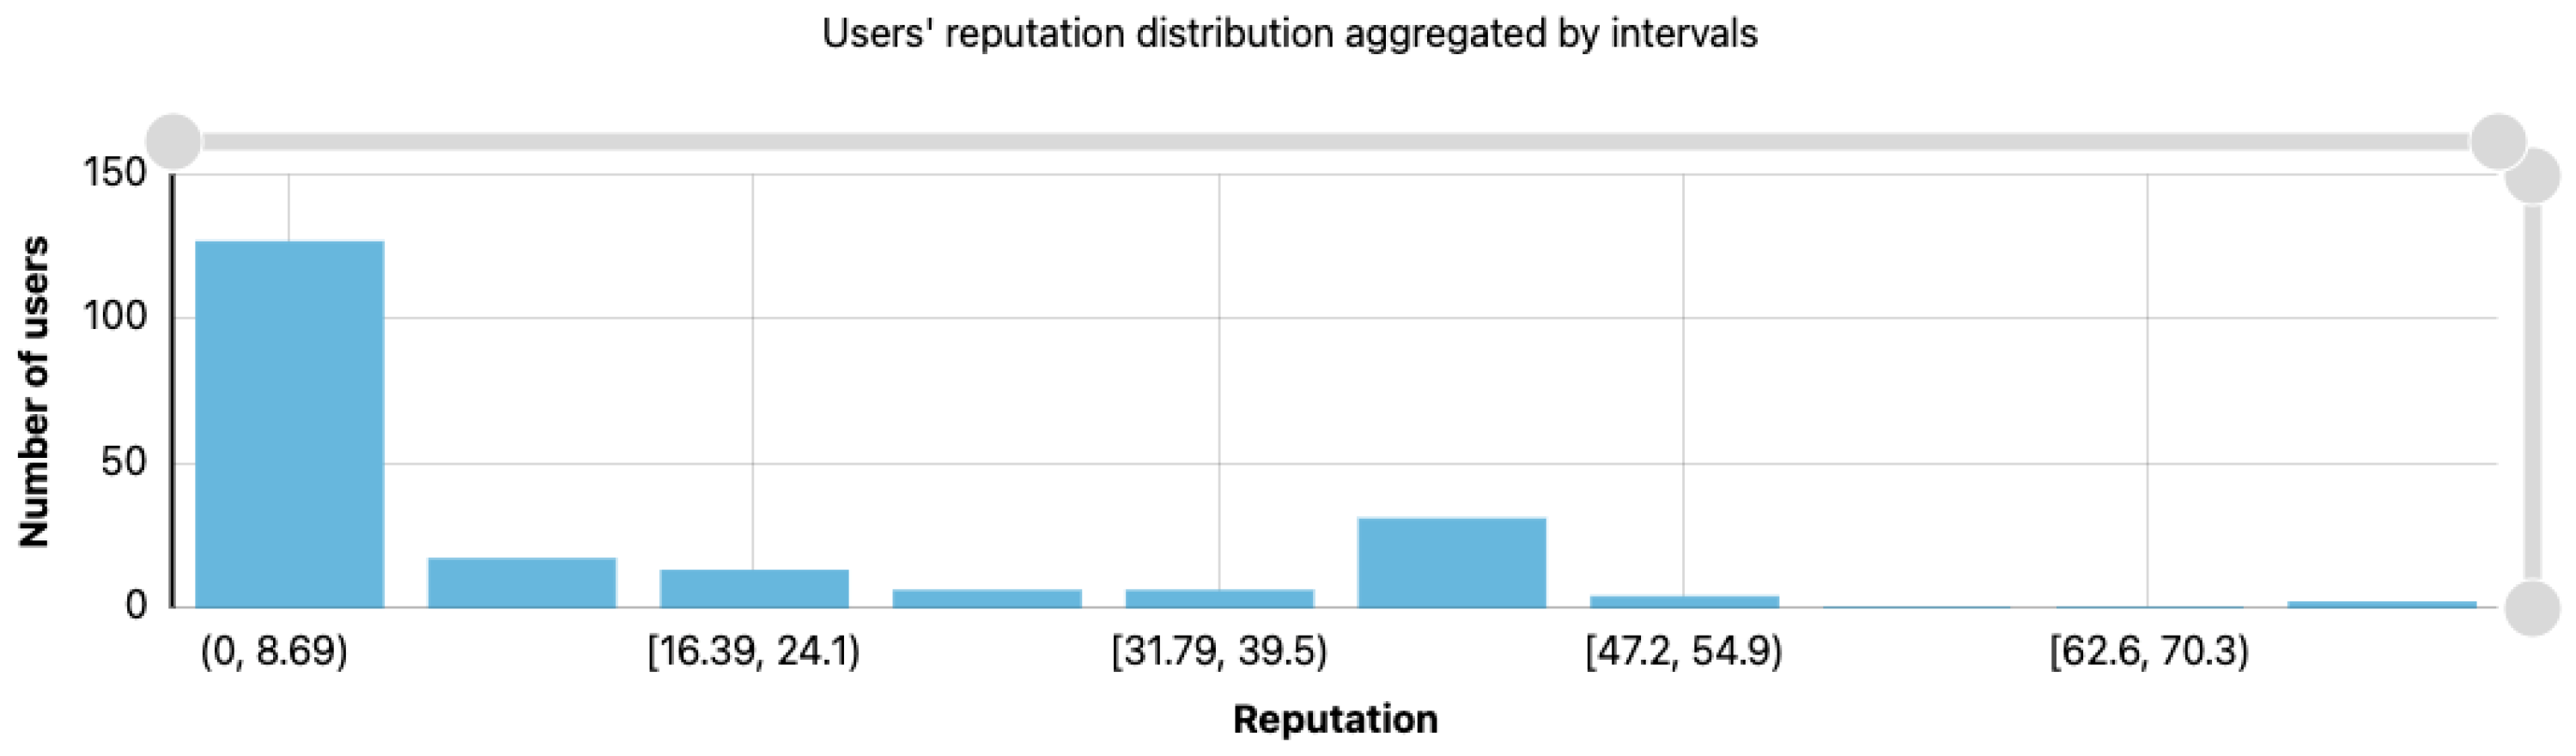
4.2.2. Users’ Reputation

Although the first version of the User Reputation Model was not used for the reasons outlined above, it is possible to carry out an assessment to demonstrate how the system would have performed.
In this case, out of the 206 total real-world live users, no one had a reputation of 100, because active users stopped being active before the date of the assessment, and this negatively affected the maintenance of their score at the highest value. The maximum reputation in this case was 86, achieved by two users. To represent this, 10 groupings with equal ranges were created, which are shown in Figure 10.
The distribution is not exactly the same as with the reward points, but, in the same way, the majority continues to remain in low values, mainly due to inactivity, so the results are evaluated by discarding this set of users and focusing again on the 143 real-world live users, who have at least interacted with the app. The distribution of their reputation is shown in Figure 11.
As participation has been lower than expected due to mobility restrictions, it can be seen that the majority of users have a below-average reputation, although the group with the highest number of users is in the intermediate reputation zone, as expected.

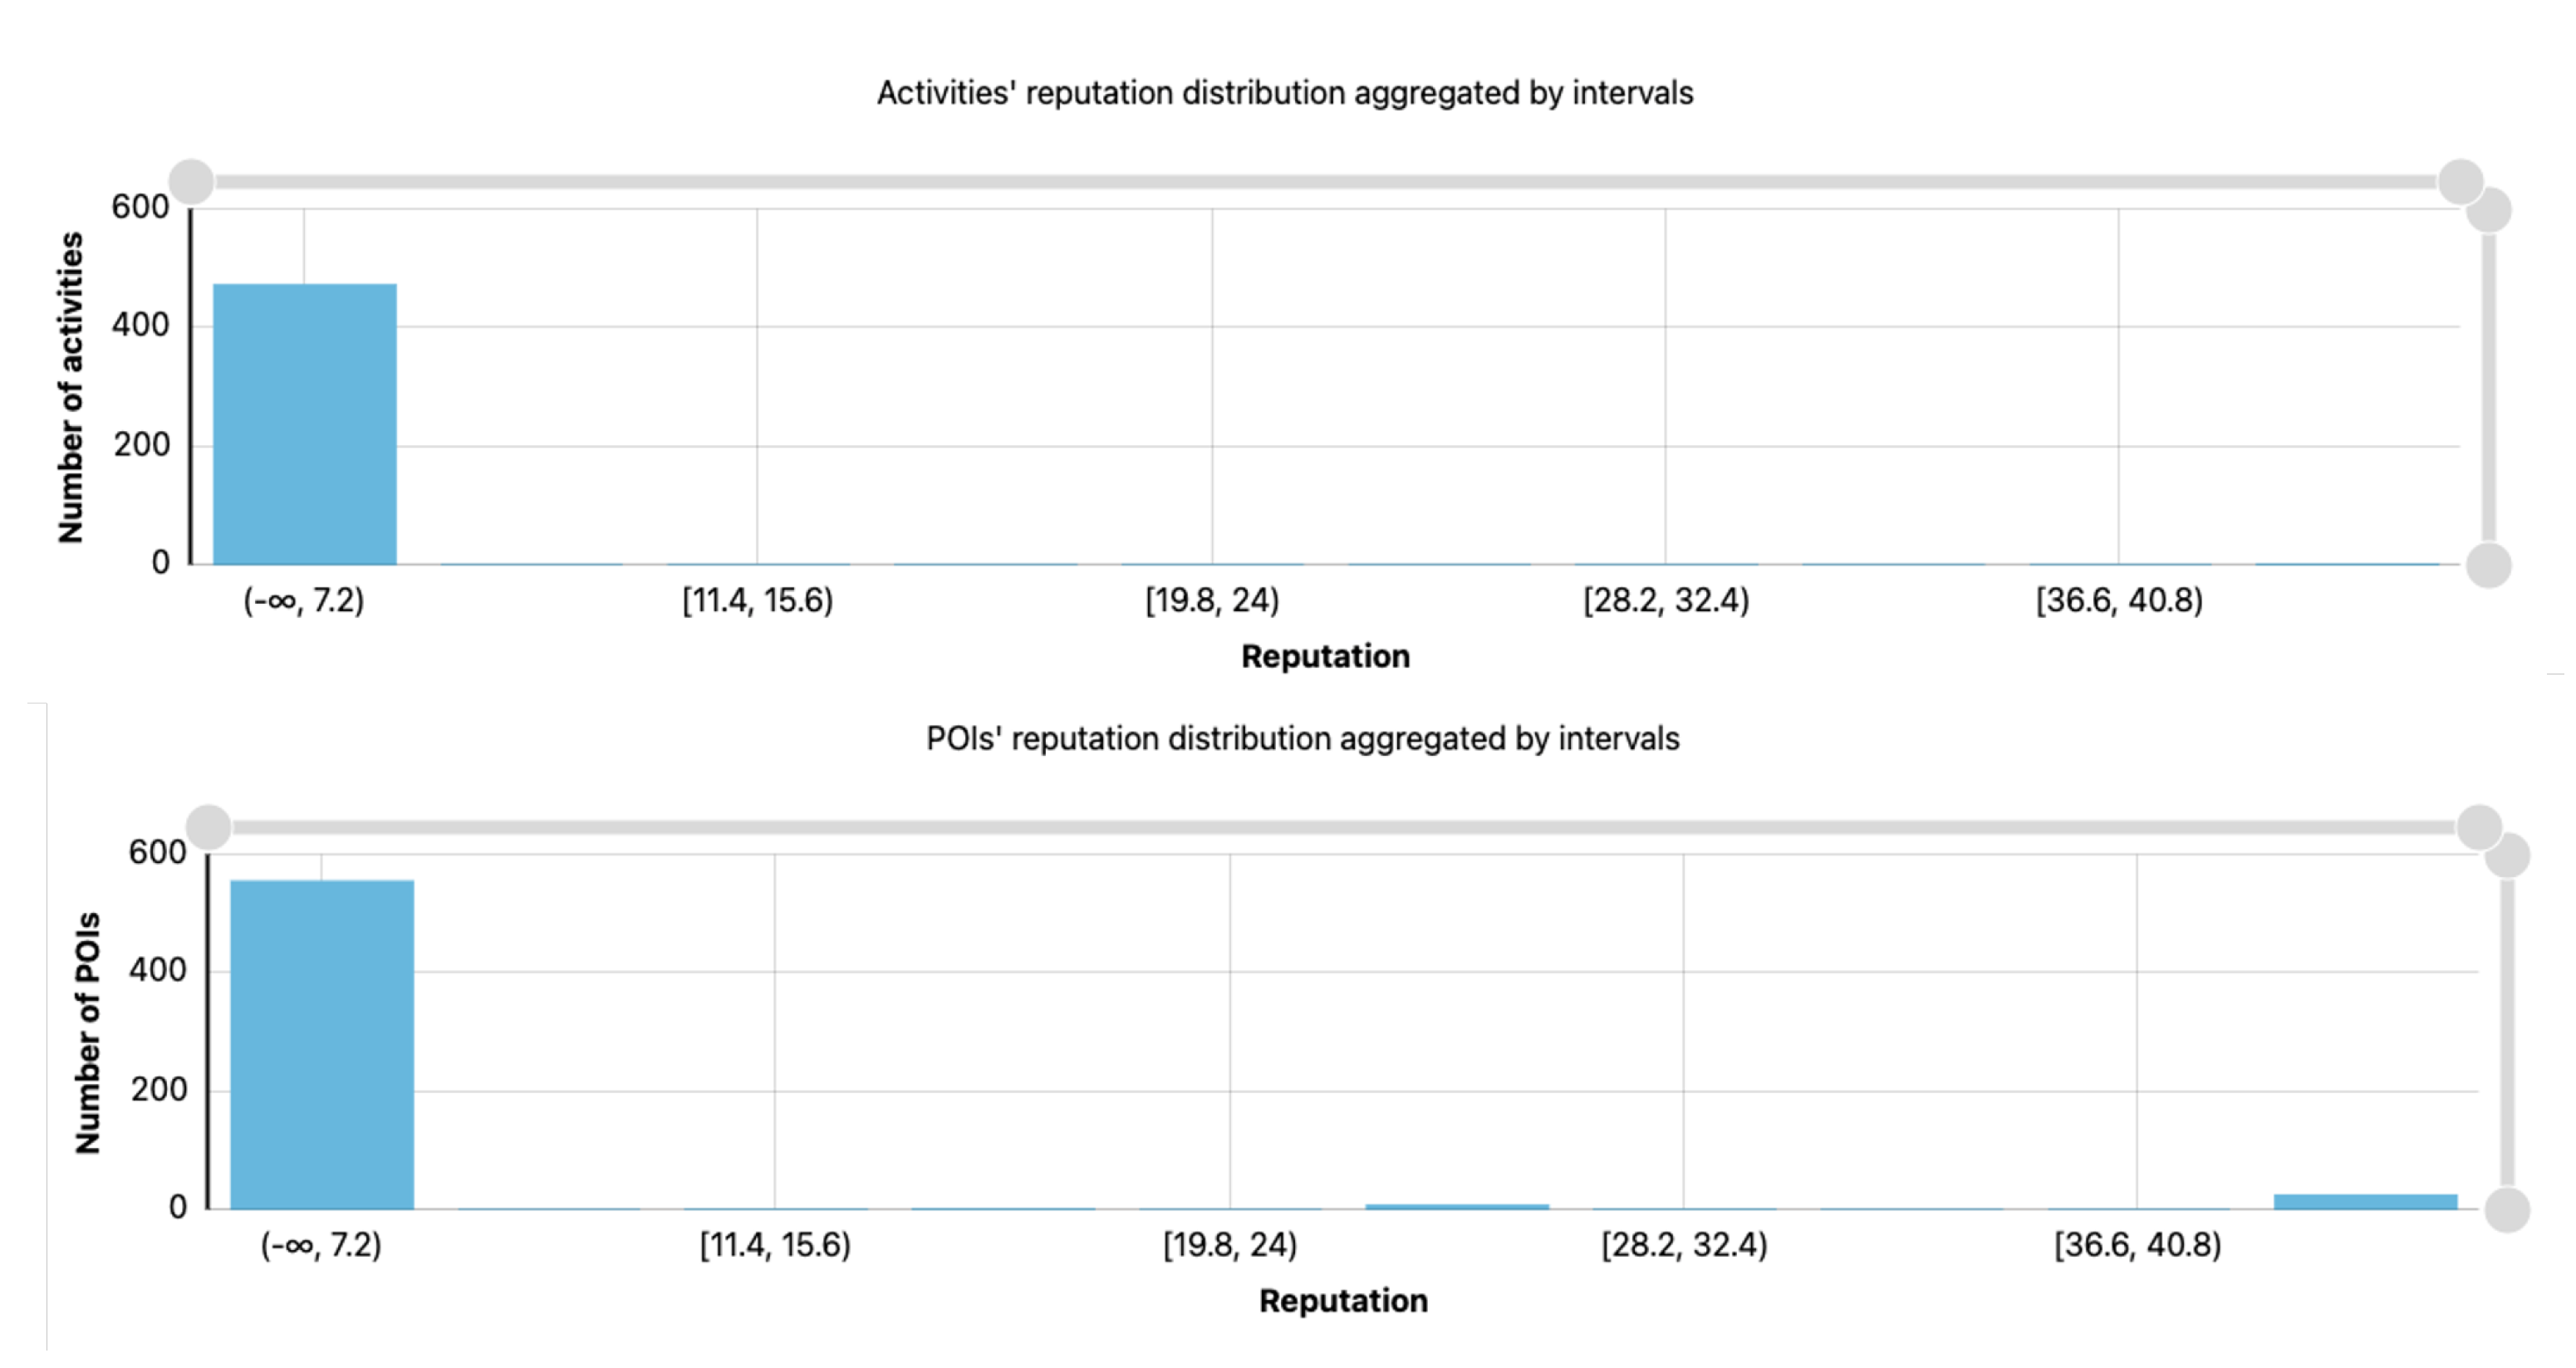
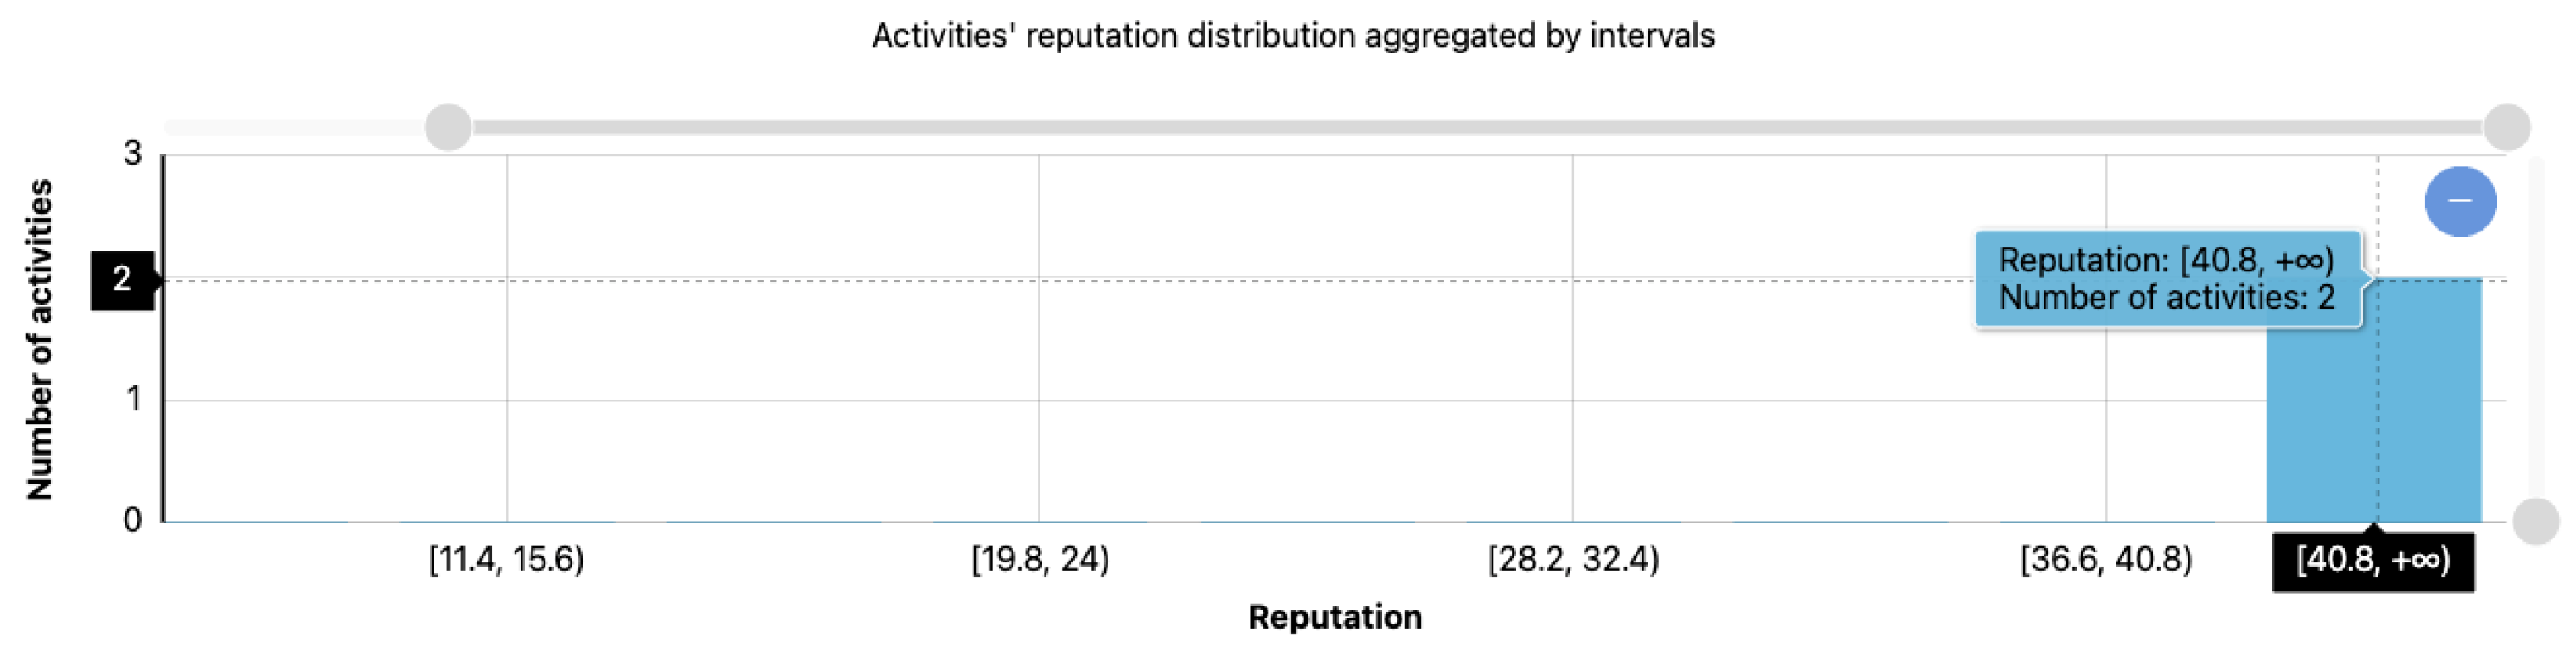
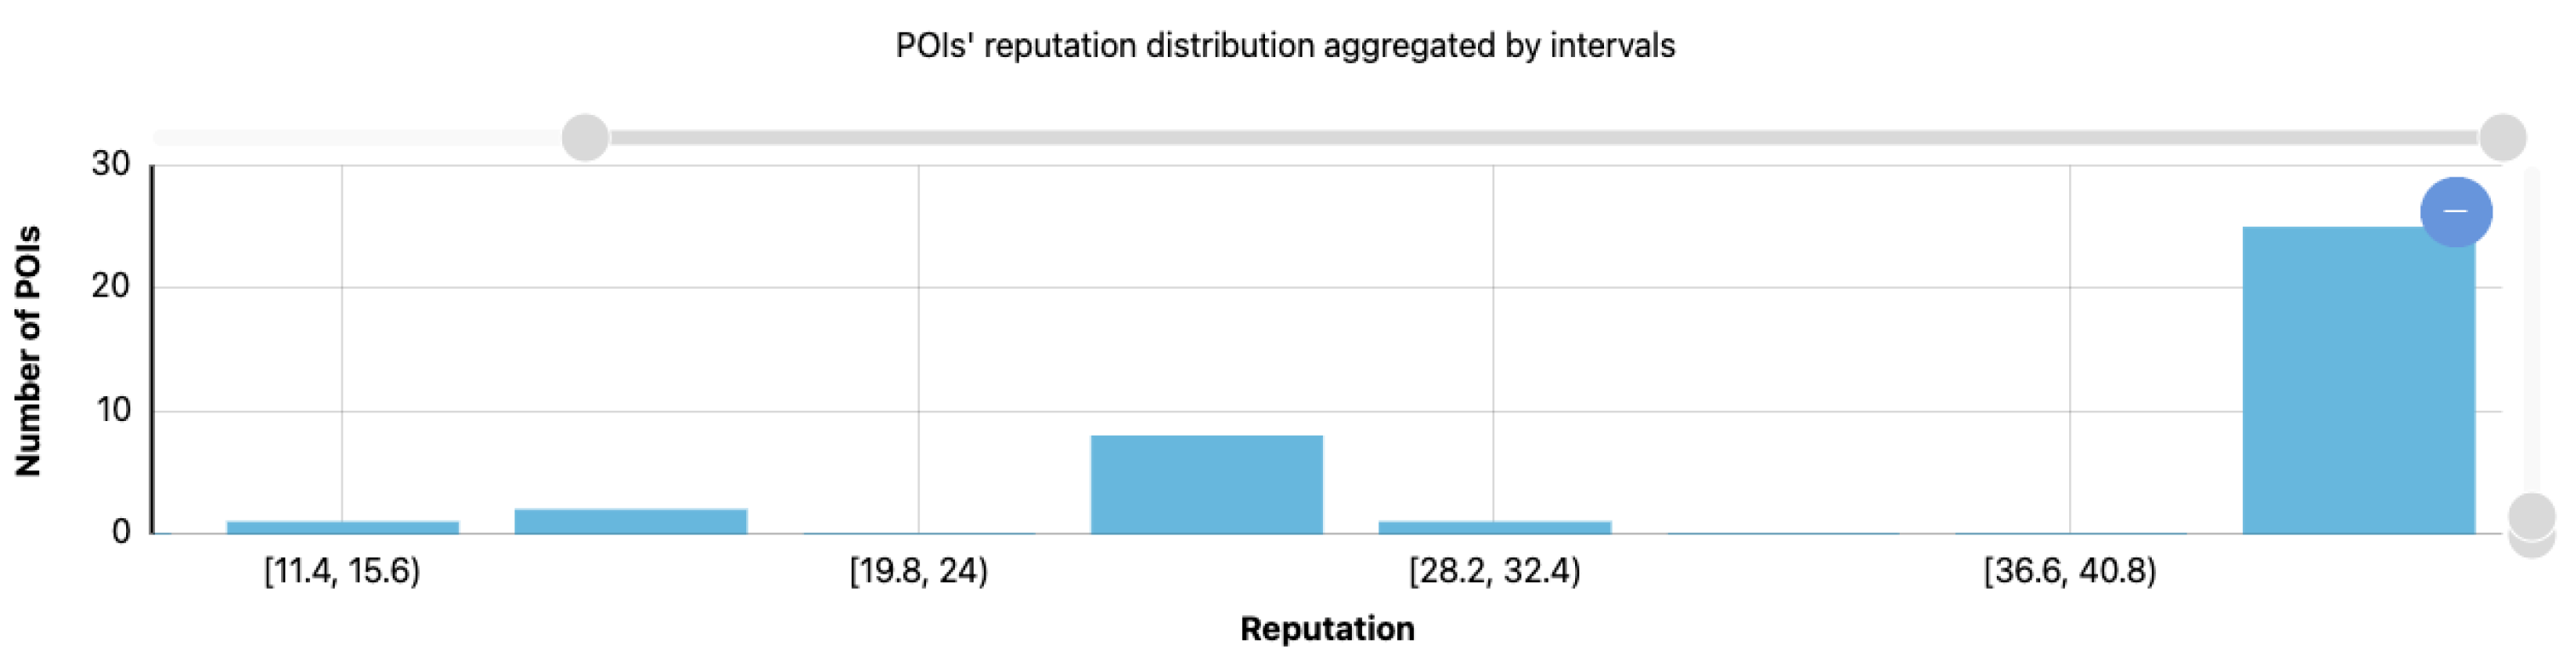
4.2.3. POIs and Activities’ Reputation

As far as the reputation of POIs and activities is concerned, the evaluation that can be made on the basis of the information obtained from the pilots would not truly reflect a real scenario, since the interaction of the real-world live users with this functionality on My-TRAC has not been sufficient. The vast majority of POIs and activities have not been interacted with, so they have no reputation, as can be seen in Figure 12.
If the results are evaluated, leaving aside the activities and POIs that have not been interacted with, the results shown in Figure 13 and Figure 14 are obtained.
Figure 13 shows that users only interacted with two activities, for which they have an average reputation, while Figure 14 shows that users have interacted with a total of 37 POIs.
On the one hand, we can conclude that users interact with POIs more than with the activities offered by the app, despite the fact that there is an even number of options (473 activities and 556 POIs). On the other hand, it can be concluded that users are, in most cases, satisfied with the POIs they visit, as 25 of the 37 POIs they have interacted with have high reputations.

5. Conclusions

Following analysis of the results, the conclusion is that, although the results seems to follow the value distribution patterns that were sought with the initially defined models, the number of active users is still not sufficient to certify that, in a real scenario, it will behave as expected.
However, using the data obtained from the pilots and the simulations, the obtained results were satisfactory, as no unexpected behaviours were detected. Moreover, it is clear that the algorithm encourages users to participate more actively by giving them points rapidly, and that reaching the maximum score is such a difficult task that users need to be engaged before achieving it.
The reputation scores seem to form a normal or Gaussian distribution, with peaks on the higher or lower end, resulting from optimal user behaviour in the synthetic data and from a low participation in the pilots, respectively. In general, active real-world users tend to cluster around the reputation value 50 (the maximum reputation value is 100), which is a desirable result. It does not demotivate users by maintaining their low score, and does not cause them to become bored by giving them the maximum score often. Most users will have around 50 points (out of 100), creating healthy competition against similar users, as they try to surpass their equals and not to be left behind.
Activities and POIs also take advantage of having the same basis; therefore, analogous results are obtained and a similar purpose is fulfilled.
It can, therefore, be concluded that, even though there was not enough data, the goal of allowing users to determine the relevance of users and the actions was fulfilled in the case study conducted on the My-TRAC platform.
This research and its results can be taken advantage of by any user who needs to develop a similar system and apply it in a real-world scenario. For example, a new video platform could adapt the developed basic functions (logarithmic and exponential) to assign a reputation to the content creator and content consumers.
The main limitations of this work are related to the limited data gathered during the pilots phase, adversely affected by the effects of the COVID-19 pandemic on mobility. Moreover, user engagement is measured through the distribution of the reputation scores: an indirect measurement instead of a direct one.
Regarding future research on this topic, user engagement will be measured when the application is launched. The parameters’ limits will be updated in order to obtain a Gaussian distribution shape, with a moderate number of users obtaining the maximum score. If the resulting distribution has several peaks or is chaotic in any sense, more input will be used to obtain a better modelling of the users’ worth.

Author Contributions

Conceptualization, P.C. and A.R.; methodology, D.G.-R.; software, D.G.-R.; validation, J.G.-G., E.A. and P.C.; formal analysis, J.G.-G., E.A. and P.C.; investigation, D.G.-R.; resources, J.G.-G., E.A. and P.C.; data curation, J.G.-G., E.A. and P.C.; writing—original draft preparation, D.G.-R.; writing—review and editing, D.G.-R.; visualization, P.C.; supervision, J.G.-G., E.A. and P.C.; project administration, J.G.-G., E.A. and P.C.; funding acquisition, P.C. All authors have read and agreed to the published version of the manuscript.

Funding

This research has been supported by the European Union’s Horizon 2020 research and innovation program under grant agreement No 777640.

Conflicts of Interest

The authors declare no conflict of interest.

References

  1. Kamargianni, M.; Li, W.; Matyas, M.; Schäfer, A. A critical review of new mobility services for urban transport. Transp. Res. Procedia 2016, 14, 3294–3303. [Google Scholar] [CrossRef] [Green Version]
  2. Dickinson, J.E.; Ghali, K.; Cherrett, T.; Speed, C.; Davies, N.; Norgate, S. Tourism and the smartphone app: Capabilities, emerging practice and scope in the travel domain. Curr. Issues Tour. 2014, 17, 84–101. [Google Scholar] [CrossRef]
  3. Chun, B.N.; Bavier, A. Decentralized trust management and accountability in federated systems. In Proceedings of the 37th Annual Hawaii International Conference on System Sciences, Big Island, HI, USA, 5–8 January 2004; p. 9. [Google Scholar]
  4. Li, N.; Mitchell, J.C.; Winsborough, W.H. Design of a role-based trust-management framework. In Proceedings of the Proceedings 2002 IEEE Symposium on Security and Privacy, Berkeley, CA, USA, 12–15 May 2002; pp. 114–130. [Google Scholar]
  5. Kim, Y.H.; Kim, D.J.; Wachter, K. A study of mobile user engagement (MoEN): Engagement motivations, perceived value, satisfaction, and continued engagement intention. Decis. Support Syst. 2013, 56, 361–370. [Google Scholar] [CrossRef]
  6. Lalmas, M.; O’Brien, H.; Yom-Tov, E. Measuring user engagement. Synth. Lect. Inf. Concepts Retr. Serv. 2014, 6, 1–132. [Google Scholar] [CrossRef] [Green Version]
  7. Bruns, A. Blogs, Wikipedia, Second Life, and beyond: From Production to Produsage; Peter Lang: New York, NY, USA, 2008; Volume 45. [Google Scholar]
  8. Forslund, G. Toward cooperative advice-giving systems: A case study in knowledge-based decision support. IEEE Expert 1995, 10, 56–62. [Google Scholar] [CrossRef]
  9. Josang, A.; Ismail, R. The beta reputation system. In Proceedings of the 15th Bled Electronic Commerce Conference, Bled, Slovenia, 17–19 June 2002; Volume 5, pp. 2502–2511. [Google Scholar]
  10. Kerschbaum, F.; Haller, J.; Karabulut, Y.; Robinson, P. Pathtrust: A trust-based reputation service for virtual organization formation. In Proceedings of the International Conference on Trust Management, Pisa, Italy, 16–19 May 2006; Springer: Berlin/Heidelberg, Germany, 2006; pp. 193–205. [Google Scholar]
  11. Corchado, J.M.; Chamoso, P.; Hernández, G.; Gutierrez, A.S.R.; Camacho, A.R.; González-Briones, A.; Pinto-Santos, F.; Goyenechea, E.; Garcia-Retuerta, D.; Alonso-Miguel, M.; et al. Deepint. net: A Rapid Deployment Platform for Smart Territories. Sensors 2021, 21, 236. [Google Scholar] [CrossRef] [PubMed]
  12. Garcia-Retuerta, D.; Chamoso, P.; Hernández, G.; Guzmán, A.S.R.; Yigitcanlar, T.; Corchado, J.M. An Efficient Management Platform for Developing Smart Cities: Solution for Real-Time and Future Crowd Detection. Electronics 2021, 10, 765. [Google Scholar] [CrossRef]
  13. Page, L.; Brin, S.; Motwani, R.; Winograd, T. The PageRank Citation Ranking: Bringing Order to the Web; Technical Report; Stanford InfoLab: Stanford, CA, USA, 1999. [Google Scholar]
  14. Kamvar, S.D.; Schlosser, M.T.; Garcia-Molina, H. The eigentrust algorithm for reputation management in p2p networks. In Proceedings of the 12th international conference on World Wide Web, Budapest, Hungary, 20–24 May 2003; pp. 640–651. [Google Scholar]
  15. Kurdi, H.A. HonestPeer: An enhanced EigenTrust algorithm for reputation management in P2P systems. J. King Saud Univ. Comput. Inf. Sci. 2015, 27, 315–322. [Google Scholar] [CrossRef] [Green Version]
  16. Adler, B.T.; De Alfaro, L. A content-driven reputation system for the Wikipedia. In Proceedings of the 16th International Conference on World Wide Web, Banff, AB, Canada, 8–12 May 2007; pp. 261–270. [Google Scholar]
  17. Zacharia, G.; Maes, P. Trust management through reputation mechanisms. Appl. Artif. Intell. 2000, 14, 881–907. [Google Scholar] [CrossRef] [Green Version]
  18. Waze. Your Rank and Points—Connected Citizens Program. 2019. Available online: https://wiki.waze.com/wiki/Your_Rank_and_Points (accessed on 12 January 2019).
Figure 1. The user interface of the My-TRAC app.
Electronics 10 01070 g001
Figure 2. Representation of the results obtained with synthetic data for the evaluation of the user reputation model.
Electronics 10 01070 g002
Figure 3. Distribution of the activities’ reputation with the generated synthetic data.
Electronics 10 01070 g003
Figure 4. Reward points for all users (206) points grouped ranges of 10 units.
Electronics 10 01070 g004
Figure 5. Reward points for all users (206) points grouped by units.
Electronics 10 01070 g005
Figure 6. Reward points for active users (143) points grouped in ranges of 10 units.
Electronics 10 01070 g006
Figure 7. Reward points for active users (143) filtered and grouped in ranges of 10 units.
Electronics 10 01070 g007
Figure 8. Users (% and size of sectors) who have obtained a certain amount of reward points (colour) depending on how many times they have opened the app.
Electronics 10 01070 g008
Figure 9. Users (% and size of sectors) who have obtained a certain amount of reward points (colour) depending on how many times they followed a suggested route.
Electronics 10 01070 g009
Figure 10. Reputation values for all users (206), scores grouped in 10 ranges.
Electronics 10 01070 g010
Figure 11. Reputation values for active users (143), scores grouped in 9 ranges.
Electronics 10 01070 g011
Figure 12. Reputation values for all the activities and all the POIs.
Electronics 10 01070 g012
Figure 13. Reputation values for the activities with reputation value > 0.
Electronics 10 01070 g013
Figure 14. Reputation values for the POIs with reputation value > 0.
Electronics 10 01070 g014
Table 1. Equations related to the user reputation, inputs, outputs and factors.
FactorMetrics (Equations)InputsOutputs
Days registered s 1 = w d a t e × c d a t e r d a t e M d a t e c d a t e ,   r d a t e s 1
List of valuations s 2 = w v a l u a t i o n s × log ( 100 × n v a l u a t i o n s M v a l u a t i o n s + 1 ) log ( 2 + 100 ) n v a l u a t i o n s s 2
Number of uses of the application s 3 = w u s e s × n u s e s M u s e s 2 n u s e s s 3
Number of chosen routes s 4 = w r o u t e s × n r o u t e s M r o u t e s 2 n r o u t e s s 4
Table 2. Equations related to the activities’ reputation, inputs, outputs and factors.
FactorMetrics (Equations)InputsOutputs
n-star ratings weighted average s 1 = w r a t i n g × i = 1 n k = 1 n ( r e u s e r k × r a u s e r k , i ) k = 1 n r e u s e r k × 1 M r a t i n g 2 r e u s e r , r a u s e r s 1
Number of views of the activity s 2 = w v i e w s × log ( 50 × n v i e w s n d a y s × M v i e w s + 1 ) log ( 2 + 50 ) n d a y s ,   n v i e w s s 2
Publisher’s Note: MDPI stays neutral with regard to jurisdictional claims in published maps and institutional affiliations.

