
An Active/Reactive Power Control Strategy for Renewable Generation Systems

 , ,
, ,  and
and
Abstract
1. Introduction
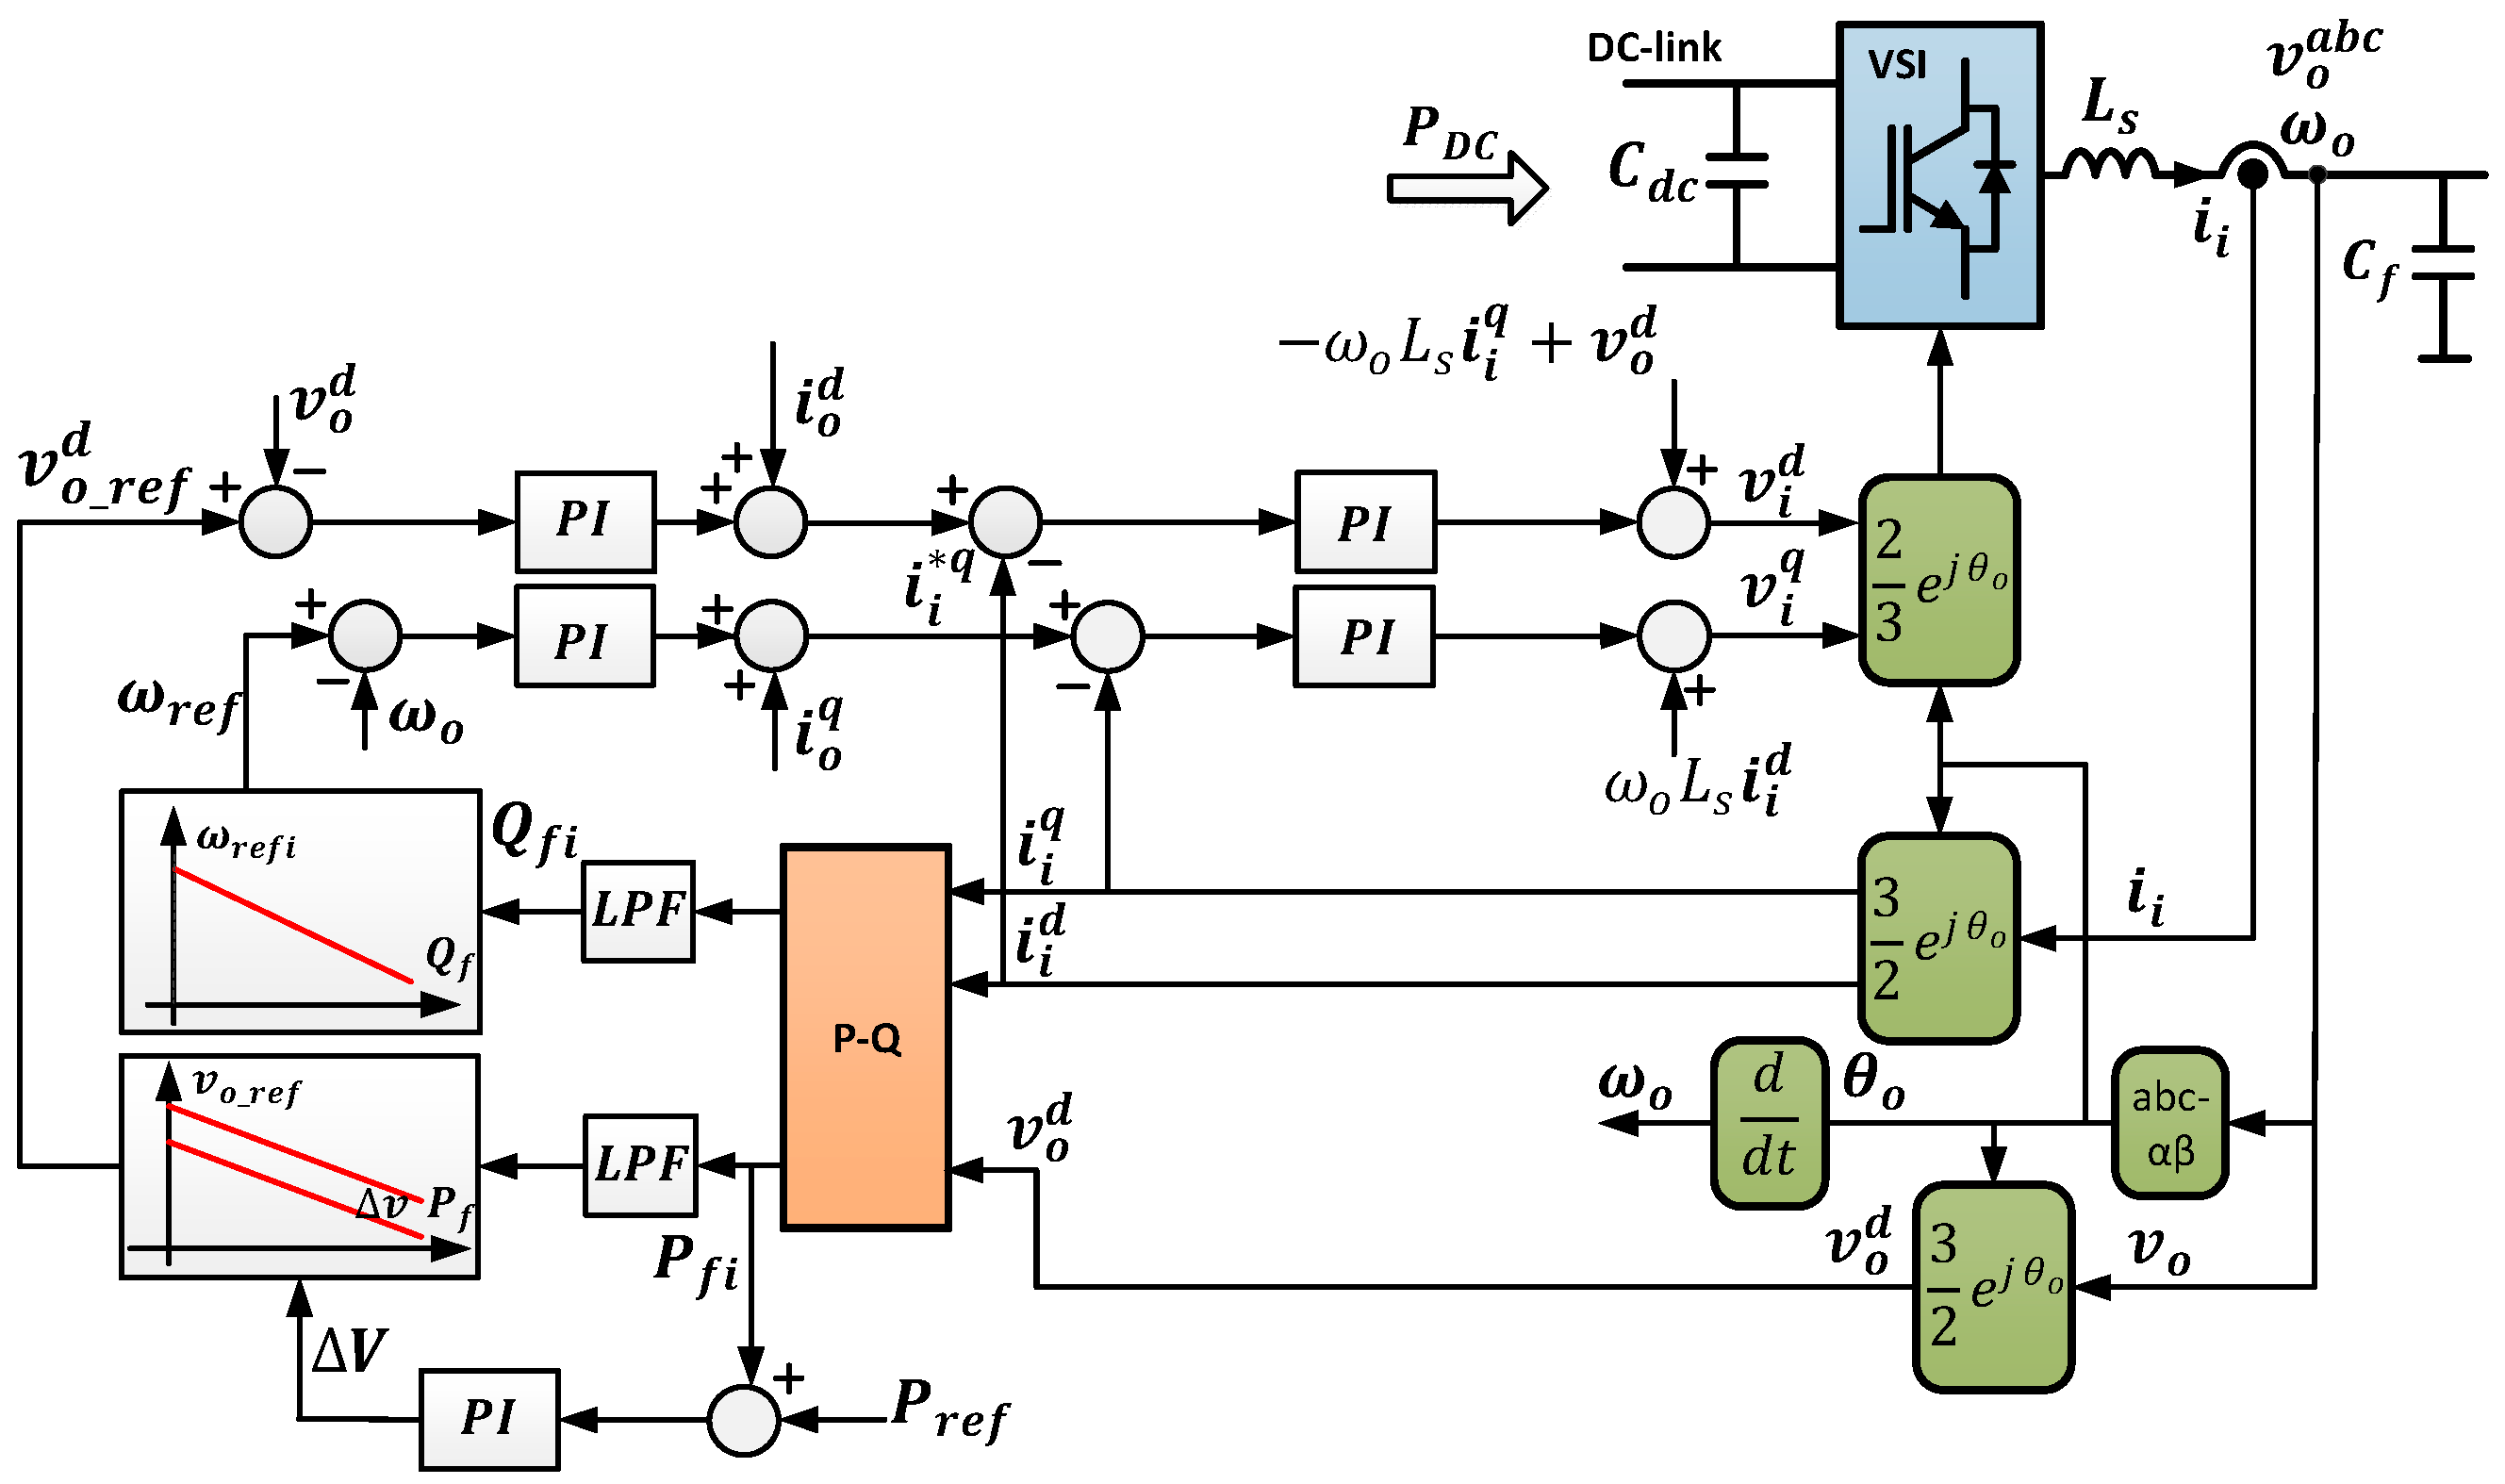
2. System Model
3. Control Scheme
3.1. Control of Currents ii,d and
3.2. Control of Voltage
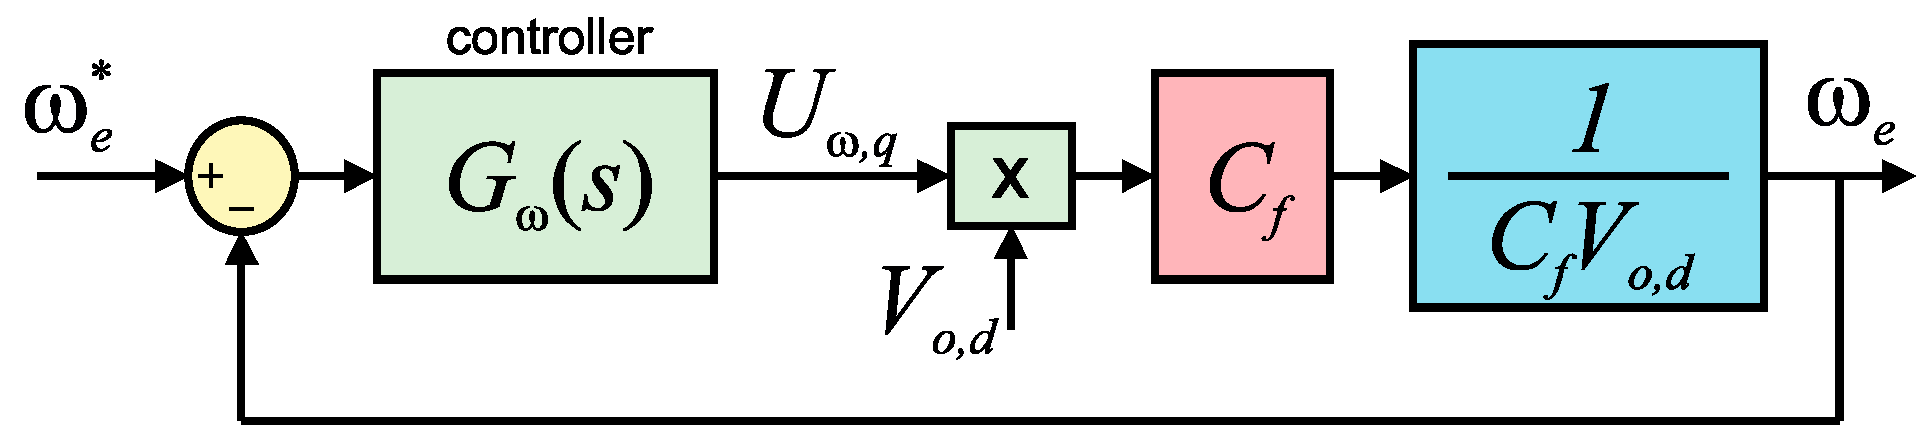
3.3. Frequency Control
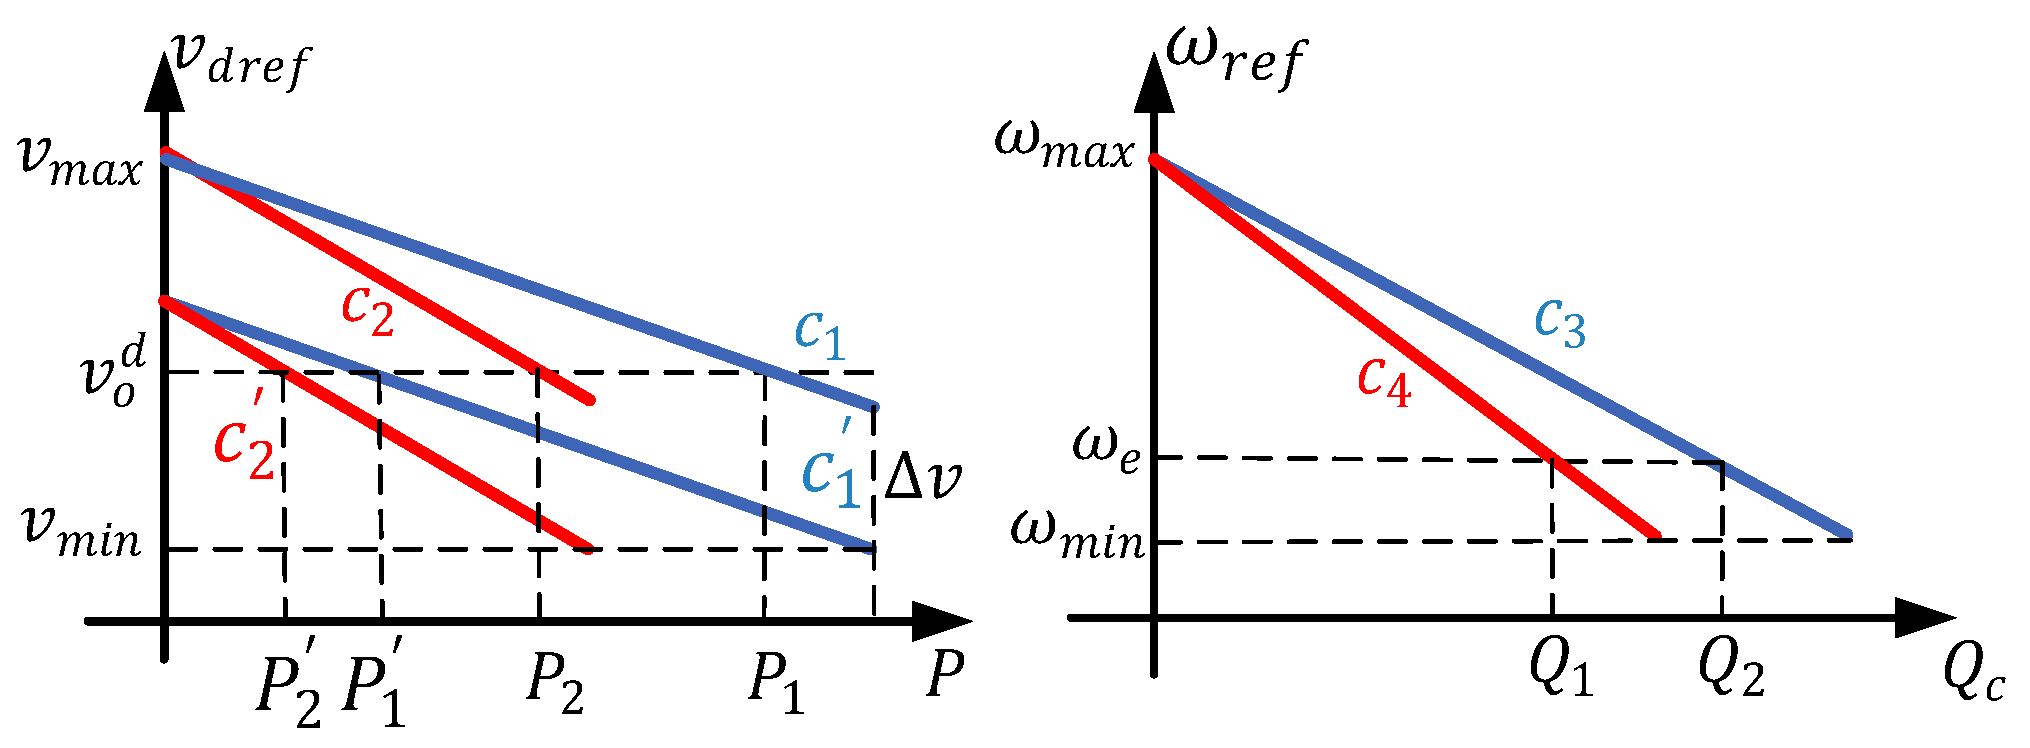
3.4. Control of Active/Reactive Power
4. Results
4.1. Solar PV Generation System
4.2. Wind Energy Generation System
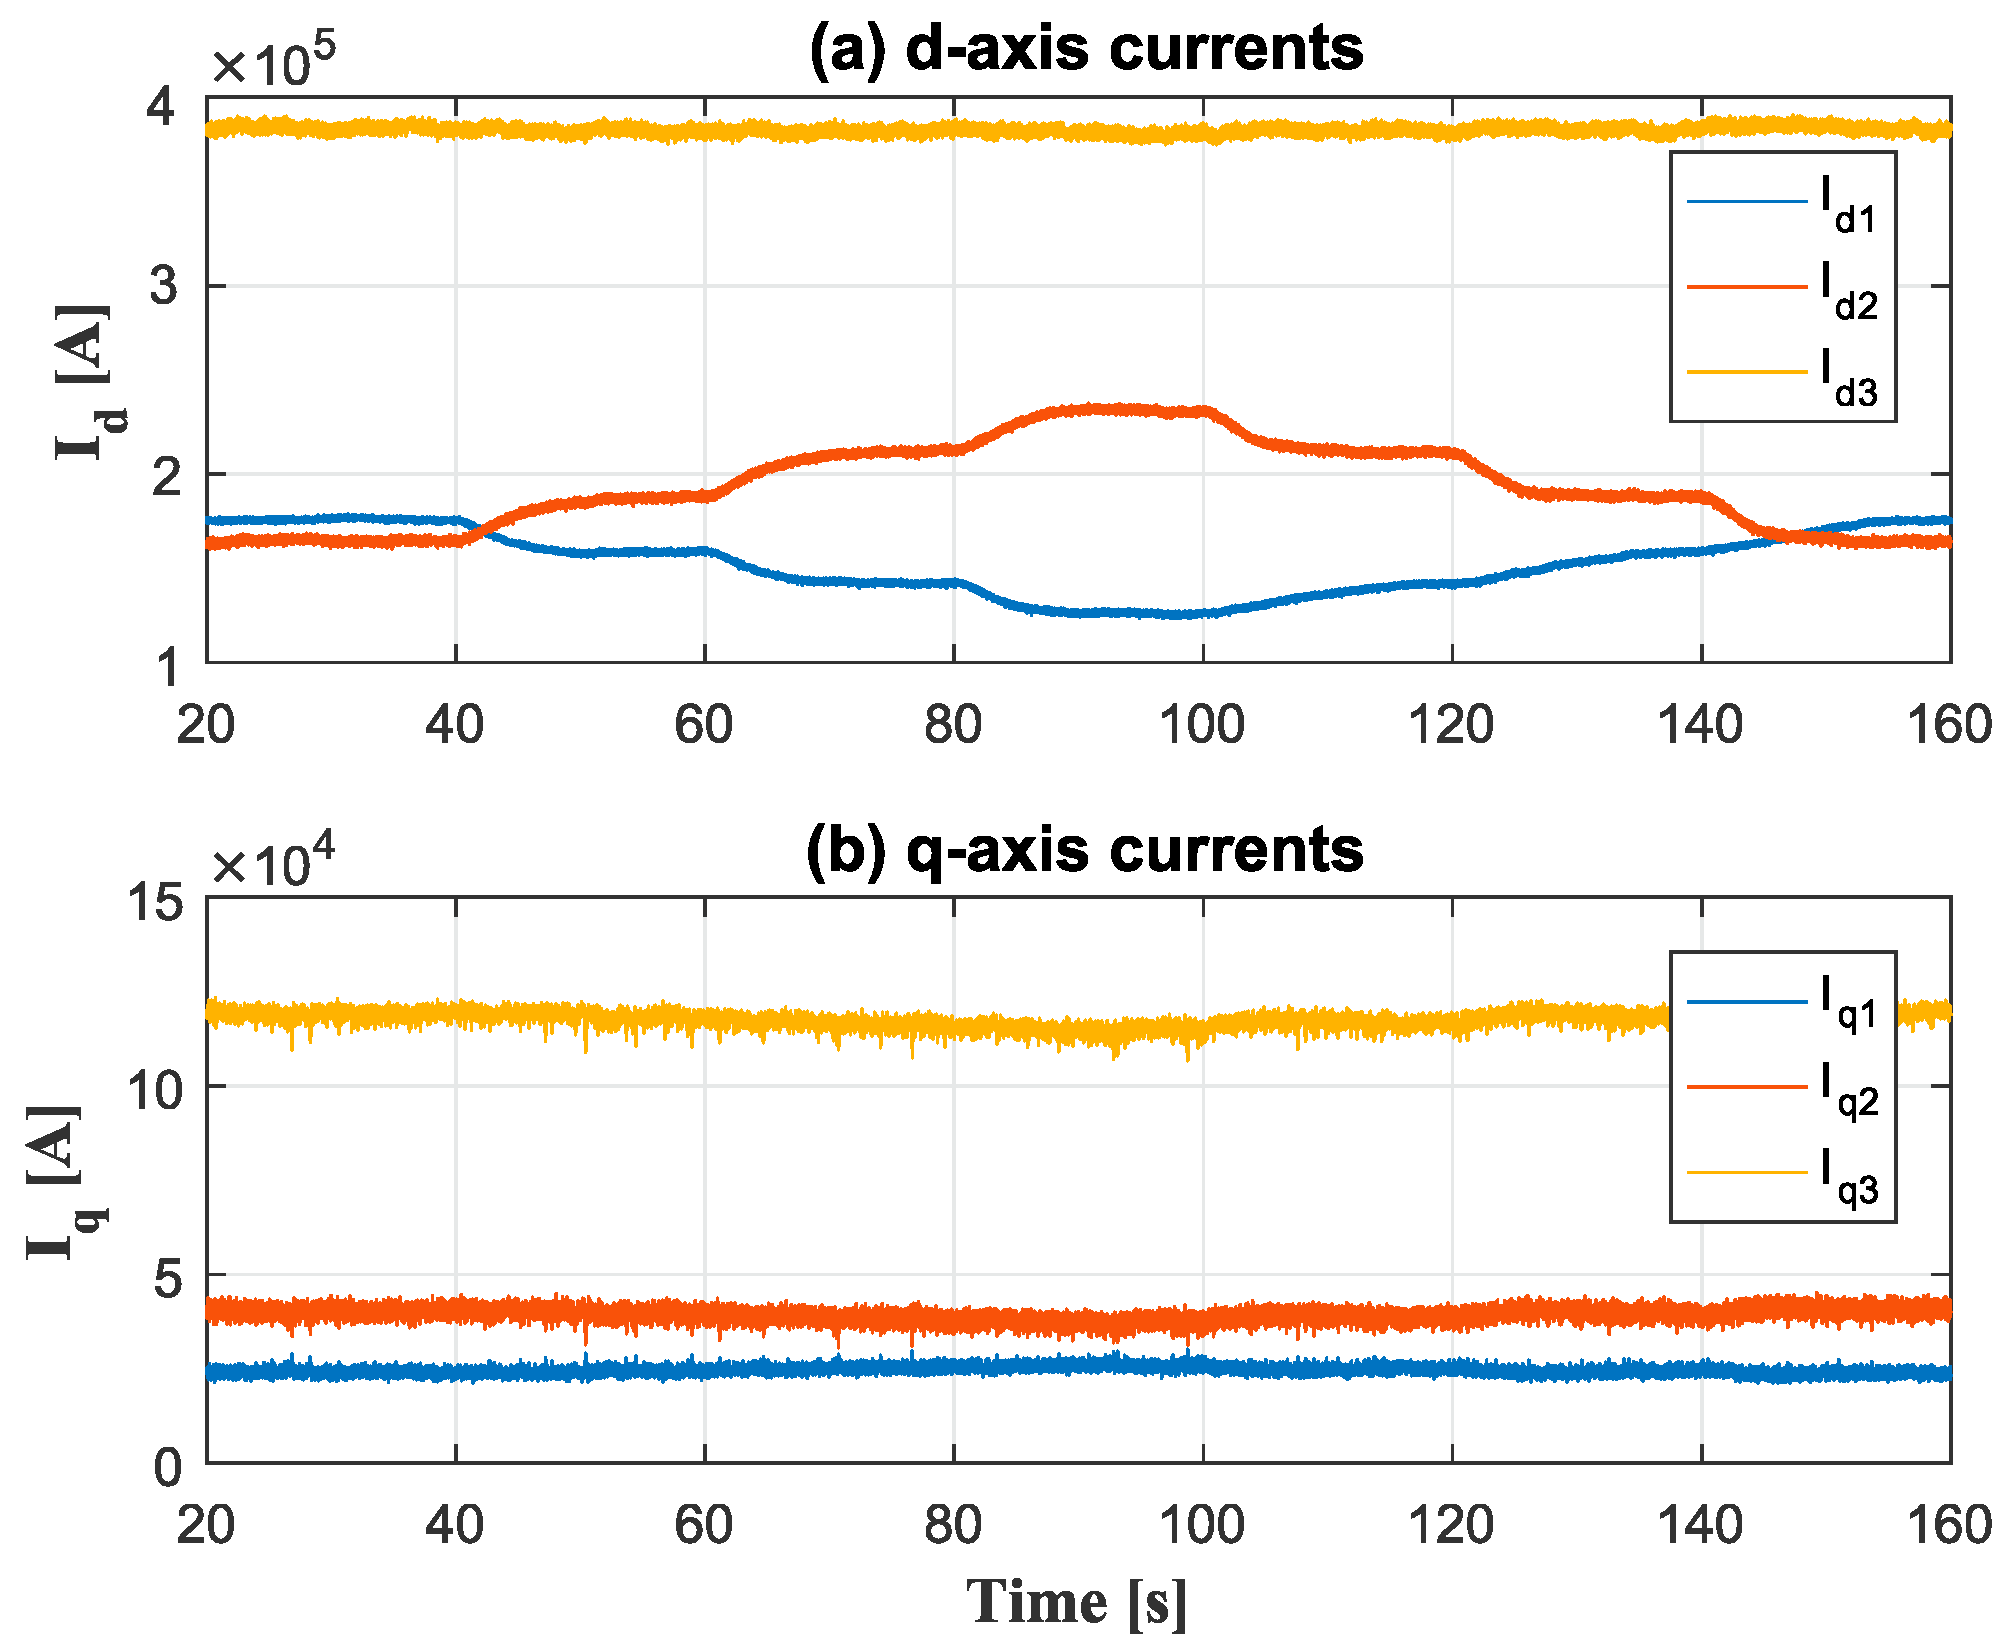
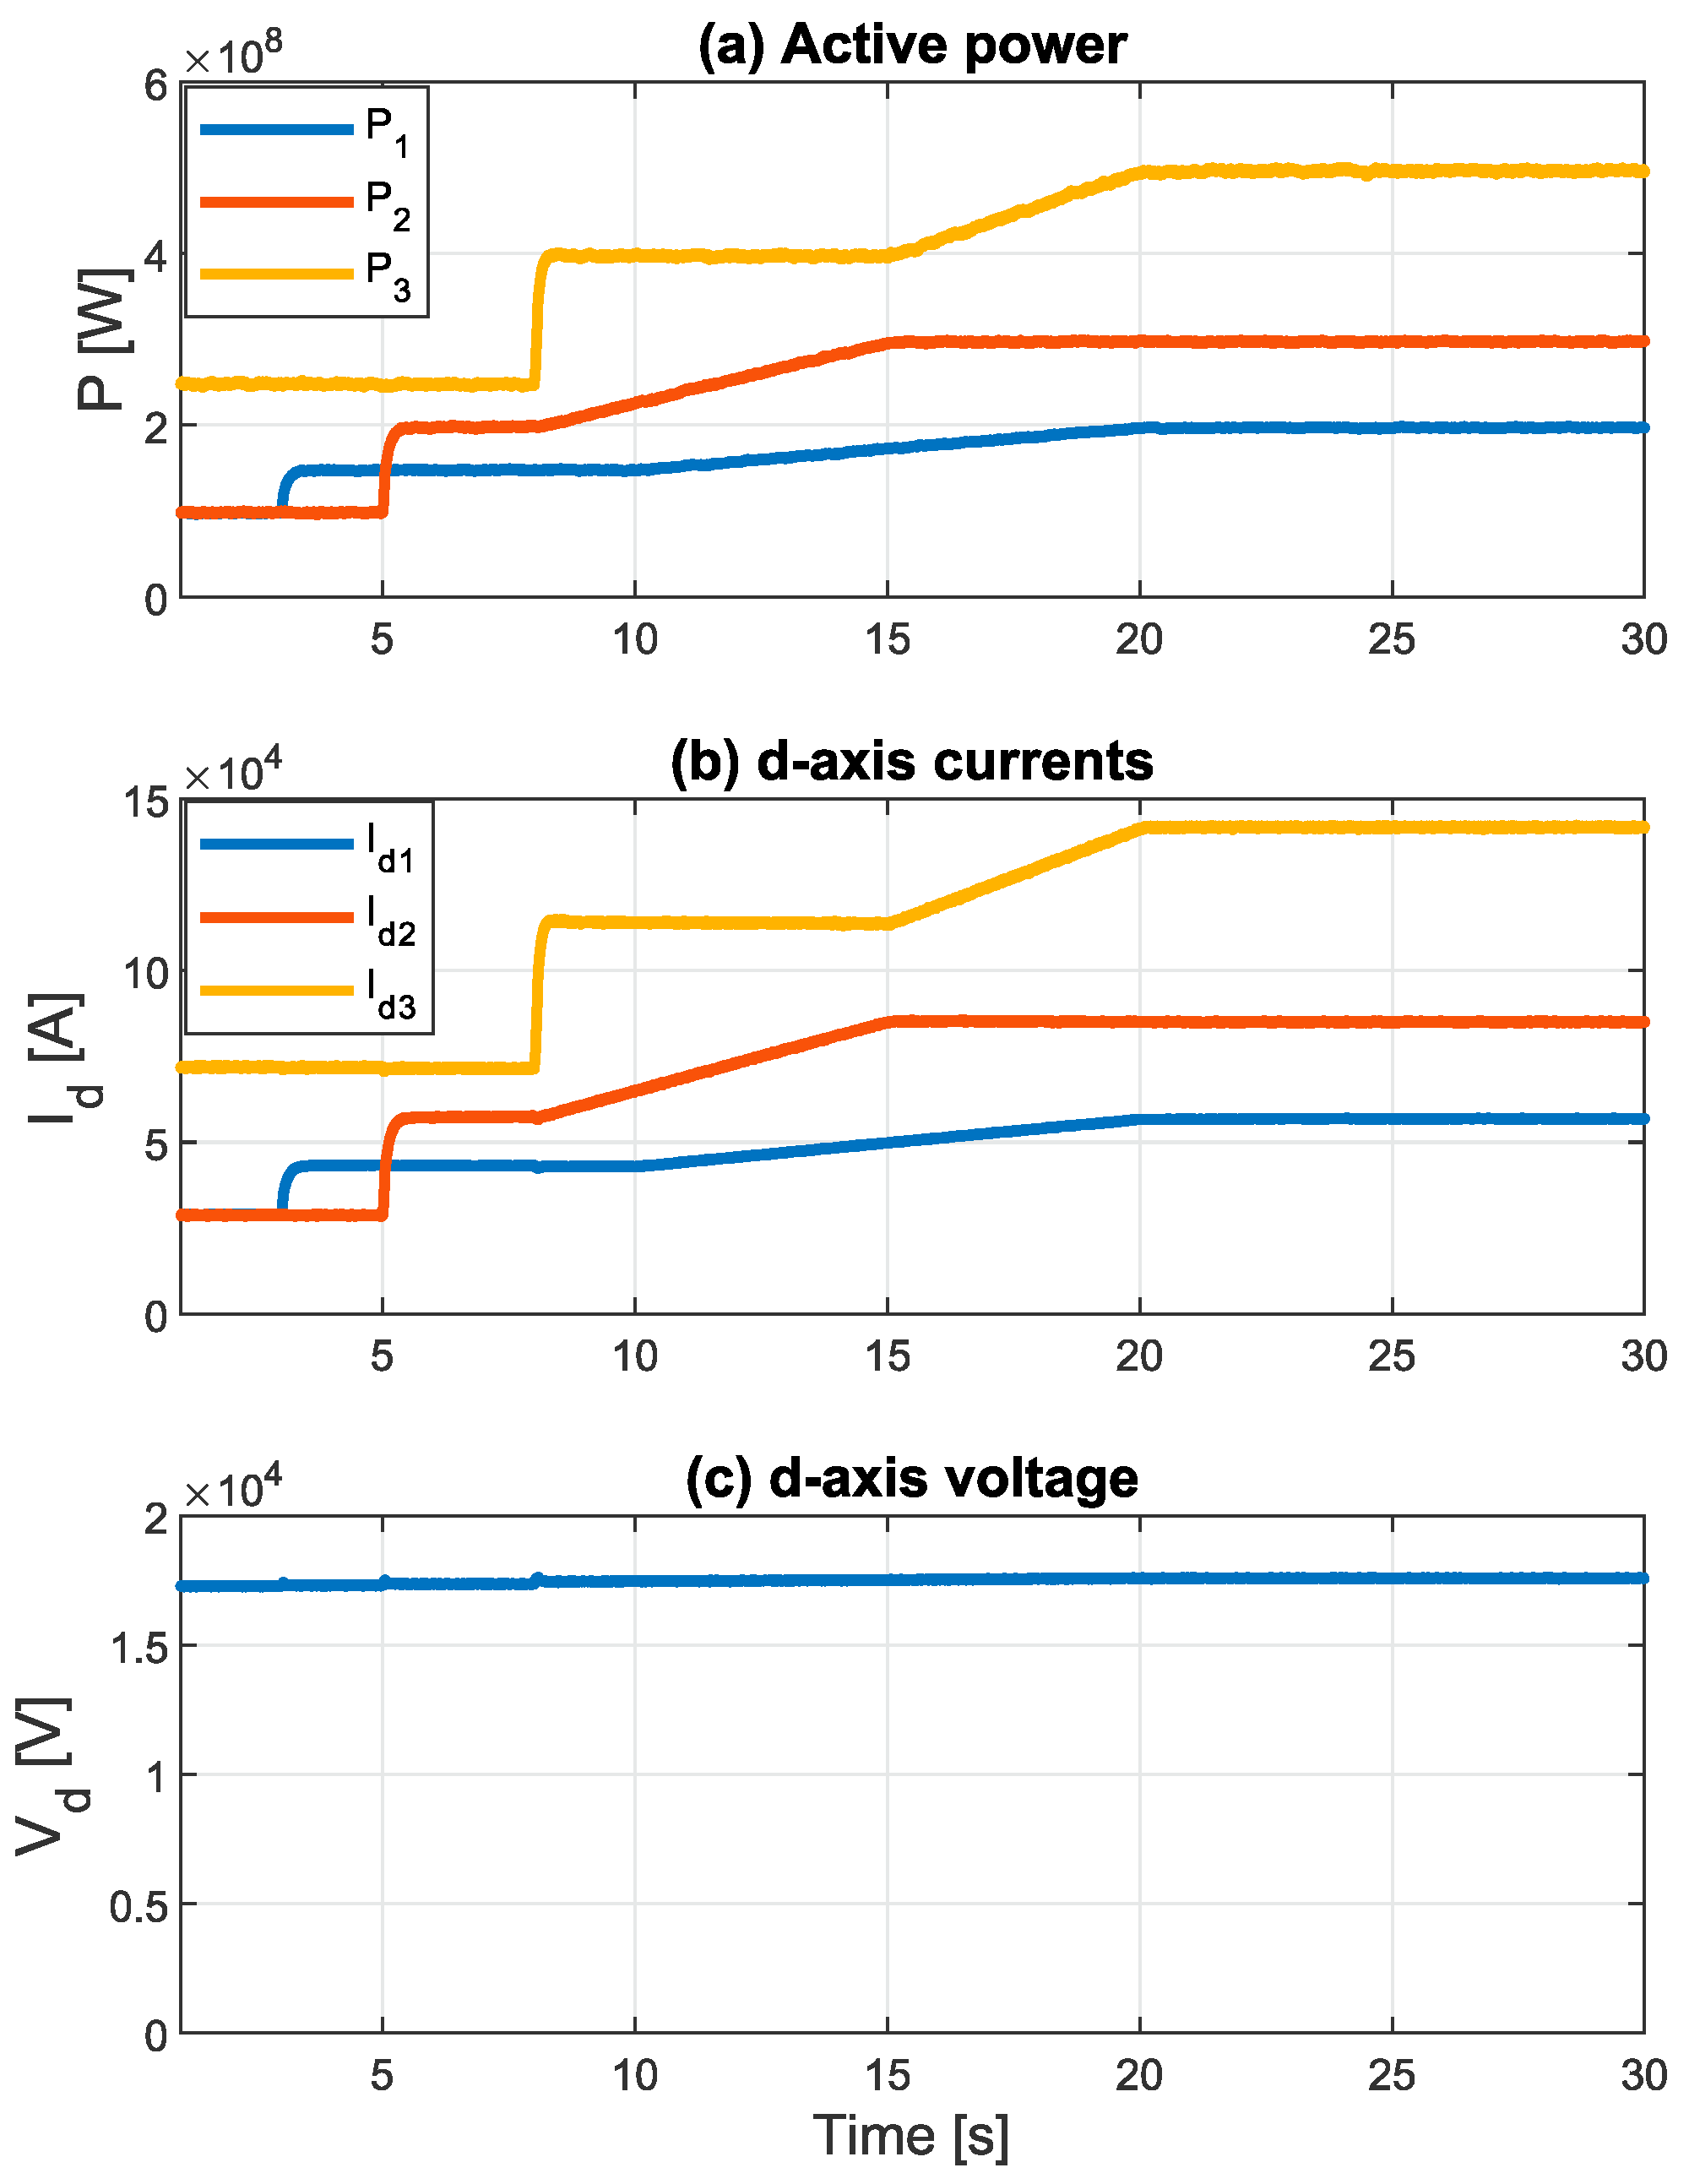
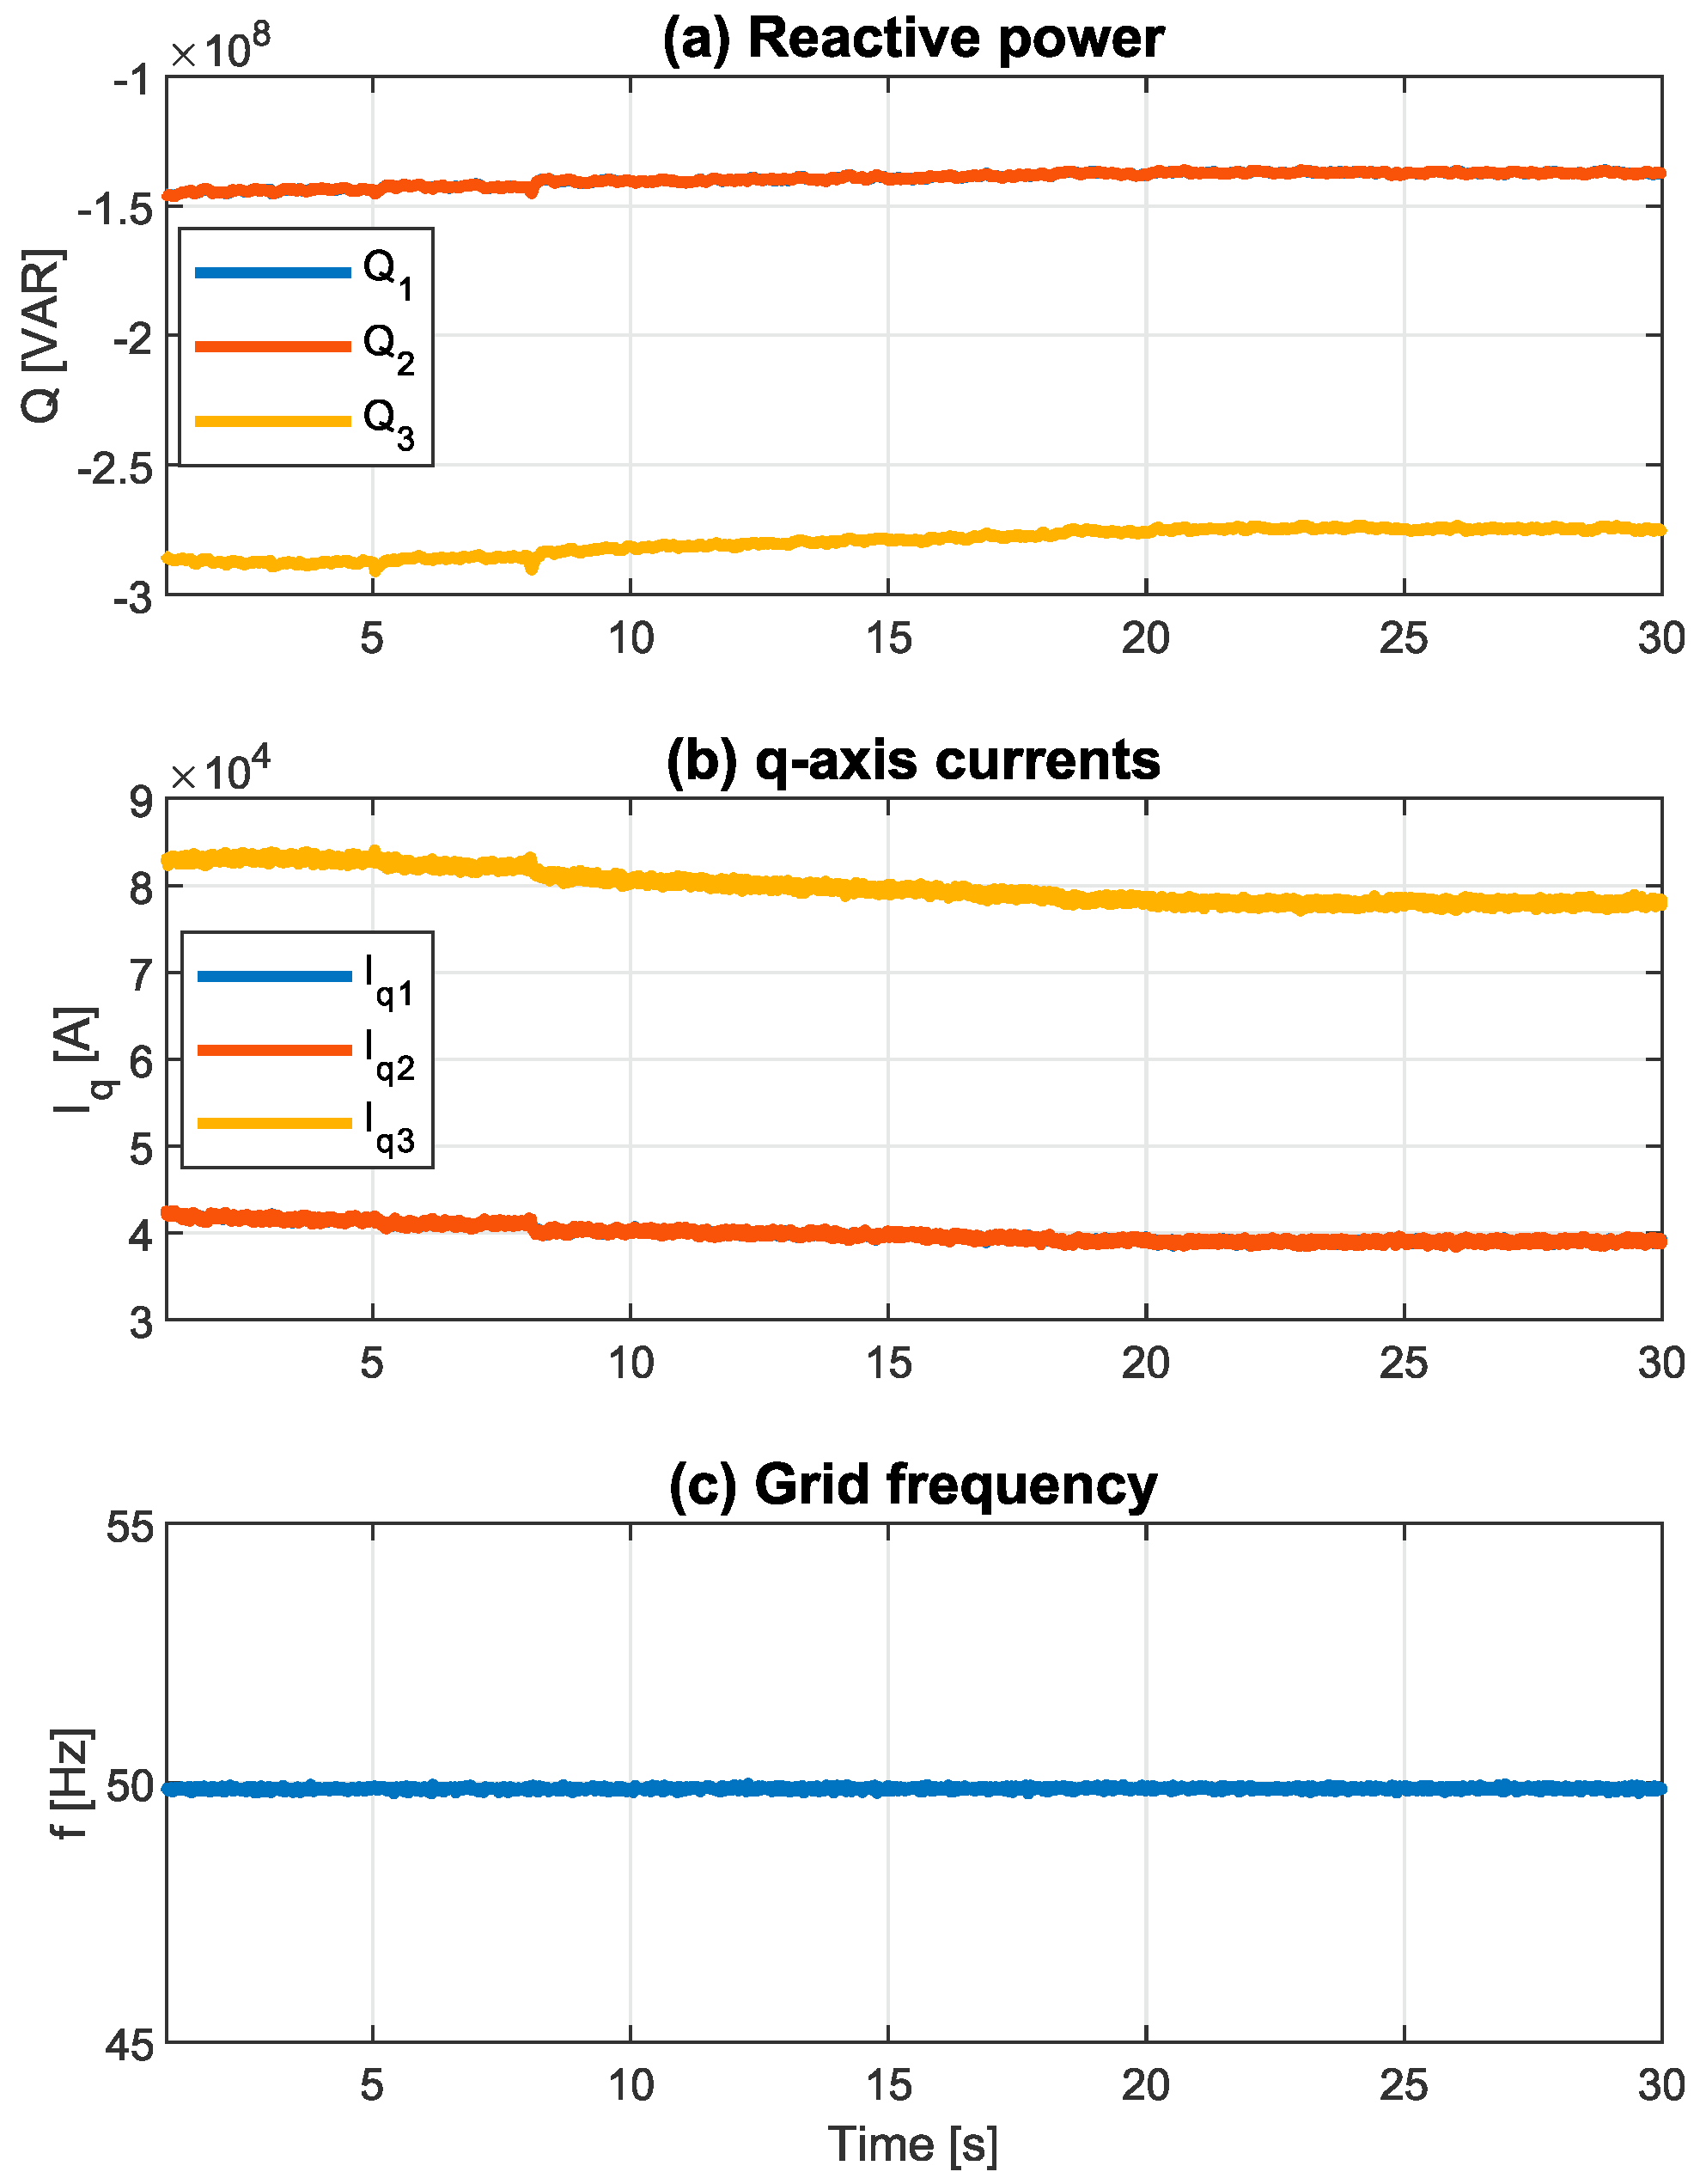
4.2.1. Step and Ramp Changes in the Power Reference
4.2.2. Wind Power Profile
4.3. Discussion
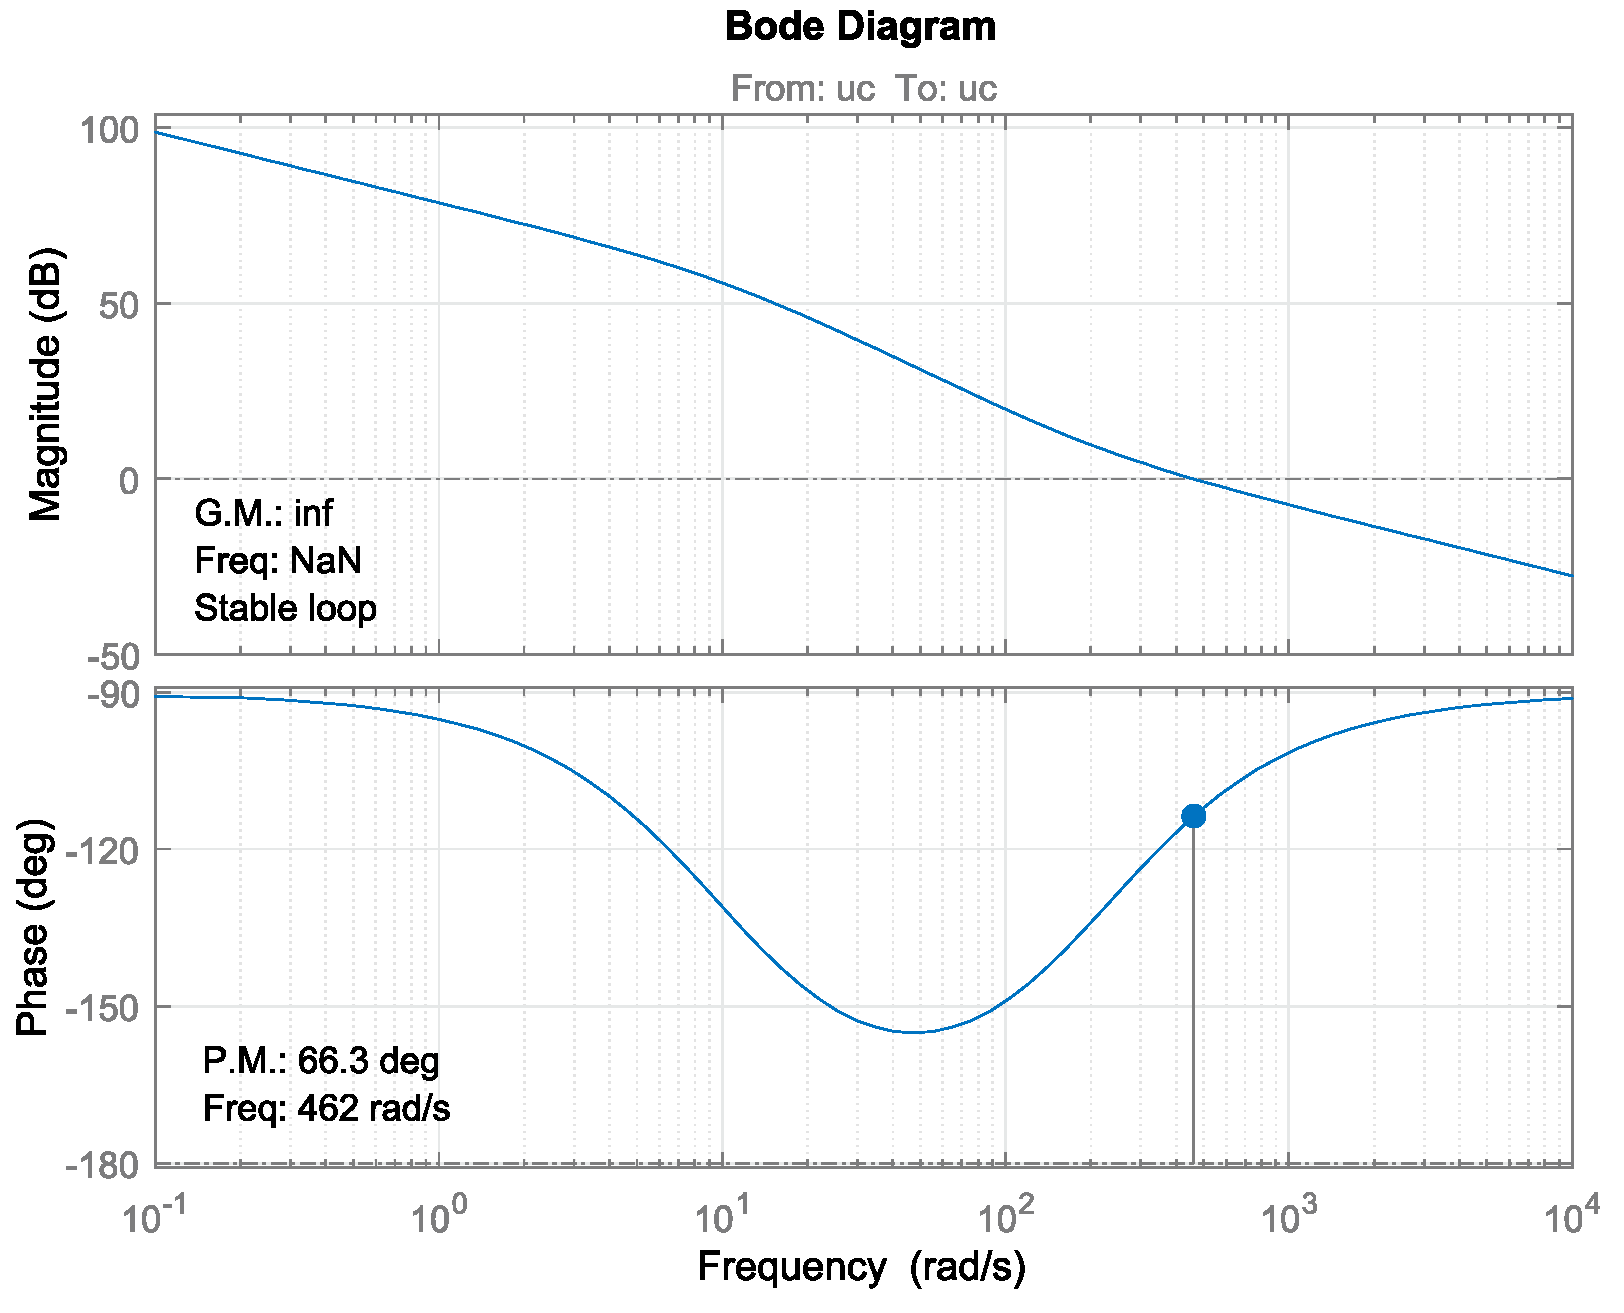
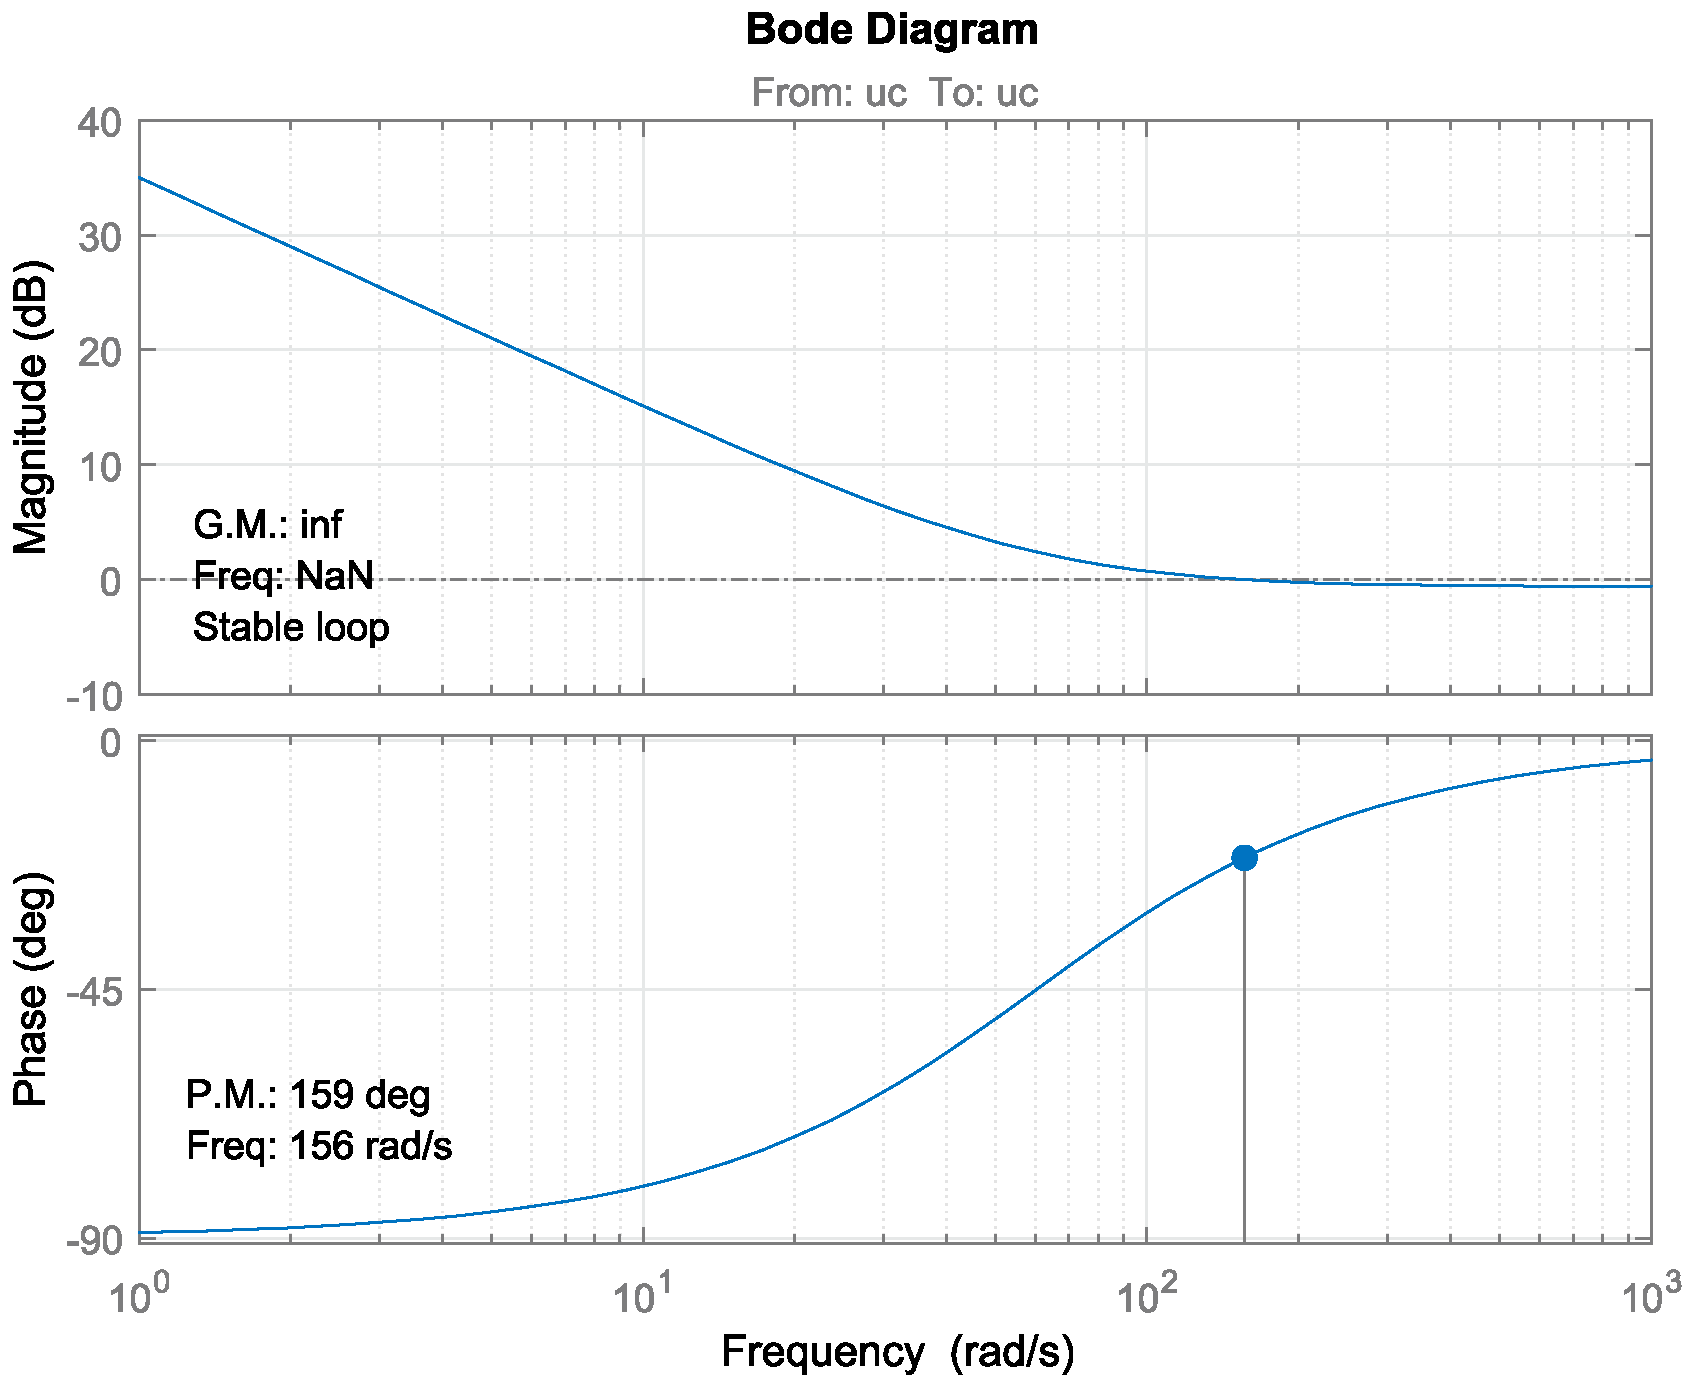
4.4. Brief Stability Analysis
5. Conclusions
Author Contributions
Funding
Conflicts of Interest
References
- SolarPower Europe. Global Market Outlook for Solar Power 2020–2024. 2020. Available online: https://www.solarpowereurope.org/global-market-outlook-2020-2024/ (accessed on 8 March 2021).
- Renewables 2020 Global Status Report. In Renewable Energy Policy Network for the 21st Century; REN21 Secretariat: Paris, France, 2017; Available online: http://www.ren21.net/global-status-report/ (accessed on 1 April 2021).
- Radwan, A.A.; Mohamed, Y.A.I. Grid-Connected Wind-Solar Cogeneration Using Back-to-Back Voltage-Source Converters. IEEE Trans. Sustain. Energy 2020, 11, 315–325. [Google Scholar] [CrossRef]
- Blaabjerg, F.; Chen, Z.; Kjaer, S.B. Power electronics as efficient interface in dispersed power generation systems. IEEE Trans. Power Electron. 2004, 19, 1184–1194. [Google Scholar] [CrossRef]
- Carrasco, J.; Franquelo, L.; Bialasiewicz, J.; Galvan, E.; PortilloGuisado, R.; Prats, M.; Leon, J.; Moreno-Alfonso, N. Power-electronic systems for the grid integration of renewable energy sources—A survey. IEEE Trans. Ind. Electron. 2006, 53, 1002–1016. [Google Scholar] [CrossRef]
- Hannan, M.; Hussin, I.; Ker, P.; Hoque, M.; Hossain, M.; Hussain, A.; Rahman, M.; Faizal, C.; Blaabjerg, F. Advanced Control Strategies of VSC Based HVDC Transmission System: Issues and Potential Recommendations. IEEE Access 2018, 6, 78352–78369. [Google Scholar] [CrossRef]
- Wang, L.; Wang, K.; Lee, W.; Chen, Z. Power-Flow Control and Stability Enhancement of Four Parallel-Operated Offshore Wind Farms Using a Line-Commutated HVDC Link. IEEE Trans. Power Deliv. 2010, 25, 1190–1202. [Google Scholar] [CrossRef]
- Fan, X.M.; Guan, L.; Xia, C.J.; He, J.M.; Xu, S.K.; Li, X.L. Active power control of VSC-HVDC transmission linked islanded wind farm. In Proceedings of the 2nd IET Renew, Power Generation Conference (RPG 2013), Beijing, China, 9–11 September 2013; 2013; pp. 1–6. [Google Scholar]
- Zhao, C.; Guo, C. Complete-independent control strategy of active and reactive power for VSC based HVDC system. In Proceedings of the 2009 IEEE Power & Energy Society General Meeting, Calgary, AB, Canada, 26–30 July 2009; pp. 1–6. [Google Scholar]
- Rodríguez-Amenedo, J.L.; Arnaltes-Gómez, S.; Aragüés-Peñalba, M.; Gomis-Bellmunt, O. Control of the Parallel Operation of VSC-HVDC Links Connected to an Offshore Wind Farm. IEEE Trans. Power Deliv. 2019, 34, 32–41. [Google Scholar] [CrossRef]
- Guo, Y.; Gao, H.; Wu, Q.; Zhao, H.; Østergaard, J.; Shahidehpour, M. Enhanced Voltage Control of VSC-HVDC-Connected Offshore Wind Farms Based on Model Predictive Control. IEEE Trans. Sustain. Energy 2018, 9, 474–487. [Google Scholar] [CrossRef]
- Nanou, S.I.; Papathanassiou, S.A. Frequency Control of Island VSC-HVDC Links Operating in Parallel with AC Interconnectors and Onsite Generation. IEEE Trans. Power Deliv. 2018, 33, 447–454. [Google Scholar] [CrossRef]
- Tamakoshi, Y.; Imanaka, M.; Kurimoto, M.; Sugumoto, S.; Takeyoshi. An Experimental Study on Fast Frequency Response of Multiple Photovoltaic Power Generations. In Proceedings of the 2019 IEEE Power & Energy Society General Meeting (PESGM), Atlanta, GA, USA, 4–8 August 2019; pp. 1–5. [Google Scholar]
- Vasquez, J.C.; Guerrero, J.M.; Luna, A.; Rodriguez, P.; Teodorescu, R. Adaptive Droop Control Applied to Voltage-Source Inverters Operating in Grid-Connected and Islanded Modes. IEEE Trans. Ind. Electron. 2009, 56, 4088–4096. [Google Scholar] [CrossRef]
- Li, Y.; Xu, Z.; Zhang, J.; Meng, K. Variable Droop Voltage Control for Wind Farm. IEEE Trans. Sustain. Energy 2018, 9, 491–493. [Google Scholar] [CrossRef]
- Meng, X.; Liu, J.; Liu, Z. A Generalized Droop Control for Grid-Supporting Inverter Based on Comparison between Traditional Droop Control and Virtual Synchronous Generator Control. IEEE Trans. Power Electron. 2019, 34, 5416–5438. [Google Scholar] [CrossRef]
- Kushwah, R.S.; Walke, G.R. Parallel Operation of Inverters with Droop Control of Voltage and Frequency. In Proceedings of the 2018 International Conference on Smart City and Emerging Technology (ICSCET), Mumbai, India, 5 January 2018; pp. 1–5. [Google Scholar]
- Raj, D.C.; Gaonkar, D.N. Frequency and voltage droop control of parallel inverters in microgrid. In Proceedings of the 2016 2nd International Conference on Control, Instrumentation, Energy & Communication (CIEC), Kolkata, India, 28–30 January 2016; pp. 407–411. [Google Scholar]
- Ye, H.; Liu, Y.; Pei, W.; Kong, L. Efficient droop-based primary frequency control from variable-speed wind turbines and energy storage systems. In Proceedings of the 2017 IEEE Transportation Electrification Conference and Expo, Asia-Pacific (ITEC Asia-Pacific), Harbin, China, 7–10 August 2017; pp. 1–5. [Google Scholar]
- Wu, D.; Tang, F.; Vasquez, J.C.; Guerrero, J.M. Control and analysis of droop and reverse droop controllers for distributed generations. In Proceedings of the 2014 IEEE 11th International Multi-Conference on Systems, Signals & Devices (SSD14), Barcelona, Spain, 11–14 February 2014; 2014; pp. 1–5. [Google Scholar]
- Trivedi, A.; Jain, D.K.; Singh, M. A modified droop control method for parallel operation of VSI’s in microgrid. In Proceedings of the 2013 IEEE Innovative Smart Grid Technologies-Asia (ISGT Asia), Bangalore, India, 10–13 November 2013; 2013; pp. 1–5. [Google Scholar]
- Imran, R.M.; Wang, S.; Flaih, F.M.F. DQ-Voltage Droop Control and Robust Secondary Restoration with Eligibility to Operate During Communication Failure in Autonomous Microgrid. IEEE Access 2019, 7, 6353–6361. [Google Scholar] [CrossRef]
- Li, Y.; Fan, L. Stability Analysis of Two Parallel Converters with Voltage–Current Droop Control. IEEE Trans. Power Deliv. 2017, 32, 2389–2397. [Google Scholar] [CrossRef]
- Andrade, I.; Peña, R.; Blasco-Gimenez, R.; Riedemann, J.; Pesce, C. Droop control strategy for voltage source converters containing renewable power sources. In ELECTRIMACS 2019; Springer: Chem, Switzerland, 2020; Volume 615. [Google Scholar]
- Dorf, R.; Bishop, R. Feedback Control System Characteristics. In Modern Control Systems, 12th ed.; Gilfillan, A., Dworkin, A., Eds.; Prentice Hall: Upper Saddle River, Bergen, NY, USA, 2011; Chapter 4; pp. 235–303. [Google Scholar]
- Liserre, M.; Teodorescu, R.; Blaabjerg, F. Multiple harmonics control for three-phase grid converter systems with the use of PI-RES current controller in a rotating frame. IEEE Trans. Power Electron. 2006, 21, 836–841. [Google Scholar] [CrossRef]
- Vazquez, S.; Rodriguez, J.; Rivera, M.; Franquelo, L.; Norambuena, M. Model Predictive Control for Power Converters and Drives: Advances and Trends. IEEE Trans. Ind. Electron. 2017, 64, 935–947. [Google Scholar] [CrossRef]
- Choi, S.; Enjeti, P.; Pitel, I. Polyphase transformer arrangements with reduced kVA capacities for harmonic current reduction in rectifier-type utility interface. IEEE Trans. Power Electron. 1996, 11, 680–690. [Google Scholar] [CrossRef]
- Arvindan, A.; Ashwin, R.; Murthi, M. Multipulse Diode Rectifiers: Power Quality Perspective Based on Experimental Data. In Proceedings of the 8th IEEE India International Conference on Power Electronics (IICPE), Jaipur, India, 13–15 December 2018; 2018; pp. 1–6. [Google Scholar]
- Subudhi, B.; Pradhan, R. A Comparative Study on Maximum Power Point Tracking Techniques for Photovoltaic Power Systems. IEEE Trans. Sustain. Energy 2013, 4, 89–98. [Google Scholar] [CrossRef]
- Schiffer, J.; Ortega, R.; Astolfi, A.; Raisch, J.; Sezi, T. Conditions for stability of droop-controlled inverter-based microgrids. Automatica 2014, 50, 2457–2469. [Google Scholar] [CrossRef]


| Description | Value |
|---|---|
| Rated power transformer | 200 MVA |
| Rated power transformer | 300 MVA |
| Rated power transformer | 500 MVA |
| Transformer resistance | 0.002 pu |
| Leakage reactance | 0.05 pu |
| PCC line-to-line voltage | 30 kV |
| PCC frequency | 50 Hz |
| Switching frequency | 2 kHz |
| Inverter DC-link voltage | 800 V |
| PCC voltage | 30 kV |
| PCC frequency | 50 Hz |
| Capacitor bank power | 400 MVA |
| Power of filters 5–7 | 50 MVA |
| Power of filters 11–13 | 50 MVA |
| Rated power output transformer | 1000 MVA |
| Transformation ratio | 30/150 kV |
| Resistance | 0.001 pu |
| Leakage reactance | 0.018 pu |
| HVDC | 400 kV |
| Current Controller | |
|---|---|
| Proportional gain () | 400 |
| Integral gain () | 87,800 |
| Voltage Controller | |
| Proportional gain () | 42.57 |
| Integral gain () | 910.15 |
| Frequency Controller | |
| Proportional gain () | 0.513 |
| Integral gain () | 107.4 |
| P–V Curve | |
| Slope () | −0.02 kV/MW |
| P–V curve equation | |
| Q–f Curve | |
| Slope (mi,Q) | −0.03 rad/s/MVAR |
| Q–f curve equation | |
| Description | Value |
|---|---|
| Maximum power | 414.8 W |
| Open-circuit voltage | 85.3 V |
| Short-circuit current | 6.09 A |
| Maximum power voltage | 72.9 V |
| Maximum power current | 5.69 A |
| Power [MW] | ||
|---|---|---|
| PV System | Wind System | |
| Inverter 1 | 150 | 120 |
| Inverter 2 | 180 | 200 |
| Inverter 3 | 490 | 370 |
| Total | 820 | 690 |
Publisher’s Note: MDPI stays neutral with regard to jurisdictional claims in published maps and institutional affiliations. |
© 2021 by the authors. Licensee MDPI, Basel, Switzerland. This article is an open access article distributed under the terms and conditions of the Creative Commons Attribution (CC BY) license (https://creativecommons.org/licenses/by/4.0/).
Share and Cite
Andrade, I.; Pena, R.; Blasco-Gimenez, R.; Riedemann, J.; Jara, W.; Pesce, C. An Active/Reactive Power Control Strategy for Renewable Generation Systems. Electronics 2021, 10, 1061. https://doi.org/10.3390/electronics10091061
Andrade I, Pena R, Blasco-Gimenez R, Riedemann J, Jara W, Pesce C. An Active/Reactive Power Control Strategy for Renewable Generation Systems. Electronics. 2021; 10(9):1061. https://doi.org/10.3390/electronics10091061
Chicago/Turabian StyleAndrade, Iván, Rubén Pena, Ramón Blasco-Gimenez, Javier Riedemann, Werner Jara, and Cristián Pesce. 2021. "An Active/Reactive Power Control Strategy for Renewable Generation Systems" Electronics 10, no. 9: 1061. https://doi.org/10.3390/electronics10091061
APA StyleAndrade, I., Pena, R., Blasco-Gimenez, R., Riedemann, J., Jara, W., & Pesce, C. (2021). An Active/Reactive Power Control Strategy for Renewable Generation Systems. Electronics, 10(9), 1061. https://doi.org/10.3390/electronics10091061