Abstract
Microwave line-of-sight radio relay (RR) systems are a constitutive part of a telecom operator transport network, as an alternative to optical transmission systems when the latter are not technically possible or rational to implement. Nowadays, RR links are quite often used in the access network for connecting mobile radio base stations, thus also enabling traffic aggregation, and so on. In this paper, we focus on a practical, real-life, five-section heterogeneous RR network, comprising classic synchronous digital hierarchy (SDH) and SDH new generation network (NGN) architecture, hybrid parallel and mutually independent transmission of native Ethernet and TDM services, and all-IP network parts. Specifically, the main task of this work is to answer whether such a diverse RR system could satisfy the quality norms for Ethernet-based services, meaning whether a tolerable RR unavailability will necessarily imply the according Ethernet quality of service (QoS) degradation. This question is addressed by the comprehensive in-service and out-of-service testing of an operational hybrid RR transmission system. After extensive practical testing and appropriate analysis of the achieved results, it came out that the impact of RR-level impairments that determine the performance prediction affected the Ethernet QoS to the extent that BER values increased to the acceptability threshold values. We believe that the preliminary results reported here could serve as a hint and a framework for a more comprehensive cross-layer test strategy in terms of both test diversity and repeating rate, which contemporary network operators need to implement in order to enable the appropriate quality of experience for users of their services.
1. Introduction
The primary purpose of any telecommunications network is to provide various services of a committed quality to their end users, which often implies heterogeneity with respect to purpose, functionality, and applied technical solutions. State-of-the art convergent networks provide simultaneous transmission of data, voice, and multimedia services [1,2].
Microwave line-of-sight (LoS) radio relay (RR) systems are often used as an alternative to optical transmission when the latter is either not technically possible or not rational to implement due to a number of compelling technical and commercial arguments, such as installation time, flexibility in space, and fast provision of services.
Specifically, RR Carrier Ethernet has been extensively used in cellular networks’ backhaul, offering flexible incremental bandwidth, the shortest deployment time, the lowest cost per transported bit of services, and a throughput of several gigabits per second, which rivals optical fiber for many applications [3,4].
Locally, RR systems are used for aggregation with IP/Multiple Protocol Label Switching (MPLS) nodes, as well as for cross-connects of transmissions to multiple base stations. Moreover, RR links are also used for back-up transmission at the trunk level [5].
State-of-the-art RR systems are heterogeneous, encompassing classical (and outgoing) synchronous digital hierarchy (SDH) and SDH new generation networks (NGN), hybrid parallel and mutually independent transmission of native Ethernet data, and time-division multiplex (TDM) services, as well as all-IP networks [6].
In this regard, as an RR link is sensitive to fading and radio interference, its transmission performance is determined by the order of the chosen modulation scheme and protective coding. The choice is fixed for SDH NGN technologies, whereas adaptive coding and modulation (ACM) is applied in hybrid and all-IP RR systems, depending on instantaneous propagation conditions [7].
Furthermore, as Ethernet technology spreads from public wideband access networks to transport ones, the classic transmission technologies, namely SDH and wavelength-division multiplex (WDM), are still also used with Ethernet services (based on TCP/IP protocol stack) as well. The NGN devices transmit packets over the network initially predetermined for voice transmission, but now the Carrier Ethernet encapsulates all TDM services in its frames. Of course, the price for this is solving synchronization problems and clock distribution, as well enabling appropriate quality of service (QoS) for TDM services transversing through Ethernet networks, which adds another degree of freedom or uncertainty in this regard [8].
Moreover, the most important goal of a network operator is to provide an appropriate level of services so that its end users can achieve the best possible quality of experience (QoE), and the prerequisite for that is to enable the according QoS throughout all relevant network segments, as a common set of services’ performances that determine the end user’s QoE, such as loss of information, delay, and delay variation in particular [9].
This goal is not easy to accomplish, as various technologies mutually interoperate; the RR transport is just a segment of the network providing services to customers. It is always the case that there are segments that are not over-provisioned and can therefore become congested.
Consequently, if in the transmission chain only a single aggregation RR link branches to access RR links leading towards a number of base stations, does this enable the simultaneous desired throughput to all base stations, especially in the condition of insufficient throughput of the aggregating RR connection? Should all traffic types and applications (video, VoIP, Internet, FTP, IPTV, etc.) be treated equally, or should some traffic engineering be done to ensure optimization and prioritization based on the importance and sensitivity of each application to packet loss, latency, and jitter [9]? Should TDM voice traffic be put at a higher priority in case of reduced throughput of the link?
Rather than reviewing well-known classical properties of microwave RR Carrier Ethernet, however, this research was motivated by more recent and relevant issues coming out of wide deployment—more than 60% globally of RR Ethernet links are 4G (i.e., long-term evolution (LTE)) and 5G backhaul connections [10,11,12,13,14,15,16,17,18,19]. This is the main reviving force of RR links, fueled by their high spectral efficiency (i.e., usage of higher-order QAM modulations), automatic transmit power control (ATPC), and ACM.
As a matter of fact, in this actual and research-motivating framework, we explored the cross-layer consistency (articulated as correlation) between the practical RR performance (availability) and the corresponding QoS at the Ethernet (and IP) layer.
To the best of our knowledge, apart from some simulation studies, there have been few (if any) similar experimental cross-layer investigations—that combine in-service and out-of-service testing in a live hybrid (with all three interoperating technologies) RR Ethernet backhaul of a major operator network—reported in the public literature [10,11,12,13,14,15,16,17,18,19].
Therefore, our motivation for this research, the relevance and actuality of which arise from real-life engineering practices (e.g., the sometimes quite unexpected uncoupling of Ethernet QoS from the RR performance, which we explored by the according statistical analysis), was to pave the way for network operators to apply such an approach while making their proactive conformance tests and analyses comply with the latest updated RR Carrier Ethernet recommendations [1,2], which specify actions needed to achieve the best QoS figures (and QoE of their users).
This way, the proposed correlative cross-layer testing could be further developed on a larger scale in terms of test diversity, repeating rate, and impact of any specific real-time propagation impairments, such as fading or ducting, which impact the RR performance and hence the Ethernet (IP) QoS.
Finally, the main task of this work is to answer whether such a diverse RR system can satisfy the quality norms for Ethernet-based services, meaning whether an acceptable RR availability will necessarily enable the according Ethernet-based QoS in terms of packet loss, delay, and jitter.
This question is addressed by comprehensive in-service and out-of-service testing of the operating heterogeneous RR system. Out-of-service testing was conducted during installation of the actual RR links connecting 12 base stations, as even temporarily shutting down the revenue-generating traffic was not an option.
Accordingly, in Section 2, the basics of Ethernet testing are reviewed, while the system being tested is described in Section 3. Test results of both RR system reliability and end-to-end Ethernet QoS are presented in Section 4, and their consistency is explored and discussed through statistical analysis in Section 5. Conclusions are drawn in Section 6.
2. Testing Ethernet Based QoS
In this study, an operating five-section RR network is subjected to testing of RR-level performance prediction (following the suggestion of the local communications regulatory agency to adopt the most overly pessimistic recommendation with respect to rain and fading), as well as testing of Ethernet end-to-end QoS scores against the standardized norms. The goal is to judge the consistency between the two test categories, by applying the chosen statistical tools to test the hypothesis of mutually correlated RR performance prediction and Ethernet QoS. In the case of non-conformance, further expert analysis and guesswork are to be conducted to interpret the conditions in the network and choose optimal steps in this regard.
2.1. QoS of Ethernet over RR Transport
In contrast to traditional TDM-based services, where QoS is mostly expressed in terms of (un)availability and bit and block errors, Ethernet-based services’ quality is determined by throughput, latency, frame loss rate, and maximal lossless frame rate (back-to-back frames) [10,11,12,13,14].
Accordingly, in Figure 1, the Carrier Ethernet system consists of several Ethernet sections, each covering the physical (L1) and data link (L2) OSI layers. The IP traffic is controlled by the network layer (L3) responsible for end-to-end transmission and routing of packets, which is conditioned by error-free transmissions of Ethernet frames carrying encapsulated IP packets over each Ethernet section.
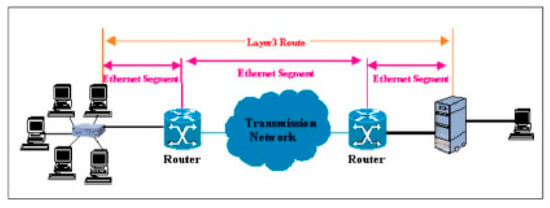
Figure 1.
Carrier Ethernet system with multiple sections.
QoS testing is mostly done end-to-end, and followed up with single-section tests only in the case of pure end-to-end performance that needs to be localized by detecting the section(s) with, for example, reduced throughput or increased delay.
2.2. Ethernet Test Models
The IETF recommendation RFC 2544 describes standard and general test methodologies for Ethernet-based services, regardless of network elements’ manufacturer [10,11,12,13,14].
In this regard, a single network element can be a device under test (DUT). This test is usually applied in the manufacturing of network equipment, and conducted in a laboratory environment. As is shown in Figure 2, a dual-port Ethernet test instrument is needed for this purpose, and no information on the overall network is acquired this way.
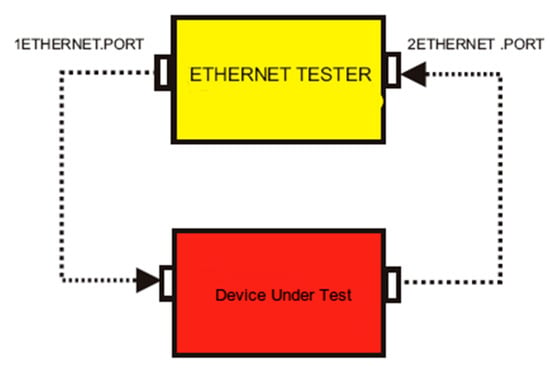
Figure 2.
Dual-port testing of a single network element.
Furthermore, testing an Ethernet network end-to-end, or its various sections, as well as transmission paths, is usually conducted after installation and during regular maintenance. For this purpose, distinct transmitting and receiving test devices are located either end-to-end or spanning section(s) of interest (see Figure 3).

Figure 3.
End-to-end testing.
However, often a single test device is used as both transmitter and receiver, while at the far end, the appropriate loopback is made, but not only at layer L1, which used to be the case with classical SDH networks. Rather, the loopback device in this case must implement both L2- and L3-related functionality to swap the source and destination MAC and IP addresses, respectively, and return the received Ethernet frame (carrying the encapsulated IP packet) back to the transmitter (see Figure 4).

Figure 4.
Logical loop-back aided end-to-end testing.
In this case, the results pertain to the round trip, essentially implying twice as many sections involved in the test path (and accordingly impacting latency, throughput, errored frame/packet rate, etc.). This reduces the capability of fault isolation.
Various standard Ethernet frame lengths can be used for testing, such as 64, 128, 256, 512, 1024, 1280, and 1518 Bytes. If Ethernet virtual LANs are implemented, then test frames also include a VLAN header, implying a maximal frame length of 1522 Bytes [15,16].
Let us now consider testing throughput, latency, and jitter.
Throughput is defined as the maximal count of transportable Ethernet frames in units of time. It is measured as a QoS indicator of whether the user is being delivered the committed bandwidth, and it is assessed either taking into account the (lost) Ethernet frames with a bad frame check sequence (FCS) of up to 10% of the total count of Ethernet frames during the test period, or allowing no loss of Ethernet frames at all in throughput assessment [2].
Furthermore, a larger throughput is achieved by using fewer longer Ethernet frames than by using more smaller ones, since the total relative frame overhead includes inter-frame spacing as well, and is smaller in the first case. Testing throughput starts with the maximal count of frames per second, which is reduced until the errored frames count is zero. (Test devices use special algorithms for determining the resolution and dynamics of frame count reduction as a function of instantaneous throughput.)
A latency measurement provides integral results that include propagation and processing delay. It can also be measured at the network layer as the time that an IP packet needs to traverse through the network from its source to destination. In any case of end-to-end delay measurements, it is important to time-synchronize transmitting and receiving test instruments (if distinct ones are used; see Figure 3). If average Ethernet frame or IP packet delay is longer than 2 s, these are considered lost and not taken into account in delay calculation. Delay variation, which is commonly referred to as jitter, is important for the transport of real-time services, such as in voice-over-IP (VoIP) or IPTV [2].
The frame loss rate is defined as the relative count of the frames that either did not arrive at the destination or have bad cyclic redundancy check (CRC) due to bit errors, increased delay, congestion, wrong priority, and QoS setup of multiple Ethernet ports sharing the communication link.
Analogously to testing throughput, the frame loss measurement transmitter firstly sends the maximal count of frames, and reduces it successfully in the next steps while counting lost frames. This series continues until an equal number of sent and received frames is reached (i.e., when frame loss rate equals 0). Again, for the same count of sent frames, a smaller Ethernet frame size provides a smaller frame loss rate.
Maximal lossless frame rate (back-to-back frames) measurement also starts with the minimal transmitted frame rate, which is increased until erroneous or lost frames are identified at the receiver. This kind of testing checks the system’s robustness against maximal traffic load (burst).
In Table 1, the Rec. 2544 reference values for normalized Ethernet QoS parameters to be measured, namely delay, delay variation, and packet loss, are presented as conforming to the radio access network (RAN) of long-term evolution (LTE) networks [9].

Table 1.
Normalized delay, jitter, and packet loss rate.
3. System under Test
The transmission system between the cities of Sarajevo and Trebinje in Bosnia and Hercegovina was built in October 2019, with the goal to provide all-IP transmission for the mobile RAN network of the third and fourth generation, LTE 4+ in particular, in the area of Eastern Hercegovina. The system is intended to provide enough throughput to 10 RAN base stations throughout next five years, fulfilling the availability norms not only end-to-end, but also for each RR section [17,18,19,20].
The transmission system consists of 3 major entities:
- DWDM/IP-MLS optical transport system Sarajevo–Mostar,
- Optical transmission system Mostar–RR station Šatorova Gomila, and
- RR system Šatorova Gomila–Trebinje.
It not only carries the IP traffic, but (using Precision Time Protocol (PTP) [2]) also distributes the reference clock signal between the master clock source in Sarajevo and the slave RAN BS stations, which are divided into three geographically separated groups (see Figure 5).
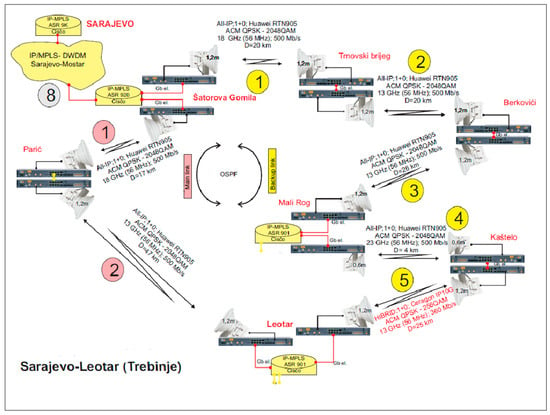
Figure 5.
RR system under test: Šatorova Gomila–Trnovski Brijeg–Berkovići–Mali Rog–Kaštelo–Leotar.
The focus of this work is the RR transmission system Šatorova Gomila–Leotar (Trebinje), consisting of two space-divided directions making the ring network structure, both using 56 MHz bandwidth and 2048 QAM modulation, with a maximal throughput of 500 Mb/s.
The operating direction is made up of two RR sections of the overall length 64.5 km, which is shorter than the five back-up sections and the 95 km-long connection Šatorova Gomila–Trnovski Brijeg–Berkovići–Mali Rog–Kaštelo–Leotar.
As these space-diversified paths between the two IP/MPLS nodes, Šatorova Gomila and Leotar, are geographically separated enough, it was justifiable to assume that both paths would not become unavailable simultaneously.
For our system under test, we selected the back-up RR path whose RR sections were implemented by combining the hybrid and all-IP RR devices as follows:
- The first RR section (Šatorova Gomila–Trnovski Brijeg) is 20 km long and built with all-IP RR devices Huawei RTN905. It uses the frequency band centered around 18 GHz, devices configured as 1 + 0, and 1.2 m antennas. The last generation’s all-IP RR devices are used, with ACM (QPSK-2048 QAM) and configured RF channel bandwidth of 56 MHz, and maximal throughput of 500 Mb/s.
- The second RR section (Trnovski Brijeg–Berkovići) is also 20 km long, with the same data as for the first section, except that the frequency band is centered around 13 GHz.
- The third RR section (Berkovići–Mali Rog) is 26 km long, with the same data as for the preceding sections, except that the frequency band is centered around 13 GHz.
- The fourth RR section (Mali Rog–Kaštelo) is 4 km long, with the same data as for the preceding sections, except that the frequency band is centered around 23 GHz, and the antennas are 0.6 m.
- The fifth RR section (Kaštelo–Leotar) is 25 km long and built by hybrid RR devices of the second generation (IP10G Ceragon). It uses the frequency band centered around 13 GHz. The other data are the same as for the first three sections, except that maximal throughput is configured to be 360 Mb/s (which also determines the end-to-end maximal throughput).
The system schematic is presented in Figure 5.
4. Test Results
4.1. RR Performance Predictions for Individual Sections and End-to-End
Let us now present performance prediction of each of the five RR sections of the observed end-to-end connection Šatorova Gomila–Leotar, measured by means of the original software tool SmartBudget, which is produced by the equipment manufacturer. The tests were initially done for maximal and fixed modulation order, namely 2048 QAM and maximal throughput of 500 Mb/s. Practically speaking, this means that the assumption of short-haul sections was adopted.
As can be read from the screenshot presented in Figure 6, the availability equals 99.40% for vertical and 99.37% for horizontal polarization of the first RR section, and thus does not satisfy the norm for a short-haul RR link with fixed transmission rate. Consequently, the annual unavailability time prediction equals 3123 min and 3294 min, respectively, for the abovementioned polarizations, both of which are significantly longer than the maximal allowed value of 210 min per year [5].
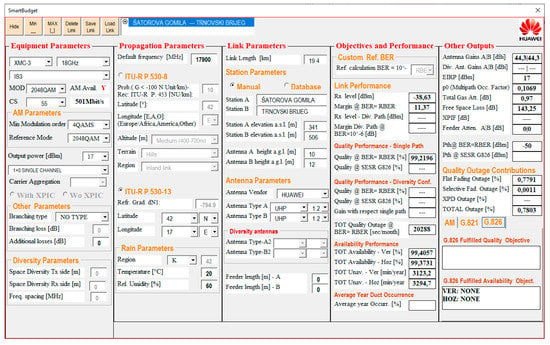
Figure 6.
Prediction for the first RR section; 2048 QAM, 500 Mb/s.
Analogously, for the second RR section, it can be seen from the corresponding screenshot in Figure 7 that the annual unavailability time prediction equals 1389 min and 1475 min for vertical and horizontal polarizations, respectively. Both values are significantly longer than the maximal allowed value of 210 min per year [5], and therefore do not satisfy the norm for a short-haul RR link with fixed transmission rate.
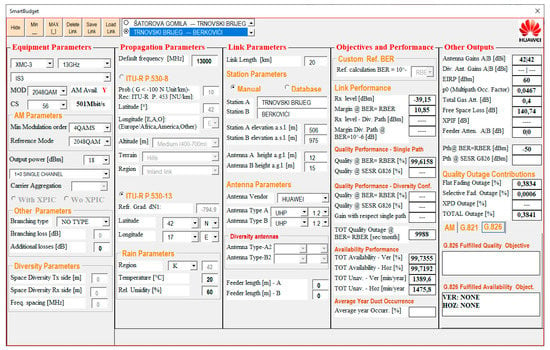
Figure 7.
Prediction for the second RR section; 2048 QAM, 500 Mb/s.
Furthermore, for the third RR section, the screenshot in Figure 8 shows that the annual unavailability time prediction equals 4992.4 min and 5174.7 min for vertical and horizontal polarizations, respectively. Both values are significantly longer than the maximal allowed value of 210 min per year [5], and therefore they do not satisfy the norm for a short-haul RR link with fixed transmission rate.
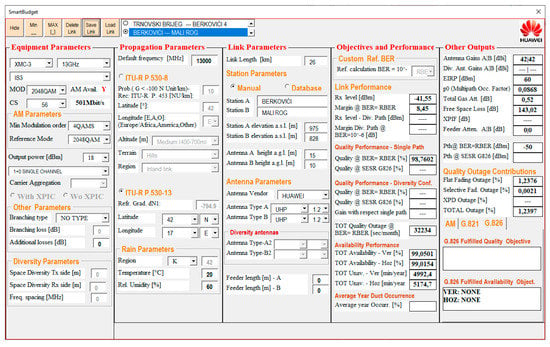
Figure 8.
Prediction for the third RR section; 2048 QAM, 500 Mb/s.
However, for the fourth RR section, the related screenshot in Figure 9 shows that the annual unavailability time prediction equals 37.8 min and 64.2 min for vertical and horizontal polarizations, respectively. These values are below the norms (even for an international RR link). This is in accordance with expectations for the 4 km-long link and the frequency band centered around 23 GHz.
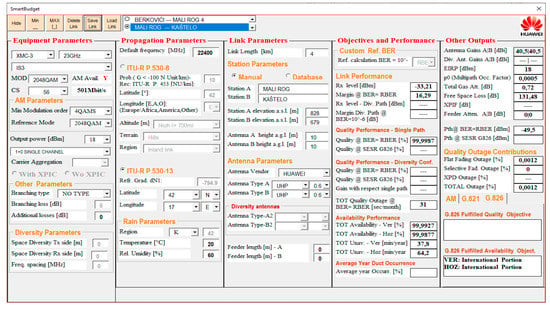
Figure 9.
Prediction for the fourth RR section; 2048 QAM, 500 Mb/s.
Finally, as can be seen in the screenshot in Figure 10, the fifth, 25 km-long RR section, using the frequency band centered around 13 GHz, also does not satisfy the availability norm, as the annual unavailability time prediction equals 3311 min and 3473.8 min for vertical and horizontal polarizations, respectively, which are both significantly longer than the maximal allowed value of 210 min per year [5].
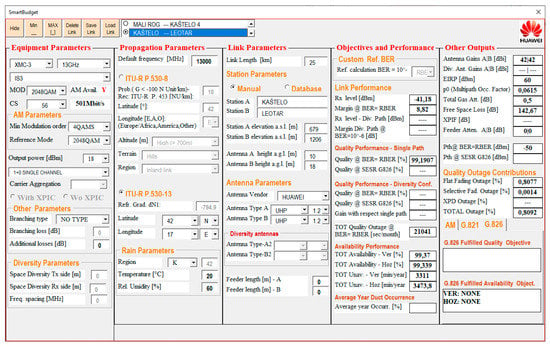
Figure 10.
Prediction for the fifth RR section; 2048 QAM, 500 Mb/s.
The potential countermeasures leading to better availability of both the individual sections and the end-to-end connection include the following:
- -
- increase the node count (i.e., reduce the lengths of critical sections);
- -
- choose lower-band (6 L, 6 U, 8 GHz) RR devices that are less susceptible to fading;
- -
- increase the antennas’ diameter in order to get better antenna gain, which implies a rise of the fading margin and signal-to-noise ratio;
- -
- optimize the order of frequency channels and polarization in accordance with RR sections lengths;
- -
- reduce the modulation order;
- -
- differentiate and prioritize services according to their importance and traffic class, and then define the QoS parameters; or
- -
- give up on an RR system and look for alternative technical solutions (i.e., optical transport).
Firstly, implementing this particular RR system was the only accomplishable solution, as the resource-demanding planting of optical cables was not an option, nor was adding new intermediate nodes in an attempt to reduce the RR sections’ lengths or replacing the RR devices with new ones that have shifted frequency bands to 13 GHz and 18 GHz.
Furthermore, using higher-gain (and thus larger) antennas within the limited space on the rooftop mounts would bring about a pronounced susceptibility to strong winds and ice accumulation, both causing antenna smearing during storms, as some constructions cannot withstand the increased weight and mechanical stress.
Therefore, the only realistic option was to reduce the modulation order until the target prediction norm (availability) was reached for each RR section, as well as for the end-to-end connection.
Moreover, differentiating and prioritizing of services according to their importance and traffic type (i.e., defining the appropriate QoS parameters) needed to be done.
So, for example, for the OAM packets and synchronizing messages, the target throughput was chosen to be 20 Mb/s. However, the internet traffic that is targeted at 200 Mb/s is of the lowest priority, implying that it primarily suffers from propagation phenomena such as fading.
RR Performance Prediction with Reduced Modulation Order
Let us now present the predictions for the same RR sections as above, but with a reduced modulation order, which have to fulfil the (un)availability norm for short haul microwave links with a fixed data rate.
As can be seen on the screenshot in Figure 11, for the first RR section, the predicted availability is 99.98% for 128 QAM modulation, vertical polarization, and a throughput of 323 Mb/s, implying that the annual unavailability is 65.5 min, which is within the relevant norm [5].
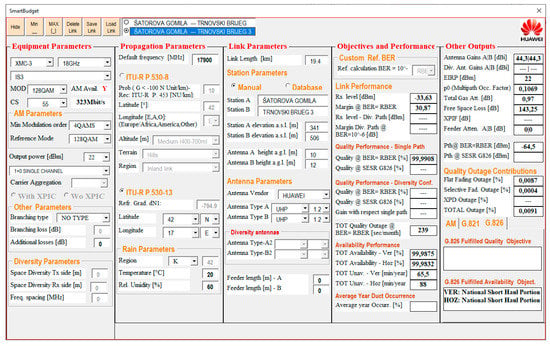
Figure 11.
Prediction for the first RR section; 128 QAM, 323 Mb/s.
From the screen shot for the second RR section, presented in Figure 12, it is reasonable to expect that 128 QAM modulation and throughput of 323 Mb/s were chosen over-pessimistically, as in this RR section, 256 QAM modulation would likely satisfy the norm too.
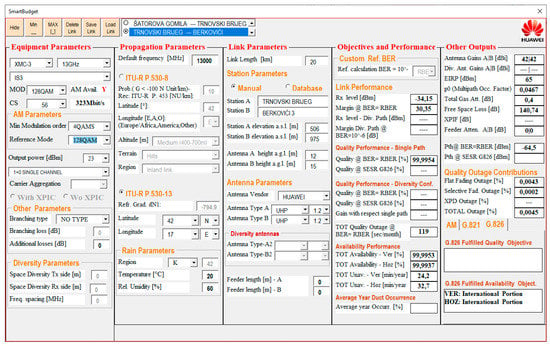
Figure 12.
Prediction for the second RR section; 128 QAM, 323 Mb/s.
However, the norm needs to be fulfilled end-to-end, so that is why the lower-order QAM was chosen to make the unavailability lower (just 24.2 h annually for vertical polarization).
Further on, the third RR section also fulfills the norm with 128 QAM modulation. As for vertical polarization, the annual unavailability amounts to 63 min, Figure 13.
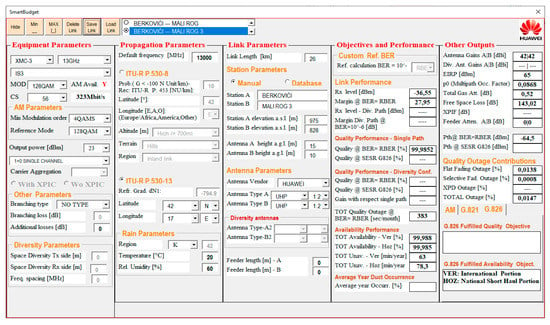
Figure 13.
Prediction for the third RR section; 128 QAM, 323 Mb/s.
The fourth very short RR section definitely fulfills the norm with 2048 QAM modulation and maximal throughput of 500 Mb/s; as for vertical polarization, the annual unavailability amounts to just 37.8 min (Figure 14).
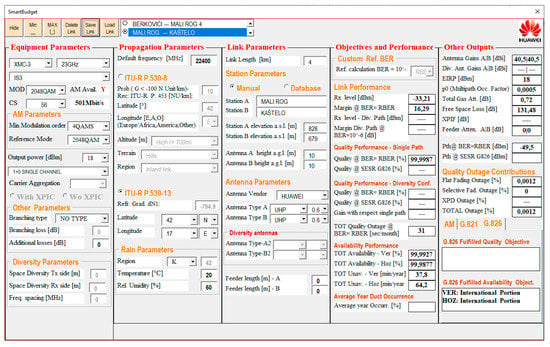
Figure 14.
Prediction for the fourth RR section; 2048 QAM, 500 Mb/s.
Finally, from the screenshot for the fifth RR section, presented in Figure 15, it can be seen that the norm is satisfied for 256 QAM modulation and a throughput of 368 Mb/s, using the installed hybrid RR equipment of the second generation.
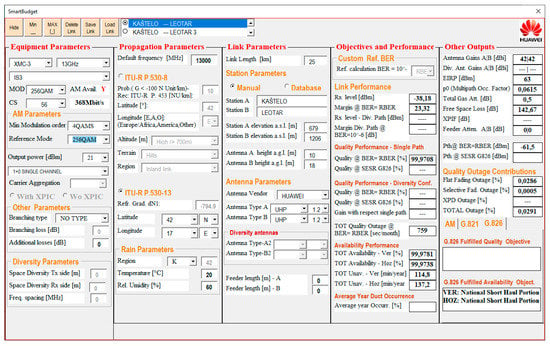
Figure 15.
Prediction for the fifth RR section; 256 QAM, 368 Mb/s.
Thus, as the end-to-end throughput equals the minimal one out of all five RR sections, we consider it to take the value of 368 Mb/s.
Moreover, the end-to-end unavailability is the sum of five individual section unavailabilities, and amounts to 305.3 min per year (for vertical polarization of all RR sections), which is above the annual norm of 210 min [5].
Therefore, in order to fulfill the end-to-end norm in this regard, we “downgraded” the last RR section modulation order from 256 QAM to 128 QAM, thus satisfying the norm for the rate of 323 Mb/s (Figure 16).
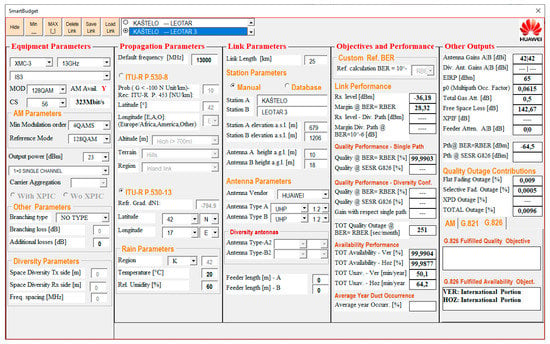
Figure 16.
Prediction for the fifth RR section; 128 QAM, 323 Mb/s.
This not only reduces the RR throughput but also that of the Ethernet traffic. Therefore, the network operator has to decide whether to lock modulation order in accordance with the norms for the fixed transmission rate, which automatically precludes maximal performance (i.e., maximal Ethernet throughput during favorable RR propagation conditions: no rain, no fading, etc.), or configure the system onto adaptive modulation and coding, and thus a variable transmission rate and throughput, which requires adopting QoS parameters for traffic differentiation, shaping, and prioritization.
In this regard, the system under test adopts the second option (i.e., operation with maximal possible throughput).
4.2. End-to-End Ethernet Tests
Finally, let us present the results of the end-to-end Ethernet measurements according to Rec. RFC 2544 [2].
As the tests are end-to-end, this implies testing at the L3 OSI layer (i.e., transmission of IP packets instead of Ethernet frames).
At the far end (Leotar), the main Ethernet tester (traffic generator) was set up, whereas in Sarajevo, the SW loopback instrument was positioned (Figure 4).
The out-of-service (OoS) test model was applied (Figure 17).
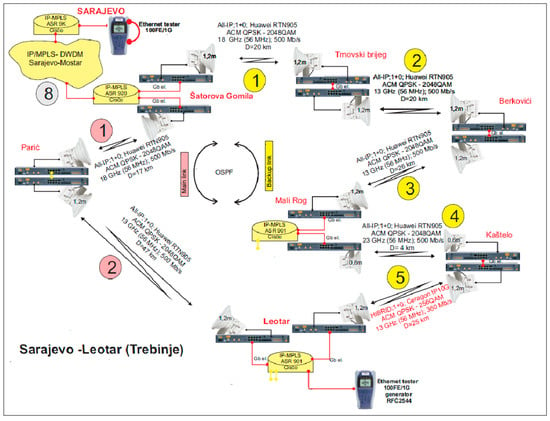
Figure 17.
End-to-end Ethernet testing on the RR system under test.
The setup and test results concern data traffic (e.g., internet access) configured for transmission by VLAN 370, with a DSCP value equal to 0 (Best Effort class), and the lowest (null) priority.
In Table 2, the Ethernet test settings are shown, whereas the exemplar diagrams of throughput, latency, and frame loss rate are presented in Figure 18, Figure 19 and Figure 20, respectively. Jitter and maximal lossless packet transmission rate (back-to-back packets) are given in Table 3 and Table 4, respectively.

Table 2.
Ethernet test settings [15,16].
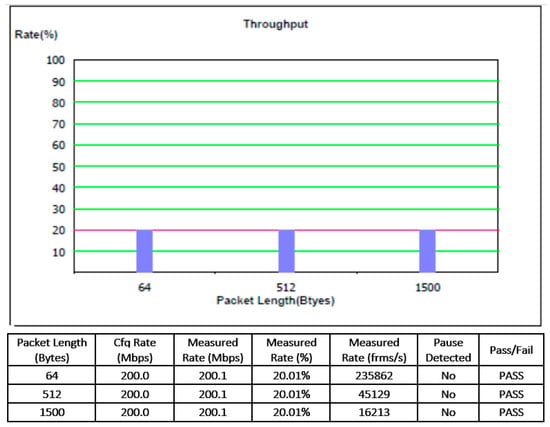
Figure 18.
Throughput.
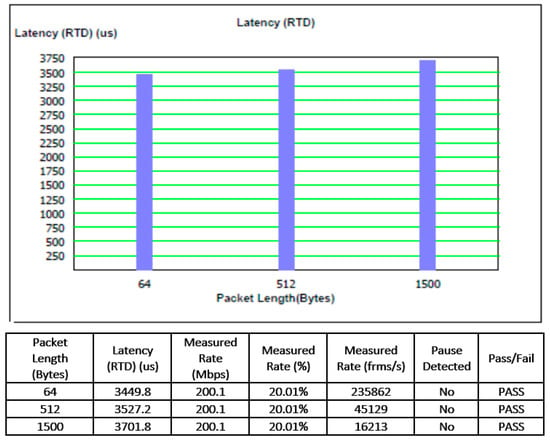
Figure 19.
Latency.
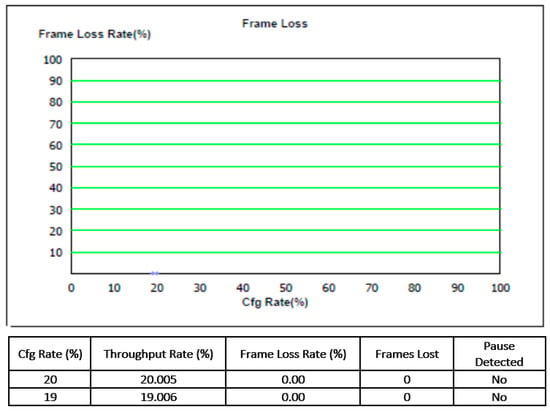
Figure 20.
Packet loss (for packet size of 1500 Bytes).

Table 3.
Jitter.

Table 4.
Maximal lossless packet transmission rate (back-to-back packets).
5. Discussion
5.1. Comments on the Preliminary Test Results
Let us resume the presented typical test results as follows:
The targeted throughput of 200 Mb/s (Figure 18) was projected, based on past experience, with a traffic load of 10 BSes. The throughput for the internet access was measured in conditions of traffic load with 2 RAN BSes (Trnovski brijeg and Berkovići). The internet traffic was categorized as best effort (i.e., with lowest priority in case of congestion).
As is already elaborated above, the expectations of longer delay with longer packets is confirmed in Figure 19, where the packets of 1500 bytes length exhibited the maximal delay value of 3.7 ms, which is below the optimal values for LTE BSes (Table 1). Moreover, since the conducted measurements were round-trip, the actual one-way packet latency was about half of the displayed one.
No packet loss occurred at this data rate and the low bit error rate (BER) (Figure 20), whereas the jitter values in Table 3 of maximal 59 μs for the largest packets of 1500 Bytes are far below the allowed figure in Table 1.
Based on these particular measurements, it came out that the end-to-end QoS satisfied the target values, which is in accordance with the end-to-end RR performance prediction being in-service monitored by means of the network monitoring and control tool also tracking changes of the modulation order throughout 24 h, during 7 successive days.
5.2. Statistical Analysis
At certain BER value, the collected packet loss rate, delay, and jitter data are continuous, while the Ethernet QoS scores can be regarded as ordinal data, measured and classified as best, optimal or tolerable [21] (Table 1).
Furthermore, let us define the ordinary Ethernet score as a union of the three events, defined by either packet loss rate, or packet delay, or packet jitter exceeding their respective RFC2544 thresholds of tolerance, specifically for the LTE (S1 interface), as presented in (1):
Therefore, we need to investigate whether there is a relationship between RR unavailability and the Ethernet QoS score (2). However, common parametric tests are not a good choice for statistical analysis of ordinal data of the sort that we were to conduct here, so we used the nonparametric Spearman rank-order correlation test to find the correlation coefficient (ρ), which is a good measure of strength and direction of the relationship between the continuous and the ordinal random variables.
Thus, considering the QoE score and RR unavailability as being represented by paired observations, our preliminary investigation revealed monotonic relationship between them. The null and the alternative hypotheses, respectively, are as follows:
Hypotheses 0 (H0).
There is no association between the QoE score and RR unavailability.
Hypotheses 1 (H1).
There is an association between the QoE score and RR unavailability.
The significance of a test result is articulated with the p-value; the smaller it is, the more significant is the result. In this respect, the comparison reference that is commonly referred to as significance (α) is in fact the probability of a “false positive” decision about null hypothesis rejection when it should be accepted [22]. So, for example, if the null hypothesis is rejected (p < α found), then a smaller α value implies stronger evidence that the finding is statistically significant [22]. In our analysis, we adopted a moderate value of α = 1% to find whether and to what extent (excessive) RR unavailability incurs notable QoS degradation.
Accordingly, our tests revealed that a direct relationship exists between the end-to-end QoS score, and the RR unavailability prediction at any given bit error rate (BER).
Specifically, In Table 5, the values of the Spearman correlation coefficient between the end-to-end Ethernet QoS score and the average RR unavailability are presented for particular BER and p-values.

Table 5.
Correlation of QoS vs. RR unavailability.
As can be seen above, when the actual BER value exceeds 10−6, the correlation coefficient gets significantly different from zero with a small enough p-value (lesser than α = 0.1), meaning that the null hypothesis can be rejected (i.e., that there is an association between the QoS rating and the RR unavailability values, dominantly determined by noise in the actual system under test).
On the other hand, no significant impact of RR unavailability on QoS rating is evident for the lower BER values in Table 5.
6. Conclusions
RR transmission systems are an important constituent of each operator network (e.g., for interconnecting the base stations of wireless access systems that we consider here), LTE in particular. Specifically, we focus on a non-uniform environment encompassing various technologies of RR systems such as legacy SDH NGN, hybrid Ethernet/TDM, and all-IP, which together have to provide targeted availability and end-to-end Ethernet/IP QoS.
As Carrier Ethernet has become dominant in RR systems, it has become even more important to ensure an appropriate end-to-end QoS level, so our goal was to analyze the RR performance consistency with the Ethernet/IP layer QoS.
In this regard, a question arises whether and to what extent fulfilling the former classic recommendations for performance prediction—specifically, the (un)availability of an RR chain of stations for fixed data rates—determine the Ethernet QoS on the end-to-end level.
The measurements were done on the operating network, which, at the physical media layer (RR), included the at-the-time actual propagation impairments, for which we followed the recommendation to adopt the most over-pessimistic predictions.
After extensive practical testing and analysis of the achieved results, it came out that the impact of RR-level impairments that determine the RR performance prediction affected the Ethernet QoS to the extent that BER values increased to the acceptability threshold values.
The only achievable solution in this regard was to downgrade the modulation order until the target norm is reached for each section, as well as for the end-to-end connection.
Although at this time, testing did not target analyzing the individual impact of any RR impairment—fading in particular (which would have needed long-term testing)—the test model could be extended or focused by tracking each propagation effect, once it was identified and isolated.
Making more tests with more diversified conditions would definitely enhance the representability of the achieved results, but unfortunately, we had no resources available for more a ambitious task in this respect.
Our goal with this research was just to pave the way for network operators to develop such correlative cross-layer testing on a larger scale in terms of both test diversity and repeating rate.
Author Contributions
Conceptualization, S.Z. and V.L.; methodology, S.Z., A.L. and V.L.; software, S.Z.; validation, A.L., M.H. and V.L.; formal analysis, A.L.; investigation (actual testing), S.Z. and M.H.; resources, S.Z.; data curation, A.L.; writing—original draft preparation, S.Z. and A.L.; writing—review and editing, V.L.; visualization, S.Z.; supervision, V.L.; project administration, A.L.; funding acquisition, S.Z. All authors have read and agreed to the published version of the manuscript.
Funding
The research leading to the published results was supported by the Ministry of Civil Affairs of Bosnia and Herzegovina, under Grant No. 02-7143/20.
Conflicts of Interest
The authors declare no conflict of interest.
References
- Y.100: General Overview of the Global Information Infrastructure Standards Development. Available online: https://www.itu.int/rec/T-REC-Y.100-199806-I/en (accessed on 30 January 2021).
- ITU-T. Recommendation G.8011/Y.1307: Series G: Packet over Transport Aspects—Ethernet over Transport Aspects; Series Y: Internet Protocol Aspects—Transport; Ethernet Service Characteristics. Available online: file:///C:/Users/MDPI/AppData/Local/Temp/T-REC-G.8011-200408-S!!PDF-E.pdf (accessed on 1 August 2004).
- Peña, R.V. Migración hacia NGN en la provincia de Granma. Ingenius 2018, 78–87. [Google Scholar] [CrossRef]
- Dragon Wave. Optimized Microwave Backhaul; Dragon Wave: Ottawa, ON, Canada, 2015. [Google Scholar]
- Henne, I.; Thorvaldesen, P. Planning of Line of Sight Radio-Relay Systems. Nera: New York, NY, USA, 1999. [Google Scholar]
- Cisco Systems. Levering Transport for Data Services with Virtual Concatenation (VCAT) and Link Capacity Adjustment Scheme (LCAS); Cisco Systems: San Jose, CA, USA, 2011. [Google Scholar]
- ITU-T Recommendation G.8010/Y.1306; Architecture of Ethernet Layer Networks. Available online: http://futureblue.com/voice/itu/ORIGINAL/G/T-REC-G.8010-200402-I!!PDF-E.pdf (accessed on 1 February 2004).
- Mikóczy, E.; Kotuliak, I.; Deventer, O.V. Evolution of the Converged NGN Service Platforms towards Future Networks. Future Internet 2011, 3, 67–86. [Google Scholar] [CrossRef]
- Rumnay, M. LTE and the Evolution of 4G Wireless: Design and Measurements Challenges, 2nd ed.; John Wiley & Sons: Hoboken, NJ, USA, 2013. [Google Scholar]
- Oproiu, E.-M.; Vulpe, A.; Fratu, O.; Ion, M. High Capacity Ethernet Radio Relay Networks in Mobile Communications. EAI Endors. Trans. Mob. Commun. Appl. 2018, 3, 1–5. [Google Scholar] [CrossRef][Green Version]
- Morro, R.; Lucrezia, F.; Gomez, P.; Casellas, R. Automated End to End Carrier Ethernet Provisioning Over a Disaggregated WDM Metro Network with a Hierarchical SDN Control and Monitoring Platform. In Proceedings of the European Conference on Optical Communication (ECOC), Roma, Italy, 23–27 September 2018; pp. 1–3. [Google Scholar]
- GSMA Future Networks. Mobile Backhaul: An Overview. Available online: https://www.gsma.com/futurenetworks/wiki/mobile-backhaul-an-overview/ (accessed on 19 June 2019).
- Gifre, L.; Izquierdo-Zaragoza, J.-L.; Ruiz, M.; Velasco, L. Autonomic Disaggregated Multilayer Networking. J. Opt. Commun. Netw. 2018, 10, 482–492. [Google Scholar] [CrossRef]
- Metro Ethernet Forum. Microwave Technologies for Carrier Ethernet Services. Available online: https://vertel.com.au/sites/default/files/MEF-paper-Microwave-Technologies-for-Carrier-Ethernet-Services.pdf (accessed on 1 January 2011).
- Microwave-link.com. Welcome to Microwave-Link.com. Available online: https://www.microwave-link.com/microwave/welcome/ (accessed on 30 March 2015).
- Aviat Networks. Three Elements to IP/MPLS Success in the Microwave Access. Available online: https://aviatnetworks.com/tag/aviat/ (accessed on 23 January 2017).
- Microwave-link.com. Point to Point Microwave Link. Available online: https://www.microwave-link.com/microwave/point-to-point-p2p-ptp-microwave-link/ (accessed on 8 May 2018).
- Kangovi, S. Peering Carrier Ethernet Networks, 2nd ed.; Elsevier: Amsterdam, The Netherlands, 2017; pp. 145–194. [Google Scholar]
- Burgess, N. RFC 2544 Testing of Ethernet Services in Telecom Networks. Available online: http://literature.cdn.keysight.com/litweb/pdf/5989-1927EN.pdf (accessed on 15 November 2004).
- ITU-T. Recommendation P.530-17; Propagation Data and Prediction Methods Required for the Design of Terrestrial Line-of-Sight Systems/. Available online: https://www.itu.int/dms_pubrec/itu-r/rec/p/R-REC-P.530-17-201712-I!!PDF-E.pdf (accessed on 1 December 2017).
- Govindarajulu, Z.; Kendall, M.; Gibbons, J.D. Rank Correlation Methods. Technometrics 1992, 34, 108. [Google Scholar] [CrossRef]
- Kendall, M.; Stewart, A. The Advanced Theory of Statistics; Charles Griffin: London, UK, 1966. [Google Scholar]
Publisher’s Note: MDPI stays neutral with regard to jurisdictional claims in published maps and institutional affiliations. |
© 2021 by the authors. Licensee MDPI, Basel, Switzerland. This article is an open access article distributed under the terms and conditions of the Creative Commons Attribution (CC BY) license (https://creativecommons.org/licenses/by/4.0/).