Article

Movement Tube Detection Network Integrating 3D CNN and Object Detection Framework to Detect Fall

1
School of Information Engineering, Nanchang University, Nanchang 330031, China
2
School of Software, Nanchang University, Nanchang 330047, China
3
Jiangxi Key Laboratory of Smart City, Nanchang University, Nanchang 330047, China
*
Author to whom correspondence should be addressed.
Electronics 2021, 10(8), 898; https://doi.org/10.3390/electronics10080898
Submission received: 5 March 2021 / Revised: 28 March 2021 / Accepted: 31 March 2021 / Published: 9 April 2021
(This article belongs to the Section Artificial Intelligence)

Abstract

:
Unlike most of the existing neural network-based fall detection methods, which only detect fall at the time range, the algorithm proposed in this paper detect fall in both spatial and temporal dimension. A movement tube detection network integrating 3D CNN and object detection framework such as SSD is proposed to detect human fall with constrained movement tubes. The constrained movement tube, which encapsulates the person with a sequence of bounding boxes, has the merits of encapsulating the person closely and avoiding peripheral interference. A 3D convolutional neural network is used to encode the motion and appearance features of a video clip, which are fed into the tube anchors generation layer, softmax classification, and movement tube regression layer. The movement tube regression layer fine tunes the tube anchors to the constrained movement tubes. A large-scale spatio-temporal (LSST) fall dataset is constructed using self-collected data to evaluate the fall detection in both spatial and temporal dimensions. LSST has three characteristics of large scale, annotation, and posture and viewpoint diversities. Furthermore, the comparative experiments on a public dataset demonstrate that the proposed algorithm achieved sensitivity, specificity an accuracy of 100%, 97.04%, and 97.23%, respectively, outperforms the existing methods.

1. Introduction

Fall is becoming an increasingly important cause of injury and even death among the elderly people. With the increase of age, various physiological functions of the human body are deteriorating seriously, and accidents such as falls can easily occur. According to the report of [1,2], with the rapid growth of the aging society, falling injuries have become one of the leading causes of accidental death. According to WHO (world health organization) [3], approximately 28–35% of people aged 65 and over fall two to three times each year, and 32–42% of those aged 70 and over fall five to seven times each year. Therefore, the emergence of automatic fall detection technology plays a positive role in protecting the health of the elderly. In this paper, deep learning technology is explored to detect human fall in surveillance videos.
In recent years, deep neural networks have gained huge success in image classification, object detection [4,5,6], and action recognition [7,8,9,10]. An SSD (single shot detector) [5] proposes discretized default boxes to detect objects. In reference [8], an SSD is adopted to predicate the action class-specific confidence scores and bounding boxes at a frame level, then an online Viterbi algorithm is used to generate the action tube in spatial and temporal dimensions incrementally. In order to overcome the disadvantage that the temporal dynamic cannot be effectively expressed by a frame-level-based detection algorithm, in reference [9], the authors stack a sequence of spatial convolution features from an SSD, then the sequence of spatial features are fed into regression and classification layers.
Inspired by [5,8,9], in this paper, a 2D object detection framework such as the SSD is extended to the movement tube detection network for human fall in both spatial and temporal dimensions simultaneously. Instead of processing appearance and motion features separately, such as in references [8,9,10], a 3D convolutional neural network is exploited to encode the spatial features and temporal features of the human fall process.
A deep neural network has a great number of parameters that may lead model over-fitting if there is lack of a large number of training data. Large-scale datasets exist in the field of human action recognition, for example, the UCF101 [11] dataset for human action recognition. There are 101 human action categories and 13,320 videos in UCF101 dataset. However, in the field of fall detection, there is no large-scale dataset. In order to meet the needs of large data, in this work, the collected fall dataset has 928 videos, each of which contains a fall process. The videos last from 6 s frames to 56 s and a 24-fps sampling rate with 1024 × 680 resolution. Besides, the person in the process of falling is annotated with bounding boxes. Thus, the dataset is called a large-scale spatio-temporal fall detection dataset, in short, a LSST fall detection dataset. In a LSST dataset, ten persons of different shapes in different colors and texture clothes fall in a variety of relative postures and distances between the human fall and the camera. The LSST fall detection dataset aims to provide a data benchmark in the field of vision-based human fall detection in both spatial and temporal dimensions. The collected dataset is the first dataset which contains a large scale of videos annotating with bounding boxes in the field of human fall detection.
To summarize, the main contributions of this paper are as follows.
  • A movement tube detection network is proposed to detect a human fall in both spatial and temporal dimensions simultaneously. Specifically, a 3D convolutional neural network integrating into tube anchors generation layer, a softmax classification layer, and a movement tube regression layer form the movement tube detection network for a human fall. Tested on an Le2i fall detection dataset with 3DIOU-0.25 and 3DIOU-0.5, the proposed algorithm outperforms the state-of-the-art fall detection methods.
  • To reduce the impact of irrelevant information in the process of a human fall, the constrained movement tube is used to encapsulate the person closely. The movement tube detection tube network can detect fall even in the case of interpersonal inference and partial occlusion because the constrained movement tube avoids peripheral interference.
  • A large-scale spatio-temporal (denoted as LSST) fall detection dataset is collected. The dataset has the following three main characteristics: large scale, annotation, and posture and viewpoint diversities. The LSST fall dataset considers the diversities of the postures of human fall process and the diversities of the relative postures and the distances between the human fall and the camera. The LSST fall detection dataset aims to provide a data benchmark to encourage further research into human fall detection in both spatial and temporal dimensions.
The remainder of this paper is organized as follows. Section 2 discusses the related work in the fall detection field. Section 3 shows the overview of the proposed method. Section 4 explains the movement tube detection network. Section 5 discusses the post-processing and evaluation metrics. Section 6 describes the details of the collected LSST fall dataset. Section 7 illustrates the experiments, followed by Section 8 offering conclusions and future work.

2. Related Work

From the perspective of data acquisition equipment, human fall detection can be categorized into the following three major types [12,13,14]: (i) wearable sensor-based; (ii) ambience sensor-based; and (iii) vision-based. In a wearable sensor-based fall detection system, various wearable sensors including accelerometers and smart phones are attached to the human body to collect related data [15,16,17]. Although wearable sensors collect accurate data, they are intrusive, which makes many older people dislike or forget to wear them. In an ambience sensor-based method, vibration sensors are installed on the floor of the elderlies’ active regions. Without wearing sensors on the elderlies’ body, the ambience sensor-based method suffers from environmental noise and usually has many false alarms [18]. Compared to the wearable sensor-based and ambience sensing-based method, the video-based fall detection methods do not require wearing or installing expensive equipment.
In recent years, with the continuous improvement of video intelligent analysis, vision-based automatic fall detection is being paid more and more attention [19,20,21]. Apparently, this kind of method is an economical solution to monitor whether anyone has fallen in general public environments. In references [19,22,23], vision-based fall detection technologies generally follow three steps. Firstly, background subtraction is applied to segment a human object from the background. Secondly, the morphological and motion characteristics of foreground targets are analyzed to extract low level hand-crafted features such as aspect ratio [19], ellipse orientation [22], and so forth. Thirdly, the hand-crafted features are fed into a classifier to judge whether anyone has fallen. In [19], the authors propose a normalized shape aspect ratio to rectify the change of the shape aspect ratio which is caused by relative postures and distance between the human body and the camera. The effect of background subtraction is very susceptible to light and shadow. A deep neural network is a promising method to process the difficulties brought about by inherent defects of background subtraction and hand-crafted features. In image classification and object detection tasks [4,5,24,25,26], the experiment results show that deep learning technics have a superior performance to hand-crafted features. In reference [26], a very deep convolution neural network achieves top-1 test set error rates of 37.5 during the ILSVRC-2010 competitions, which is 8.2 percent lower than that of the method where linear SVMs are trained on Fisher Vectors (FVs) computed from two types of densely sampled features [27]. Recently, learning features directly from raw observations using deep architectures shows great promise in human action recognition. In the past years, human action recognition methods based on deep neural networks can be divided into three categories: (i) two stream architectures; (ii) LSTM-based; and (iii) 3D convolution networks. In reference [28], an individual frame appearance ConvNet and a multi-frame dense optical flow ConvNet are fused together to gain final classification scores. The two-stream architecture has the disadvantage of not being able to unify the appearance and motion information in a unified model. In reference [29], long term recurrent convolutional networks are proposed to model complex temporal dynamics. Compared with traditional CNN, the ConvLSTM [30] explores long range temporal structures as well as spatial structures. In reference [31], Tran et al. state that 3D ConvNet are more suitable for spatiotemporal feature learning compared to two stream 2D ConvNet. 3D convolutional neural networks can extract not only spatial features but also temporal features, thereby capturing the motion information in multiple adjacent frames. In references [7,31], 3D convolutional neural networks are proposed to incorporate both appearance and motion features in a unified end-to-end network.
Inspired by the breakthroughs of object detection and human action recognition via deep learning technology, researchers have begun to use deep neural networks to detect human falls. In reference [32], skeleton data and segmentation data of the human are extracted by a proposed human pose estimation and segmentation module with the weights pre-trained on a MS COCO Key points dataset, which is then fed into a CNN model with modality-specific layers which is trained on synthetic skeleton data and segmentation data generated in a virtual environment. In reference [33], the authors encode the motion information of the trimmed video clip in dynamic images, which compress a video to a fixed length vector which can be inverted to a RGB image. Then, the VGG-16-based ConvNet takes dynamic image as input and outputs the scores of four phases: standing, falling, fallen, and not moving. In reference [34], a three-stream Convolutional Neural Network is used to model the spatio-temporal representations in videos. The inputs to the three-stream Convolutional Neural Network are silhouettes, motion history images, and dynamic images. In reference [21], in order to detect human fall, a neural network which is trained by a three-step phase takes optical flow images as input. Although it is simple, this method does not consider the appearance of the human body. In reference [35], the fall detection is divided into two training stages, which are 3D CNN and LSTM-based attention networks. Firstly, a 3D convolutional neural network is trained to extract motion features from temporal sequences. Then, the extracted C3D features are fed into an LSTM-based attention network. In references [21,33,34,35], the proposed models detect fall at frame level, therefore, can only detect fall only in the temporal dimension. In essence, the four methods refs. [21,33,34,35] mentioned above do not model both spatial and temporal representations in a unified trainable deep neural network.

3. The Overview of Proposed Method

Figure 1 shows the overview of the proposed method. The model consists of six components: 3D ConvNet, Spatial Pyramid, tube anchors generation layer, matching and hard negative mining, loss layer and output layer.
A 3D ConvNet takes a sequence of successive RGB frames as input to output the 3D convolutional features. For the convenience of calculation, a reshape layer reshapes the features from 3D to 2D after the 3D ConvNet pools the size of the temporal dimension to 1.
The Spatial Pyramid layer generates a multi-scale feature pyramid so that the model can detect a multi-scale fall. Specifically, the multi-scale features are fed into the tube anchors generation layer, softmax classification layer, and movement tube regression layer.
In the tube anchors generation layer, the box anchors are extended to tube anchors, which are stacked by the fixed length sequence of successive default boxes with different width, different height. The 3D tube anchors generation process is similar to the box anchors generation process of an object detection framework.
The matching and negative mining component is used at the training stage. The matching process finds tube anchors matching the ground truth according to the mean Intersection-over-Union (IOU) between them. Negative mining collects negative examples which match the ground truth and have a large loss to form a set of hard negative examples. In this paper, the ratio of positive to negative examples is 1:3. The matched positive examples and hard negative examples are taken as input to the loss function which consists of class loss and location loss. Then the losses propagate back to the anchors corresponding to examples.
At the training stage, the loss layer consists of softmax classification loss and movement tube regression loss. The cross-entropy loss is used to measure the difference between the ground truth and predicated classification at the softmax classification loss layer. At the movement tube regression loss layer, the Smooth L1 loss is used to measure the difference between the ground truth constrained movement tube and the regressed movement tube.
The output layer, which is used at the inference stage, consists of the softmax classification layer and movement tube regression layer. The softmax classification layer outputs bi-classification probabilities of fall and no fall for each tube anchor. The movement tube regression layer is to regress the tube anchors to the constrained movement tubes, which closely encapsulate the person. The shape of bounding boxes in the constrained movement tube changes over time in the process of a fall. The constrained movement tube, avoiding peripheral interference, enables the proposed algorithm to detect a fall even in the case of partial occlusion. By extending the box anchor to the tube anchor and the box regression to the movement tube regression, the movement tube detection network taking appearance and motion features as input can detect multiple falls in both spatial and temporal dimensions simultaneously in a unified form.

4. The Movement Tube Detection Network

This section describes the movement tube detection neural network. Section 4.1 describes the concept of constrained movement tube. Section 4.2 describes the structure of the proposed neural network. Section 4.3 and Section 4.4 addresses the loss function and data augmentation respectively.

4.1. Constrained Movement Tube

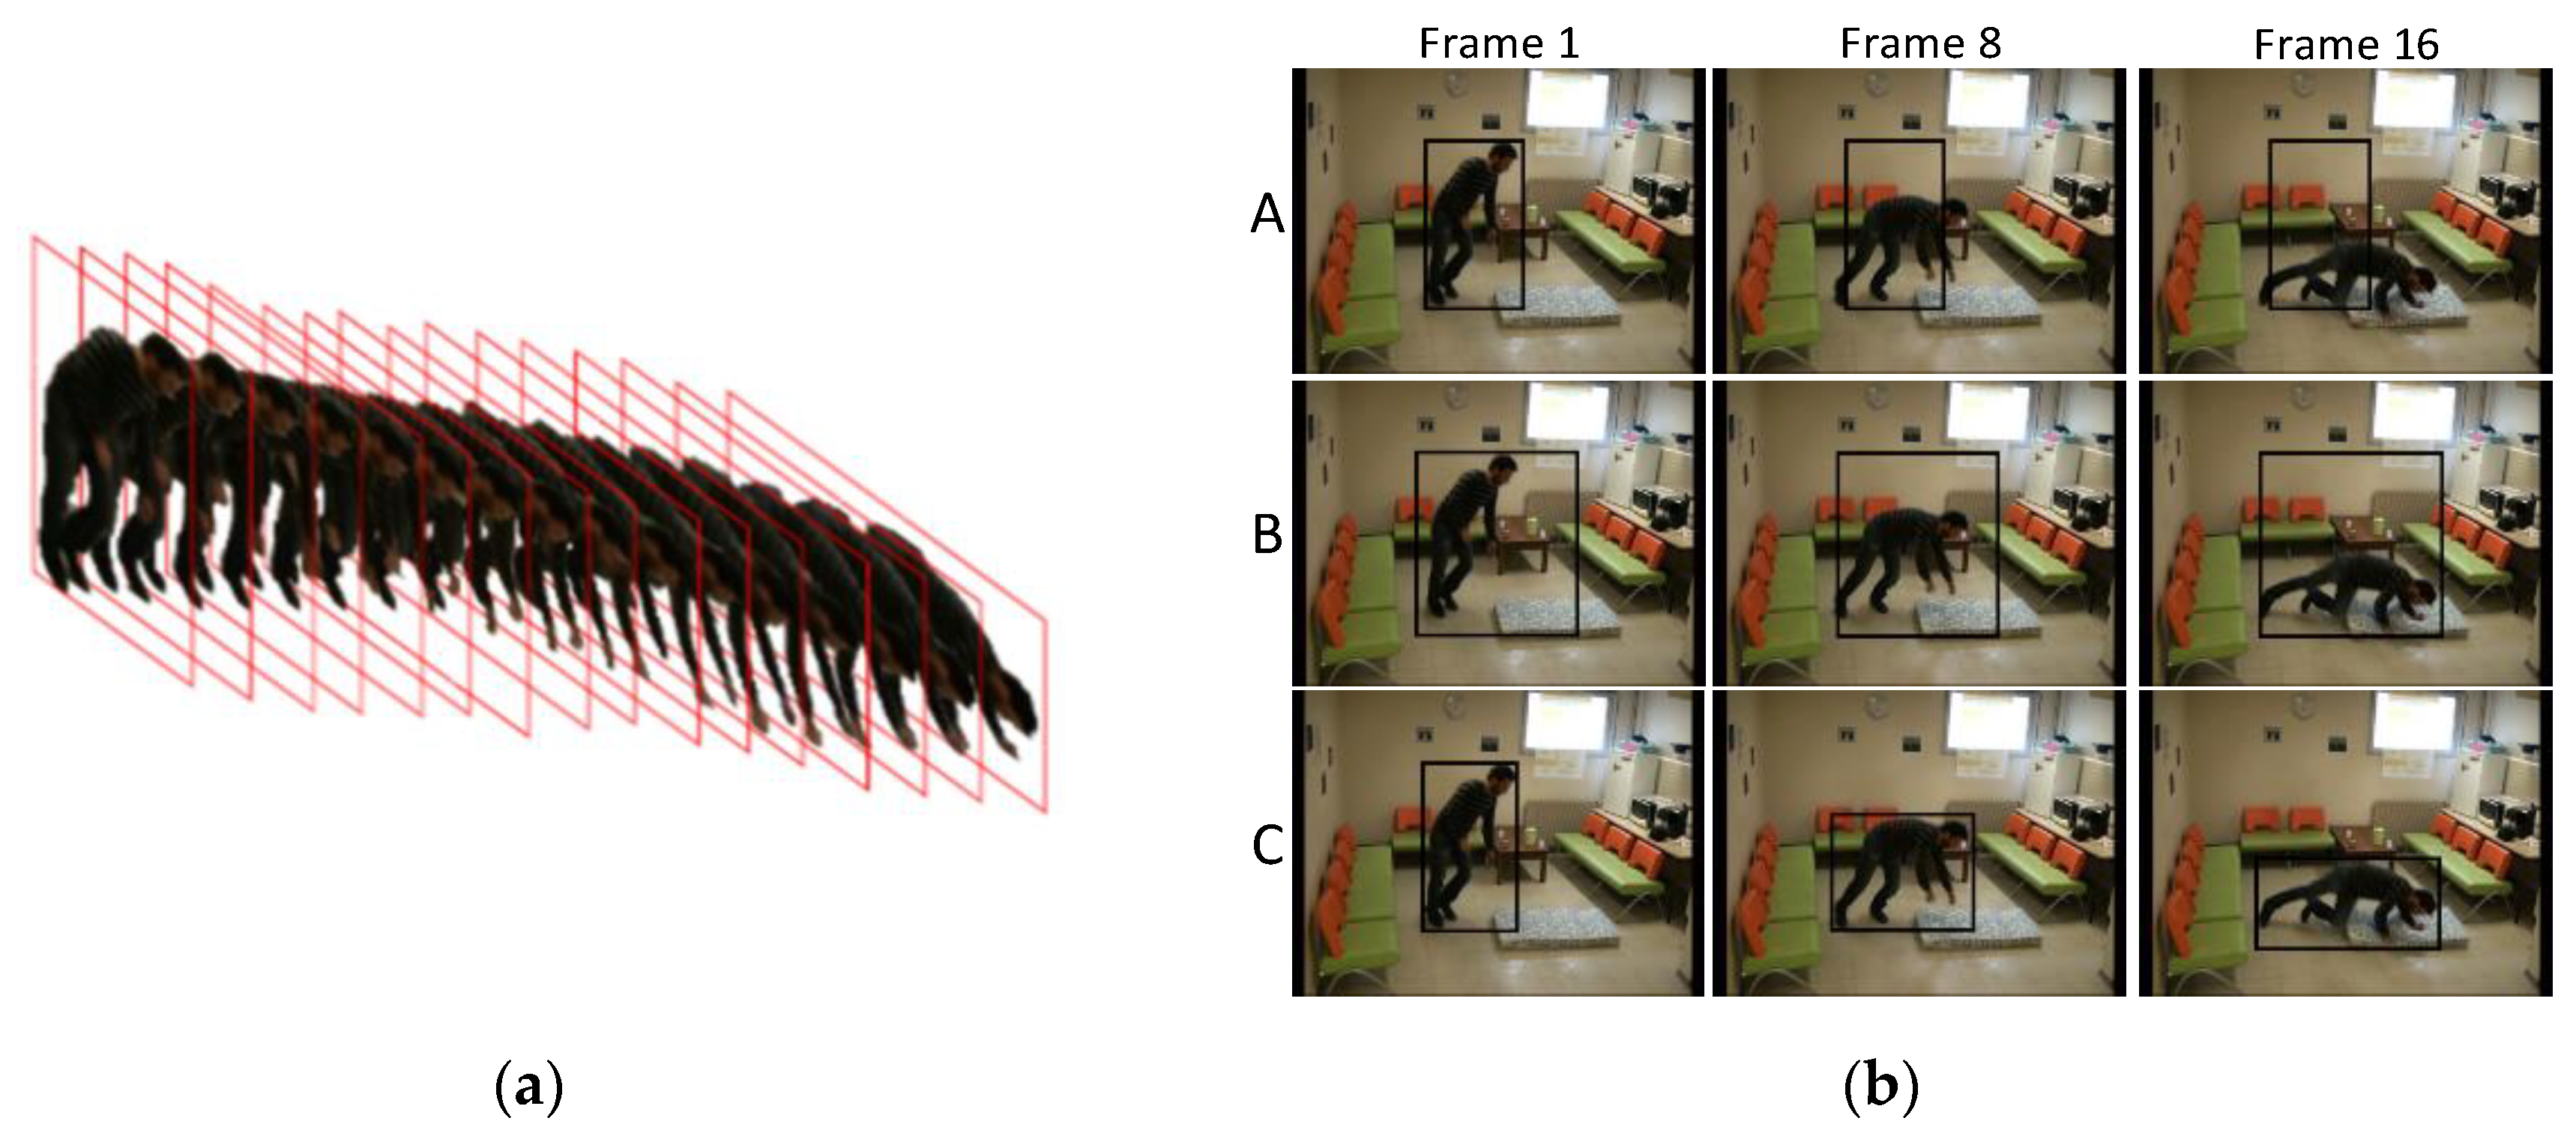
As depicted in Figure 2a, when a person falls, the shape aspect ratio of the bounding box encapsulating the person changes dramatically, which is quite different from the small changes when the person walks normally. Aside from the aspect ratio, the center point of the bounding box moves frame by frame in the process of fall.
In Figure 2b, the first column, second column, and third column are the first frame, eighth frame, and sixteenth frame of the falling process, respectively. Row A: the bounding boxes do not contain the person in Frame 16. Row B: the bounding boxes contain too much irrelevant information in Frame 16. Row C: the bounding boxes just encapsulate the fall person in the whole fall process. Figure 2b shows three manners of annotating the person with bounding boxes during fall. Manner A is depicted by Row A, in which the bounding boxes do not fully encapsulate the fall person in Frame 16 at the later stage of the falling process. Manner B is depicted by Row B, in which the bounding boxes contain too much irrelevant information in Frame 16. Manner C is depicted by Row C, in which the bounding boxes just encapsulate the fall person in the whole fall process. In manner C, the bounding boxes encapsulating the fall person changes over time. The sequence of successive bounding boxes in manner C is called a well constrained movement tube. The well constrained movement tube has the merits of encapsulating the person closely and avoiding peripheral interference. In this paper, a well constrained movement tube is used as ground truth to train the movement tube detection network.

4.2. The Structure of the Proposed Neural Network

The movement tube detection network consists of three components: 3D ConvNet, a tube anchors generation layer, and an output layer.
The human fall detection is benefitted from the appearance and motion information encoded in 3D ConvNet. The 3D ConvNet model takes as input a successive sequence of RGB frames. In 3D convolution, the features are computed by applying the 3D filter kernels over input in both a spatial and temporal dimension. 3D convolution is expressed by following Equation (1):
v i j x y z = t a n h ( b i j   +   m = 0 M 1 r = 0 R 1 q = 0 Q 1 p = 0 P 1 w i j m p q r v i 1 m z + r x + p y + q )
The size of 3D kernel is P × Q × R. w i j m p q r is the (p,q,r)-th weight of the 3D kernel connected to the m-th feature map of (i-1)-th layer. v i j x y z is the value at position (x,y,z) on the j-th feature map of the i-th layer. b i j is the bias of the j-th feature map of i-th layer. Tanh is the non-linear activation function.
In this paper, the size of all 3D convolutional kernels is 3 × 3 × 3 with stride 1 × 1 × 1 in both spatial and temporal dimensions. Max pooling is used in all 3D pooling. The format of 3D pooling is d × k × k, in which d is denoted as the temporal kernel size and k is denoted as the spatial kernel size. Table 1 depicts the details of the 3D ConvNet architectures. The input to the 3D ConvNet is a successive sequence of 16 frames. There are five 3D convolutional layers and four 3D pooling layers. In Table 1, the first row shows the layer names of the proposed architectures. The second row shows the stride of the 3D convolution and 3D pool. The third row shows the size of the feature map. The fourth and the fifth row show the temporal size and spatial size respectively.
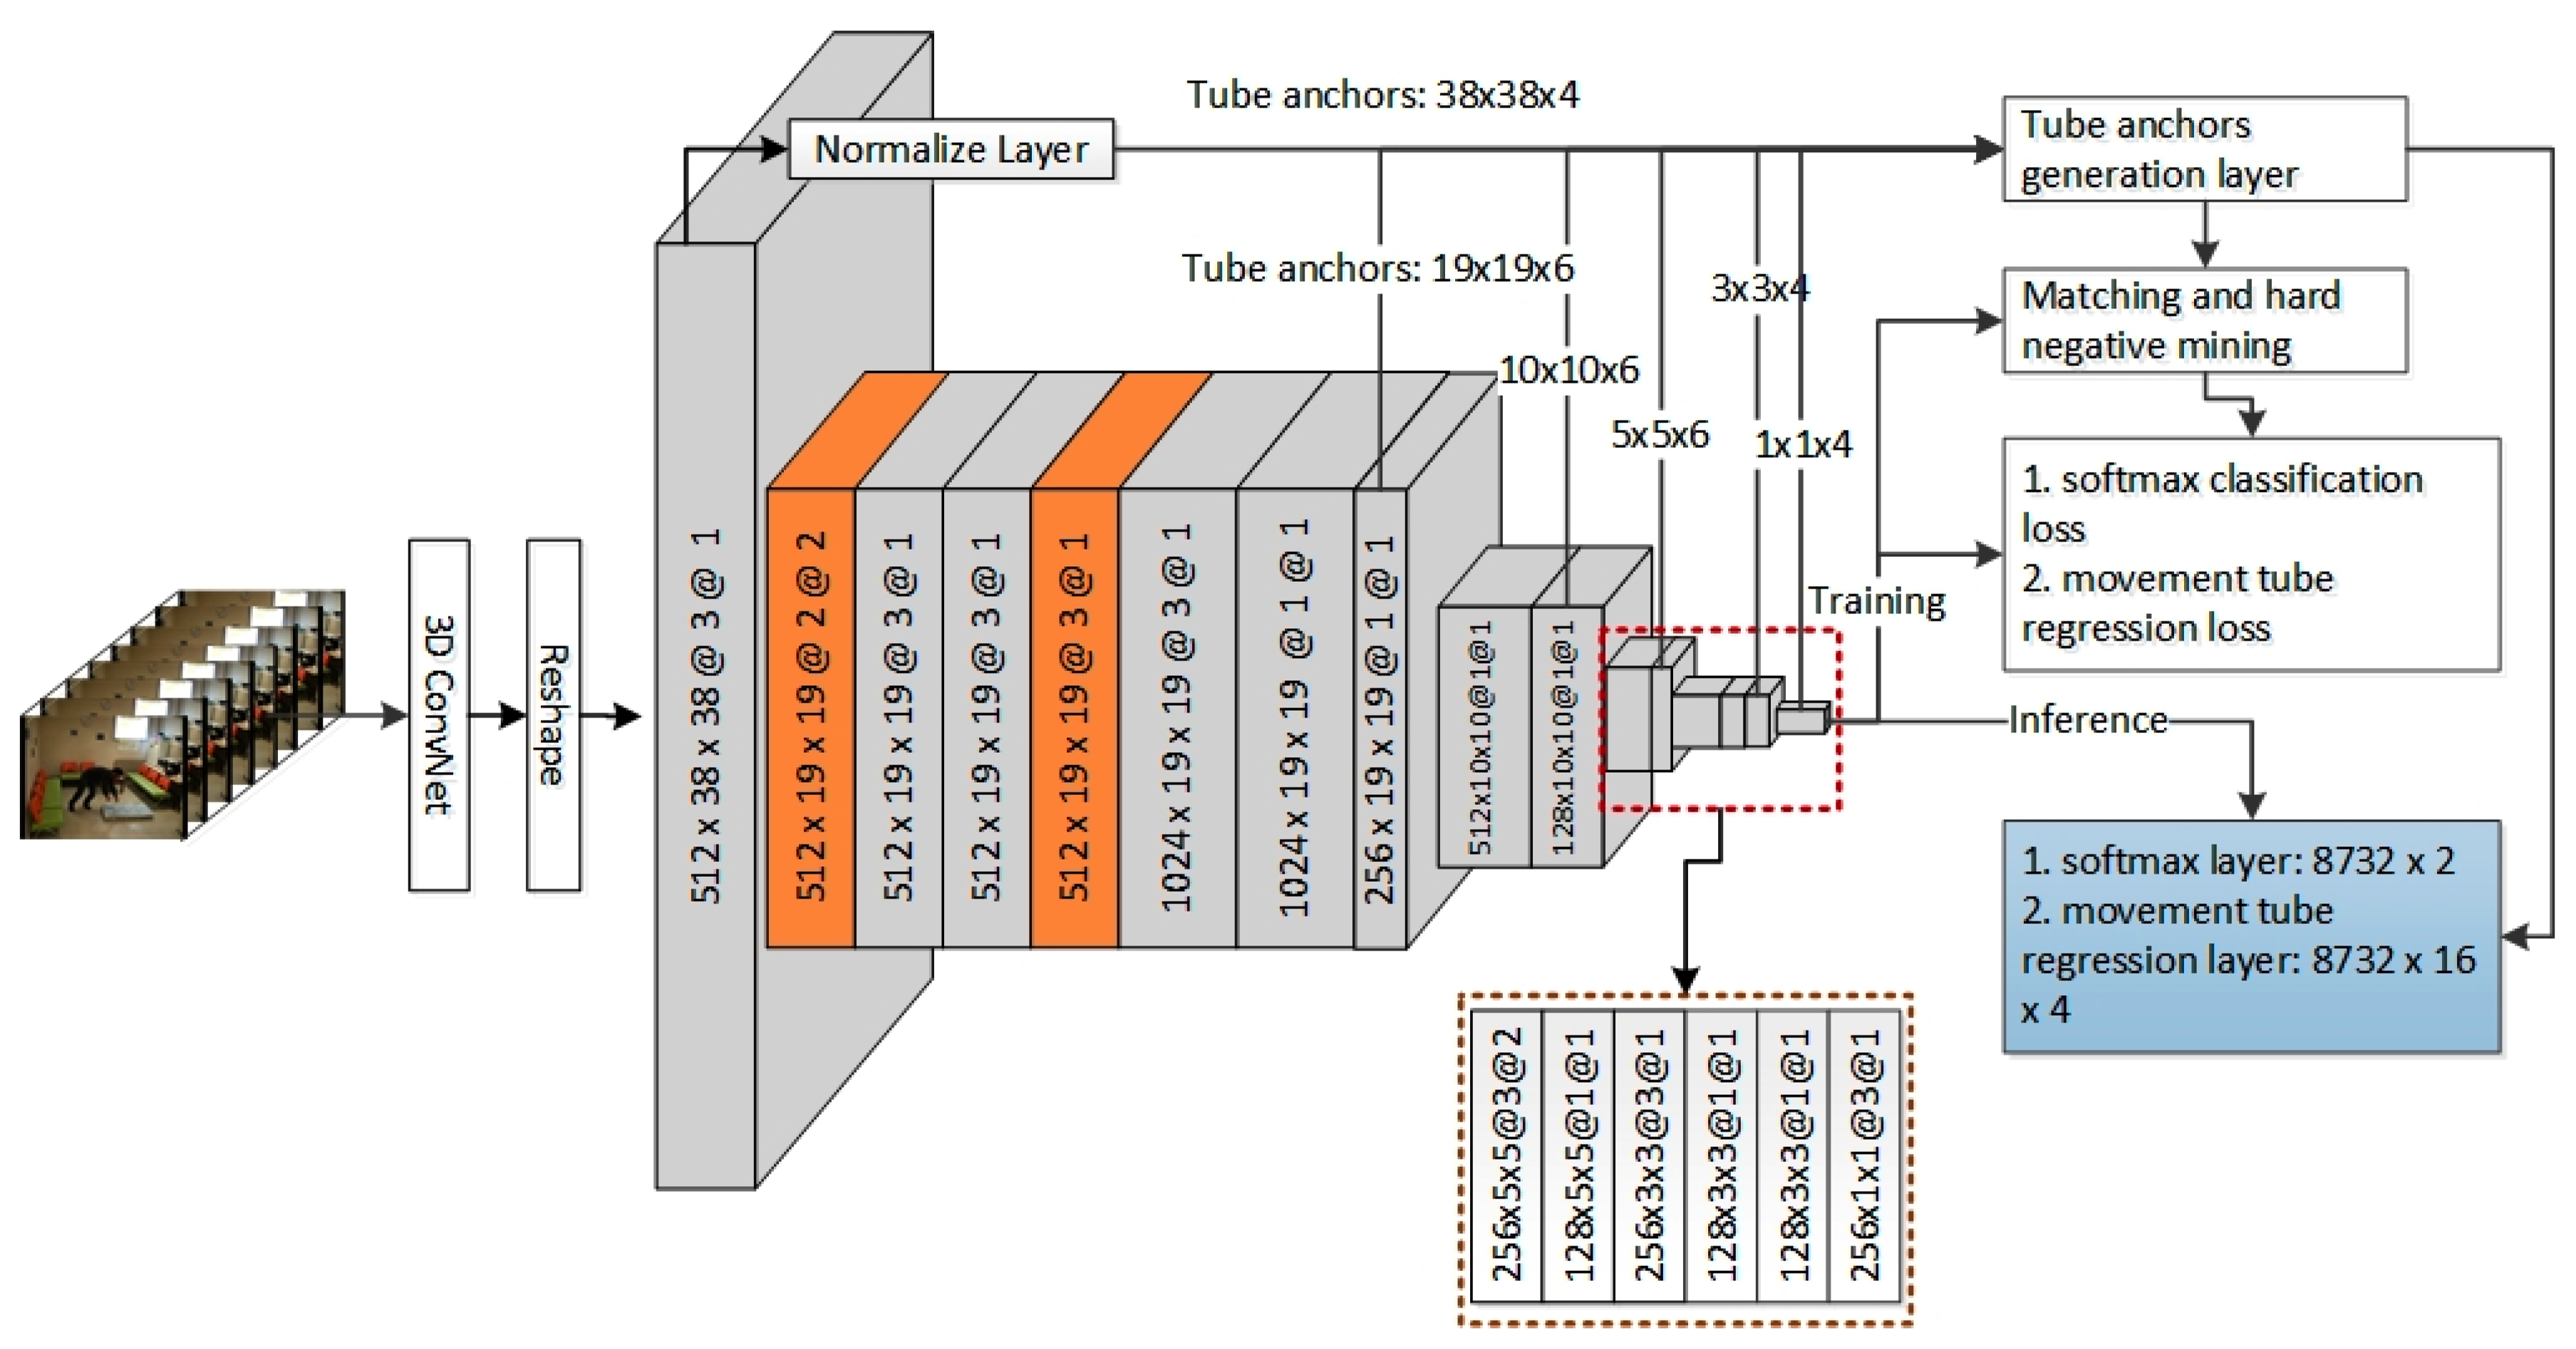
3D ConvNet pools the size of the temporal dimension to 1. To integrate with the rest part of the movement tube detection network, the reshape layer reshapes the 3D features into 2D form. In this paper, SSD, which is one of the most widely used neural networks for object detection, is used to illustrate the tube anchors generation layer and the structure of the movement tube detection network. Figure 3 shows the structure of the proposed network when using SSD as the detection framework which is easily replaced by other object detection networks such as YOLO. The tube anchors generation layer is related to the specific object detection framework. As depicted in Figure 3, in multi-scale pyramid layers, the yellow cuboids represent pooling layers, the other cuboids represent convolution layers. The format of numbers on the cuboids and rectangles are the number of feature maps, height, width, kernel size, and stride of the corresponding layer. The six rectangles in the lower right corner correspond to the last six layers. The sizes of the six different scale feature maps are 38 × 38, 19 × 19, 10 × 10, 5 × 5, 3 × 3, and 1 × 1. For each location, the number of tube anchors of the six different scale feature maps are 4, 6, 6, 6, 4, and 4, respectively. The tube anchors with different aspect ratios, which are evenly distributed in the spatial position of the feature map, enable the algorithm to detect the fall in both spatial and temporal dimension simultaneously. The tube anchor is stacked by 16 successive default boxes that are the same as the default boxes of SSD.
At the training stage, a matching process and hard-negative mining are used to find the positive and negative tube anchors, respectively, which are used to compute the losses. If the mean IOU between the ground truth tube and the default tube anchor is greater than a threshold, the default tube anchor is considered as the positive example. The hard-negative mining considers the top k tubes with maximum classification loss as the negative examples. Then, the softmax classification losses and movement tube regression losses of the positive and negative examples are computed and back propagated to the corresponding anchors.
At the inference stage, the output layer consists of a softmax layer and a movement tube regression layer. The softmax layer is adapted to output two confidence scores which predicate if the action is a human fall and the movement tube regression layer is adapted to output a constrained movement tube for each tube anchor. The number of the confidence score is 2: fall or no fall. The constrained movement tube consists of 16 bounding boxes. Each bounding box has 4 parameters: (x coordinate of center, y coordinate of center, height and width). The output of the regression layer has (4 × 16) 64 parameters. The movement detection tube network is a spatio-temporal network which is capable of detecting a human fall at both spatial and temporal dimensions.

4.3. Loss Function

The objective of the movement tube detection network for human fall detection is to detect the fall in both spatial and temporal dimensions. The network has two sibling output layers. The first outputs bi-classification probabilities of no fall or fall, which are computed by a softmax layer for each tube anchor. The second outputs constrained movement tube. The loss function consists of classification loss and location loss, corresponding to classification and regression inconsistency, respectively. For each tube anchor, the loss is the weighted sum of classification loss (cls) and the location loss (loc). The loss function is defined by Equation (2):
L p ,   u ,   B , V   = L c l s p , u   +   λ u = 1 L l o c B , V
in which λ is a weighted parameter, and indicator function   u = 1 evaluates to 1 when u = 1 and 0 otherwise. The classification loss is defined by Equation (3):
L c l s p , u   = u log p   1 u log 1 p )
The classification loss L c l s p , u is the cross-entropy loss function. p is the probability of fall output by softmax layer. L l o c B , V is location loss function which measures the matching degree between constrained movement tubes B and the ground truth tubes v. When u = 0 , it is the background at the tube anchor, hence the location loss is zero. When u = 1 , the location loss function for the default anchor is the Smooth L1 [36] loss defined by Equations (4) and (5):
L l o c B ,   V   = 1 K k = 1 K i = x , y , w , h S m o o t h L 1 ( b ^ i k v ^ i k ) )
in which S m o o t h L 1 loss is defined by Equation (5):
S m o o t h L 1 x   =   0.5 x 2               i f   x < 1 x     0.5   o t h e r w i s e
For each tube anchor, the regressive constrained movement tube can be represented by B =   b k   |   k = 1 16   a n d   b k =   b x k , b y k , b w k , b h k . The ground truth constrained movement tube is V =   v k   |   k =   1 16   a n d   v k =   v x k , v y k , v w k , v h k . b x k , b y k , b w k , b h k and v x k , v y k , v w k , v h k are the center, width and height of the regressive constrained movement tube and ground truth tube for the k-th frame respectively. b ^ k and v ^ k are four parameterized coordinates of the regressive constrained movement tube and ground truth tube for the k-th frame respectively. The method of parameterization is computed according to the method in the paper [4].
The final loss is the arithmetical mean of the losses of all tube anchors of all training samples. The final loss is defined by Equation (6):
L = 1 N 1 D j = 1 N i = 1 D L p ,   u ,   B , v i j
in which N is the batch size, D is the number of tube anchors.

4.4. Data Augmentation

The data is augmented in three dimensions: illumination, spatial, and temporal. Photo-metric distortions are applied to adjust the model to adapt to illumination changes. At the spatial dimension, each original image is horizontally flipped, scaled, and cropped according to the sample way shown in reference [5]. Then, each sampled patch is resized to fixed resolution (300 × 300). At the temporal dimension, the videos are segmented into two parts: the sequences of frames with fall and the sequences of frames without fall. The fall process lasts for about one second, and most surveillance cameras have a frame rate of 24 or 25 frames, so we assume the fall process lasts about 30 frames. When the frame rate of the camera increases, we can take frames at intervals so that the fall process also lasts 30 frames. The model takes 16 successive frames as input. The fall clips are obtained by sliding the window from left to right through the fall process. There are 15 fall clips consisting of sequences of 16 frames after augmentation at the temporal dimension for each fall process. All sequences without fall are called non-fall clips. In a video, the number of non-fall clips are much larger than that of fall clips. In order to balance fall clips and non-fall clips, all fall clips are used and non-fall clips are randomly sampled when training the model. The effect of the ratio of fall clips and non-fall clips on the results will be discussed in the Section 7.2.

5. Post-Processing and Evaluation Metrics

5.1. Post-Processing

When the confidence score of the tube anchor is beyond a threshold, the responding regressive constrained movement tube is thought to be part of human fall process. Then, non-maximum suppression (NMS) [37] is performed on all constrained movement tubes to filter out most repetitive tubes. At the inference time, the model runs every 8 frames through the videos with 16 frames as input, thus there are 8 frames overlapped between two adjacent regressive movement tubes. After NMS, the adjacent overlapped movement tubes are liked to form the complete constrained movement tubes of the human fall process. The adjacent movement tube linking algorithm is described in Algorithm 1. The idea behind the algorithm is that the adjacent pair of movement tubes should be linked together when the 3DIOU between them is beyond a threshold and the maximum of all pairs of adjacent movement tubes.
Algorithm 1. The adjacent movement tube linking algorithm.
1: Input: { B i j , i = 1 , 9 , , 8 L 16 8 + 1 ; j = 1 ,   2 , N i } , in which B i j =   b k , k =   1 , 2 16 is the j-th sequence of movement tubes of the i-th frame of video. L is the length of video. N i is all sequences of movement tubes of the i-th frame.
2: Output: Tube_list // The output Tube_list is a list of the complete constrained movement tubes.
3: List<List> CTs //CTs are current unfinished tubes.
4:    for (i = 1; i <= 8   L 16 / 8   +   1 ; i++)
5:        for (j = 1; j <= N i ; j++)
6:             Compute 3DIOU between B i j and current all unfinished CTs;
7:             Search the pair < B i j , CT> corresponding to the max IOU.;
8:             If the max 3DIOU is beyond a threshold
9:                 B is added to CT;
10:           Else;
11:                CT is added to the complete movement tube list Tube_list;
12:                B is a new unfinished tube, add B to CTs;
13:   return Tube_list;

5.2. Evaluation Metrics

The performance of the algorithm is evaluated at frame level and slot level. At frame level, drawing lessons from the evaluation of 2D object detection, the mAP is used in the performance of the proposed fall detection algorithm in the spatial dimension. In the field of object detection, Intersection-over-Union (IOU) is often used to measure the overlapping degree between the predicted bounding box and ground truth bounding box. The IOU is defined by Equation (7):
IOU = a r e a b v a r e a b v
in which a r e a b v represents the areas of the intersection of bounding box b and bounding box v. a r e a b v represents the area of the union of bounding box b and bounding box v.
At the slot level, the video is divided into slots by which the number of true positives (TP), false negatives (FN), true negatives (TN), and false positives (FP) are counted. Referring to the Intersection-over-Union (IOU) of 2D object detection, 3DIOU is used to judge the overlapping degree between two tubes. 3DIOU is defined by Equation (8):
3 DIOU =   O V max e g , e p min s g , s p s p < i < e p   and   s g < j < e g a r e a t i v j a r e a t i v j
T =   t k , k =   s p ,   s p + 1 , e p   where   t k =   t x k , t y k , t w k , t h k is the complete constrained movement tube of human fall process. V =   v k , k =   s g ,   s g + 1 , e g   where   v k =   v x k , v y k , v w k , v h k is ground-true tube. s p , e p ,   a n d   s g , e g are start and end frame number of predicated movement tubes and ground truth movement tubes of human fall process respectively. The overlap of T and V is O V = { t i , v j |   s p < i < e p   and   s g < j < e g } . O V is size of set O V .
Sensitivity and specificity are two widely used metrics by the existing algorithm for fall detection. Sensitivity, also known as the true positive rate, is the probability of falls being correctly detected. Specificity, also known as the true negative rate is the probability of no falls being correctly detected. Ideally, both high sensitivity and high specificity are expected, but in fact, a balance between sensitivity and specificity need to be found. The choice of the balance point can be based on the receiver operation characteristic (ROC) curve discussed in Section 7.2. In the case of fall detection as an abnormal action, higher sensitivity is preferred to specificity. The sensitivity, specificity, FAR, and accuracy are defined by Equations (9)–(12), respectively:
Sensitivity = T P T P + F N
Specificity = T N T N + F P
FAR = 1 Specificity
Accuracy = T P + T N T P + T N + F P + F N
in which FAR is false alarm rate. TP, FN, TN, and FN are short for true positive, false negative, true negative and false negative. Besides, for convenience of comparison with other existing fall detection methods, accuracy is also computed.

6. Dataset

This section describes the Le2i fall detection dataset, multiple cameras fall dataset (Multicams), and the proposed large-scale spatio-temporal fall dataset.

6.1. Existing Fall Detection Datasets

In the field of video-based fall detection, the existing fall detection datasets often used by researchers to evaluate the performance of the fall detection algorithms are Le2i dataset [38] and Multicams dataset [39].
In reference [38], Charfi I et al. introduce a realistic Le2i fall detection dataset containing 191 videos captured from four different sceneries: ‘Home’, ‘Coffee room’, ‘Office’, and ‘Lecture room’. The length of videos lasts 30 s–4 min. The Le2i dataset have 130 videos annotated with bounding boxes, 118 of which contain falls. The frame rate is 25 fps and the resolution are 320 × 240 pixels. In reference [39], eight IP cameras are evenly arranged on the ceiling inside the room to shoot the videos simultaneously. The Multicams dataset contains 24 scenarios recorded with 8 IP video cameras, so the total number of videos is 192, each of which lasts 10–45 s. There are 184 videos containing falls. The frame rate is 120 fps, and the resolution is 720 × 480 pixels. The Multicams dataset lacks annotation information indicating the ground truth of the fall position at the frame level. Because the Multicams dataset is not annotated with bounding boxes, the Multicams dataset is not suitable for the spatial and temporal fall detection algorithm proposed in this paper.

6.2. LSST

When lacking a public large scale fall dataset, it is difficult to train modern neural networks with substantial parameters. Both Le2i and Multicams datasets are relatively small scale if used to train deep neural networks which need to consume substantial data. The collected LSST fall detection dataset is a large-scale spatial-temporal fall detection dataset which is abbreviated as the LSST fall detection dataset. The dataset contains 928 videos with a duration from 140 frames to 1340 frames each. One fall occurs in a single video. The resolution of the video is 1024 × 680 pixels at a sampling rate of 24 fps. As depicted in Figure 4, four Hikvision cameras are placed at about 3 m at four corners in the room, the lenses are toward the middle of the room at an angle of 45 degrees with the vertical line. The purpose of using four cameras to record video is to capture more fall instances and to capture the fall process from different perspectives to increase the richness of the LSST fall dataset. In this case, the LSST fall dataset has three characteristics of large scale, annotation, posture, and viewpoint diversities. The videos are captured in two different illumination environments in which one is sunny, and the other is cloudy in a room with open widows. Different orientations of each camera results in different exposure, so the videos have eight different intensities of illumination. There are a lot of different objects in the scene, such as: cartons, blackboard, computers, tables and chairs, and so on. The actors fall on the yellow foam mattress of 3 × 5 m. There are ten actors involved in the collected videos. The ten actors wear different colors and styles of clothes, and their body shapes are different. Each actor falls from 17 to 30. The actors fall at various postures, such as: forward fall, backward fall, fast fall, slow fall and so on. The dataset simulates the diversities of the relative postures and the distances between the human fall and the camera; thus, it increases the difficulties of the fall detection algorithm. Meanwhile, the persons are annotated with bounding boxes. The LSST fall detection dataset can be used to evaluate the algorithms which detect fall in spatial dimension and temporal dimension. To the best of our knowledge, the proposed fall dataset is the largest in terms of scale and resolution so far. The LSST fall detection dataset is split into a training set and test set. Eight actors are assigned to the training set, and the other two actors are assigned to the test set. The ratio of training set to test set is 8:2.
Table 2 shows the number of falls, the number of total frames, the number of fall frames, and the number of no fall frames in Le2i, Multicams, and LSST fall dataset. By comparison, the LSST dataset is much larger than the Le2i dataset and the Multicams datasets in terms of scale and resolution, furthermore, the persons in LSST are annotated with bounding boxes. When the two datasets are used to train the proposed network respectively, the algorithm demonstrates a better performance on the LSST dataset than the Le2i.

7. Experiments and Discussion

The experiments are implemented on Inter(R) Xeon(R) E-2136 CPU @ 3.30GHz (Intel, Santa Clara, CA, USA) with NVIDIA P5000 GPU (NVIDIA, Santa Clara, CA, USA). The proposed network is implemented on Lei2 dataset and LSST dataset.

7.1. Implementation Details

This section discusses the implementation details and hyper-parameters. Mini-batch stochastic gradient descent (SGD) is used to optimize the loss function defined by Equation (5). The mini-batch size is equal to 8. When the number of iterations is equal to 40,000, the loss function tends to be stable. AN L2 regularization is used to constrain the weights to a smaller value and reduce the problem of model over-fitting. The learning rate is decreased by step policy so that the update step of model weights became smaller and more subtle in the later stage of learning. The algorithm is implemented with CAFFE (Convolutional Architecture) for Fast Feature Embedding [40]. The hyper-parameter values are listed in the Table 3.

7.2. Ablation Study

The purpose of ablation studies is to find how the varied factor affects the performance of the model when other factors are fixed. In this section, three ablation studies are implemented to evaluate the effects of three factors on the performance of the algorithm. The three factors are the threshold of 3DIOU, the ratio of fall clips and non-fall clips, and the size of the dataset. Three ROC curves are used to compare the effect of different thresholds of 3DIOU, different ratios of fall clips and non-fall clips and different datasets on the result of fall detection respectively. To draw ROC curves, we compute eight different sensitivities and specificities at eight thresholds of confidence score which are [0.4, 0.45, 0.5, 0.6, 0.7, 0.75, 0.8, and 0.9]. In Figure 5, the X-axis and Y-axis are false alarm rate (FAR) and sensitivity, respectively. In the case of fall detection, the greater the sensitivity, the better the performance of the algorithm. Under a certain sensitivity, the lower the false alarm rate, the better the performance of the algorithm. The ablation studies on 3DIOU and positive negative sampling ratios are tested on LSST dataset.
3DIOU is a metric for measuring the accuracy of result of the spatial-temporal fall location. This metric is used to measure the overlap degree between reality and prediction. The higher the overlap degree, the higher the value. A detection is considered correct if its 3DIOU with the ground-truth bounding boxes is beyond a threshold δ. In this paper, the sensitivity and specificity at threshold δ =   0.25 , 0.5 are computed. In Figure 5a, the green curve and yellow curve correspond to the ROC curves with δ =   0.25 and δ =   0.5 , respectively. It shows that the false alarm rate of δ =   0.25 is lower than that of δ =   0.5 when the sensitivity is equal. On THUMOS15, in the temporal action detection task, if the temporal IOU is larger than 0.5, the detection is correct. In the fall detection task, the system not only outputs the location of the fall, but also the start and end time of the fall. A smaller δ =   0.25 as threshold of 3DIOU is used in other experiments of this paper.
The input clip consists of 16 successive frames. In a video, the number of non-fall clips is much greater than that of fall clips. In the training stage, non-fall clips are randomly sampled so as to balance the number of fall clips and non-fall clips. The clip in in human fall instance is a positive clip, otherwise it is a negative clip. The training results are greatly influenced by the ratio of positive clip and negative clips. In Figure 5b, the green curve and yellow curve correspond to the ROC curves with of 1:3 and 4:1 of positive clip and negative clip ratio, respectively. The green ROC curve is on the left of the yellow ROC curve. Comparing the negative clips with the positive clips, the model generates more false alarms when the positive clips are more than the negative clips. Figure 5b shows that the performance of the model trained with a ratio of 1:3 of positive clips to negative clips, this model is superior to the performance of the model trained with a ratio of 4:1 of positive clips to negative clips.
The third ablation study is to compare the performance of the model which is trained by LSST and Le2i respectively. The larger the amount of the dataset, the more effective it is to prevent the over-fitting of a deep neural network with huge numbers of parameters. In Figure 5c, the green curve and yellow curve correspond to the ROC curves with LSST and Le2i, respectively. The green ROC curve is above the green ROC curve between the two intersections of two curves. Compared with the green ROC curve, the sensitivity of green ROC curve achieves 100% quickly. Figure 5c demonstrates that the performance of the model trained by LSST is more effective than that of the model trained by Le2i.

7.3. Comparison to the State of the Art

In this section, the proposed fall detection method is compared with other state-of-the-art vision-based fall detection methods on Le2i. In the field of vision-based fall detection, sensitivity and specificity are widely used as evaluation metrics by researchers [20,21,22,23,32,33]. In addition, accuracy is also one of the evaluation metrics in some papers [21,22,23]. For a fair comparison, the proposed method is compared with the papers [21,23,32,33], in which the Le2i fall dataset is used to test the performance of the algorithms.
Table 4 describes the comparison of the performance of fall detection methods on Le2i. According to Equations (9)–(12), sensitivity, specificity, and accuracy are determined by the number of true positive (TP), false negative (FN), true negative (TN), and false positive (FP). Different measurement methods of TP, FN, TN, and FP lead to different values of sensitivity, specificity, and accuracy. There are two methods of measurement, one is the video level at which the number of TP, FN, TN, and FP are counted by whole video, and the other is the slot level at which the video is divided into slots and the numbers are counted by slot. Even on the same dataset, it is difficult to make completely fair comparisons of the results if the evaluating method is different. For example, if false positives are concentrated in a few videos, the performance of evaluation at the video level will be better than that at the slot level.
In reference [32], the model trained by synthetic data lacks realism, which leads to low sensitivity and low specificity. In reference [33], Fan Y et al. computed sensitivity and specificity at the video level, thus, they did not consider the impact of the duration of videos on the statistical results. In reference [23], the authors reported an accuracy of 97.02%. In the absence of other metrics, the performance of the algorithm cannot be well measured by the accuracy. Because the number of falls is much smaller than that of non-falls, even if there are many missed detections (false negatives), the algorithm can still lead to high accuracy. In reference [21], the authors evaluated the performance of the fall detection systems at slot level with 10 frames length. Instead of using 10 frames length slot, in this paper, the number of TP, FN, TN and FP is counted at slot level with 16 frames length which is exactly the length of the input to the model in the experiments. The sensitivity, specificity, and accuracy are 100%, 97.04%, and 97.23%, respectively, which is higher than that of existing state-of-the-art methods [21,23,32]. Besides, the mAP at frame level is only reported by the proposed method in this paper at the fifth column in Table 4.

7.4. The Result of the Proposed Method

In this section, two experiments are implemented to validate the effectiveness of the proposed method. One is on Le2i dataset and LSST dataset. Another is on the scenario with two persons.
Table 5 describes the sensitivity, specificity, accuracy, and mAP of the proposed algorithm on Le2i dataset and LSST dataset at slot level. In the experiments, when the confidence score is above 0.45, the algorithm achieves best balance between sensitivity and specificity. We investigate the IOU threshold of σ =   0.25 , 0.5 and 3DIOU threshold of δ =   0.25 , 0.5 . The performance of the algorithm is evaluated at frame level and slot level. At slot level, the performance on LSST dataset is lightly superior to that on Le2i. From Table 5, when δ =   0.25 , sensitivity is 100% on two datasets and FAR is 2.96% and 1.81% on Le2i dataset and LSST dataset respectively. When δ =   0.5 , the performance decreases on both the Le2i dataset and the LSST dataset. It is worth noting that the sensitivity on the LSST dataset is 3.58% bigger than that on Le2i with δ =   0.5 , this shows that the performance on the LSST dataset is better than that on the Le2i dataset especially in terms of temporal dimension. The sensitivity at video level is the same as at slot level. It shows that the diversity and quantity of LSST have a positive impact on the training performance of the model.
In Le2i and LSST fall datasets, there is one fall in each video, so the TN and FP are zero at video level. At the test stage, at least one fall is detected per video, so the specificity is 100% at video level. The sensitivity is only related to TP, FN. The TP and FN at video level equal TP and FN at slot level divided by slot number of fall process respectively. The sensitivity and accuracy at video level are the same as at slot level. From this we can see that the video level sensitivity is not as significant as the frame level sensitivity.
At the frame level, the evaluation does not consider that the length of input to the model is smaller than the length of fall process and fall detection is more difficult than the human body detection. The mAP on LSST dataset is 11.36%, 11.25% smaller than that on Le2i dataset with σ =   0.25 , and σ =   0.5 respectively. That is because the resolution of LSST is 1024 × 680 pixels much bigger than that of Le2i is 320 × 240 pixels. When the videos resized to 300 × 300, the pixel area of the person in LSST is about 36 × 100, much smaller than that in Le2i. In reference [5], the authors claim that SSD has much worse performance on smaller objects than bigger objects.
From Figure 6, the effect of encapsulating the human body with bounding boxes at the top row is better than that at down low; it indirectly illustrates that the mAP on LSST is lower than that on Le2i in Table 5. In Figure 6, the first row and the second row describe four frames of a fall process instance from Le2i dataset and LSST dataset, respectively. In Figure 6a–d are the first, tenth, twentieth, and thirtieth frame of the fall process. The green box is the bounding box detected by the proposed model. The red numbers on the green boxes are the confidence scores averaged by adjacent outputs.
Another experiment is implemented to test the performance of the proposed algorithm in the case of two persons in the scenario. Four videos are captured in the scenario where there are two persons. The total length of all videos last 18 min 40 s, 28,000 frames. Figure 7 shows four instances of the human fall process. The first, second and third row are the first, fifteenth, and thirtieth frame of the fall process. Figure 7a–c are true positive samples. In Figure 7a, there are two persons fall at the same time. In Figure 7b, a person is partially occluded by another during the fall process. In Figure 7c, a person falls in front of another. In Figure 7d, the body of the fall person is largely occluded by another; in this situation, the fall fails to be detected. The experimental result validates that the proposed algorithm can deal with the situation of interpersonal inference and interpersonal partial occlusion in the process of human fall.

8. Conclusions

A movement tube detection network is proposed to detect multiple falls in both spatial and temporal dimensions. Compared with those detection networks that encode appearance and motion features separately, the movement tube detection network integrates the 3D convolution neural network and object detection framework to detect human fall with a constrained movement tube in a unified neural network. A 3D convolutional neural network is used to encode the motion and appearance features of a video clip, which are fed into the tube anchors generation layer, softmax classification, and movement tube regression layer similar to those of the object detection framework. In this network, the bounding boxes generation layer and boxes regression layer in the object detection framework is extended to the tube anchors generation layer and movement tube anchors generation layer, respectively. The softmax classification layer is adjusted to output bi-classification probabilities of tube anchors generated by the tube anchors generation layer. The movement tube regression layer finetunes the tube anchors to constrained movement tubes closely encapsulating the fall person. The constrained movement tubes enable the algorithm to deal with the situation of interpersonal inference and interpersonal partial occlusion. In order to meet the requirement of deep neural network for large amount of data, a large-scale spatio-temporal fall dataset is constructed using self-collected data. The dataset has three characteristics: large scale, annotation, and posture and viewpoint diversities. The persons in the videos are annotated with bounding boxes. The dataset has diversities in terms of the posture of human fall and the relative position and the distance between the human body and the camera. The movement tube detection network is trained on the public Lei2 fall dataset and the proposed LSST fall dataset, respectively. The experiment results demonstrate the validity of the proposed network in expressing the intrinsic appearance and motion features of the human fall process.
3D Convolution is time-consuming, the model finds it difficult to meet the real-time requirements for fall detection. In the future, a lightweight model and execution efficiency will be further researched to further improve the proposed method.

Author Contributions

Conceptualization, S.Z., W.M., and Q.W.; data curation, S.Z.; funding acquisition, W.M.; methodology, S.Z., W.M., and Q.W.; software, S.Z., L.L., and X.Z.; supervision, W.M.; validation, L.L. and Q.W.; writing—original draft, S.Z., L.L., and X.Z.; writing—review and editing, S.Z., W.M., and X.Z. All authors have read and agreed to the published version of the manuscript.

Funding

This work was supported by the National Natural Science Foundation of China (Grant No. 62076117 and 61762061), the Natural Science Foundation of Jiangxi Province, China (Grant No. 20161ACB20004) and Jiangxi Key Laboratory of Smart City (Grant No. 20192BCD40002).

Data Availability Statement

The LSST data presented in this study are available on request from the corresponding author.

Conflicts of Interest

The authors declare no conflict of interest.

References

  1. Yao, C.; Hu, J.; Min, W.; Deng, Z.; Zou, S.; Min, W. A novel real-time fall detection method based on head segmentation and convolutional neural network. J. Real-Time Image Process. 2020, 17, 1939–1949. [Google Scholar] [CrossRef]
  2. Ren, L.; Peng, Y. Research of Fall Detection and Fall Prevention Technologies: A Systematic Review. IEEE Access 2019, 7, 77702–77722. [Google Scholar] [CrossRef]
  3. World Health Organization. WHO Global Report on Falls Prevention in Older Age; World Health Organization: Geneva, Switzerland, 2008; ISBN 978-92-4-156353-6. [Google Scholar]
  4. Ren, S.; He, K.; Girshick, R.; Sun, J. Faster R-CNN: Towards Real-Time Object Detection with Region Proposal Networks. IEEE Trans. Pattern Anal. Mach. Intell. 2017, 39, 1137–1149. [Google Scholar] [CrossRef] [PubMed] [Green Version]
  5. Liu, W.; Anguelov, D.; Erhan, D.; Szegedy, C.; Reed, S.; Fu, C.-Y.; Berg, A.C. SSD: Single Shot MultiBox Detector. In Proceedings of the Computer Vision—ECCV 2016, Amsterdam, The Netherlands, 11–14 October 2016; Leibe, B., Matas, J., Sebe, N., Welling, M., Eds.; Springer International Publishing: Berlin/Heidelberg, Germany, 2016; pp. 21–37. [Google Scholar]
  6. Redmon, J.; Divvala, S.; Girshick, R.; Farhadi, A. You Only Look Once: Unified, Real-Time Object Detection. In Proceedings of the 2016 IEEE Conference on Computer Vision and Pattern Recognition (CVPR), Las Vegas, NV, USA, 27–30 June 2016; IEEE: Piscataway, NJ, USA, 2016; pp. 779–788. [Google Scholar]
  7. Ji, S.; Xu, W.; Yang, M.; Yu, K. 3D Convolutional Neural Networks for Human Action Recognition. IEEE Trans. Pattern Anal. Mach. Intell. 2013, 35, 221–231. [Google Scholar] [CrossRef] [Green Version]
  8. Singh, G.; Saha, S.; Sapienza, M.; Torr, P.; Cuzzolin, F. Online Real-Time Multiple Spatiotemporal Action Localisation and Prediction. In Proceedings of the 2017 IEEE International Conference on Computer Vision (ICCV), Venice, Italy, 22–29 October 2017; IEEE: Piscataway, NJ, USA, 2017; pp. 3657–3666. [Google Scholar]
  9. Kalogeiton, V.; Weinzaepfel, P.; Ferrari, V.; Schmid, C. Action Tubelet Detector for Spatio-Temporal Action Localization. In Proceedings of the 2017 IEEE International Conference on Computer Vision (ICCV), Venice, Italy, 22–29 October 2017; pp. 4415–4423. [Google Scholar]
  10. Yang, H.; Liu, L.; Min, W.; Yang, X.; Xiong, X. Driver Yawning Detection Based on Subtle Facial Action Recognition. IEEE Trans. Multimed. 2021, 23, 572–583. [Google Scholar] [CrossRef]
  11. Soomro, K.; Zamir, A.R.; Shah, M. UCF101: A Dataset of 101 Human Actions Classes From Videos in The Wild. arXiv 2012, arXiv:1212.0402. [Google Scholar]
  12. Dhiman, C.; Vishwakarma, D.K. A review of state-of-the-art techniques for abnormal human activity recognition. Eng. Appl. Artif. Intell. 2019, 77, 21–45. [Google Scholar] [CrossRef]
  13. Yu, X. Approaches and principles of fall detection for elderly and patient. In Proceedings of the HealthCom 2008—10th International Conference on e-Health Networking, Applications and Services, Singapore, 7–9 July 2008; IEEE: Piscataway, NJ, USA, 2008; pp. 42–47. [Google Scholar]
  14. Wang, Z.; Ramamoorthy, V.; Gal, U.; Guez, A. Possible Life Saver: A Review on Human Fall Detection Technology. Robotics 2020, 9, 55. [Google Scholar] [CrossRef]
  15. Augustyniak, P.; Smoleń, M.; Mikrut, Z.; Kańtoch, E. Seamless Tracing of Human Behavior Using Complementary Wearable and House-Embedded Sensors. Sensors 2014, 14, 7831–7856. [Google Scholar] [CrossRef] [PubMed] [Green Version]
  16. Medrano, C.; Plaza, I.; Igual, R.; Sánchez, Á.; Castro, M. The Effect of Personalization on Smartphone-Based Fall Detectors. Sensors 2016, 16, 117. [Google Scholar] [CrossRef] [PubMed]
  17. Luque, R.; Casilari, E.; Morón, M.-J.; Redondo, G. Comparison and Characterization of Android-Based Fall Detection Systems. Sensors 2014, 14, 18543–18574. [Google Scholar] [CrossRef] [PubMed]
  18. Mubashir, M.; Shao, L.; Seed, L. A survey on fall detection: Principles and approaches. Neurocomputing 2013, 100, 144–152. [Google Scholar] [CrossRef]
  19. Min, W.; Zou, S.; Li, J. Human fall detection using normalized shape aspect ratio. Multimed. Tools Appl. 2018, 78, 14331–14353. [Google Scholar] [CrossRef]
  20. Alhimale, L.; Zedan, H.; Al-Bayatti, A. The implementation of an intelligent and video-based fall detection system using a neural network. Appl. Soft Comput. 2014, 18, 59–69. [Google Scholar] [CrossRef]
  21. Núñez-Marcos, A.; Azkune, G.; Arganda-Carreras, I. Vision-Based Fall Detection with Convolutional Neural Networks. Wirel. Commun. Mob. Comput. 2017, 2017, 9474806. [Google Scholar] [CrossRef] [Green Version]
  22. Charfi, I.; Miteran, J.; Dubois, J.; Atri, M.; Tourki, R. Definition and Performance Evaluation of a Robust SVM Based Fall Detection Solution. In Proceedings of the 2012 Eighth International Conference on Signal Image Technology and Internet Based Systems, Naples, Italy, 25–29 November 2012; IEEE: Piscataway, NJ, USA, 2012; pp. 218–224. [Google Scholar]
  23. Zerrouki, N.; Houacine, A. Combined curvelets and hidden Markov models for human fall detection. Multimed. Tools Appl. 2018, 77, 6405–6424. [Google Scholar] [CrossRef]
  24. Russakovsky, O.; Deng, J.; Su, H.; Krause, J.; Satheesh, S.; Ma, S.; Huang, Z.; Karpathy, A.; Khosla, A.; Bernstein, M.; et al. ImageNet Large Scale Visual Recognition Challenge. Int. J. Comput. Vis. 2015, 115, 211–252. [Google Scholar] [CrossRef] [Green Version]
  25. Krizhevsky, A.; Sutskever, I.; Hinton, G.E. ImageNet classification with deep convolutional neural networks. Commun. ACM 2017, 60, 84–90. [Google Scholar] [CrossRef]
  26. Simonyan, K.; Zisserman, A. Very Deep Convolutional Networks for Large-Scale Image Recognition. arXiv 2014, arXiv:1409.1556. [Google Scholar]
  27. Sanchez, J.; Perronnin, F. High-dimensional signature compression for large-scale image classification. In Proceedings of the CVPR 2011, Colorado Springs, CO, USA, 20–25 June 2011; IEEE: Piscataway, NJ, USA, 2011; pp. 1665–1672. [Google Scholar]
  28. Simonyan, K.; Zisserman, A. Two-Stream Convolutional Networks for Action Recognition in Videos. In Advances in Neural Information Processing Systems 27; Ghahramani, Z., Welling, M., Cortes, C., Lawrence, N.D., Weinberger, K.Q., Eds.; Curran Associates, Inc.: Red Hook, NY, USA, 2014; pp. 568–576. [Google Scholar]
  29. Donahue, J.; Hendricks, L.A.; Rohrbach, M.; Venugopalan, S.; Guadarrama, S.; Saenko, K.; Darrell, T. Long-Term Recurrent Convolutional Networks for Visual Recognition and Description. IEEE Trans. Pattern Anal. Mach. Intell. 2017, 39, 677–691. [Google Scholar] [CrossRef] [PubMed]
  30. Shi, X.; Chen, Z.; Wang, H.; Yeung, D.-Y.; Wong, W.; Woo, W. Convolutional LSTM Network: A Machine Learning Approach for Precipitation Nowcasting. In Proceedings of the 28th International Conference on Neural Information Processing Systems—Volume 1, Montreal, QC, Canada, 8–13 December 2014; MIT Press: Cambridge, MA, USA, 2015; pp. 802–810. [Google Scholar]
  31. Tran, D.; Bourdev, L.; Fergus, R.; Torresani, L.; Paluri, M. Learning Spatiotemporal Features with 3D Convolutional Networks; IEEE: Piscataway, NJ, USA, 2015; pp. 4489–4497. [Google Scholar]
  32. Asif, U.; Mashford, B.; Cavallar, S.V.; Yohanandan, S.; Roy, S.; Tang, J.; Harrer, S. Privacy Preserving Human Fall Detection using Video Data. Proceedings of the Machine Learning for Health Workshop. 2020. Available online: http://proceedings.mlr.press/v116/asif20a.html (accessed on 21 November 2020).
  33. Fan, Y.; Levine, M.D.; Wen, G.; Qiu, S. A deep neural network for real-time detection of falling humans in naturally occurring scenes. Neurocomputing 2017, 260, 43–58. [Google Scholar] [CrossRef]
  34. Kong, Y.; Huang, J.; Huang, S.; Wei, Z.; Wang, S. Learning spatiotemporal representations for human fall detection in surveillance video. J. Vis. Commun. Image Represent. 2019, 59, 215–230. [Google Scholar] [CrossRef]
  35. Lu, N.; Wu, Y.; Feng, L.; Song, J. Deep Learning for Fall Detection: Three-Dimensional CNN Combined With LSTM on Video Kinematic Data. IEEE J. Biomed. Health Inform. 2019, 23, 314–323. [Google Scholar] [CrossRef] [PubMed]
  36. Girshick, R. Fast R-CNN. In Proceedings of the 2015 IEEE International Conference on Computer Vision (ICCV), Santiago, Chile, 7–13 December 2015; IEEE: Santiago, Chile, 2015; pp. 1440–1448. [Google Scholar]
  37. Neubeck, A.; Gool, L.V. Efficient Non-Maximum Suppression. In Proceedings of the 18th International Conference on Pattern Recognition (ICPR’06), Hong Kong, China, 20–24 August 2006; Volume 3, pp. 850–855. [Google Scholar]
  38. Charfi, I.; Miteran, J.; Dubois, J.; Atri, M.; Tourki, R. Optimised spatio-temporal descriptors for real-time fall detection: Comparison of SVM and Adaboost based classification. J. Electron. Imaging 2013, 22, 17. [Google Scholar] [CrossRef]
  39. Auvinet, E.; Rougier, C.; Meunier, J.; St-Arnaud, A.; Rousseau, J. Multiple Cameras Fall Data Set; Technical Report; DIRO-Université de Montréal: Montreal, QC, Canada, 2010; Volume 24. [Google Scholar]
  40. Jia, Y.; Shelhamer, E.; Donahue, J.; Karayev, S.; Long, J.; Girshick, R.; Guadarrama, S.; Darrell, T. Caffe: Convolutional Architecture for Fast Feature Embedding. arXiv 2014, arXiv:1408.5093. [Google Scholar]
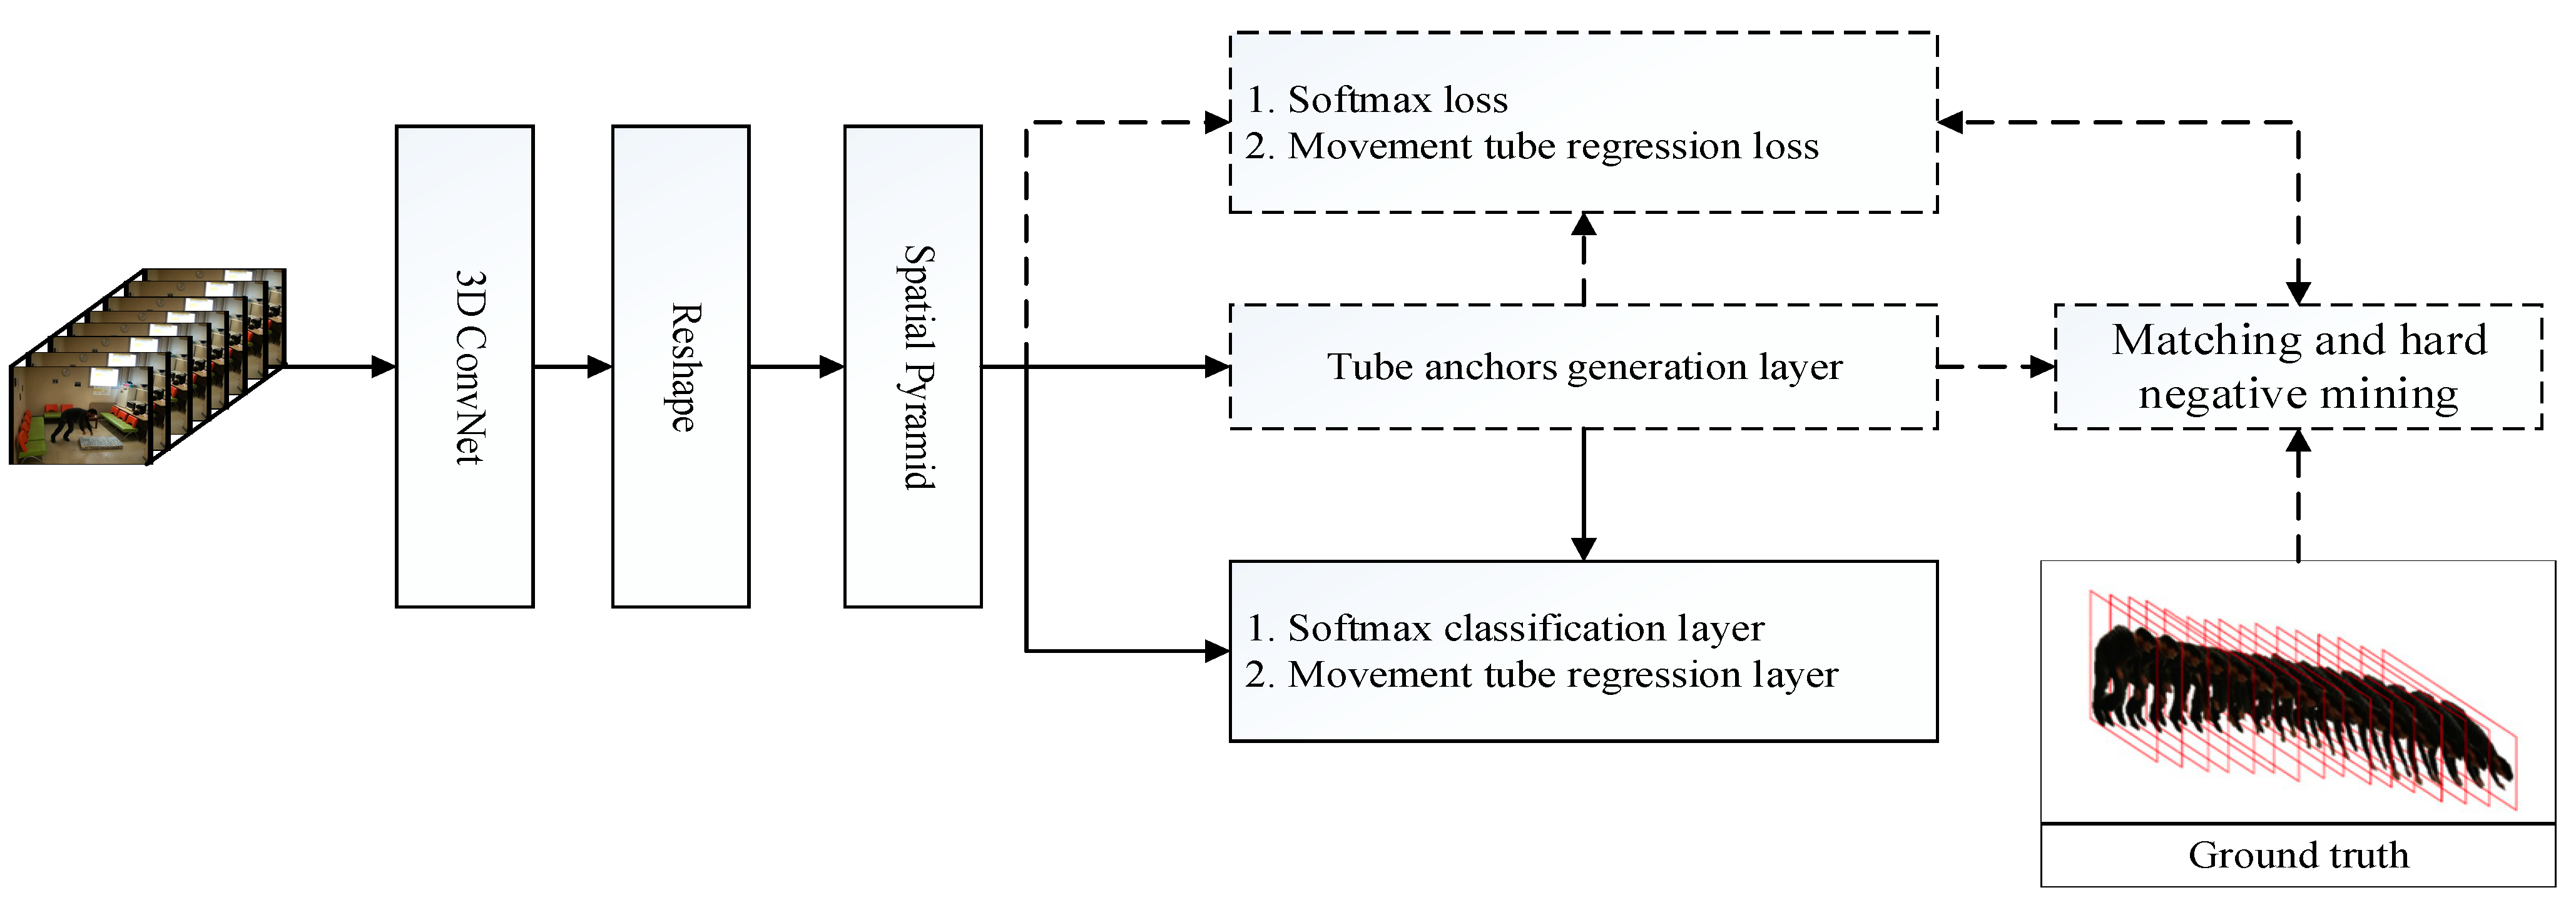
Figure 1. The overview of the proposed method. The model consists of six components: 3D ConvNet, Spatial Pyramid, tube anchors generation layer, matching and hard negative mining, loss layer and output layer. The dotted lines describe the components at training stage. The solid lines describe the components at the inference stage.
Electronics 10 00898 g001
Figure 2. The constrained movement tube: (a) A fall person who is well constrained by a movement tube; (b) the comparison of three manners of bounding boxes encapsulating the person.
Electronics 10 00898 g002
Figure 3. The structure of movement tube detection network. It consists of three components: 3D ConvNet, tube anchors generation layer, and output layer.
Electronics 10 00898 g003
Figure 4. The layout of cameras. CAM0 and CAM2 are placed at near the window, with the lens back to the window. CAM1 and CAM3 are placed away from window and the lens are facing the window: (a) CAM0; (b) CAM1; (c) CAM2; (d) CAM3; (e) shows the space size of the scence and the layout of cameras in the scence.
Electronics 10 00898 g004
Figure 5. Receiver operation characteristic (ROC) comparison of three ablation studies. (a) ROC comparison between δ =   0.25 and δ =   0.5 ; (b) ROC comparison between positive and negative clips with a ratio of 1:3 and positive and negative clips with a ratio of 4:1; (c) ROC comparison between large-scale spatio-temporal (LSST) and Le2i.
Electronics 10 00898 g005
Figure 6. Two instances of falls correctly detected. The top row comes from Le2i dataset, the down row comes from LSST dataset. The numbers on the green boxes are the confidence scores averaged by adjacent outputs: (a) The first frame of the fall process; (b) The tenth frame of the fall process; (c) The twentieth frame of the fall process; (d) The thirtieth frame of the fall process.
Electronics 10 00898 g006
Figure 7. Four instances of the human fall process in the experiment with two persons in the scene: (a) Two persons who are not next to each other fall; (b) One person behind another fall; (c) One person in front of another fall; (d) One person mostly occluded by another fall.
Electronics 10 00898 g007
Table 1. The 3D ConvNet used in the proposed model. All convolution layers and pooling layers are three-dimensional. All 3D convolution kernels are 3 × 3 × 3 with stride 1 in both spatial and temporal dimensions. F-size, T-size, and S-size are short for feature size, temporal size, and spatial size, respectively.
NameInputConv1aPool1Conv2aPool2Conv3aPool3Conv4aConv4bPool4
Stride-1 × 1 × 12 × 1 × 11 × 1 × 12 × 2 × 21 × 1 × 12 × 2 × 21 × 1 × 11 × 1 × 12 × 1 × 1
F-size36464128128256256512512512
T-size161688442221
S-size300 × 300300 × 300300 × 300300 × 300150 × 150150 × 15075 × 7575 × 7575 × 7538 × 38
Table 2. The statistics of Le2i, Multicams, and large-scale spatio-temporal (LSST) dataset: number of falls, total frames, number of fall frames, and number of no fall frames. The notation # means that only the video-annotated bounding boxes are counted.
DatasetFalls/#Total Frames/#Fall Frames/#No Fall Frames/#
Le2i192/118108,476/29,2373825/3540104,651/25,697
Multicams184/0261,137/07880/0253,257/0
LSST928/928331,755/331,75527,840/27,840303,915/303,915
Table 3. The hyper-parameter values used in the mini-batch SGD.
Minibatch SizeTypeBase_LrMax_IterLr_PolicyStepsizeGammaMomentumWeight_Decay
8SGD0.00000540,000step10,0000.10.90.00005
Table 4. Comparison of the proposed fall detection method with other state-of-the-art fall detection methods on Le2i.
MethodSensitivitySpecificityAccuracymAP
Núñez-Marcos A [21]99.00%97.00%97.00%-
Zerrouki [23]--97.02%-
Asif, U [32]0.92450.9244--
Fan Y [33]100.00%98.43%--
The method in this paper100.00%97.04%97.23%78.94%
Table 5. The performance of the proposed algorithm on Lei2 and LSST dataset at slot level.
DatasetSensitivitySpecificityAccuracymAPSensitivitySpecificityAccuracymAP
δ =   0.25 σ =   0.25 δ =   0.5 σ =   0.5
Le2i100.00%97.04%97.23%78.94%94.74%96.30%95.85%74.85%
LSST100.00%98.18%98.03%68.69%98.32%98.07%98.09%63.10%
Publisher’s Note: MDPI stays neutral with regard to jurisdictional claims in published maps and institutional affiliations.