Article

Double-Threshold Segmentation of Panicle and Clustering Adaptive Density Estimation for Mature Rice Plants Based on 3D Point Cloud

School of Agricultural Engineering, Jiangsu University, Zhenjiang 212013, China
*
Authors to whom correspondence should be addressed.
Electronics 2021, 10(7), 872; https://doi.org/10.3390/electronics10070872
Submission received: 13 March 2021 / Revised: 1 April 2021 / Accepted: 2 April 2021 / Published: 6 April 2021
(This article belongs to the Collection Electronics for Agriculture)

Abstract

:
Crop density estimation ahead of the combine harvester provides a valuable reference for operators to keep the feeding amount stable in agriculture production, and, as a consequence, guaranteeing the working stability and improving the operation efficiency. For the current method depending on LiDAR, it is difficult to extract individual plants for mature rice plants with luxuriant branches and leaves, as well as bent and intersected panicles. Therefore, this paper proposes a clustering adaptive density estimation method based on the constructed LiDAR measurement system and double-threshold segmentation. The Otsu algorithm is adopted to construct a double-threshold according to elevation and inflection intensity in different parts of the rice plant, after reducing noise through the statistical outlier removal (SOR) algorithm. For adaptively parameter adjustment of supervoxel clustering and mean-shift clustering during density estimation, the calculation relationship between influencing factors (including seed-point size and kernel-bandwidth size) and number of points are, respectively, deduced by analysis. The experiment result of density estimation proved the two clustering methods effective, with a Root Mean Square Error (RMSE) of 9.968 and 5.877, and a Mean Absolute Percent Error (MAPE) of 5.67% and 3.37%, and the average accuracy was more than 90% and 95%, respectively. This estimation method is of positive significance for crop density measurement and could lay the foundation for intelligent harvest.

1. Introduction

There is an increasing demand to keep the feed-rate stable when the combine harvester operates in the fields, so as to guarantee the operation performance and avoid the blockage of the machine [1,2]. Since the crop density varies locally, the feeding amount is always fluctuating, and operators usually need to adjust the harvest speed constantly. Manual adjustment is usually carried out according to the experience, which could hardly cope with the variable conditions and maintain the steady feed-rate. The advance estimation of the crop density is an effective way to support drivers; however, it has always been a difficult problem in the field of agricultural engineering, restricting the development of agricultural mechanization, automation and intelligence [3,4,5].
When the harvesting parameters such as cutting width, stubble and forward speed of the combine harvester are acquired, the feeding-amount estimation mostly relies on the information of rice-plant height, density, yield and biomass in the area to be harvested. Among all of them, rice density is the most important parameter [6,7]. During the harvesting operation, estimating the density of mature rice in the field in advance can obtain the information of plot yield and feeding amount before harvest, which provides data reference for the control of working parameters of the combine harvester. It is of great significance for maintaining the stability of the main working parts of the machine, improving the efficiency of threshing and cleaning, and reducing the loss rate and damage rate [8].
There are different attempts to generate data for crop-biomass estimation, from the contact sensors embedded in the harvester, or by analyzing the images or the data acquired from non-contact sensors. The crop density measured by contact sensors requires interaction with the grains to obtain the amplitude or frequency of deviation based on a movable component of the sensor [9,10]. However, contact sensors are difficult to efficiently measure further in advance. Currently the non-contact measurement methods mainly include ultrasonic detection, infrared detection, visible light imaging, light detection and ranging (LiDAR), etc. Maertens et al. [11] carried out the first experiments on ultrasonic crop density measurement, and results showed that satisfactory ultrasonic waves failed to generate when it comes to clumping mature plants. Due to the harsh and changeable harvesting environment, the methods sensitive to wind, dust and temperature, etc., could not present excellent performance. Furthermore, Maldaner et al. [12] proposed a real-time yield-prediction method for sugarcane by harvester engine parameters such as specific fuel consumption. Machine-learning approaches were used to train and test, which requires the different machines to match with the field conditions with different crop properties. As LiDAR has the advantages of higher ranging accuracy, better stability and less influence by illumination, it has received extensive attention and applications [13,14].
At present, many researchers have studied on the methods to estimate the crops density through LiDAR. Most of the available methods mainly focus on extracting information from individual plants and constructing the estimation model between the crops density and influence factors, such as total volume, canopy volume, numbers of earheads and other parameters. Yang et al. [15] improved crop-segmentation accuracy by matching LiDAR point-cloud data with satellite-image data. They established a prediction model to calculate the crop density according to the number of laser echoes in the crop area. Jin et al. [16] carried out in-depth learning and training of corn point-cloud data based on the voxel convolution neural network, and through this, the stem and leaf segmentation of single maize was realized. This method could provide the reference for the measurement of maize gene phenotype information and density estimation in field. By installing the LiDAR on the harvester, Saeys et al. [17] gained the wheat point-cloud data in front of the machine and analyzed the penetration-depth data of wheat point cloud, including mean value, median value, standard deviation and peak value ratio between crop profile and ground profile. By establishing the estimation model, which is the function of feed amount and crop volume, they accurately calculated crop density. In order to acquire the rice density, Phan et al. [18] put forward a method that divided the voxels of rice point-cloud data and calculated the spatial volume. As the spatial volume depends on the height of the rice and the numbers of plants, the rice density could be measured by inverse transformation after removing the influence of rice height.
Clustering methods have been investigated for crop-density estimation, which should be based on the accurate cloud-point information segmented from the whole data, as well as with the established prediction model. Christiansen et al. [19] constructed the voxel grids depending on filtered point-cloud data of mature wheat, and put forward a wheat biomass prediction model. Hosoi and Omasa [20] adopted the LiDAR to collect cloud data of rice canopy at different growth stages and established the relationship between rice canopy volume and density according to voxel estimation. Velumani et al. [21] installed the signal LMS400 LiDAR to scan wheat field, and the voxel segmentation and mean-shift algorithm were used to segment the wheat head point cloud. Then the number of higher point-cloud clusters was calculated as the number of wheat panicles.
The above methods could improve the accuracy of crop density estimation in their corresponding fields; however, the branches and leaves of mature rice are usually luxuriant, with bent and intersected panicles. It is difficult to precisely segment a single crop or panicle among all of them, and density estimation based on individual rice extraction under 3D point-cloud data becomes inexact. Therefore, the aim of this study was to investigate the potential of using a LiDAR measurement system for density estimation of clumping mature rice in the field. It proposed the method that separates the panicle of mature rice with double-thresholds. The standard experimental group of various mature rice densities was set up to analyze the influence of seed-point size and kernel bandwidth with regard to the number of points in that panicle. Clustering analysis was then adopted to analyze the cloud point of the rice panicle so as to estimate rice density, and the field experiment was carried out.

2. Materials and Methods

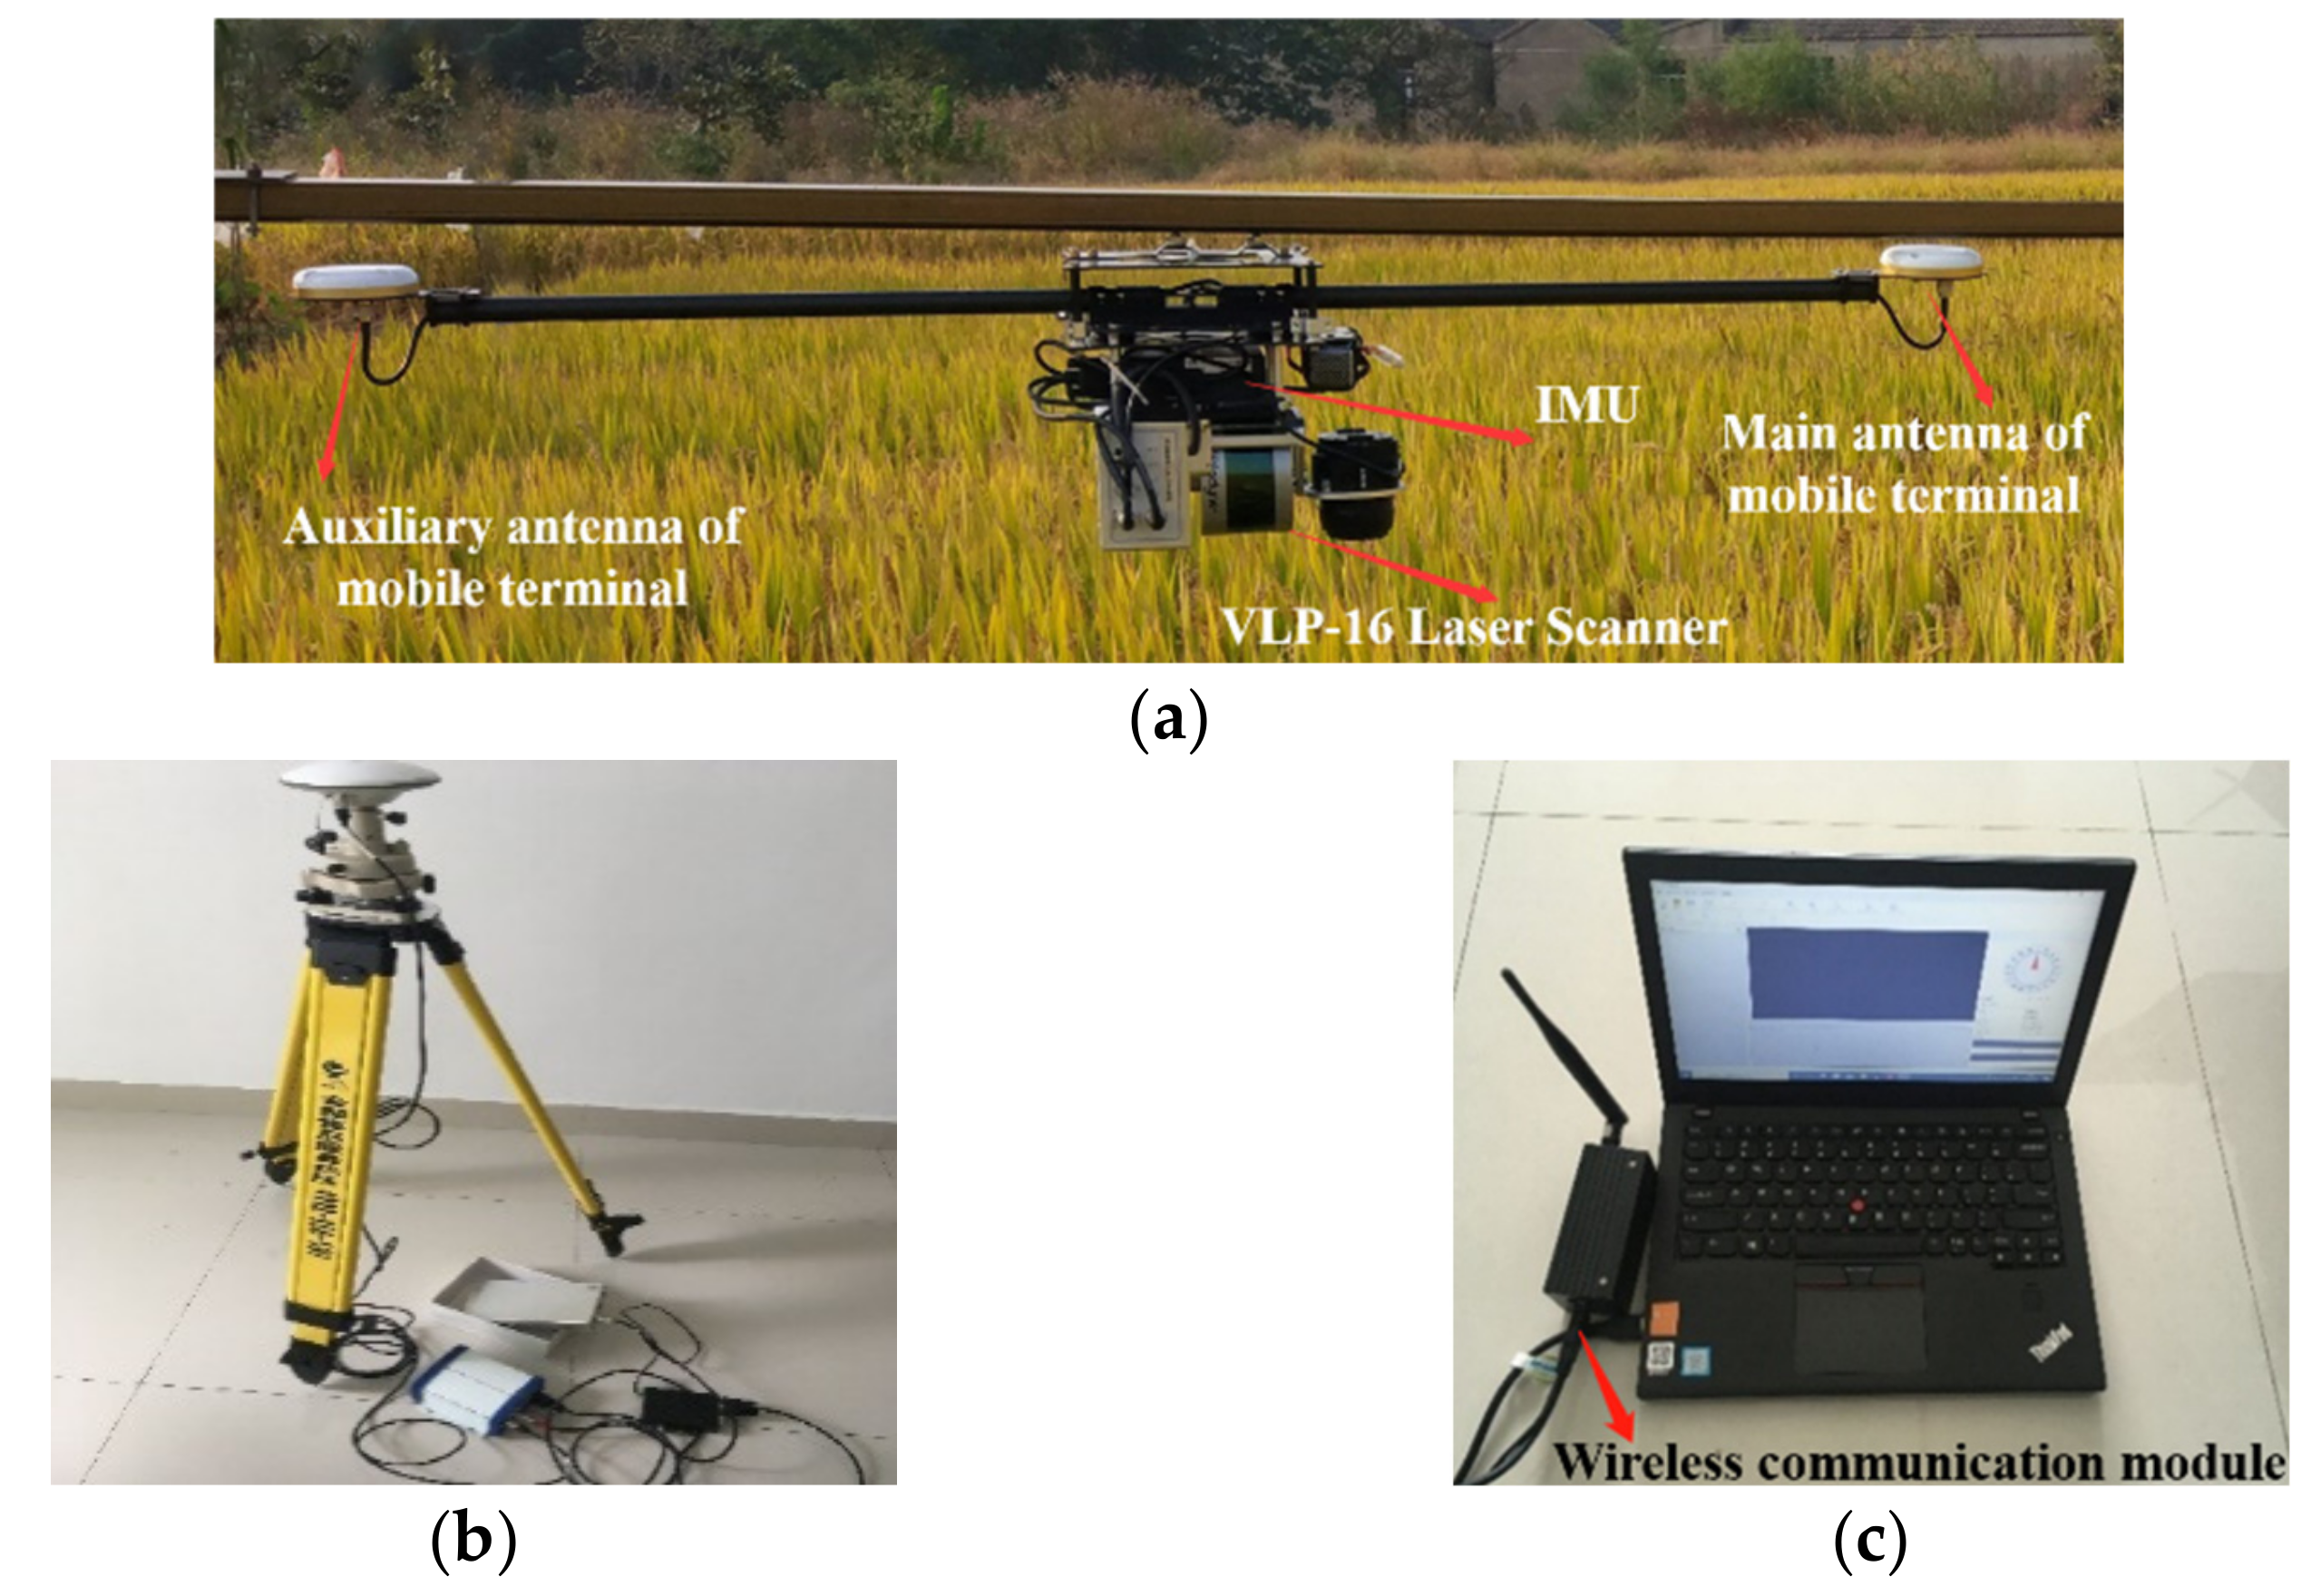
2.1. LiDAR Measurement System and Point-Cloud-Data Acquisition

2.1.1. LiDAR Measurement System

The LiDAR measurement system, including a mobile measurement terminal (Figure 1a), base station (Figure 1b) and computer control terminal (Figure 1c), was established to acquire point-cloud data. The mobile measurement terminal was equipped with a laser scanner (VLP-16, Velodyne, San Jose, CA, USA) and integrated navigation module (SPAN-IGM-A1, NovAtel, Beijing, China). The main parameters are shown in Table 1.
The laser scanner was used to measure the distance between the laser emission point and laser reflection point of the ground object. In order to improve the scanning accuracy of crops, to obtain clear and accurate point-cloud data, the laser scanner performed multiple scans in a short period; therefore, an integrated navigation module was used to match the real-time position and posture information of the crops during the scanning process, and the main parameters are shown in Table 2. The integrated navigation module mainly consisted of a Global Navigation Satellite System (GNSS) receiver and Inertial Measurement Unit (IMU). The dynamic differential GNSS receiver composes the main and secondary receiving antennas, which are used to determine the spatial position changes of the laser scanner in the process of data acquisition. IMU is used to measure the attitude parameters of laser scanner. The wireless module is connected with the computer to communicate with mobile measurement terminal. The laser-scanner data then can be synchronized according to the time stamp, as well as the position and attitude data of the laser scanner during data acquisition. The laser data can then be converted from the laser scanner to the ground reference system to form the 3D data information of field crops [22].
The calculation process of 3D point-cloud data of LiDAR measurement system includes the following steps: LiDAR records time difference or phase difference between the laser pulse reflected from the target on the ground and the received laser pulse. The slant distance from the emission point to the ground laser foot point could be measured accurately. At the same time, the attitude information in LiDAR measurement is determined by IMU, which includes course angle, elevation angle and roll angle [23]. The GNSS receiver provides exact LiDAR position information. Finally, according to the supplied information of attitude, position and distance, the precise 3D coordinates of each laser foot point are calculated. During the scanning process, 3D space coordinates of a large number of ground target points could be obtained.

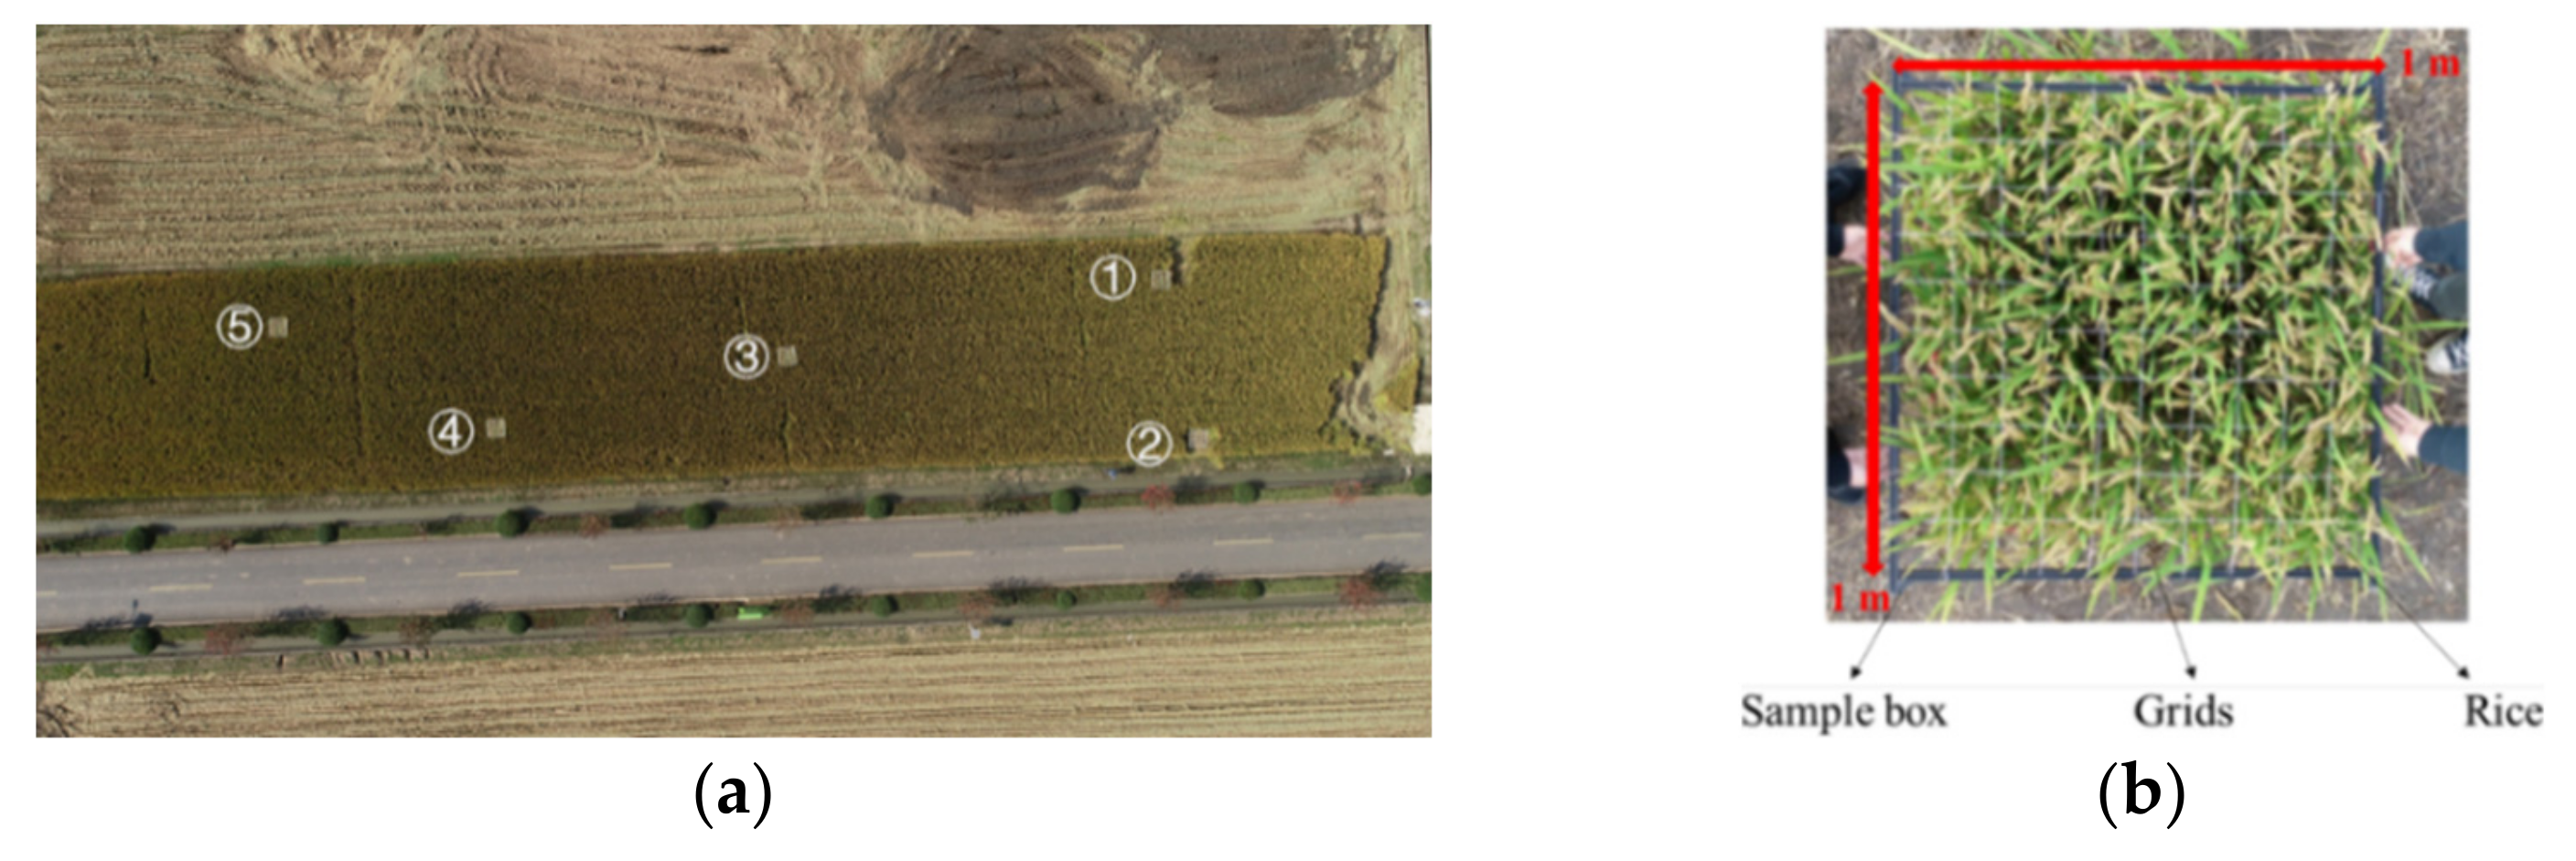
2.1.2. Point-Cloud-Data Acquisition

The experiment was carried out in the field near Jiangsu University, Zhenjiang, China. The field was seeded with the rice “Nanjing 9108” (Jiangsu Academy of Agricultural Sciences, Nanjing, China), and the planting method was direct seeding. The sowing time was chosen in the middle of May, and the measurements started in mid-October 2020, when the crops were maturing. The average plant height of clumping mature rice was 946.3 mm, the average panicle length was 112.7 mm and the yield was 40.11 kg/ha. The 1000-grain weight was 26.2 g, the stem moisture content was 62% and the grain moisture content was 21%.
During the measurements, the LiDAR measurement system was used to acquire 3D point-cloud data of each sample from both groups. In order to analyze the relationship between clustering parameters and the density of mature rice in the field, the standard experimental group (Figure 2) with four different rice densities (100, 200, 300 and 400 plants/m2) was set manually, respectively. The random experimental group (as shown in Figure 3) was measured to prove the density estimation method effective and investigate the precision. The samples in the random experimental group were stochastically selected from a field to be harvested, as shown in Figure 4a. Each sample from the random experimental group was randomly selected from the same field and collected by the same sampling frame, which could reflect the multiple field conditions for the inconsistent crop density.
The size of sampling frame is 1 m × 1 m, divided into 100 grids, through soft rope, as shown in Figure 4b. Thus the required density of each sample could be defined conveniently by setting the corresponding number of rice plant in each grid area. For instance, when the required density was 100 plants/m2, only one rice plant was kept in each grid area, and then the surplus rice plants in each grid area were manually removed.

2.2. Segmentation of Clumping Mature Rice Panicle with Double-Threshold

The focus of this article is investigating the satisfactory method that the 3D point-cloud data of clumping mature rice obtained through LiDAR measurement system could be effectively processed. Due to the variable environment, inherent error of the equipment, operating error of personnel and other factors, the acquired point-cloud data will inevitably produce extreme points. As usual, extreme points are far away from the main part of target point cloud so that they are also called noise points, leading to the inaccurate segmentation of cloud data [24]. Therefore, statistical outlier removal (SOR) algorithm was adopted to remove the noise points ahead of the segmentation process. Generally, clusters of mature rice distribute densely, and the crops are luxuriant, with bent and intersected panicles. Accordingly, a small amount of point-cloud data of rice stalks, branches and leaves between the panicles acquired by the LiDAR system may have dense areas, which increases difficulty in estimating crop density [16]. In order to solve the problem, a method to segment the panicle of mature rice with double-threshold is put forward, which could lay a foundation for realizing estimation of the density based on the point cloud of a panicle.

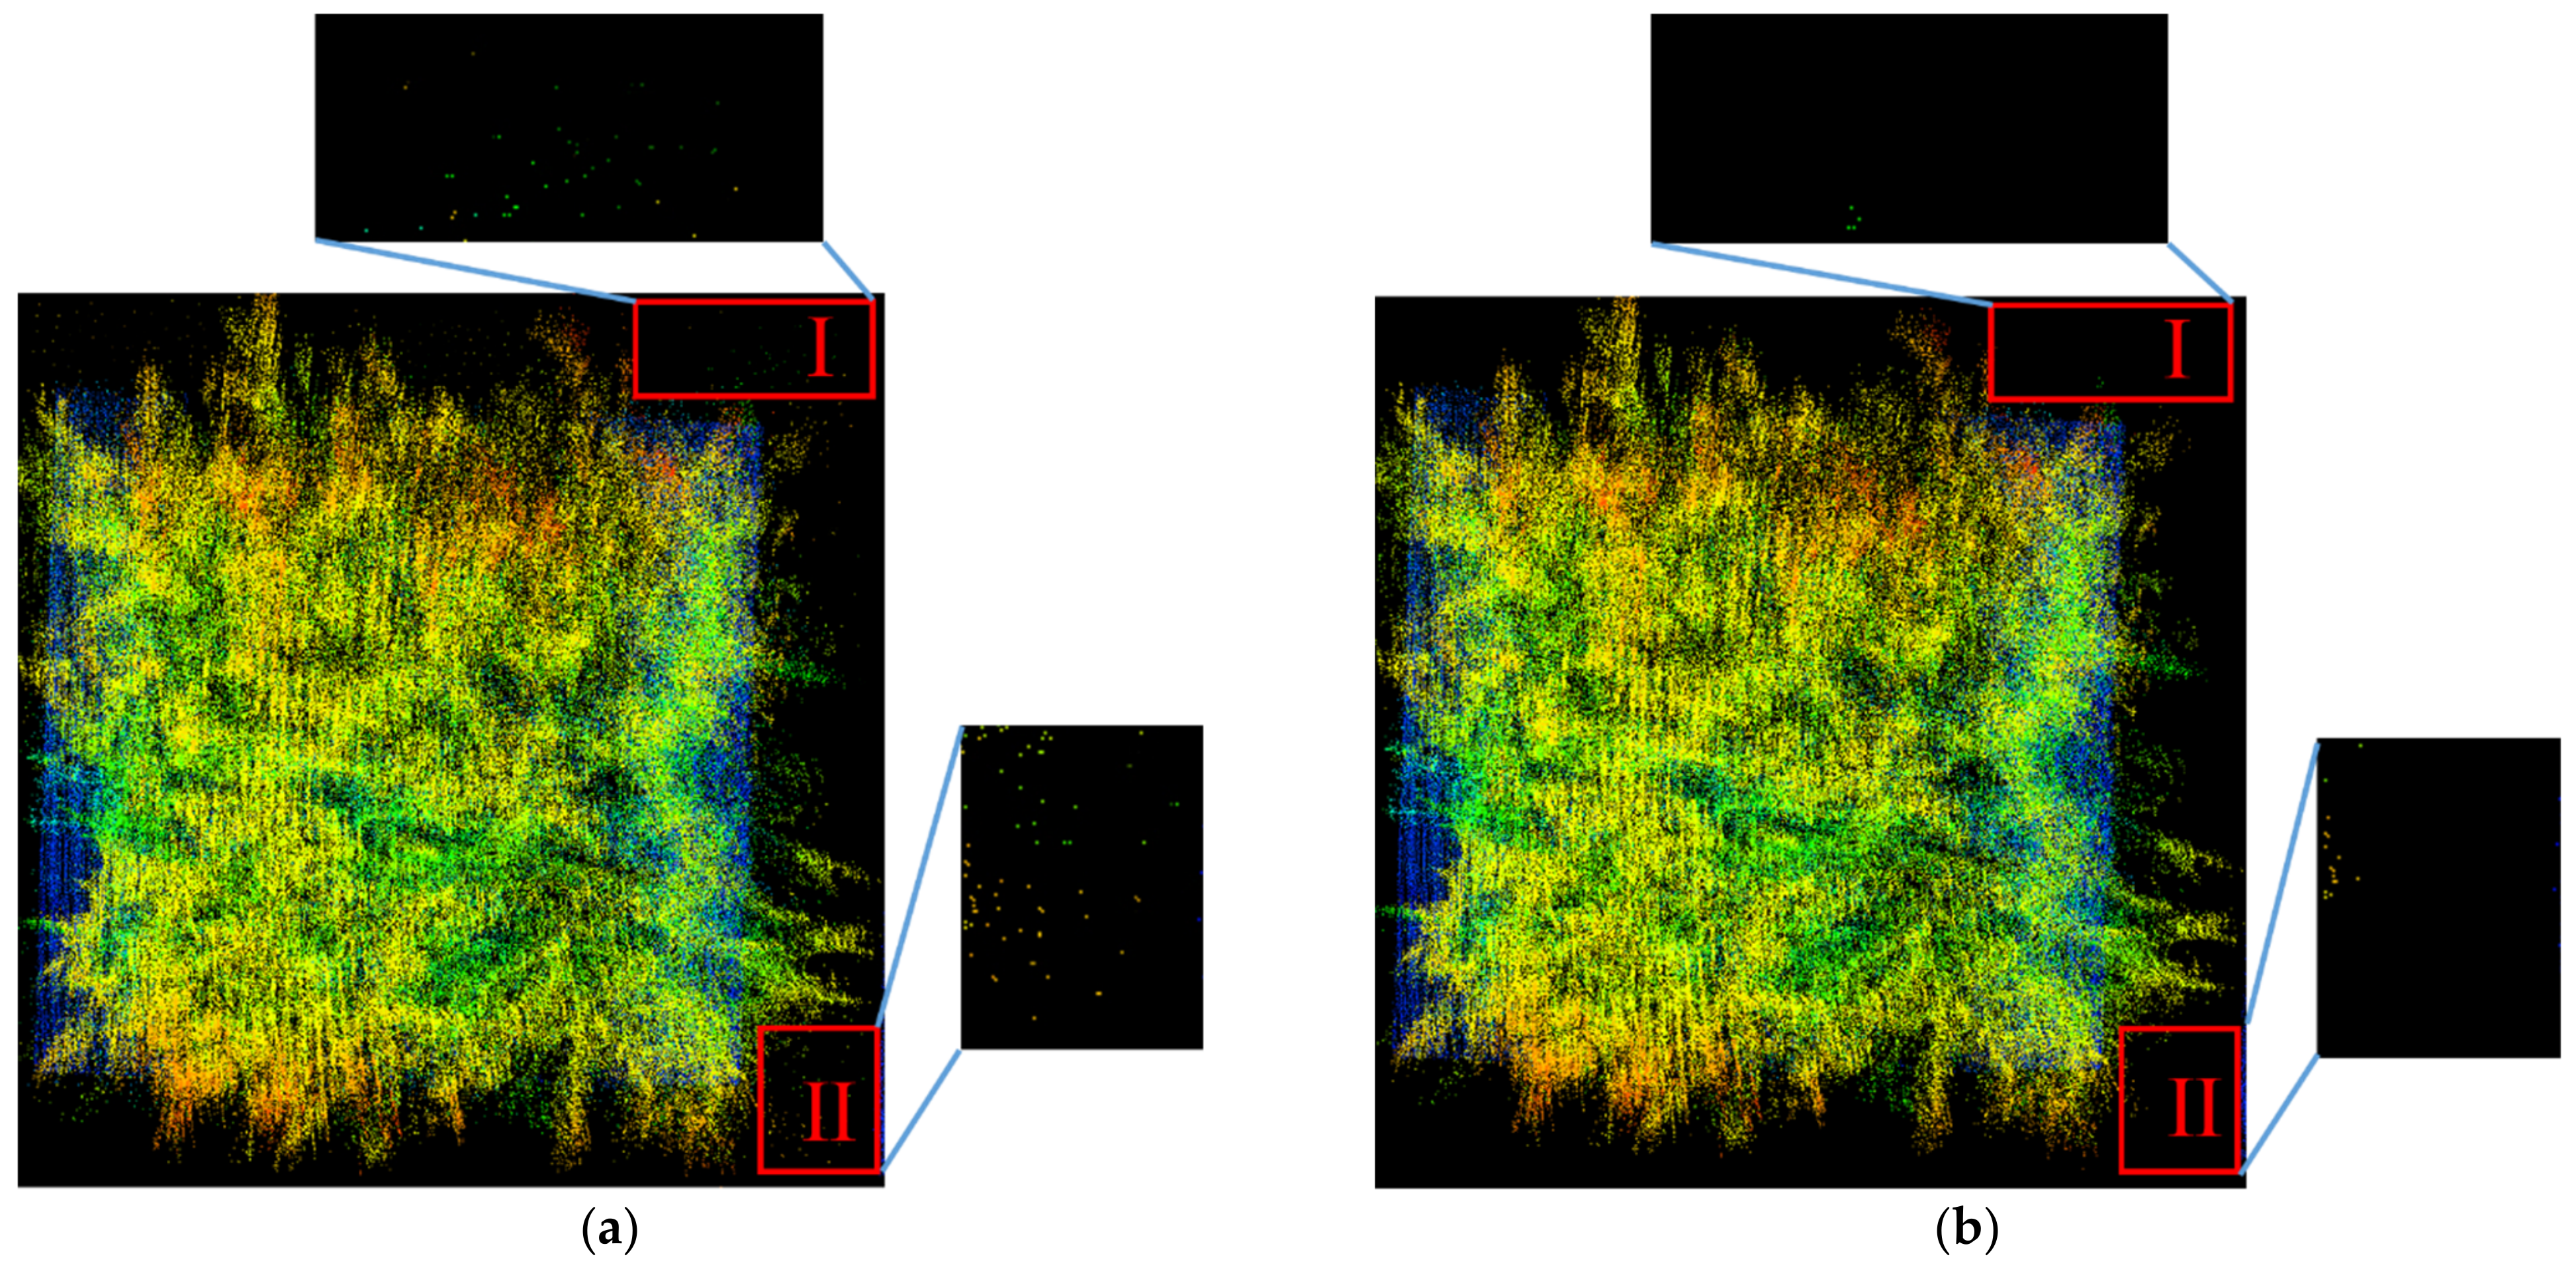
2.2.1. Noise Reduction

The noise points that are far away from the main part of target point cloud are reduced by SOR algorithm [25] in this article. The point-cloud data in the neighborhood r of each data point xi were statistically analyzed, and the average distance ( d i ), mean value of each point (μ) and standard deviation (σ) of all data within the neighborhood radius (r) were calculated. According to the standard deviation multiple (m) and the relationship between d i and [μ − m·σ, μ + m·σ], determine the noise points and then remove them. A large number of experiments have verified that when the neighborhood radius is r = 50 mm, and standard deviation multiple threshold is m = 2, the SOR algorithm has a better effect in reducing noise points.

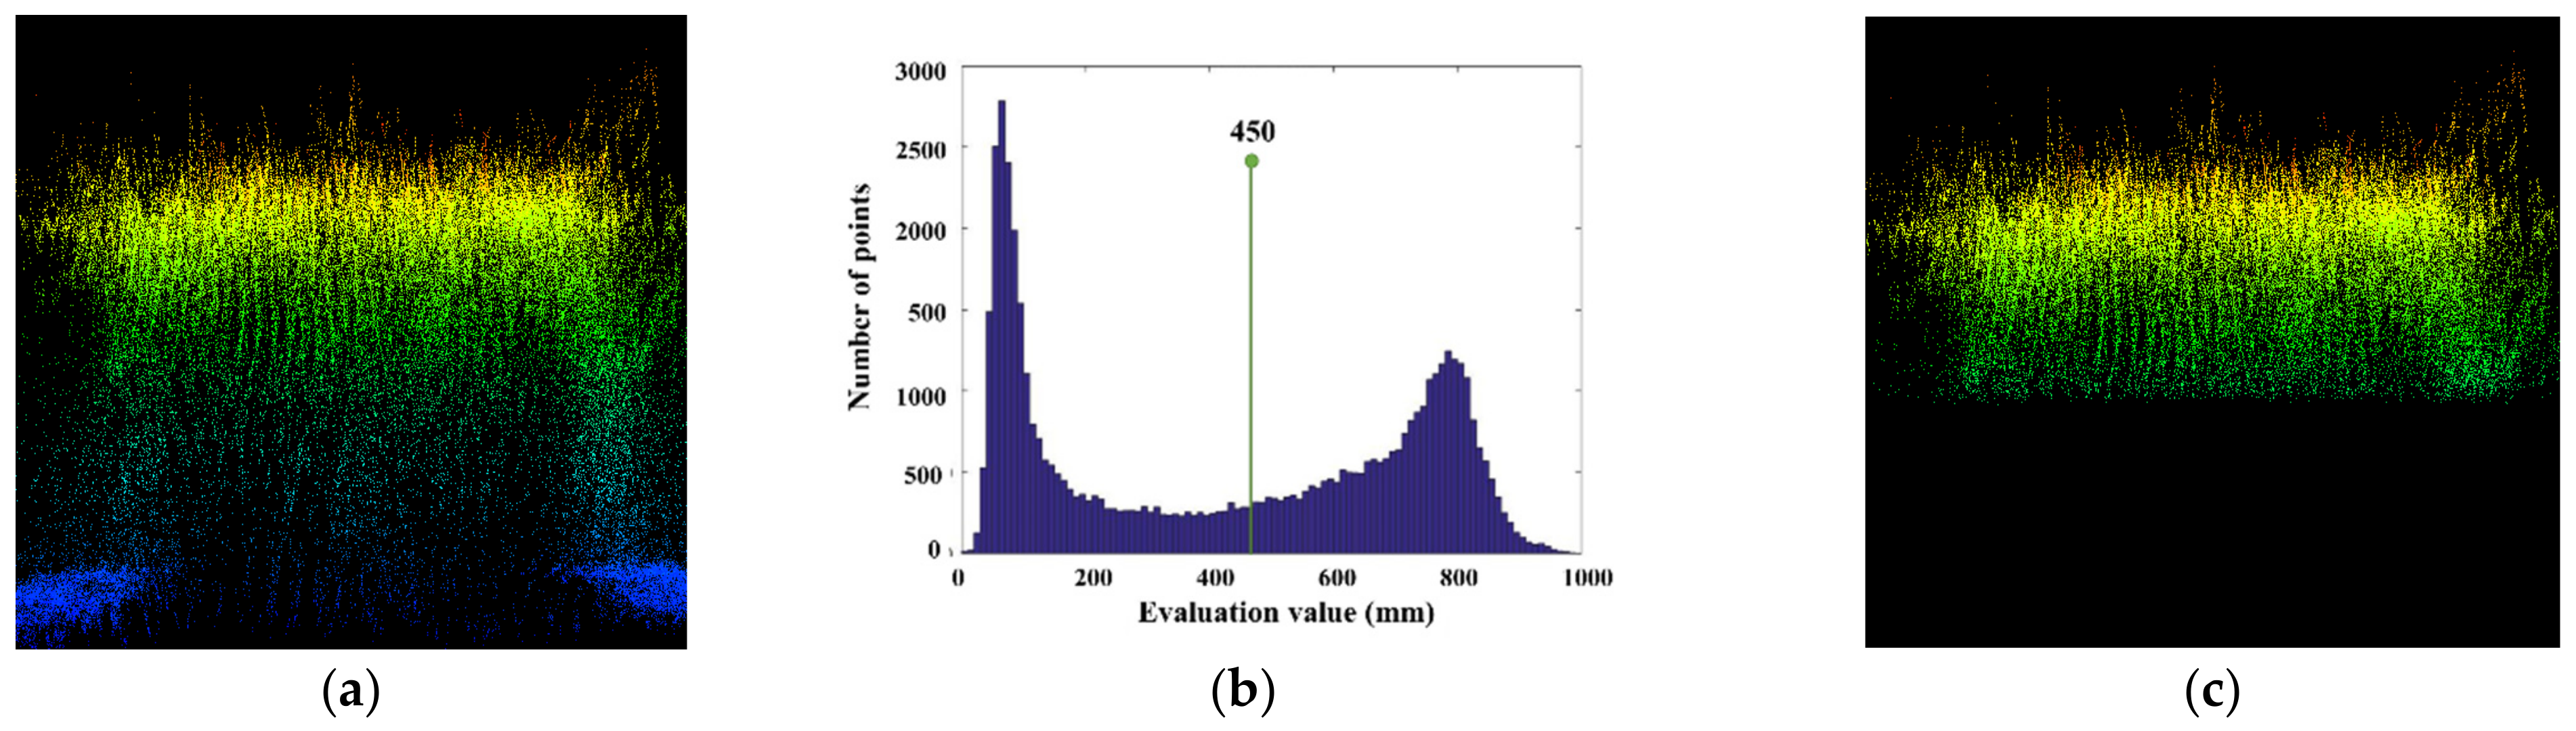
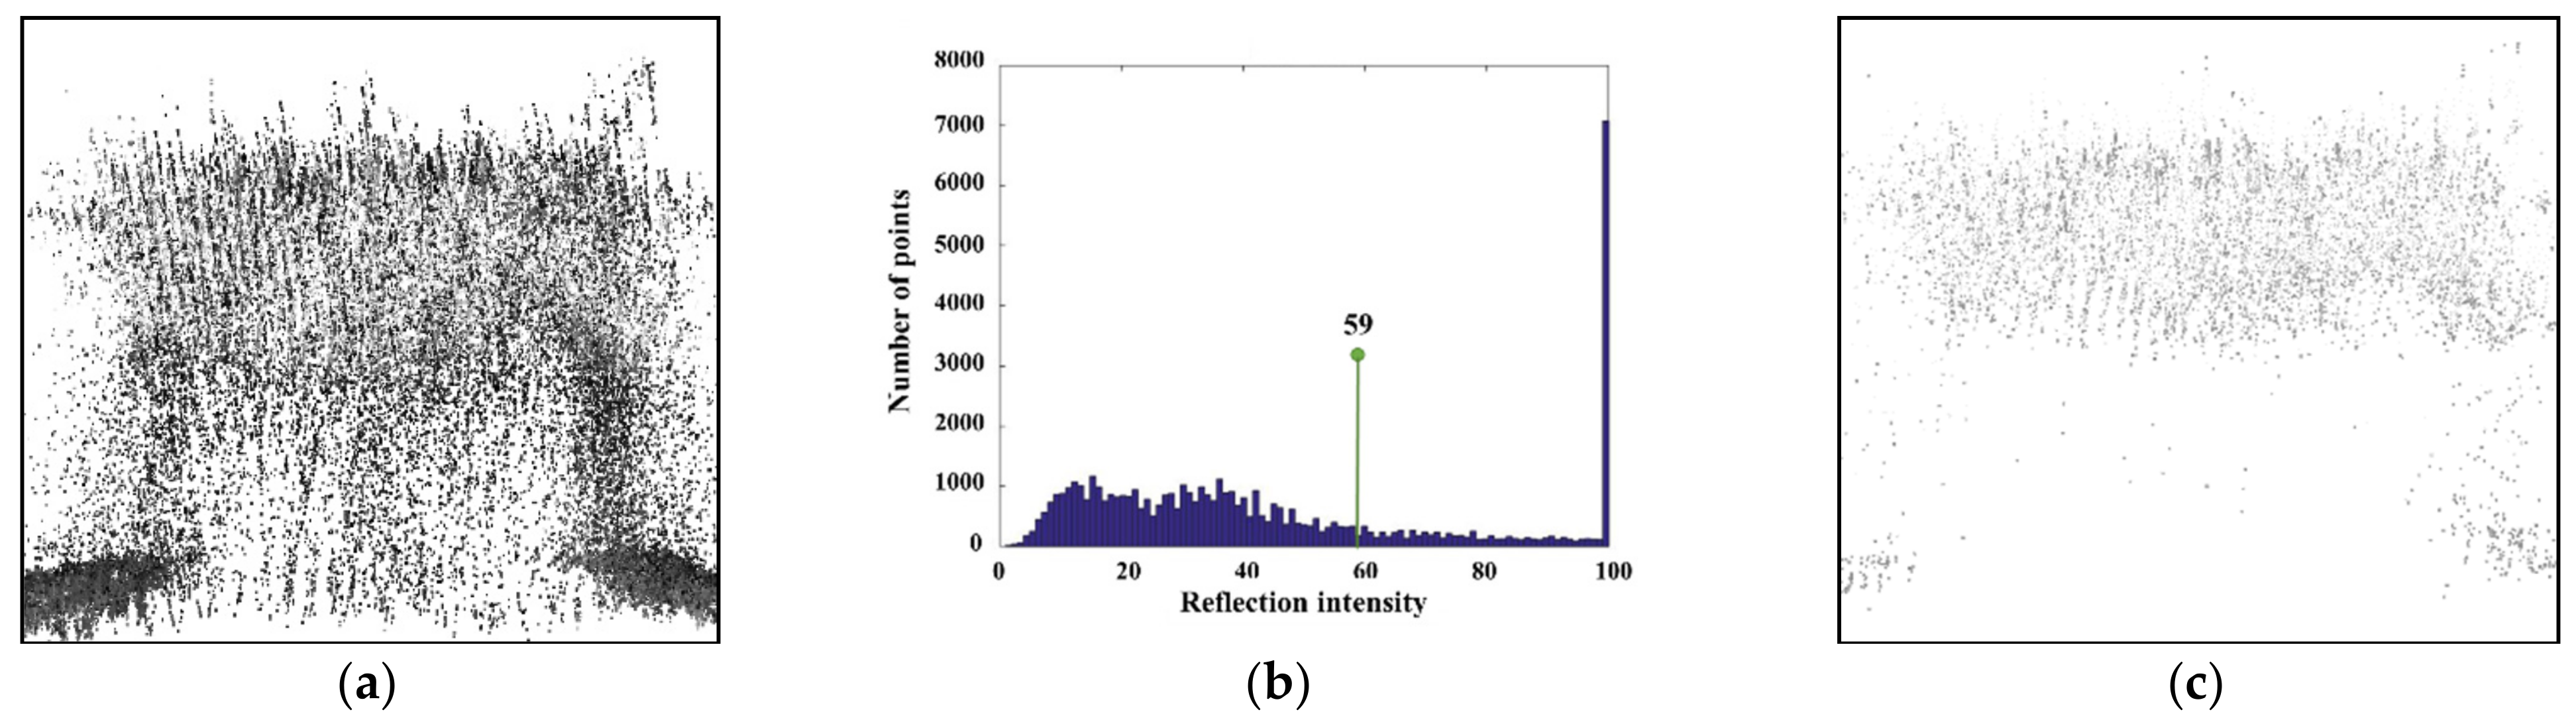
2.2.2. Segmentation for Point-Cloud Data of Panicle

Rice panicle consists of the earheads and a small number of stems and leaves, which are all distributed in the highest part of rice vertical direction. The elevation value of 3D point-cloud data of rice is one of the distinguishing features of earhead from other parts of the whole rice plant. Besides, the earhead is the main part of panicle, and the reflection intensity of the laser on its surface is different from that of other parts [26]. Therefore, based on the height and surface reflection characteristics of different rice parts, the maximum class square error method (the following refers to Otsu) proposed by Nobuyuki Otsu [27] is used to construct the double-threshold of elevation and reflection intensity, so as to achieve accurate segmentation.
The elevation and reflection intensity threshold are both determined through Otsu, the detail process could be described by taking elevation threshold as an example. The length of the point-cloud data should be measured, including the maximum elevation value Zmax and the minimum elevation value Zmin. Then set the elevation threshold as Tz(i), where i = [Zmin, Zmax]. Retrieve all point-cloud data, calculate the proportion ω0 of point-cloud data, which is less than threshold T(i) in all point-cloud data, and calculate the average elevation value μ0, which is less than the threshold data. Then calculate the proportion ω1 of point-cloud data, which is larger than threshold T(i) in all point-cloud data, and calculate the average elevation value μ1 which is larger than the threshold data. The total average elevation of the cloud data at the point is μ2, and the interclass variance is g(i), where we get the following:
μ 2   =   ω 0 × μ 0 + ω 1 × μ 1 ,
g i   =   ω 0 μ 0 μ 2 2 + ω 2 μ 1 μ 2 2 ,
According to Equations (1) and (2), the following can be obtained:
g i   =   ω 0 ω 1 μ 0 μ 1 2 ,
Matlab software (MathWorks, Natick, MA, USA) is used to program the selection of elevation threshold, as shown in Figure 5. Threshold value of the point-cloud data based on the elevation distribution histogram is 450, located between maximum peak and minimum peak. The panicle-segmentation result based on the elevation threshold is shown in Figure 5c.
The second segmentation process, that the selection of the 3D point-cloud reflection-intensity threshold is also obtained by using Matlab software, based on the data through the pervious segmentation. The histogram of reflection intensity distribution is shown in Figure 6b, and it can be analyzed that the threshold of the point-cloud data of the rice panicle is 59, which is located between maximum peak and minimum peak. The second panicle segmentation result based on reflection intensity is shown in Figure 6c.

2.3. Clustering Adaptive-Parameter Adjustment and Rice-Density Estimation

Current crop density estimation method based on single plant extraction, the point-cloud data include the information of earheads, stems and leaves. The laser beam of LiDAR is difficult to penetrate into the panicles to obtain clear and accurate data; therefore, a clustering adaptive method based on point-cloud data was put forward.
The rice density estimation method builds on the clustering algorithms, which has been widely used to process the point cloud data [28,29,30]. Among the clustering algorithms, K-means clustering algorithm through iterative solution, should randomly select k objects as K categories, and then initialize the center point as the clustering center. As the number of clustering categories should be set up according to the number of earheads in advance, this algorithm could hardly be applied. Although clustering categories are not required by DBSCAN algorithm, this method could hardly show excellent processing speed for messy and complex point cloud data for real-time density estimation [31].
The supervoxel clustering algorithm is a method based on voxel, of which the concept is derived from pixels in two-dimensional (2D) image space. When processing 2D image, pixels are clustered into over-pixels. Similarly, voxels are clustered into superpixels in the process of 3D point-cloud data. The principle of supervoxel cluster is to segment the point cloud by way of dividing the target point cloud into several pieces, according to the texture, feature, material, color and other characteristics of the target. Moreover, then the cluster can be realized by analyzing the relationship between each piece. The mean-shift clustering algorithm [32] sets a sliding window to find data-concentration areas based on density gradient rise, and calculates the mean value of candidate points in the data-concentration areas to substitute the mean value of points in the window to locate the center of each class. Supervoxel clustering and mean-shift clustering can realize point-cloud-data clustering by setting seed-point spacing and kernel-bandwidth size, respectively, which is more suitable for clumping mature rice-density estimation. Therefore, in this study, experiments were conducted to determine the parameter-setting rules of supervoxel clustering and mean-shift clustering in the calculation of different rice densities, and to analyze the correlation between influencing factors and the number of point clouds in the rice panicle.

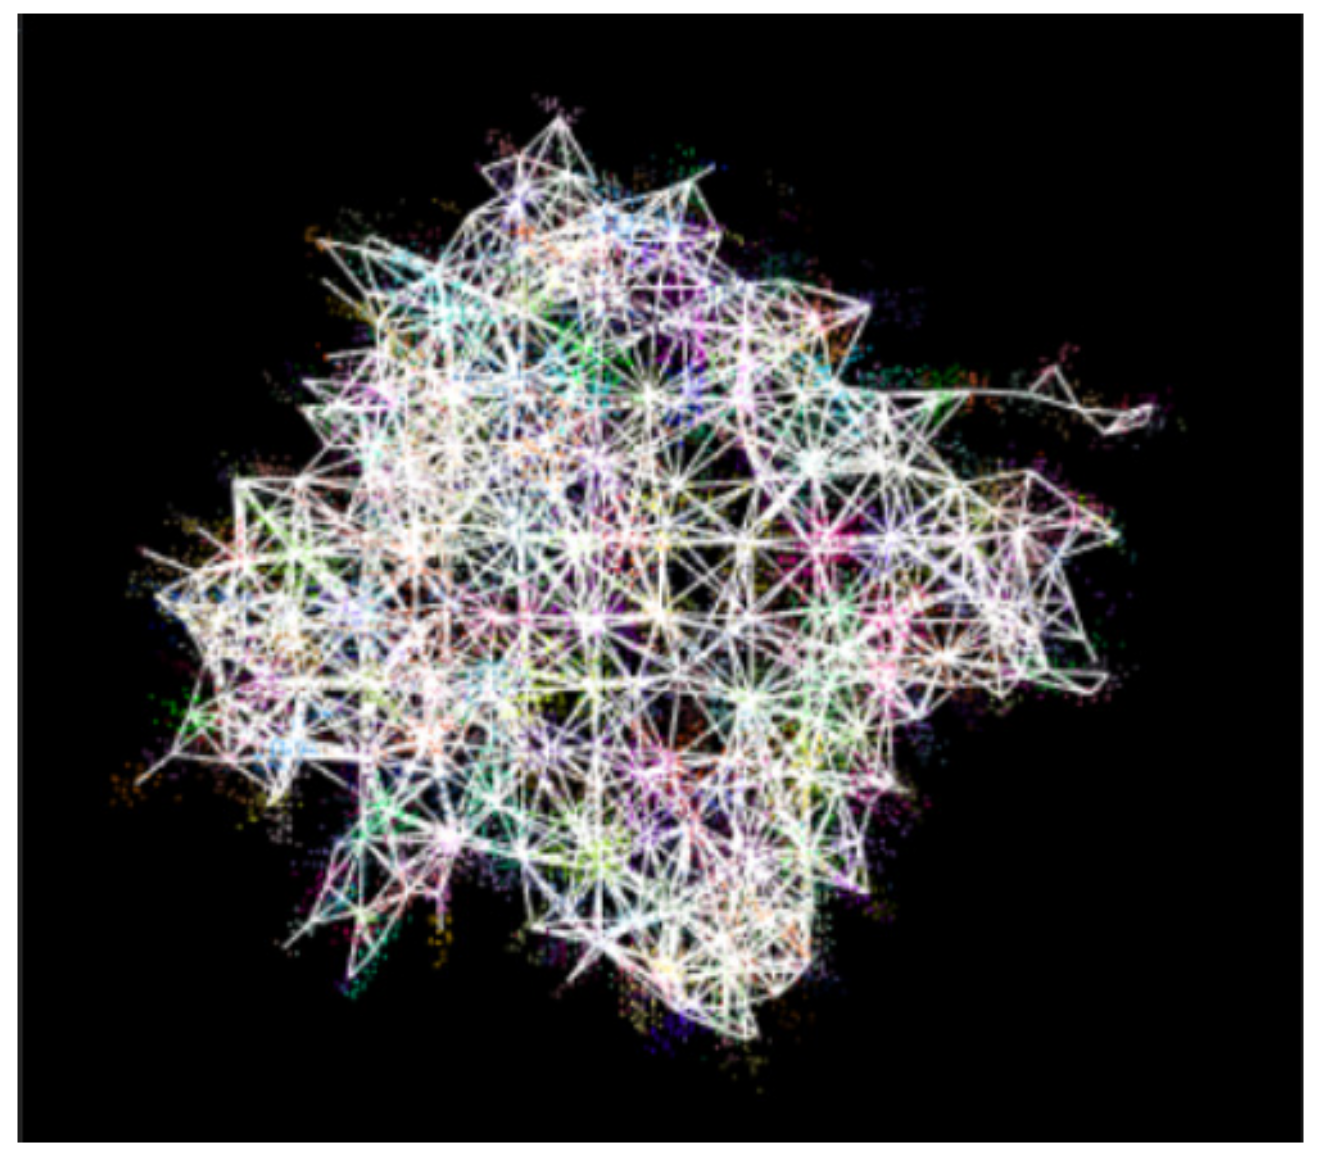
2.3.1. Rice-Density Estimation: Supervoxel Clustering Method

The process of the supervoxel clustering algorithm is similar to the crystallization of salt solution in the supersaturated state. Through the uniform arrangement of seed points, all crystal kernels grow at the same time, until the whole data space is covered. Therefore, these seed points are also named as crystal kernels, and voxel groups (also known as grain crystal) are formed after clustering. By specifying the crystal kernels’ distance (R_seed), the voxel size (R_voxel) and the minimum grain (MOV), the voxel is clustered with the voxel, and the small grain obtained by the clustering is integrated into the nearest large grain to form a cluster of supervoxel [28].
When clustering the point-cloud data of the panicle, the supervoxel clustering algorithm needs to set the voxel size (R_voxel) to realize voxelization of the point cloud and set the seed-point size (R_seed). In this study, the supervoxel clustering parameter analysis was carried out using point-cloud data from the standard experimental group. After reducing the noise points and finishing accurate segmentation, the precise point cloud could be obtained. Since the seed-point size is connected with the spacing between rice plants, which is also correlated with the number of points in the total cloud point, each seed-point size is adjusted only once the clustering result is close to the actual result. Then regression analysis is performed on seed-point size and the point amount, and the model of adaptive-parameter adjustment can be deduced as well.

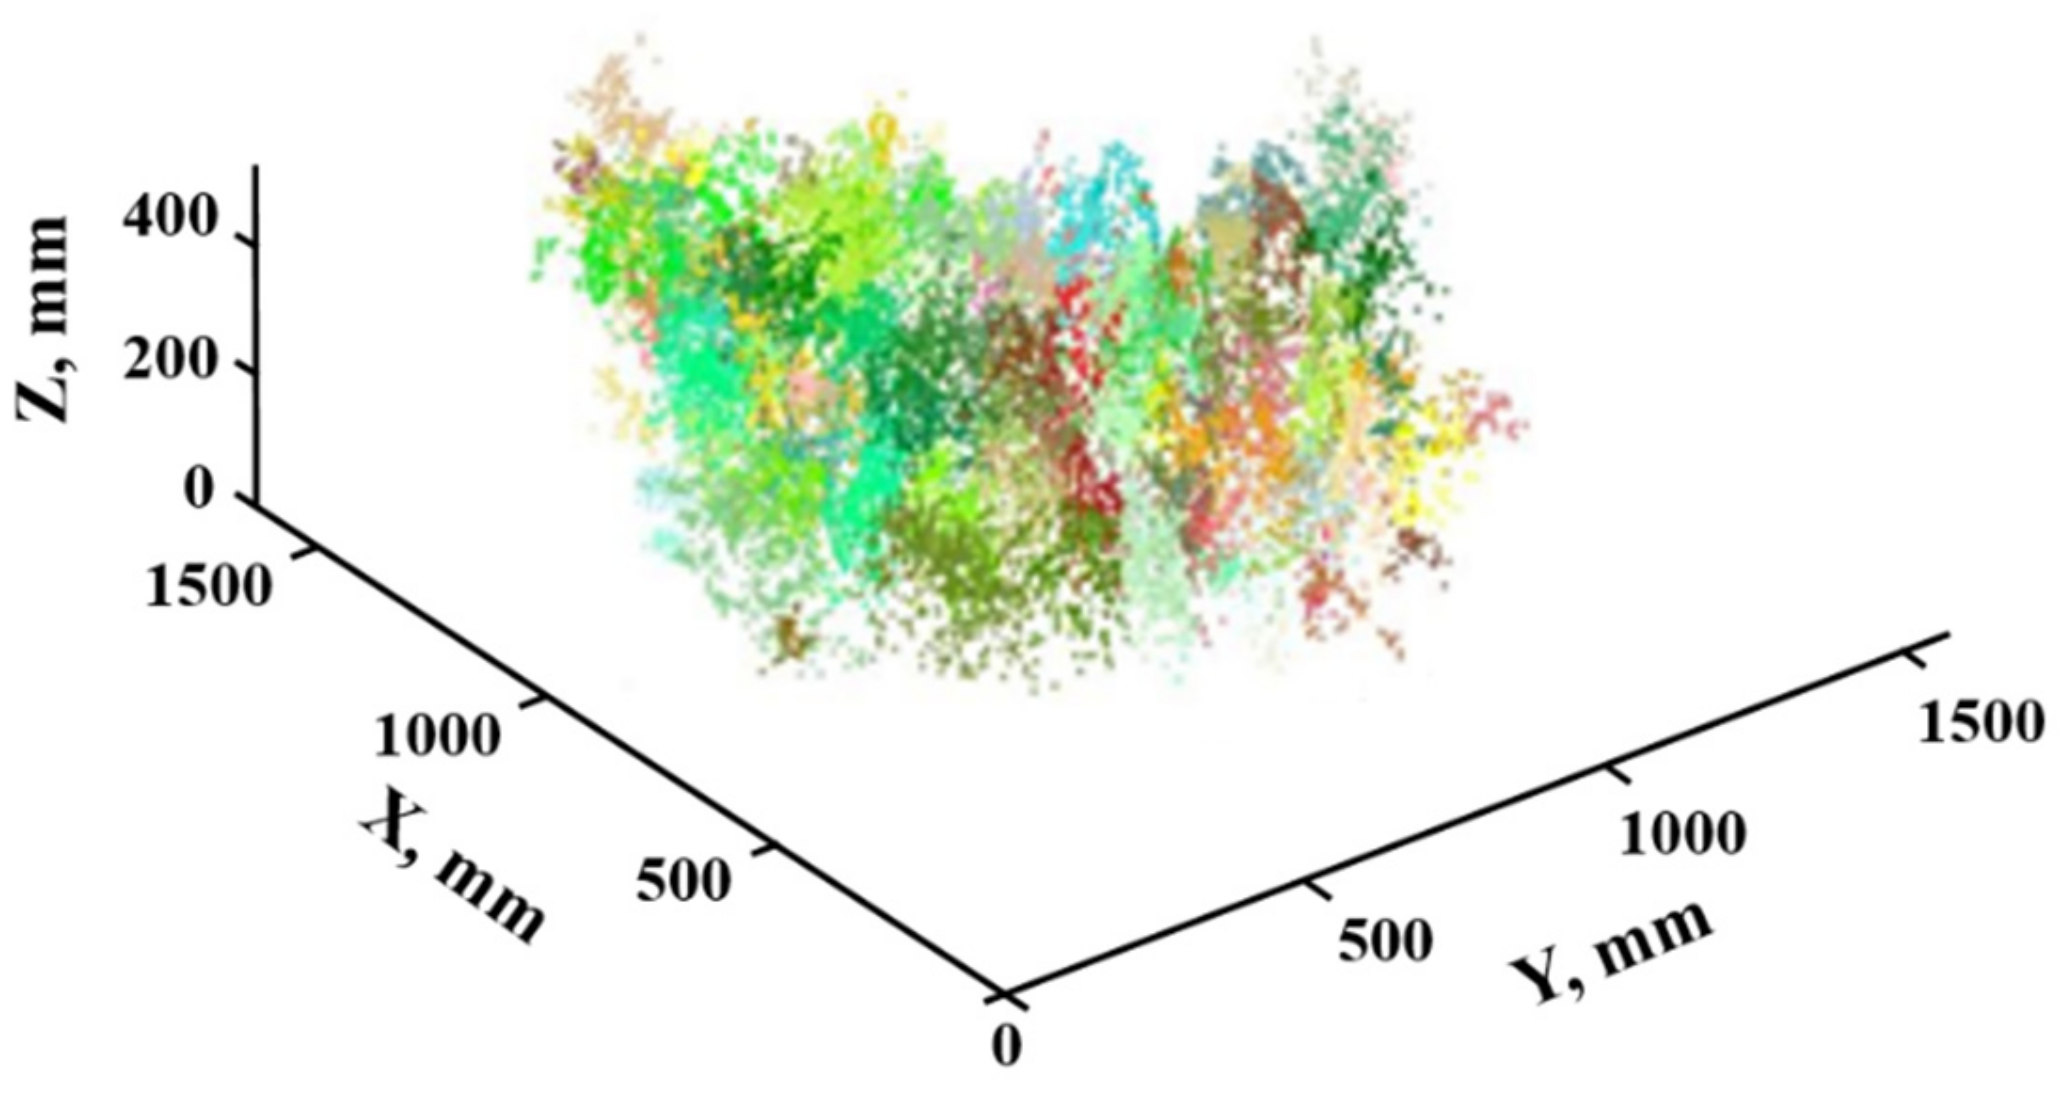
2.3.2. Rice-Density Estimation: Mean-Shift Clustering Method

The mean-shift clustering algorithm calculates the wandering vector of the center point by changing the data density in the Region of Interest (ROI). Through iterative calculation of the point-cloud data in the adjacent range, the center position of the probability density function is constantly moved until the best-fitting effect is achieved. At this time, the peak point of the function is the clustering center [32].
When the mean-shift clustering algorithm is used to cluster the rice panicle point-cloud data, kernel-bandwidth size should be set. In this study, clustering parameter analysis of mean shift is carried out by using point-cloud data of the panicle in the standard experimental group. Since the kernel-bandwidth size is connected with the spacing between rice plants, which is also correlated with the number of points in total point cloud, each kernel bandwidth is adjusted only once the clustering result is close to the actual result. Then regression analysis is performed on seed-point size and the number of points, and this model of adaptive-parameter adjustment can be deduced.

3. Results and Discussion

3.1. Adaptive-Parameter Adjustment Model

As mentioned above, the standard experiment group was used to establish the adaptive-parameter adjustment model. The clustering results corresponding to different supervoxel clustering parameters based on the acquired cloud point data of this group were obtained, as shown in Figure 7 and Table 3.
From Table 3, it can be seen that the voxel size was approximately equal to the rice earhead width. During the process of experimental analysis, due to the uniformity of rice varieties, the variance was small. The seed-point size was connected with the spacing between rice plants, which was also correlated with the number of points in the total point cloud. Therefore, a regression analysis was conducted on the seed-point size and the number of points. The relationship between the seed-point size and the number of rice panicle points could be obtained through function fitting, as shown in Equation (4).
y = 8983.7 x 0.651 ,
where y is the spacing between seed points, and x is the number of rice panicle points. R2 = 0.9581.
The correlation reached an extremely significant level. Based on this, the parameters of the supervoxel clustering algorithm were adapted, the seed-point spacing could be set according to the number of rice panicle point and the rice density could be estimated.
The clustering results corresponding to different clustering parameters were obtained, as shown in Figure 8 and Table 4. Table 4 shows that there is a correlation between kernel bandwidth and the distance between rice plants, which is related to the number of points in point cloud.
Therefore, a regression analysis was performed on the kernel bandwidth and the number of points in point cloud. The relationship can be obtained by function fitting, and the formula is as follows:
y = 2 e + 0.7 x 1.553
where y is kernel bandwidth, x is the number of points, constant e ≈ 2.718, and the determination coefficient is R2 = 0.9138.
The correlation is very significant. The parameters of the super voxel clustering algorithm are set adaptively on the basis of this formula. In accordance with the number of point clouds in the rice panicle, the kernel bandwidth could be set, and the density of rice could be estimated by adjusting adaptive parameters.

3.2. Noise Reduction and Double-Threshold Segmentation

Data were acquired for the random experiment group. As an example of noise reduction, the result of Sample-test 2 is shown in Figure 9. It can be clearly seen that the noise points in areas Ⅰ and Ⅱ are obviously reduced. As indicated in the previous section, the 3D cloud point of the panicle is difficult to segment accurately. Figure 10 shows the results of double-threshold segmentation based on elevation and reflection intensity. The precise point cloud of each sample in random experiment group could be obtained, so that the further crop estimation could be more accurate.

3.3. Rice-Density Estimation

The rice-density-estimation results for random experiment group are shown in Table 5. Each sample was measured three times, so that it was calculated by both estimation methods trice. The result pictures obtained from supervoxel clustering are shown in Figure 11, and the result pictures from mean-shift clustering are shown in Figure 12.
The rice-density-estimation methods calculated by supervoxel clustering and mean-shift clustering based on adaptive-parameter adjustment were verified by random experiment group. Matlab and the Point Cloud Library (PCL) point-cloud database were used in the experiment. According to the relationship between the size of seed points and the number of points, the supervoxel algorithm adaptively sets the seed-point spacing. The mean-shift algorithm sets the kernel bandwidth according to the relationship between the kernel bandwidth and the number of points.
RMSE = 1 n i = 1 n ( z i z ) 2 ,
MAPE = 1 n i = 1 n z i z z   ×   100 % ,
Take the field measured rice density as the real value, the Root Mean Square Errors (RMSEs) and the Mean Absolute Percent Errors (MAPEs) of rice-density estimation based on 3D point cloud and supervoxel clustering algorithm were 9.968 and 5.67%, respectively, and the average accuracy of density estimation was more than 90%. The RMSE and MAPE of rice-density estimation based on 3D point cloud and mean-shift clustering algorithm were 5.8778 and 3.37%, respectively, and the average accuracy of density estimation was more than 95%. By comparing the results of two methods, we found that the density calculated by mean-shift clustering seemed to be more precise.
From the above analysis, the use of clustering methods could be effective on basis of the double-threshold segmentation for acquired point-cloud data. It can be concluded that crop density could be estimated by analyzing the point-cloud data depending on LiDAR technology. This is consistent with the conclusion proposed by Swayes [17], who applied LiDAR sensors to estimate wheat density, that the crop properties are relative to rice to some extent. The literature shows that accuracy of wheat density estimation could reach an R2 of 0.8, according to Blanquart [33], who also analyzed the different installment angle of LiDAR sensor. However, as the wheat panicles have less leaves, the separation of wheat earheads is more obvious; moreover, the estimation based on point-cloud data becomes more convenient, compared with the mature rice plants with bent and intersected earheads. Even though the crop properties of rice plants make the density estimation difficult, the methods proposed here could reach a high accuracy. Therefore, this method may provide a valuable reference for improving density-estimation accuracy for clumping mature crops in the field.

4. Conclusions

In this paper, clustering adaptive density estimation method for mature rice plants by extracting 3D point cloud of panicle based on double-threshold segmentation was put forward. The panicle information of mature rice, the crop with lush branches and leaves, and both with the bent and intersected earheads could be acquired. Therefore, the clustering analysis could be effective for the rice-density estimation according to the investigation in the clustering adaptive-parameter model. The experiments were carried out, and the following conclusions could be obtained:
(1)
The 3D cloud point data of the rice in the field were obtained by the established LiDAR measurement system, of which the noise points far away from the target body were effectively reduced through SOR algorithm. The accurate segmentation of mature rice panicle was realized according to the elevation and reflection intensity value of the point-cloud data based on Otsu. This method could be valuable for technical reference of the similar crops segmentation, such as wheat and millet.
(2)
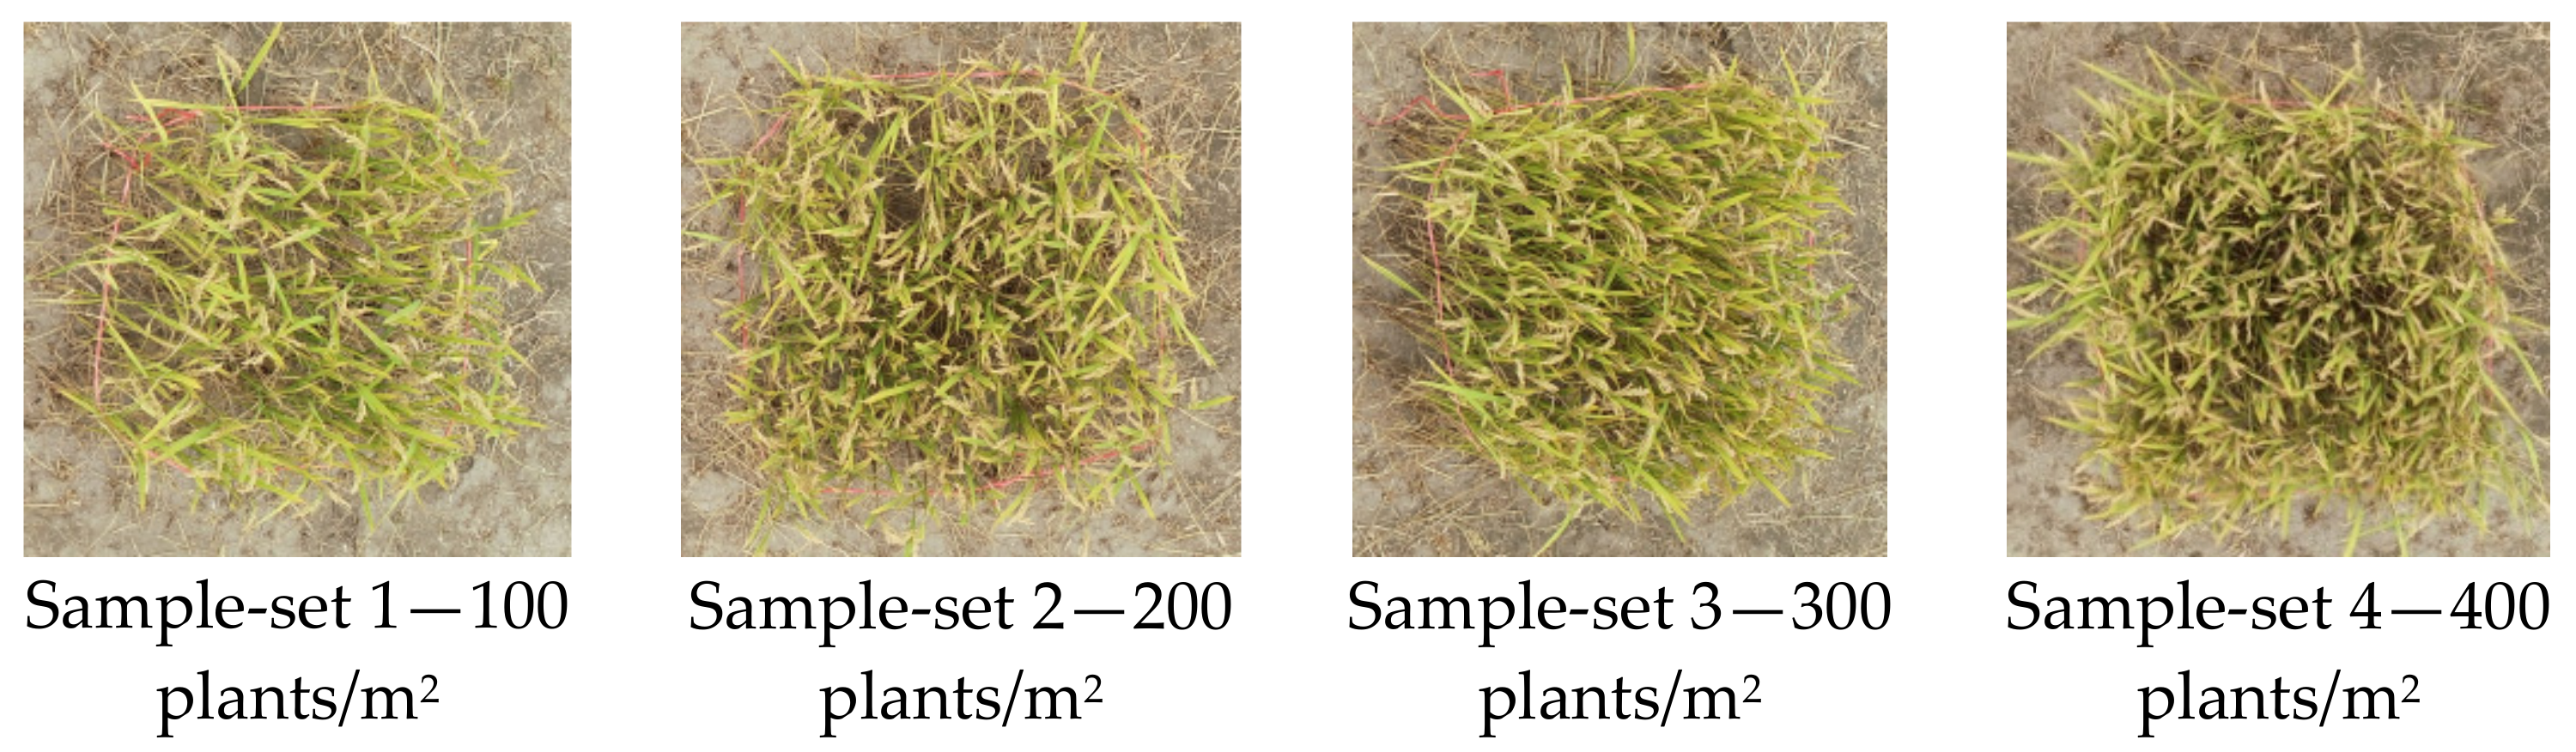
In order to better investigate the influence between the seed-point distance and the kernel bandwidth with regard to the number of points in the total panicle point cloud, respectively, when using supervoxel clustering and mean-shift clustering, the rice samples with different densities were set manually as a standard experiment group. The models were then obtained, which could be beneficial for adaptively adjusting parameters when estimating crop density.
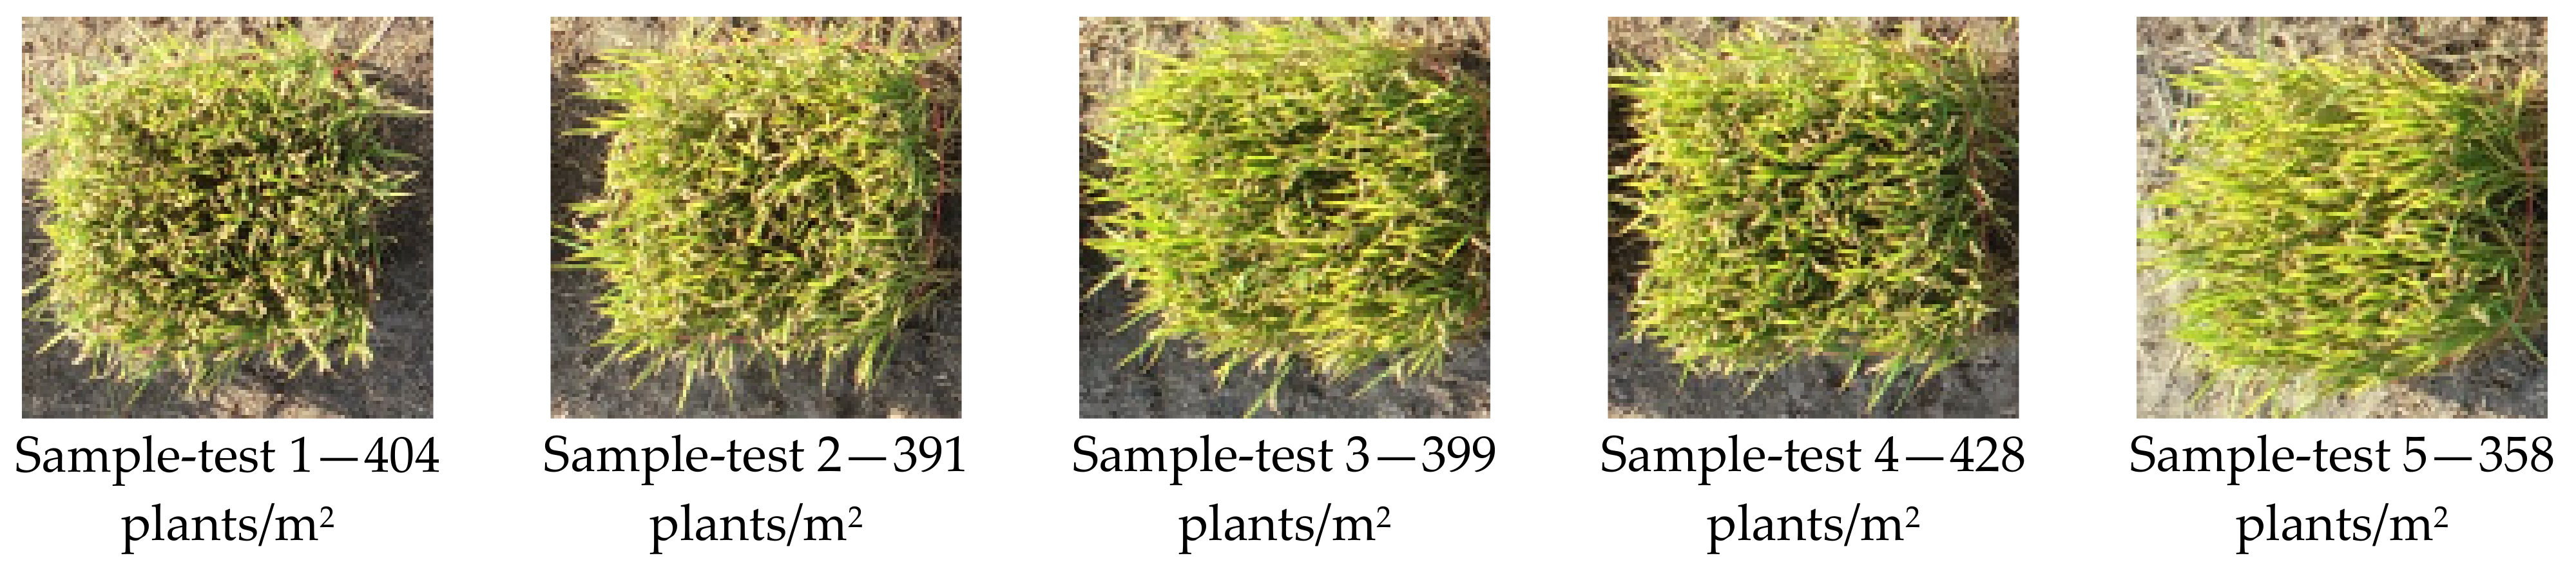
(3)
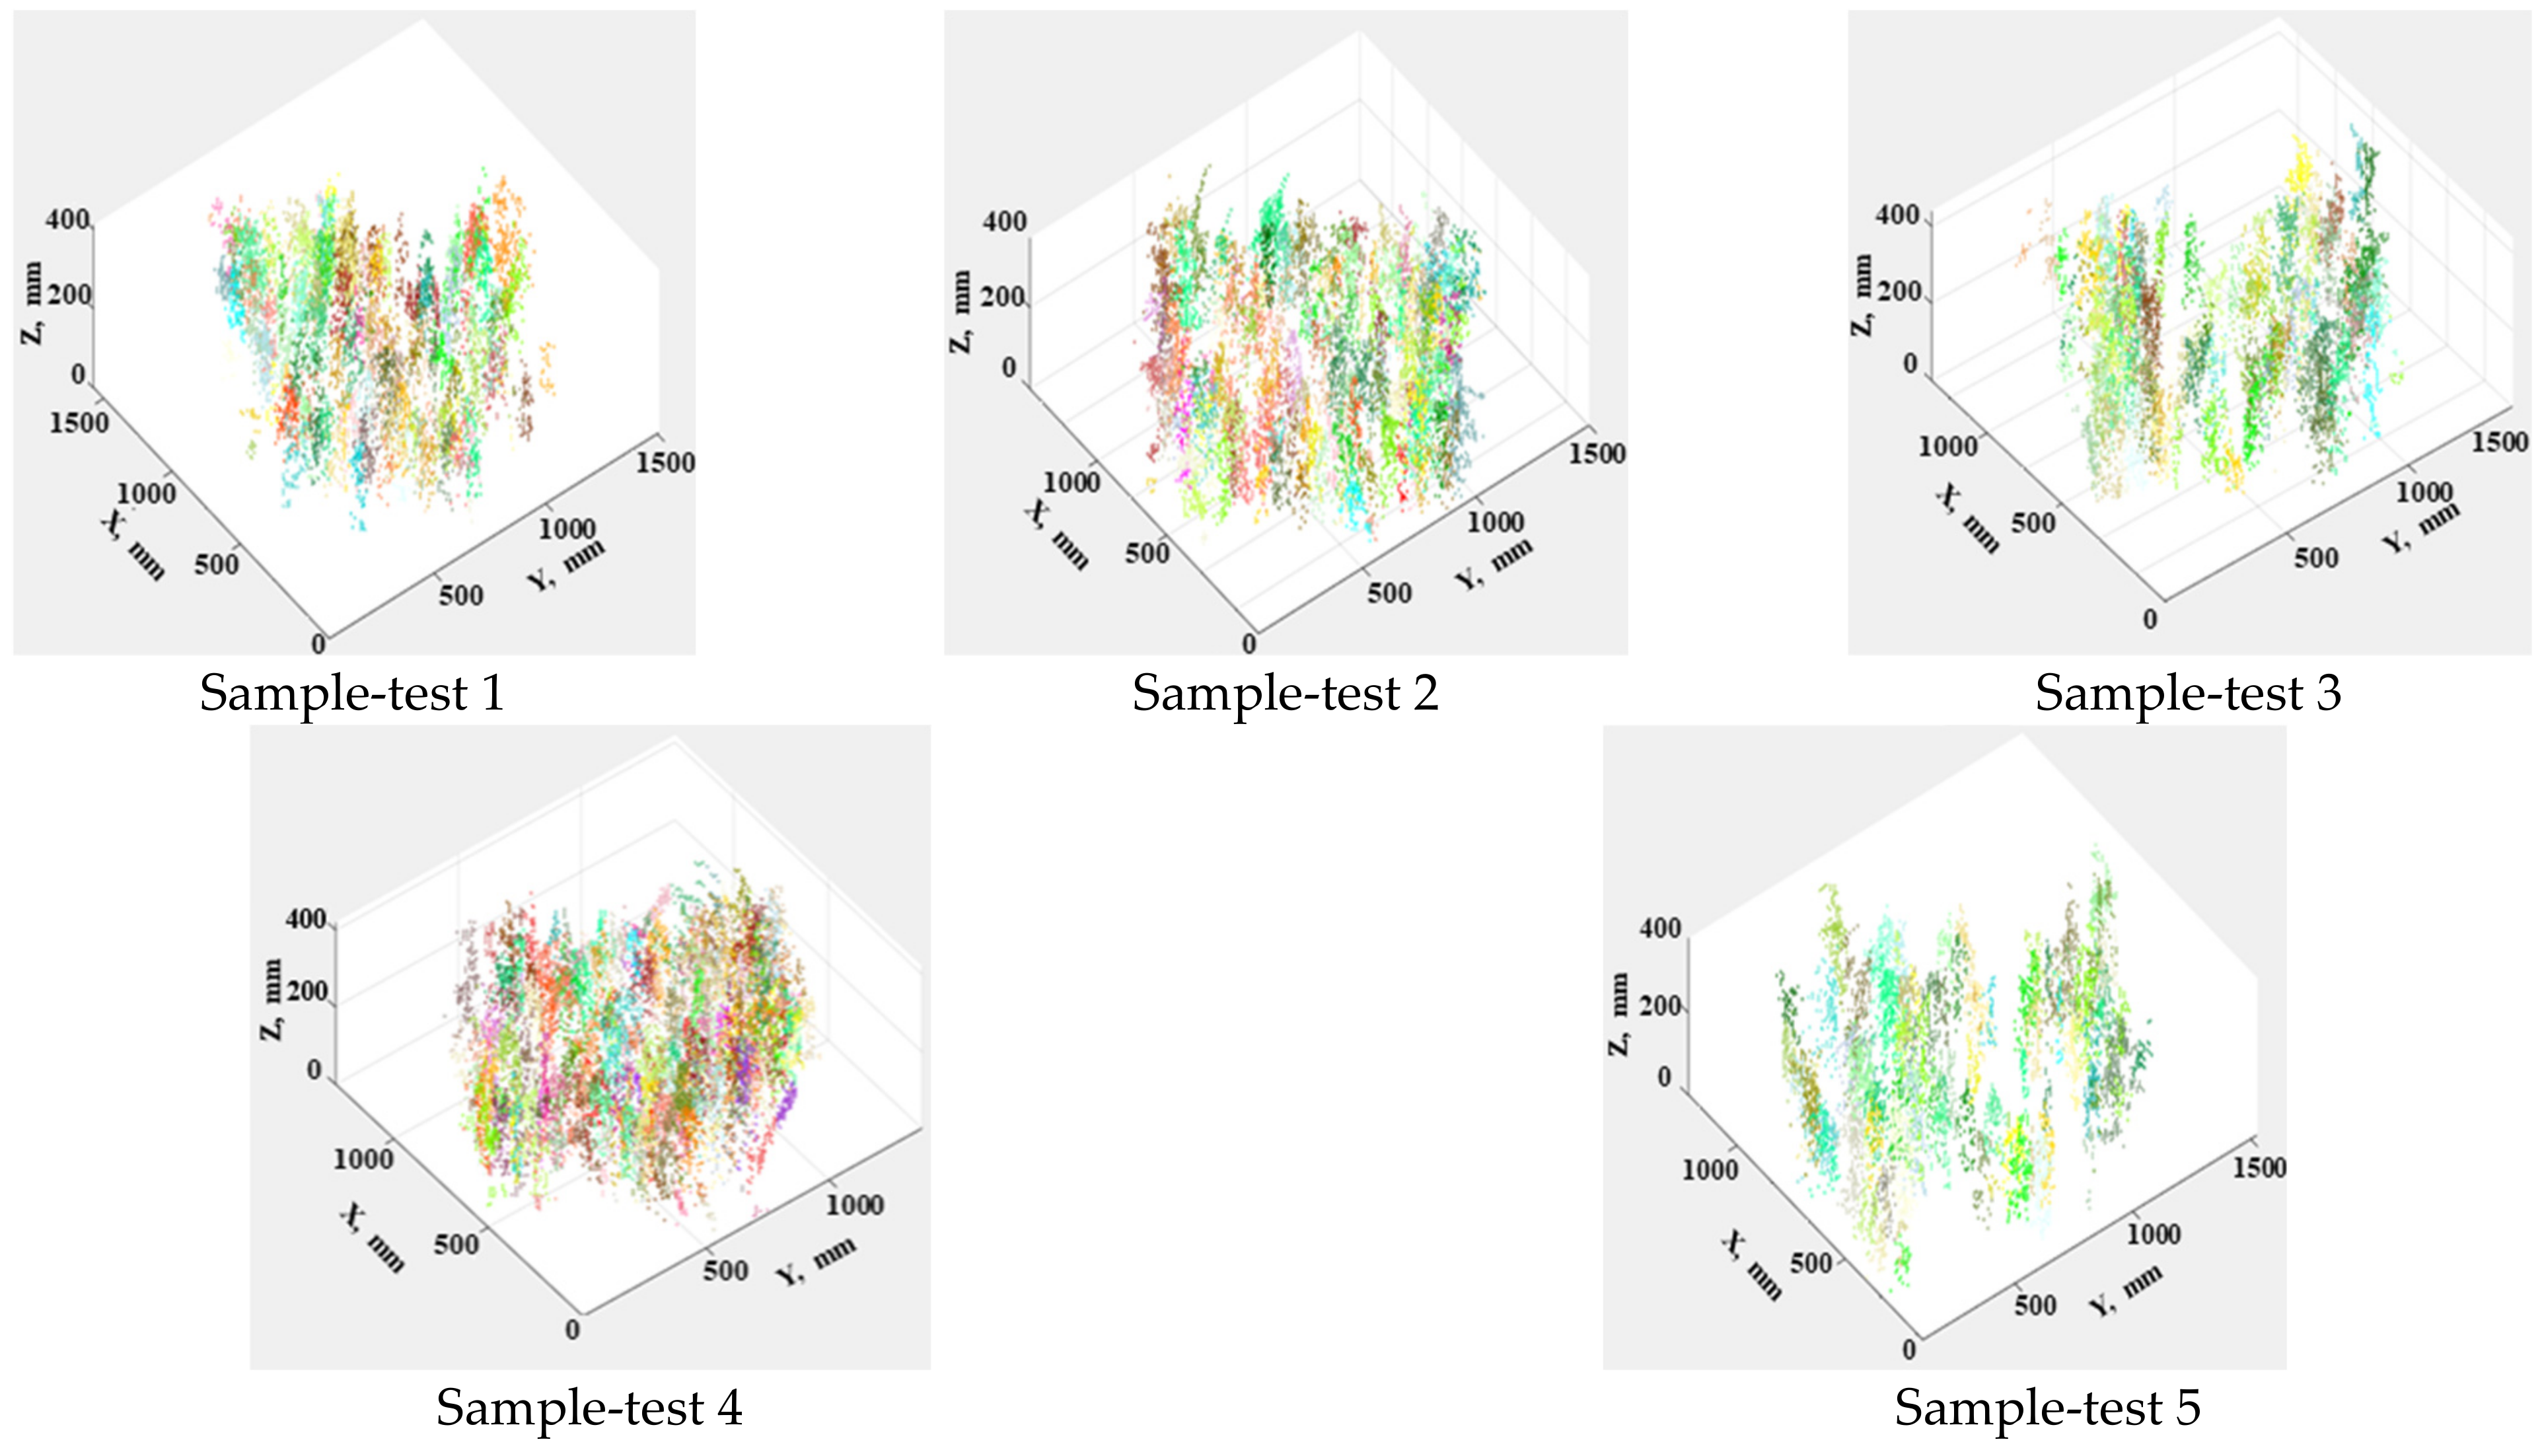
The random experiment group with random density samples was established, and the measurement tests proved the proposed methods for crop-density estimation feasible based on the double-threshold segmentation method. The best results were obtained with the mean-shift clustering, resulting in an RMSE of 9.968 and a MAPE of 3.37%.

Author Contributions

Conceptualization, Y.S.; methodology, Y.S.; software, L.W., P.Z. and X.C.; validation, Y.L.; formal analysis, X.C., P.Z.; writing—original draft preparation, Q.Z.; writing—review and editing, L.X., Q.Z. and P.Z.; funding acquisition, L.X. All authors have read and agreed to the published version of the manuscript.

Funding

This research was funded by the National Natural Science Foundation of China (51875260), the Earmarked Fund for China Agriculture Research System (CARS-12), and National Ten Thousand Talents Plan Leading Talents, Six Talent Peaks Project in Jiangsu Province (TD-GDZB-005), Taishan Industry Leading Talent Project.

Data Availability Statement

The data used to support the findings of this study are included within the article.

Conflicts of Interest

The authors declare no conflict of interest.

References

  1. Bietresato, M.; Carabin, G.; Vidoni, R.; Gasparetto, A.; Mazzetto, F. Evaluation of a LiDAR-based 3D-stereoscopic vision system for crop-monitoring applications. Comput. Electron. Agri. 2016, 124, 1–13. [Google Scholar] [CrossRef]
  2. Jimenez-Berni, J.A.; Deery, D.M.; Rozas-Larraondo, P.; Condon, A.G.; Rebetzke, G.J.; James, R.A.; Bovill, W.D.; Furbank, R.T.; Sirault, X.R. High throughput determination of plant height, ground cover, and above-ground biomass in wheat with LiDAR. Front. Plant Sci. 2018, 2018, 9. [Google Scholar] [CrossRef] [Green Version]
  3. Chai, X.Y.; Xu, L.Z.; Li, Y.; Qiu, J.; Li, Y.M.; Lv, L.Y.; Zhu, Y.H. Development and experimental analysis of a fuzzy grey control system on rapeseed cleaning loss. Electronics 2000, 9, 1764. [Google Scholar] [CrossRef]
  4. Chai, X.Y.; Zhou, Y.; Xu, L.; Li, Y.; Li, Y.M.; Lv, L.Y. Effect of guide strips on the distribution of threshed outputs and cleaning losses for a tangential-longitudinal flow rice combine harvester. Biosyst. Eng. 2000, 198, 223–234. [Google Scholar] [CrossRef]
  5. Taylor, R.K.; Hobby, H.M.; Schrock, M.D. Evaluation of an Automatic Feedrate Control System for a Grain Combine. In 2005 ASAE Annual Meeting; American Society of Agricultural and Biological Engineers: St. Joseph, MI, USA, 2005; pp. 17–20. [Google Scholar]
  6. Long, D.S.; McCallum, J.D. On-combine, multi-sensor data collection for post-harvest assessment of environmental stress in wheat. Precis. Agric. 2015, 16, 492–504. [Google Scholar] [CrossRef]
  7. Pan, J.; Shao, L.; Wang, K. Detection method on feed density for rice combine. TCSAE 2010, 26, 113–116. [Google Scholar]
  8. Homburg, H. Method and Apparatus for the Measurement of Plant Density for the Control of Harvest Machines. U.S. Patent No. 4228636, 22 April 1980. [Google Scholar]
  9. Ehlert, D.; Hammen, V.; Adamek, R. On-line Sensor Pendulum-Meter for determination of Plant Mass. Precis. Agric. 2003, 4, 1573–1618. [Google Scholar] [CrossRef]
  10. Sudduth, K.A.; Birrell, S.J.; Krumpelman, M.J. Field evaluation of a corn population sensor. In Proceedings of the 5th International Conference on Precision Agriculture, Bloomington, MN, USA, 16–19 July 2000. [Google Scholar]
  11. Maertens, K.; Reyns, P.; De Clippel, J.; De Baerdemaeker, J. First experiments on ultrasonic crop density measurement. J. Sound Vib. 2003, 266, 655–665. [Google Scholar] [CrossRef]
  12. Maldaner, L.F.; Corrêdo, L.D.P.; Canata, T.F.; Molin, J.P. Predicting the sugarcane yield in real-time by harvester engine parameters and machine learning approaches. Comput. Electron. Agric. 2021, 181, 105945. [Google Scholar] [CrossRef]
  13. Destain, M.; Vrindts, E.; Reyniers, M.; Darius, P.; Baerdemaeker, J.; Gilot, M.; Sadaoui, Y.; Frankinet, M.; Hanquet, B. Analysis of soil and crop properties for precision agriculture for winter wheat. Biosyst. Eng. 2003, 85, 141–152. [Google Scholar]
  14. Behnke, W.; Baumgarten, J. Method and Apparatus for Ascertaining the Quantity of a Crop Harvested in a Combine. U.S. Patent No. 7362233, 22 April 2008. [Google Scholar]
  15. Yang, Y.; Udupa, J.K.; Lin, Y.; Sang, N.; Nyul, L.G.; Tong, H. Crop detection and density estimation combing LiDAR points cloud with remote sensing image. In Proceedings of the MIPPR 2009: Multispectral Image Acquisition and Processing, Yichang, China, 30 October–1 November 2009. [Google Scholar]
  16. Jin, S.; Su, Y.J.; Gao, S.; Wu, F.F.; Ma, Q.; Xu, K.X.; Hu, T.; Liu, J.; Pang, S.; Guan, H.; et al. Separating the structural components of maize for field phenotyping using terrestrial LiDAR data and deep convolutional neural networks. IEEE Trans. Geosci. Remote 2019, 58, 2644–2658. [Google Scholar] [CrossRef]
  17. Saeys, W.; Lenaerts, B.; Craessaerts, G.; De Baerdemaeker, J. Estimation of the crop density of small grains using LiDAR sensors. Biosyst. Eng. 2009, 102, 22–30. [Google Scholar] [CrossRef]
  18. Phan, A.T.T.; Takahashi, K.; Rikimaru, A.; Higuchi, Y. Method for estimating rice plant height without ground surface detection using laser scanner measurement. J. Appl. Remote Sens. 2016, 10, 046018. [Google Scholar] [CrossRef] [Green Version]
  19. Christiansen, M.P.; Laursen, M.S.; Jørgensen, R.N.; Skovsen, S.; Gislum, R. Ground vehicle mapping of fields using LiDAR to enable prediction of crop biomass. arXiv 2018, arXiv:1805.01426. [Google Scholar]
  20. Hosoi, F.; Omasa, K. Estimation of vertical plant area density profiles in a rice canopy at different growth stages by high-resolution portable scanning lidar with a lightweight mirror. ISPRS J. Photogramm. 2012, 74, 11–19. [Google Scholar] [CrossRef]
  21. Velumani, K.; Elberink, S.O.; Yang, M.Y.; Baret, F. Wheat ear detection in plots by segmenting mobile laser dacnner data. In Proceedings of the ISPRS Geospatial Week, Wuhan, China, 18–22 September 2017. [Google Scholar]
  22. Zhang, L.; Grift, T.E. A LiDAR-based crop height measurement system for miscanthus giganteus. Comput. Electron. Agri. 2012, 85, 70–76. [Google Scholar] [CrossRef]
  23. Dhami, H.; Yu, K.; Xu, T.; Zhu, Q.; Dhakal, K.; Friel, J.; Li, S.; Tokekar, P. Crop height and plot estimation from unmanned aerial vehicles using 3D LiDAR. arXiv 2019, arXiv:1910.14031. [Google Scholar]
  24. Dimitrievski, M.; Veelaert, P.; Philips, W. Semantically aware multilateral filter for depth upsampling in automotive LiDAR point clouds. In Proceedings of the 2017 IEEE Intelligent Vehicles Symposium (IV), Los Angeles, CA, USA, 11–14 June 2017. [Google Scholar]
  25. Wei, H.; He, L.; Jie, L. Data processing of airborne Lidar point cloud based on the edge detection filtering algorithm. For. Eng. 2013, 29, 17–20. [Google Scholar] [CrossRef]
  26. Gang, C. Digital terrain model extraction from airborne LiDAR data in complex mining area. In Proceedings of the 18th International Conference on Geoinformatics, Beijing, China, 18–20 June 2010. [Google Scholar]
  27. Qin, J.X. Improved algorithm of building point cloud segmentation based on Otsu. Geospat. Inform. 2014, 12, 110–113. [Google Scholar] [CrossRef]
  28. Ban, Z.; Chen, Z.; Liu, J. Supervoxel Segmentation with Voxel-Related Gaussian Mixture Model. Sensors 2018, 18, 128. [Google Scholar]
  29. Reza, M.N.; Na, I.S.; Sun, W.B.; Kyeong-Hwan, L. Rice yield estimation based on K-means clustering with graph-cut segmentation using low-altitude UAV images. Biosyst. Eng. 2018, 177, 109–121. [Google Scholar] [CrossRef]
  30. Han-Ya, I.; Ishii, K.; Noguchi, N. Rice yields and rrotein content estimation by low-altitude remote sensing using spectroradiometer. IFAC Proc. Vol. 2011, 44, 1796–1801. [Google Scholar] [CrossRef] [Green Version]
  31. Li, M.; Bi, X.; Wang, L. A method of two-stage clustering learning based on improved DBSCAN and density peak algorithm. Comput. Commun. 2021, 167, 75–84. [Google Scholar] [CrossRef]
  32. Melzer, T. Non-parametric segmentation of ALS point clouds using mean shift. J. Appl. Geod. 2007, 1, 159–170. [Google Scholar] [CrossRef]
  33. Blanquart, J.E.; Sirignano, E.; Lenaerts, B.; Saeys, W. Online crop height and density estimation in grain fields using LiDAR. Biosyst. Eng. 2020, 198, 1–14. [Google Scholar] [CrossRef]
Figure 1. LiDAR measurement system: (a) mobile measurement terminal, (b) fixed reference station and (c) computer control part.
Electronics 10 00872 g001
Figure 2. Standard experiment group with manually set densities rice samples.
Electronics 10 00872 g002
Figure 3. Random experiment group with mature-rice densities randomly selected in the field.
Electronics 10 00872 g003
Figure 4. Rice-sample collection: (a) distribution of samples in the random experimental group and (b) sampling frame.
Electronics 10 00872 g004
Figure 5. Point-cloud data segmentation by elevation threshold: (a) elevation value of point-cloud data, (b) histogram of elevation distribution and (c) segmentation based on elevation threshold.
Electronics 10 00872 g005
Figure 6. Point-cloud data segmentation by intensity inflection threshold: (a) reflection intensity value of point-cloud data, (b) histogram of reflection intensity distribution and (c) segmentation based on reflection intensity distribution.
Electronics 10 00872 g006
Figure 7. Supervoxel clustering result in standard experiment group.
Electronics 10 00872 g007
Figure 8. Mean-shift clustering result in standard experiment group.
Electronics 10 00872 g008
Figure 9. Noise reduction of Sample-set 2 from the random experiment group: (a) without noise reduction and (b) after noise reduction.
Electronics 10 00872 g009
Figure 10. The segmentation results of random experiment group based on double-threshold.
Electronics 10 00872 g010
Figure 11. Supervoxel clustering results of random experiment group.
Electronics 10 00872 g011
Figure 12. Mean-shift clustering results of random experiment group.
Electronics 10 00872 g012
Table 1. Main parameters of VLP-16 laser scanner.
Performance TargetParameterPerformance TargetParameter
Number of laser lines16Horizontal angle resolution/°0.1–0.4
Range/mm<100Frequency/Hz5–20
Accuracy/cm±3Working voltage/V9–32
Vertical angle resolution/°2Weight/g830
Horizontal measurement angle range/°360Dimensions/mm103×72
Wavelength/nm903Power/W8
Laser beam size/mm9.5 × 12.7Divergence angle/mrad3.0
Table 2. Main parameters of integrated navigation module.
Performance TargetParameter
Output frequency of IMU/Hz200
Output frequency of GNSS/Hz20
Course accuracy/0.05
Elevation angle and roll accuracy/°0.015
Input voltage/V10–30
IMU, Inertial Measurement Unit; GNSS, Global Navigation Satellite System.
Table 3. Supervoxel clustering parameters and results of the standard experiment group.
Number MarkVoxel Size
(mm)
Seed-Point Spacing (mm)Number of Point Clouds in Point CloudActual Results,
Plants/m2
Clustering Results,
Plants/m2
Sample-set 1a2020011,310100105
b2019012,78097
c2021012,309108
Sample-set 2a2016015,451200207
b2016017,460205
c2017016,997194
Sample-set 3a2014018,633300311
b2013021,055323
c2014021,152307
Sample-set 4a2012026,780400381
b2011030,261396
c2011030,138405
Table 4. Mean-shift clustering parameters and results of the standard experiment group.
Number MarkKernel Bandwidth
(mm)
Number of Points Clouds in Point Cloud Actual Results,
Plant/m2
Clustering Result, Plants/m2
Sample-set 1a4511,31010096
b4412,780104
c4512,30998
Sample-set 2a3815,451200193
b3817,460191
c4016,997189
Sample-set 3a3318,633300287
b3321,055292
c3221,152310
Sample-set 4A3026,780400392
B3030,261412
C2930,138415
Table 5. Rice-density estimation of random experiment group.
NumberMarkActual Result, Plants/m2Supervoxel Clustering
Result, Plants/m2
Mean-Shift Clustering
Result, Plants/m2
Sample-test 1a404437406
b421409
c410401
Sample-test 2a393393396
b399402
c403403
Sample-test 3a365345387
b367382
c372408
Sample-test 4a402402410
b405415
c439412
Sample-test 5a333333332
b331328
c327341
Publisher’s Note: MDPI stays neutral with regard to jurisdictional claims in published maps and institutional affiliations.

