1. Introduction
A road traffic survey identifies the number and type of vehicles passing through a specific point on the road over a period of time. The results of this survey are used as basic data for road traffic planning, road design, road operation status analysis, maintenance strategy establishment, and project feasibility evaluation [
1]. In one method commonly used in traffic volume surveys, a person manually classifies the number and type of vehicles. In the final step, the expert verifies the data once more. However, this method, which requires a high amount of manpower, cannot be applied where long-term data interpretation is required, such as a traffic survey that continuously monitors traffic 365 days a year. Even in the case of short-term data, it is easy for workers to feel tired due to the nature of traffic survey work that is close to a repetition of simple work. This cause a problem in that the reliability of the traffic volume survey result cannot be improved beyond a certain value.
In order to solve this problem, several preceding studies have been attempted to automate the traffic volume survey [
2,
3,
4,
5,
6]. There have been many attempts to measure vehicle traffic using sensors [
7] or image processing methods [
4,
8,
9,
10]. However, there is a risk of damage or loss when using the sensors installed for a long time, and it is difficult to distinguish between vehicle types when using the image processing method. Therefore, neither method has been widely adopted. Recently, with the development of AI and deep learning technology, many methods of extracting traffic information using this technology have been proposed [
11,
12,
13,
14,
15,
16,
17,
18]. However, all of these methods do not have a way to verify the accuracy of the number and type of vehicles to generate traffic survey data. In order to verify the accuracy, a person must manually verify the number and type of vehicles. The average reliability of road traffic surveys required by several road traffic survey companies is over 98%. However, Among the currently proposed methods, there is no method with such reliability performance without human intervention.
Therefore, this paper proposes a method of generating traffic volume survey data that can help the existing traffic volume survey method while minimizing human intervention. This method uses deep learning or various methods to classify vehicles according to CCTV’s road traffic survey guidelines and to count the number of vehicles along the route. The result is then verified using a verification algorithm that checks the vehicle type and route. The algorithm automatically provides users with candidates with a high probability of error through the user interface. Users can save time by first verifying the error list instead of checking all results sequentially. The verified lists are saved as accurate information through the correction and deletion functions of the user interface, and finally provided to the user in the form of traffic volume survey data. To demonstrate the proposed method, we developed a user interface on our own based on the requirements of a road traffic survey specialist, and built and experimented with a data set necessary for classifying vehicles. In addition, we conducted experiments and demonstrations based on the images used in actual road traffic surveys. We proved that our method is better by comparing the performance of the proposed method and the existing method manually verified by humans.
This paper is organized as follows.
Section 2 presents the preceding work related to the traffic volume survey method.
Section 3 describes the process and method for generating traffic volume survey data.
Section 4 shows the results of experiments and verification using the proposed method. Finally,
Section 5 presents the conclusions.
2. Related Work
Previous studies that automatically survey traffic volume can be classified into three categories: sensor-based, image-processing-based, and deep-learning-based.
First, the way to use sensors [
7] is to develop a new intelligent vehicle counting and classification system that uses wireless magneto-mechanical sensors for real-time traffic monitoring. Vehicle detection, speed and length estimation, and coarse classification can be performed using smart wireless sensors. It shows consistent and accurate performance in free flow and congested traffic conditions on highways and city roads. However, if a sensor is used, there are costs to installing the sensor and to inconvenient maintenance. Therefore, it is not suitable due to the nature of road traffic surveys where multiple points on the road must be surveyed.
The method using image processing mainly uses vehicle classification to detect vehicle type and vehicle movement. Kamkar, et al. [
4] divided the vehicle into two parts to differentiate the vehicle using images such as sketches, textures, colors, and planes. Belen, et al. [
8] proposed a vehicle detection method that uses an active-based model to select vehicles and identify vehicles based on reflections. Two features are extracted, counted, and classified: the vehicle length of the significant corresponding temporal space image and the correlation calculated from the co-occurrence of the gray level of the vehicle image within the bounding box. Memon, et al. [
9] captured frames from the video to perform background subtraction in order to detect and count the vehicles using GMM (Gaussian Mixture Model) background subtraction; it then classifies the vehicles by comparing the contour areas to the assumed values. However, there is a disadvantage that the performance for classification by vehicle type does not come out as required by the traffic volume survey data.
Deep-learning-based technologies combine detection, tracking, and re-id technologies to classify and count vehicles. Arinaldi, et al. [
11] used Faster R-CNN (Region with Convolutional Neural Network) to detect the vehicle, used the MoG (Mixture of Gaussian) + SVM (Support Vector Machine) system to classify the vehicle type, and monitored the vehicle’s speed estimation and lane usage. Awang, et al. [
13] used convolutional neural networks and deep learning methods using the CNNLS (Convolutional Neural Network with Layer skipping-Strategy) framework to classify vehicles into three classes: car, taxi, and truck. Wang, et al. [
19] used an algorithm, which effectively combines detection, background modeling, tracking, trajectory modeling, and matching in a sequential manner. They proposed a trajectory modeling and matching schema that leverages the direction and speed of a local vehicle’s trajectory to improve the robustness and accuracy of vehicle turn-counts. Bui, et al. [
15] proposed a comprehensive framework with multiple classes and movements for vehicle counting. They adopted state-of-the-art deep learning methods for vehicle detection and tracking. An appropriate trajectory approach for monitoring the movements of vehicles using distinguished regions tracking was then presented in order to improve the performance of the counting.
However, in all these studies, there was no verification method to check whether the vehicle type was well classified or the vehicle was identified as being on the correct route. For accuracy beyond the standard, there was no choice but to compare the accuracy by having a human verify the total count of vehicles. To address this problem, we propose a method for generating traffic volume survey data combined with automatic recognition. By verifying the traffic volume survey result extracted from the image with a verification algorithm and user interface, and providing it in the form of a file, it is possible to quickly and easily secure highly reliable traffic survey results.
3. Methods
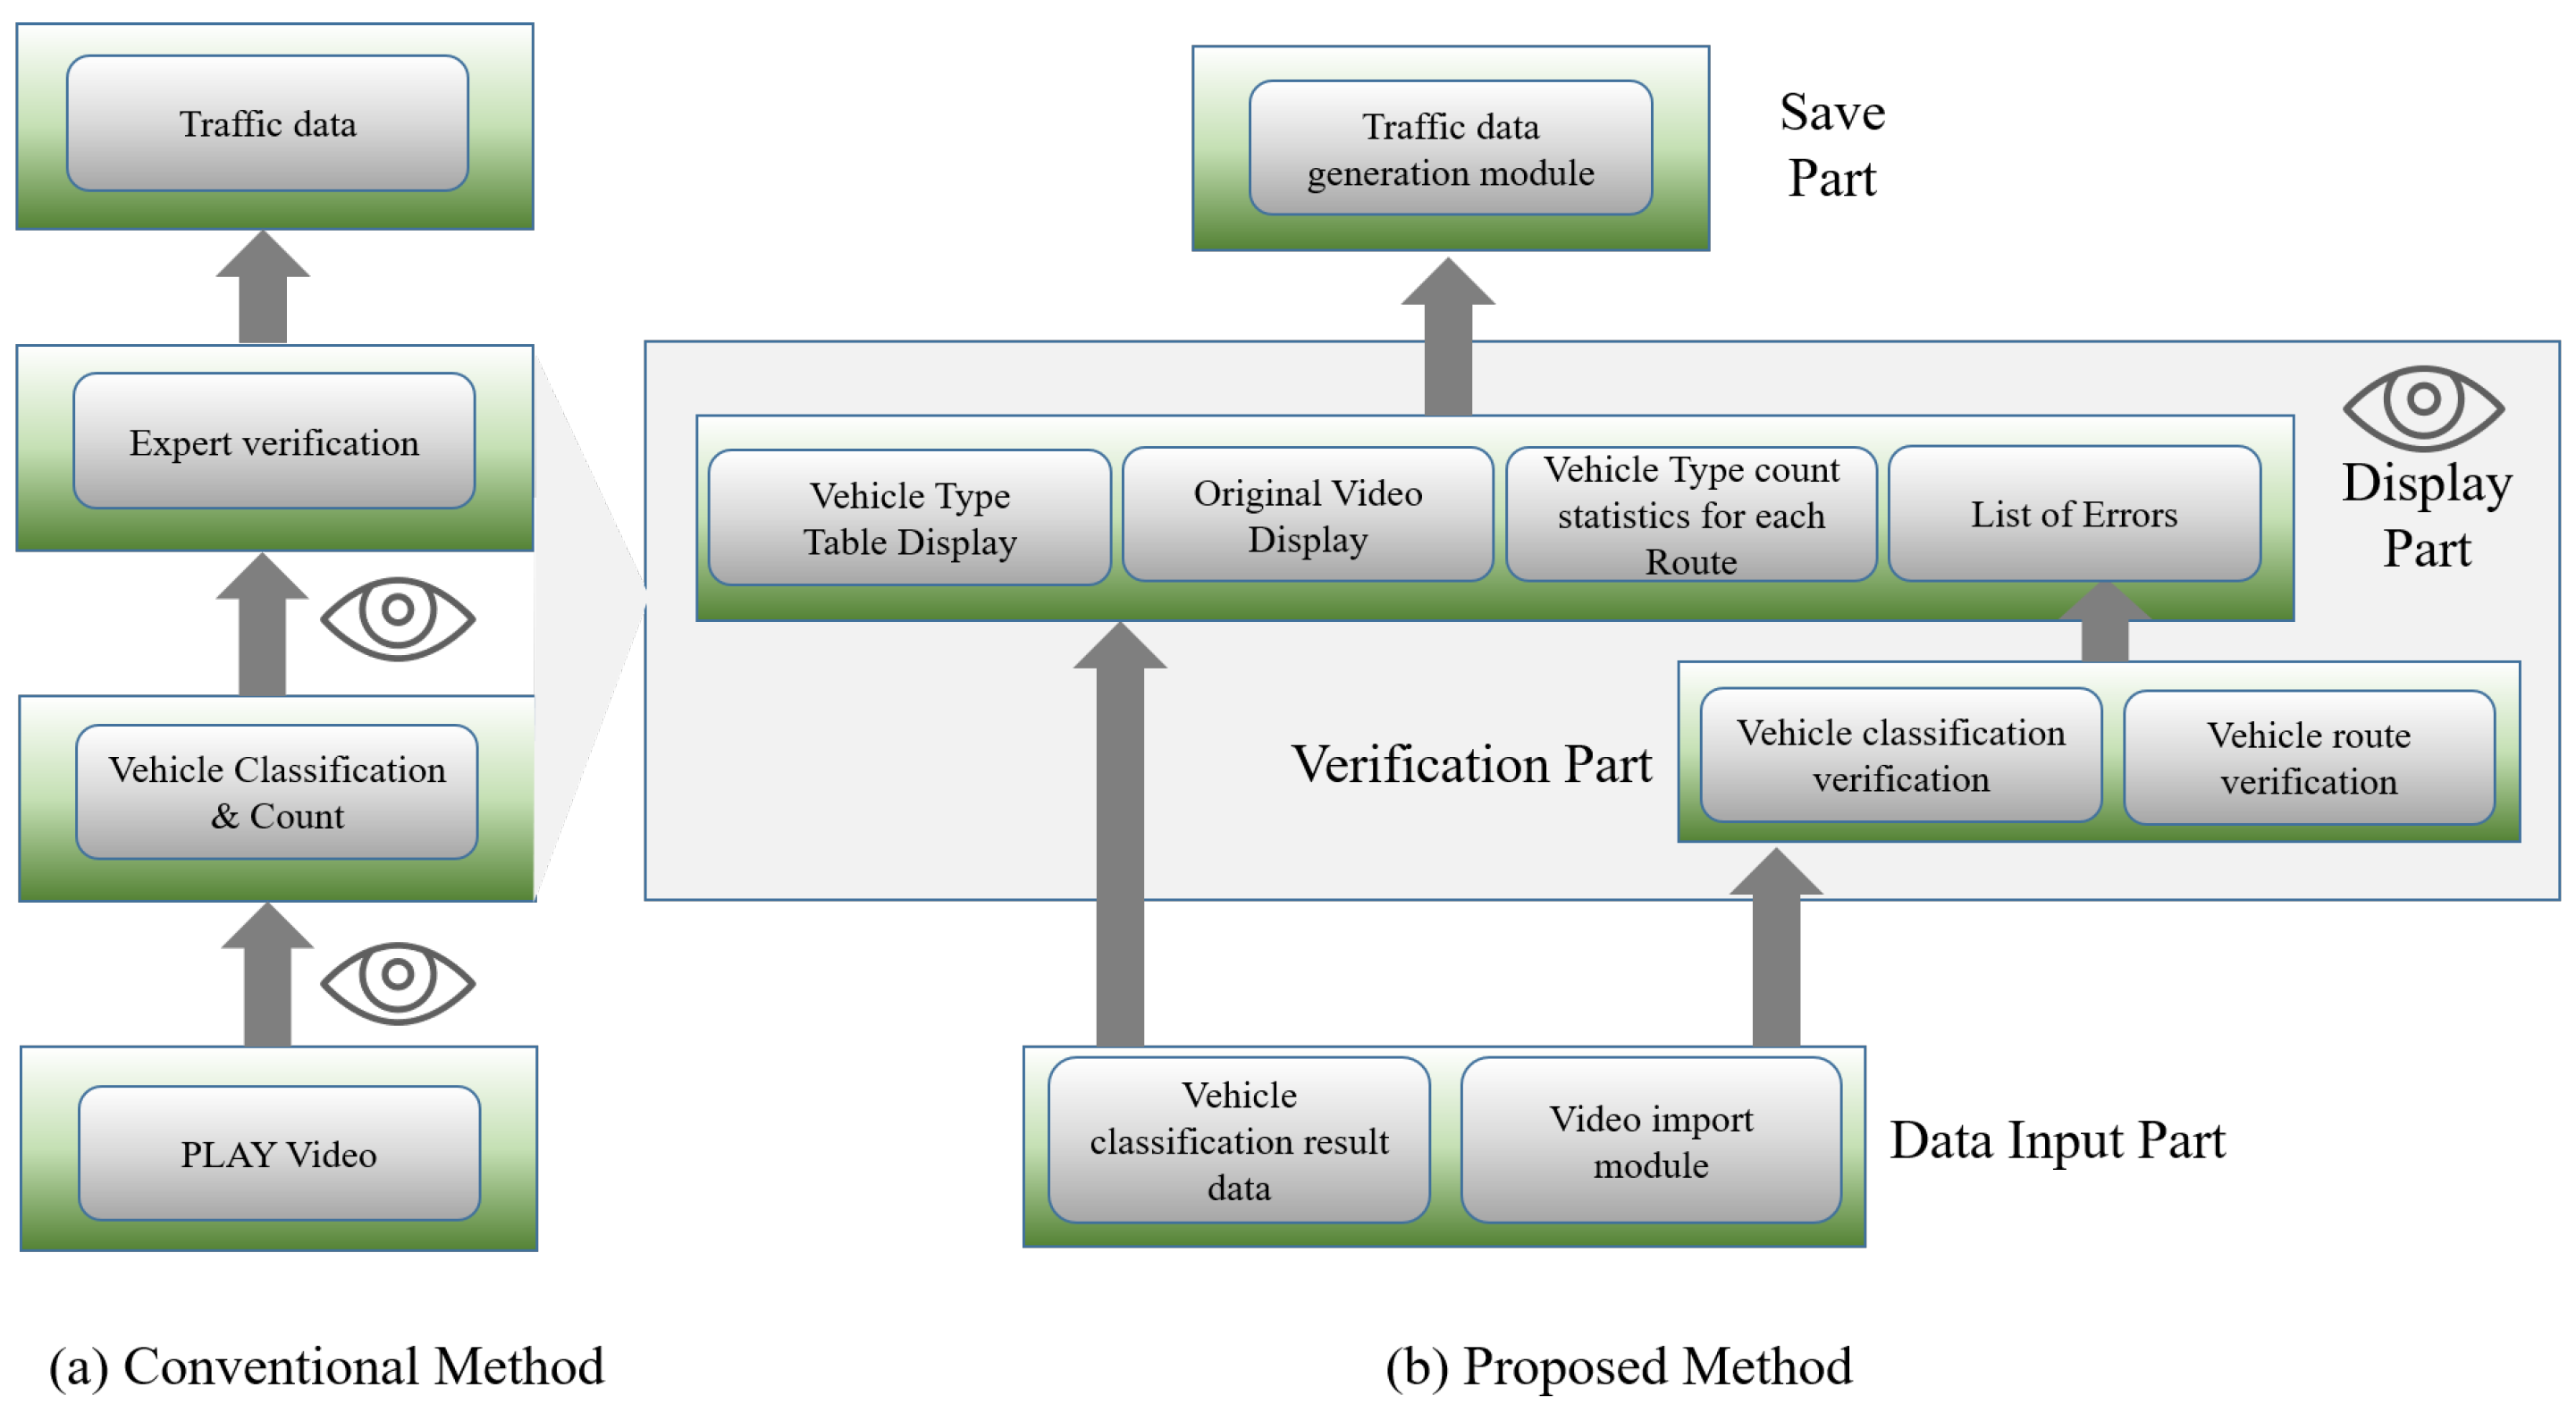
The method commonly used in traffic surveys is to count and classify vehicles while a person plays a videotape. When a person extracts the result while playing the video, it is operated in a way that the expert finally verifies the result. In order to minimize human intervention in the existing traffic volume survey method, we propose a survey method as shown in
Figure 1.
The method we have proposed is as follows:
Extract the vehicle type classification result for each route using deep learning or a similar method.
When the vehicle type classification result for each route is input to the display unit, a screen for each vehicle type and a total count for each route are provided to the user.
The verification part checks the type of vehicle and the path of the vehicle and provides a list of errors to the user.
The user proceeds with a review based on the error list.
The storage device provides the final reviewed result in the form of a traffic volume survey file.
The above process allows one person to do the investigation and verification conducted by two people in the previous method.
3.1. Data Input Part
The data input part provides the original image for generating traffic volume survey data and the extracted result using the traffic volume survey method. We combined YOLO (You Only Look Once) v3 [
20], Deep Feature, and ResNet (Residual Network) [
21] to obtain the result. We detect vehicles using YOLO v3 in individual frames of video and create a trajectory by connecting the detection results for each frame using tracking technology [
22,
23]. Finally, for representative images of the trajectory, vehicle types are classified using a classifier, and traffic volume information according to vehicle types is extracted [
24]. The reason we chose ResNet-18 was that the vehicle classification criteria are not large, and we need a model of a small size that can be trained and inferred in a short amount of time.
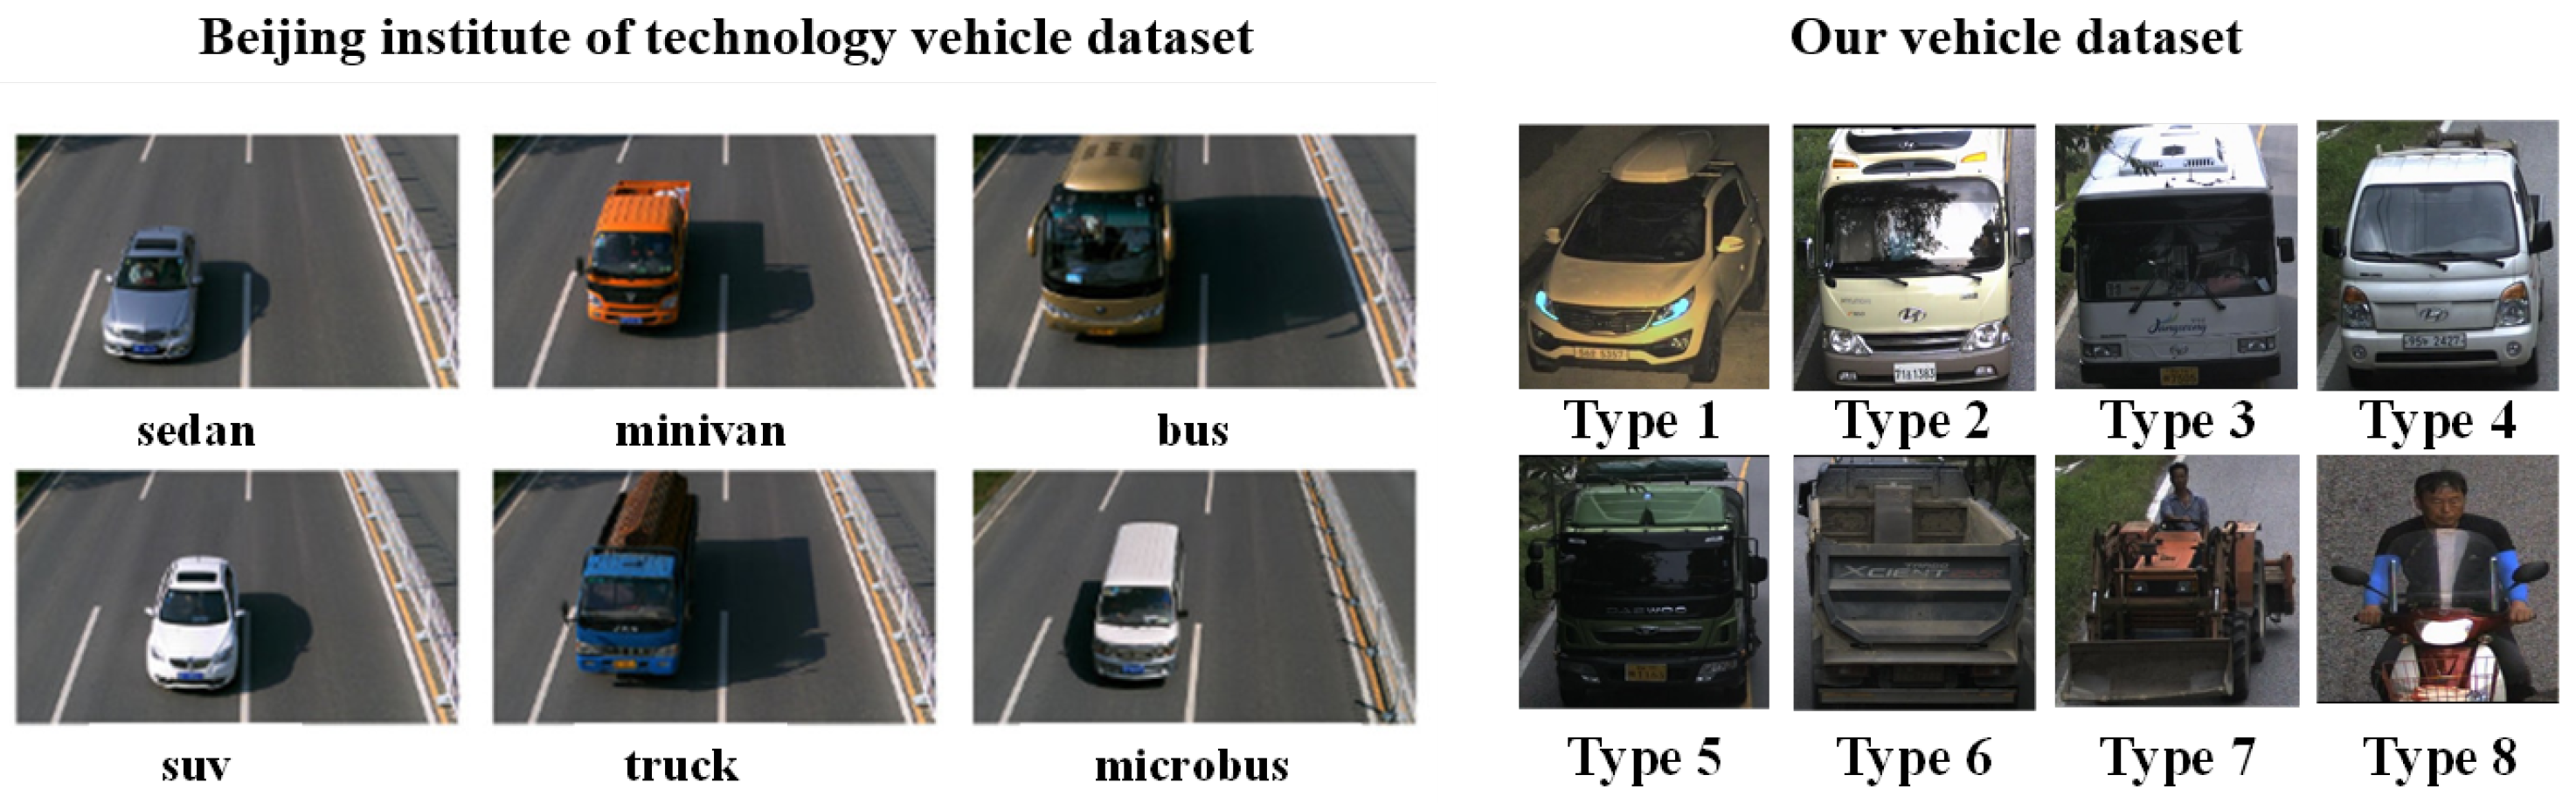
Vehicle classification criteria differ according to region and purpose. For other public datasets, the BIT (Beijing Institute of Technology) vehicle dataset [
25] is divided into 6 types: sedan, minivan, bus, SUV, truck, and microbus. MIO-TCD (MIOvision Traffic Camera Dataset) [
26] is divided into 8 types: articulated trucks, buses, pickup trucks, cars, non-powered vehicles, single unit trucks, work vans, and motorcycles. We classified vehicles into a total of 8 types by adding 2 more types to the basic 6 types of vehicles that are frequently used in traffic volume surveys. We have Type 1 for passenger car or taxi van, Type 2 for small buses, Type 3 for large buses, Type 4 for small cargo under 2.5 tons, Type 5 for medium cargo under 8.5 tons, Type 6 for large cargo and trailers, Type 7 for special vehicles, and Type 8 for two-wheeled vehicles [
27].
Figure 2 shows the BIT and our dataset.
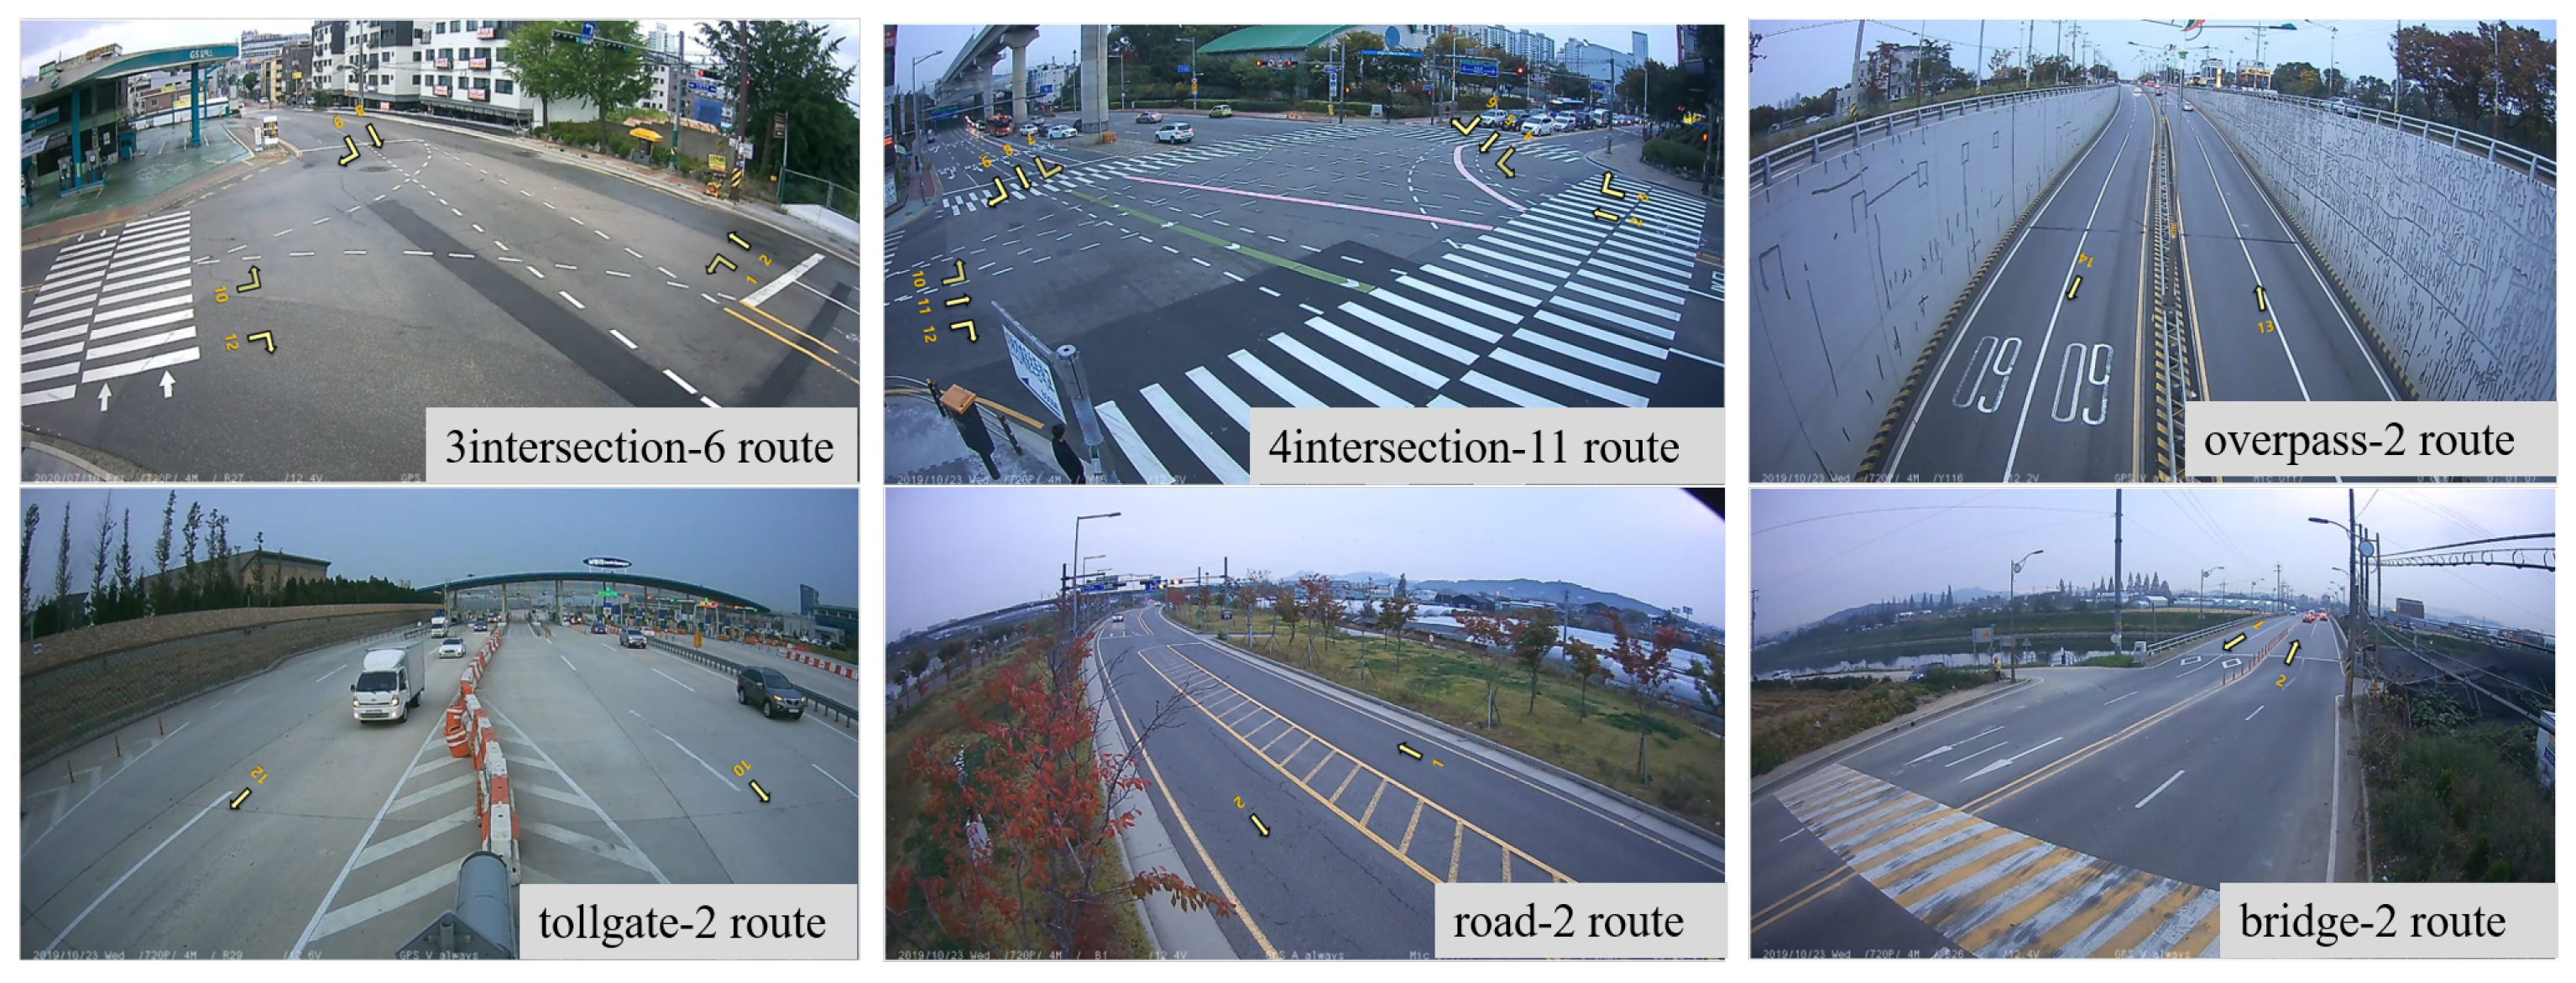
The number of vehicles is extracted for each route according to the road point. For example, as shown in
Figure 3, vehicles are detected in 6 routes in the case of a 3-way intersection, and 11 or 12 routes in the case of a 4-way intersection. The route is different for each measuring point, to be decided according to the survey point. In this paper, a deep feature was used to track the vehicle for each frame by applying the re-ID (re-IDentification) method to determine the path [
22].
3.2. Display Part
The display part shows a list by vehicle type according to the vehicle classification criteria and a total count of vehicle types for each route so that a person can easily check the traffic volume survey results. In addition, a list with a high probability of error is provided using a verification algorithm so that data can be generated by minimizing human intervention.
3.2.1. List by Vehicle Type
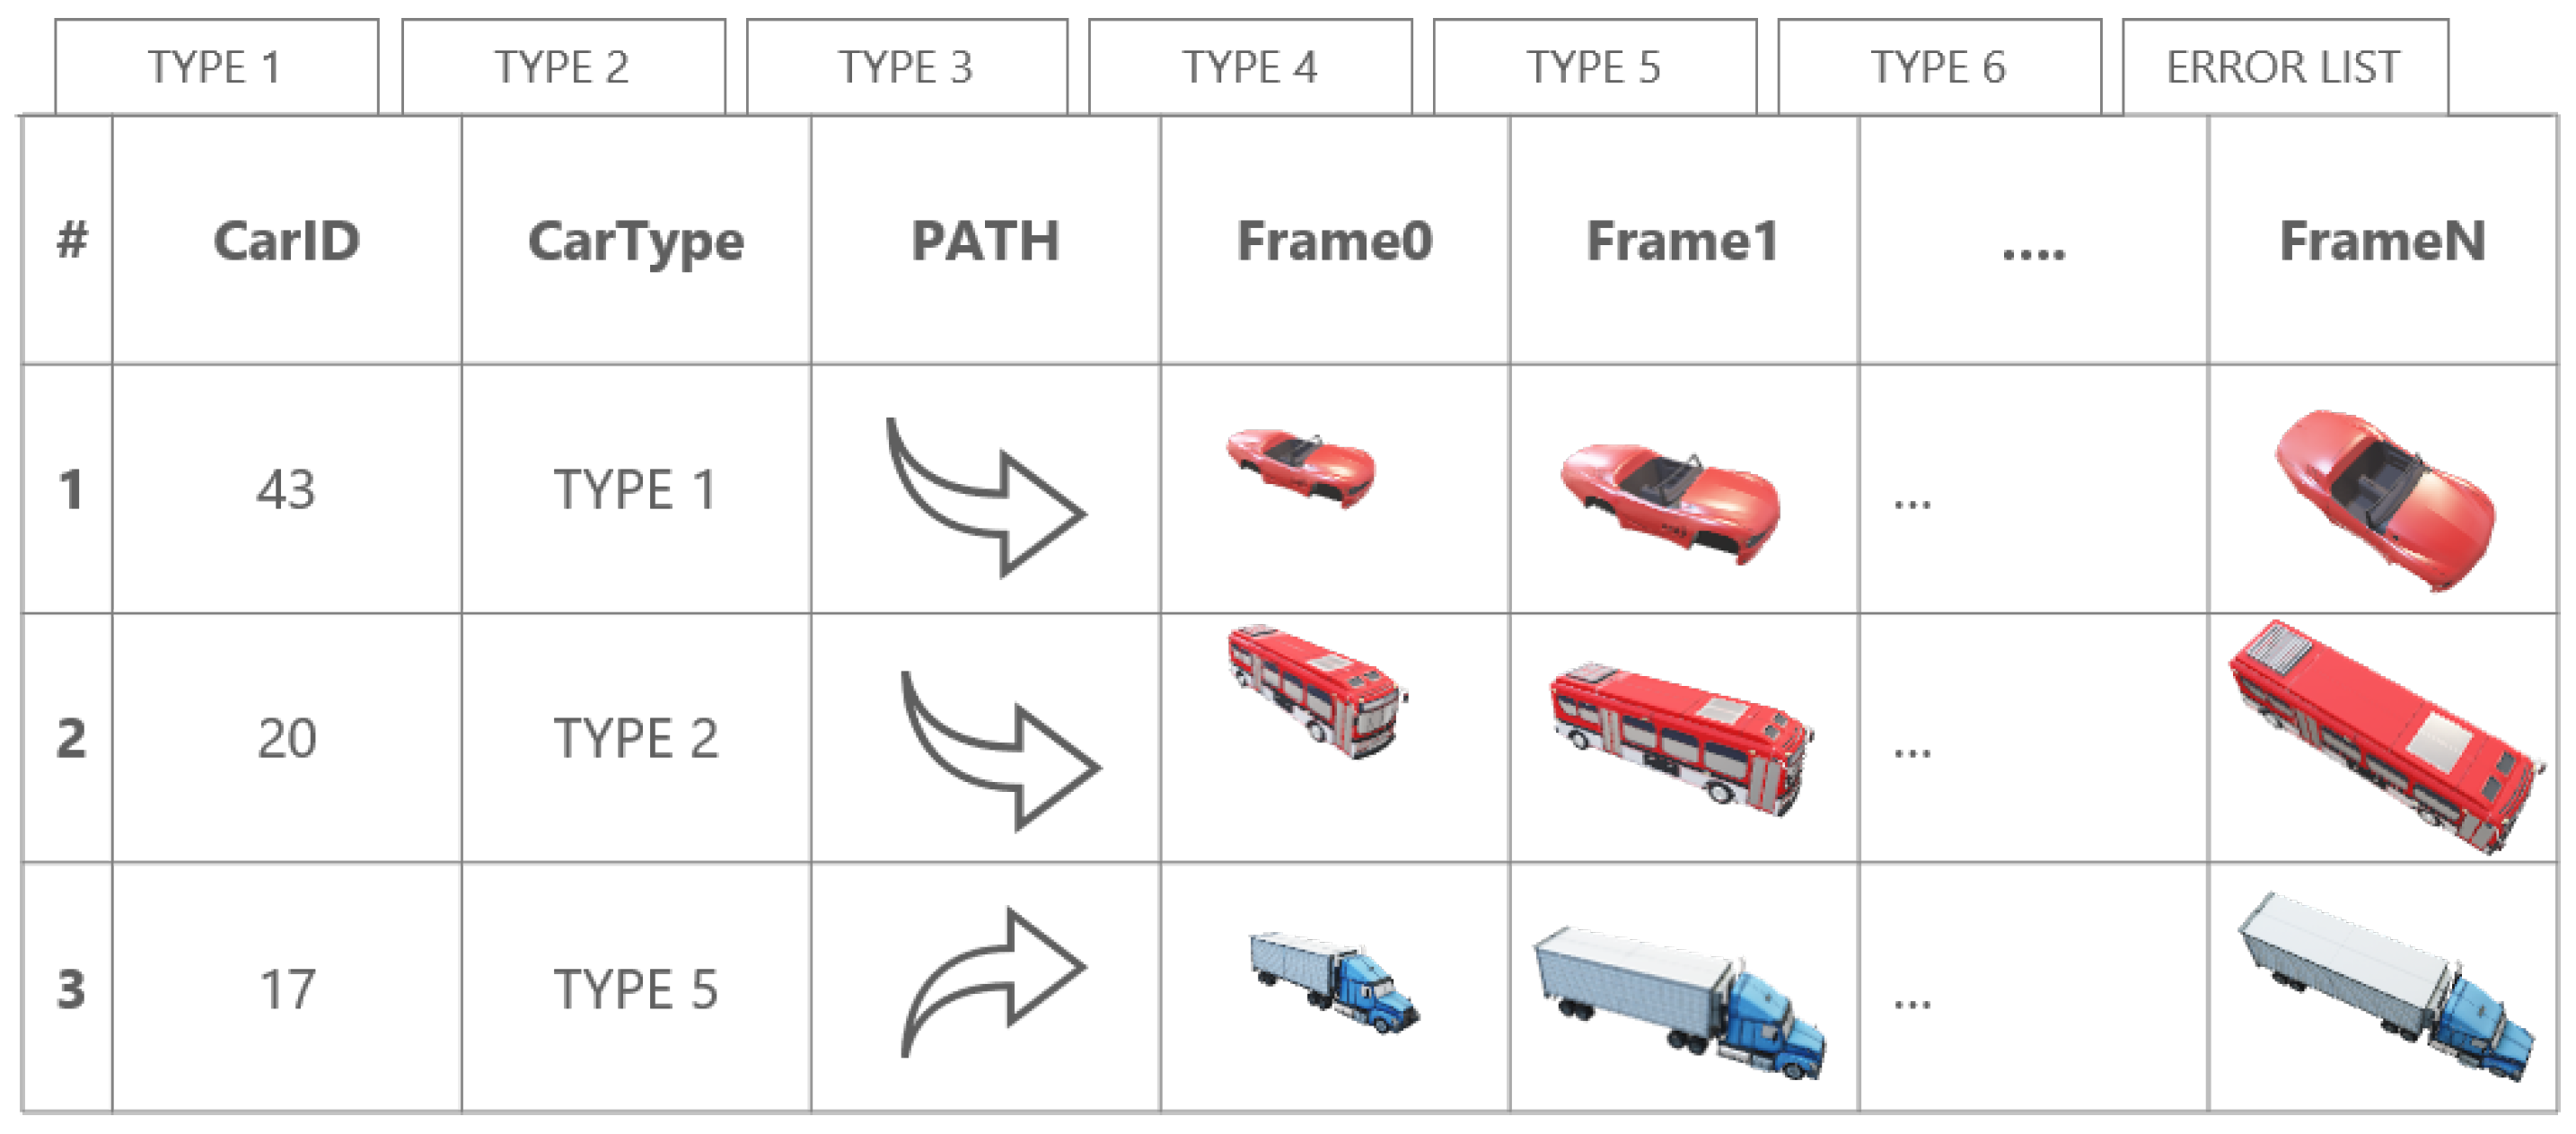
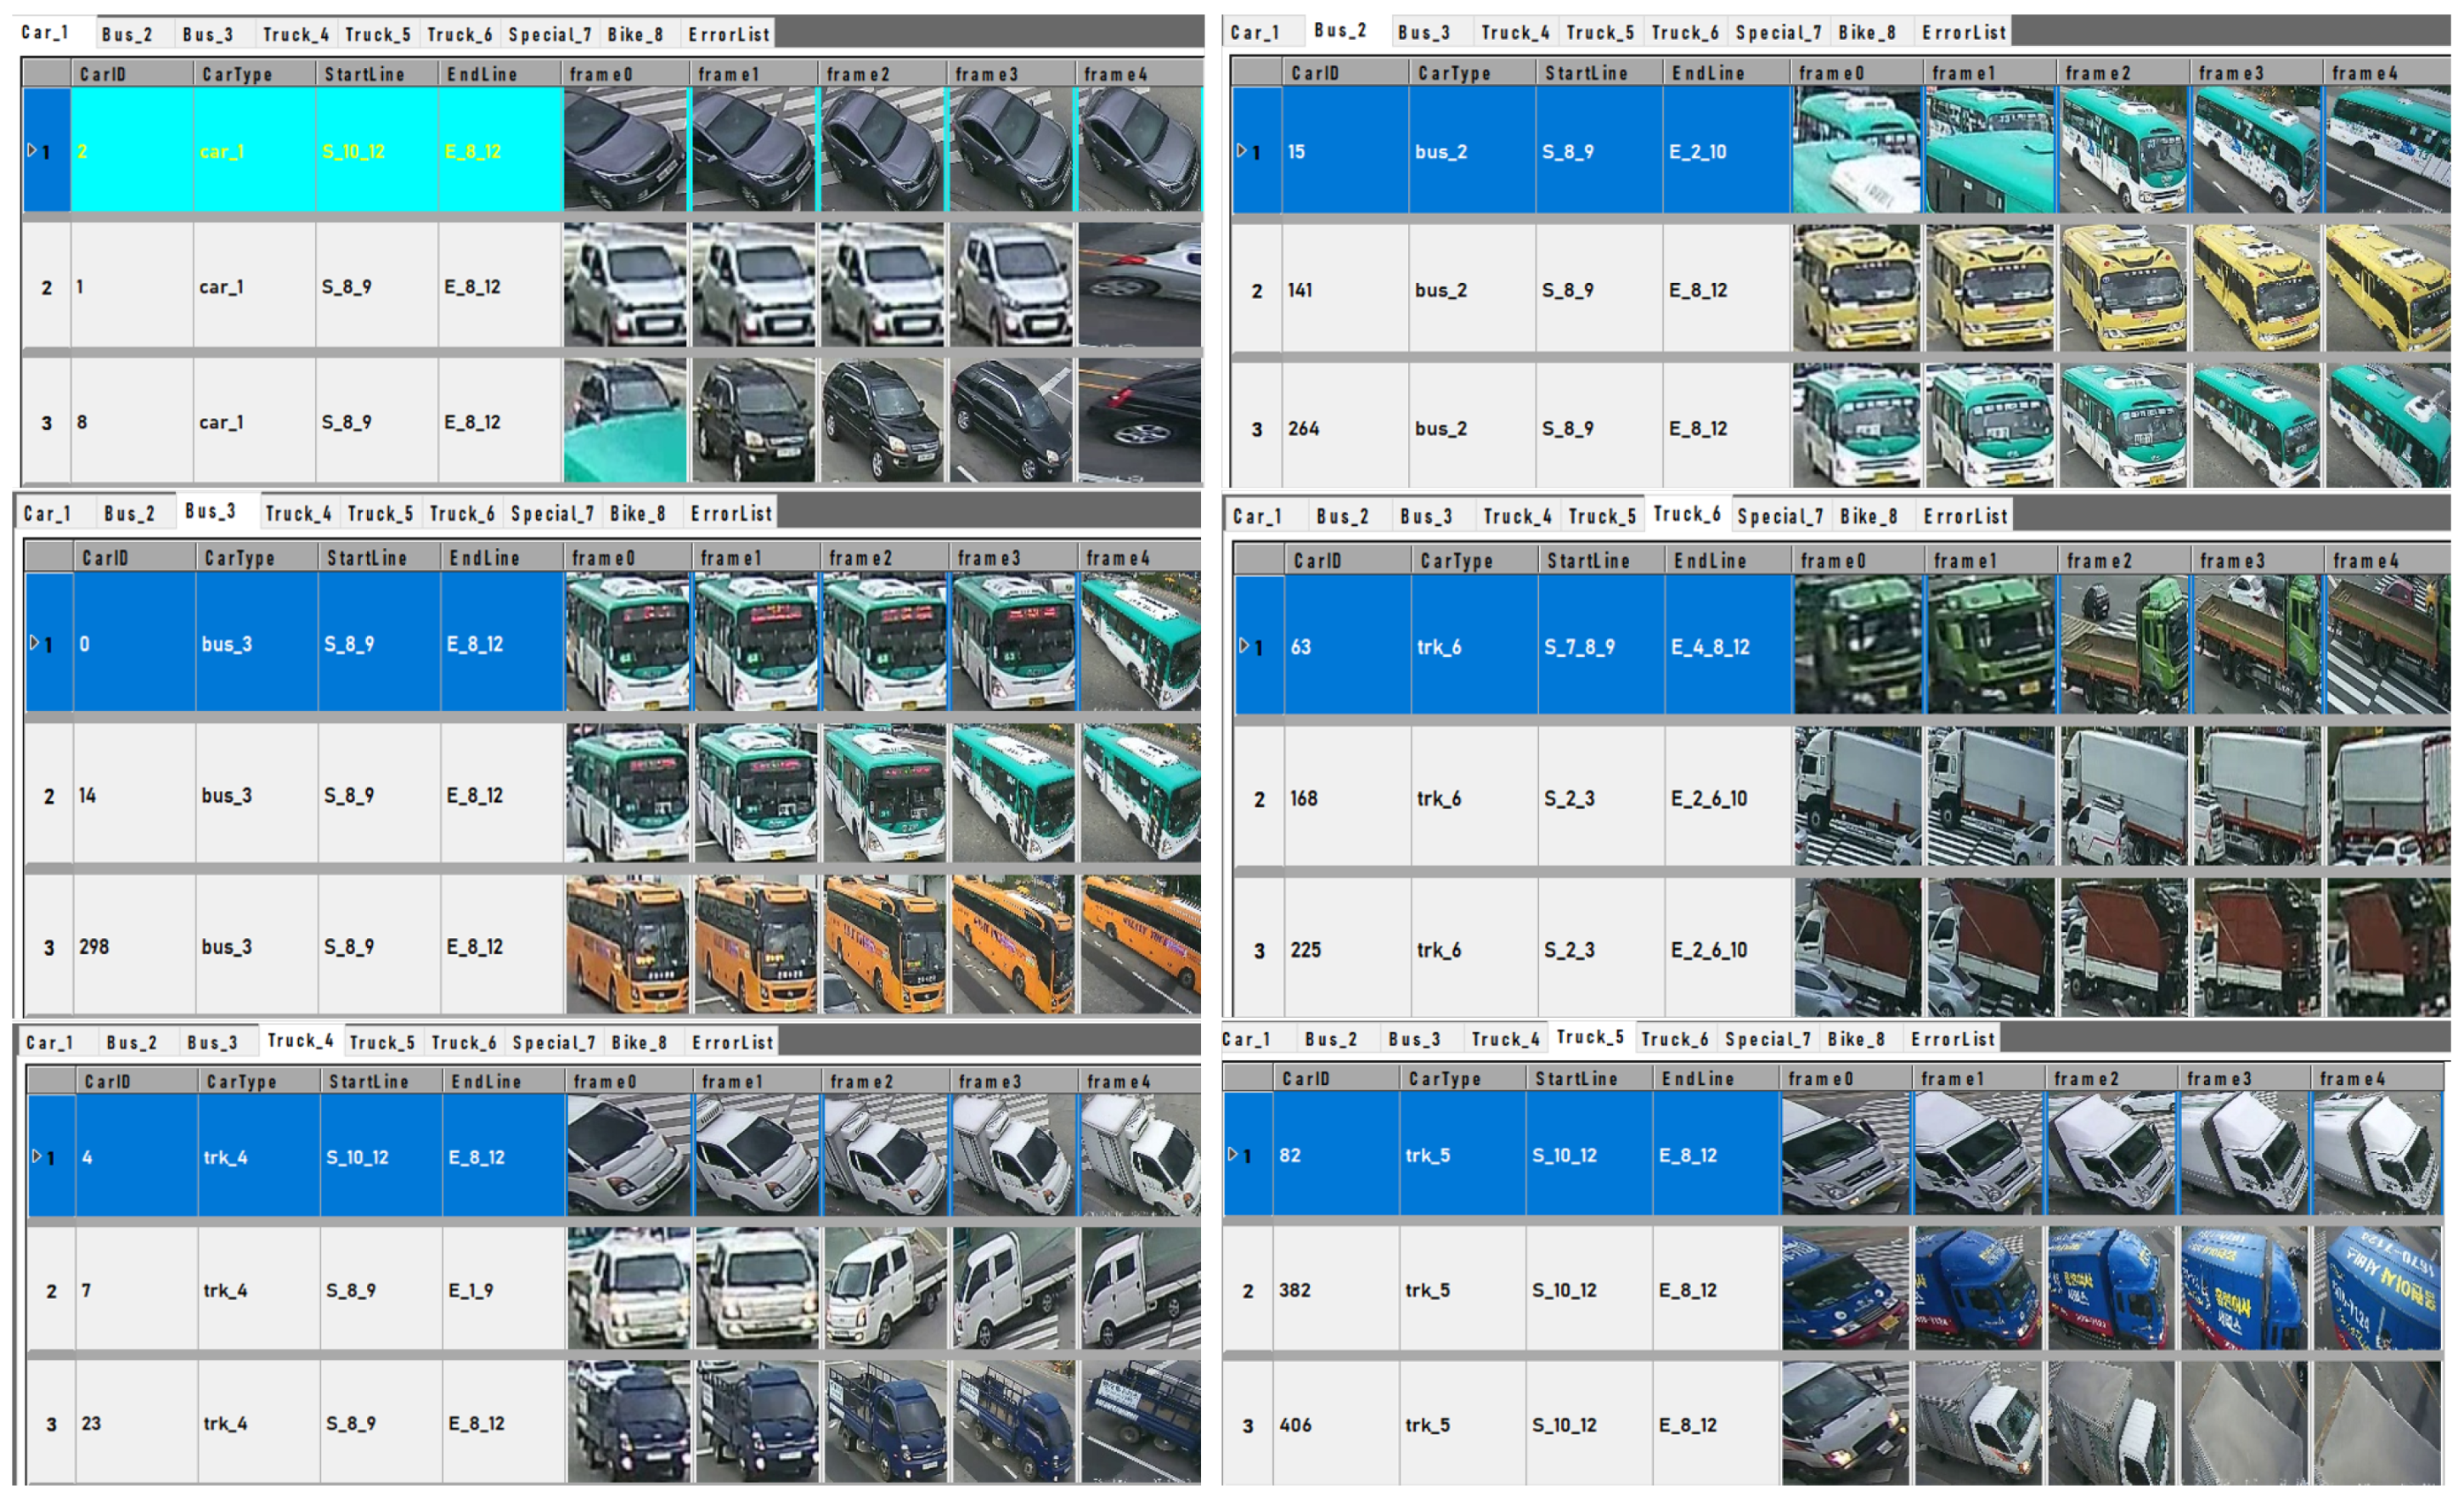
As shown in
Figure 4, lists are displayed on each screen by vehicle type according to the classification criteria set in the traffic volume survey guidelines. This is a necessary part for the user to clearly verify the vehicle type classification. Particularly, the part that sequentially shows vehicle images is important. The contents of the table may show different elements depending on the user. The information included in
Figure 4 is a drawing that is structured so that the essential elements necessary to verify the road traffic survey result can be seen.
The vehicle ID, type, route information, and image must be provided for the user to check the number of vehicles by vehicle type. The route shows the information of the starting point and the ending point of the vehicle, and the image should show the part where the vehicle appears in the image to the part where the vehicle disappears from the image.
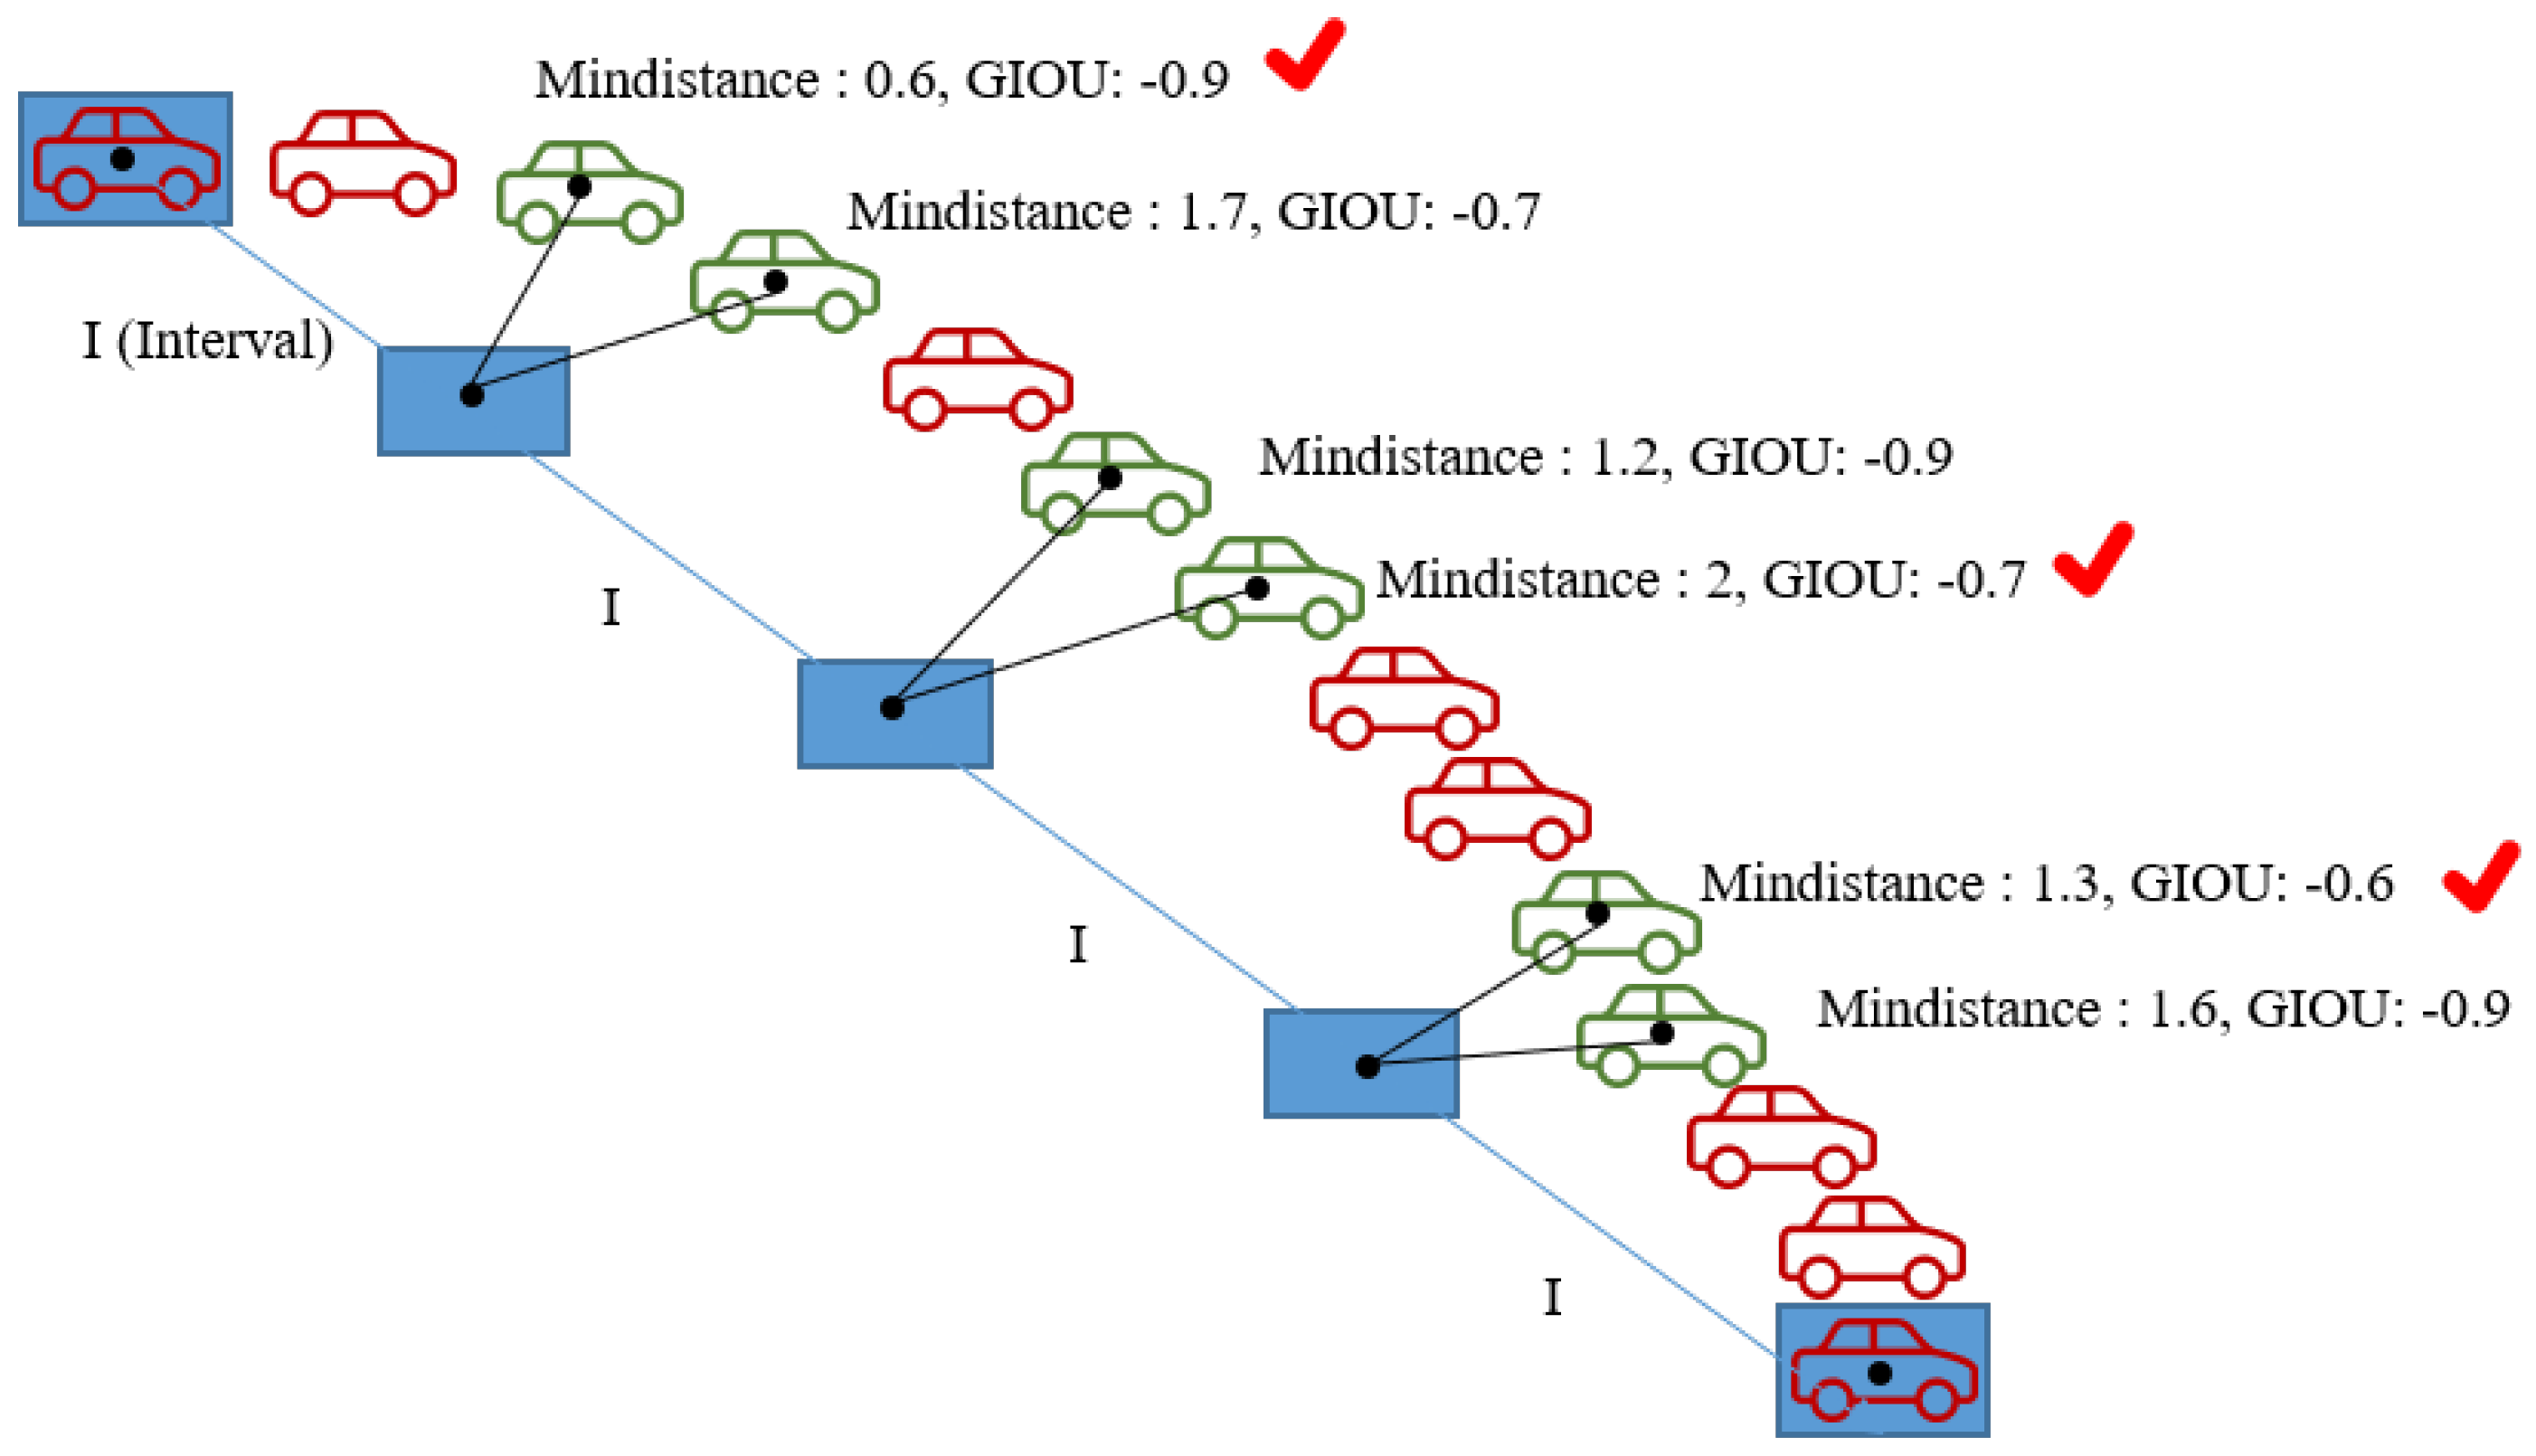
In particular, when displaying an image, a method of sequentially displaying an image from the start frame to the end frame is such that the user can see at a glance that the vehicle is the same vehicle. Using Equation (
1), frame images can be displayed as the number of images desired by the user from the beginning to the end of the vehicle.
For example, if the number of images is designated as
N, the distance between the center value of the rect information at the time when the first vehicle appears and the center value of the final rect information is divided by
N to obtain an
value. For each
I value, the minimum distance
d between the median value of the designated location and the center value of the rect of the actually detected vehicle is calculated. In addition, the GIoU (Generalized Intersection over Union) [
28] value of the two objects is obtained. The reason for using the GIoU value is to find a vehicle with the closest possible distance even though the minimum distance
d is similar. The GIoU value converges to 1 as the distance between two objects gets closer, and converges to −1 as the distance between objects increases. By substituting this value into Equation (
1), the user can select the frame of the vehicle with the smallest distance between two objects, as shown in
Figure 5. In Equation (
1), the value of
is the weight value.
3.2.2. Original Video
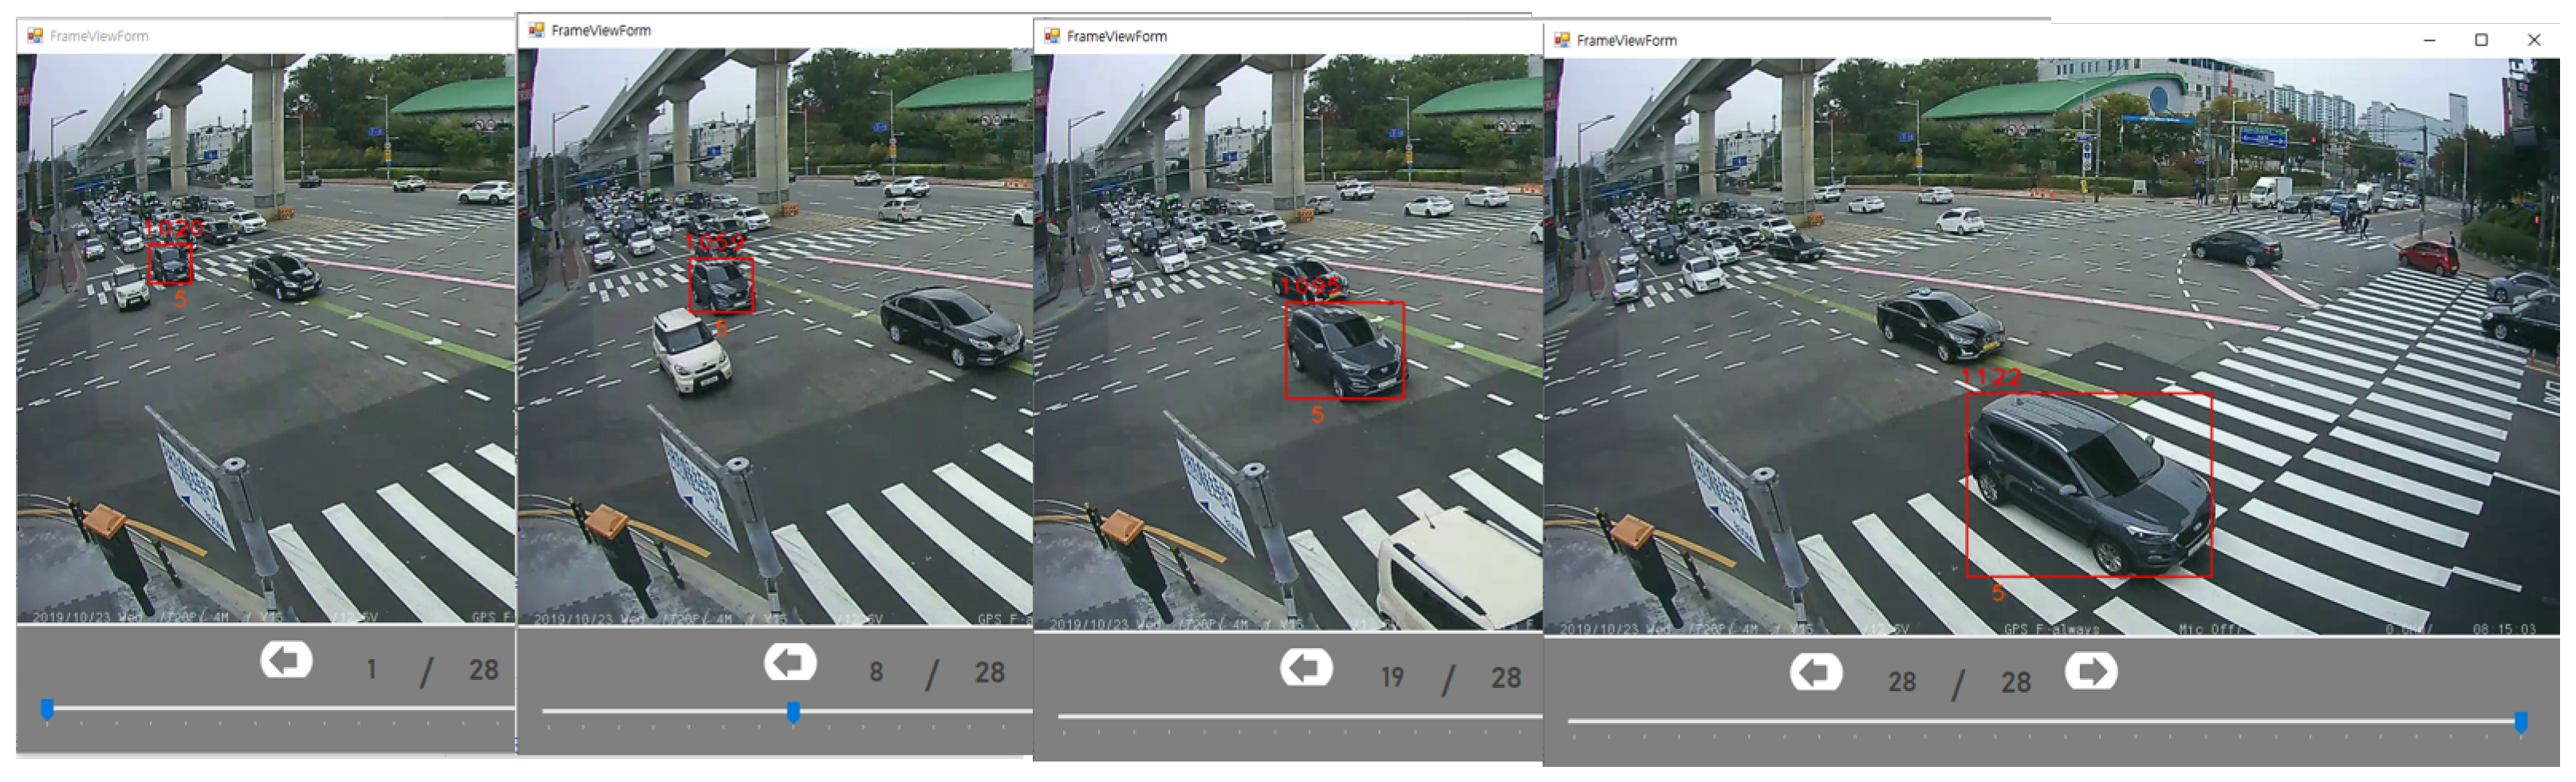
When verifying the road traffic survey data, it is necessary to check the type of vehicle on the full screen. In particular, in the case of Type 4 and Type 5 trucks, there are many vehicles that are difficult to judge even with the naked eye, so it is necessary to actually take a closer look in the original video. In addition, it is necessary to check the original video when verifying which route the vehicle has taken. Therefore, if the original image can be viewed for each vehicle, the user can check the entire frame of the vehicle frame by frame, so that it is possible to accurately determine whether the vehicle has moved in the correct route or what the vehicle type is.
3.2.3. Vehicle Type Count Statistics for Each Route
The final result of the road traffic survey is the total number of vehicle types for each route. Therefore, it is necessary to periodically check the total number of each route and the vehicle type during verification. As shown in
Figure 6, the route table provides the number of each route by vehicle type and shows the total number of vehicle types for each route. Users can check the number of vehicles through the table during verification.
3.3. Verification Part
3.3.1. Error List
In this paper, instead of sequentially verifying vehicles to minimize human intervention, we preferentially provide a list of vehicles with high errors to the user, thereby reducing the verification time as much as possible. Vehicle type classification and route verification algorithms automatically provide the user with a list of errors. The error list is a collection of vehicles identified as FALSE after vehicle classification and route verification. The method for classifying the vehicle type and verifying the vehicle route for this is as follows.
3.3.2. Verification Method of Vehicle Type
In order to extract a candidate with low reliability from the vehicle classification result, it is verified using SVM [
29]. We designed a classifier that recognizes patterns assuming that there will be a specific pattern in the output value of the candidate with low reliability. We chose SVM because we thought a SVM was enough to analyze the reliability pattern. Confidence values for 8 types of classifier were used as data. If it is classified normally, it is determined as true. Otherwise, it is determined as false. The verification system sends the list determined as FALSE to the error list, and the user can first verify the vehicle type classification with this list.
3.3.3. Verification Method of Vehicle Route
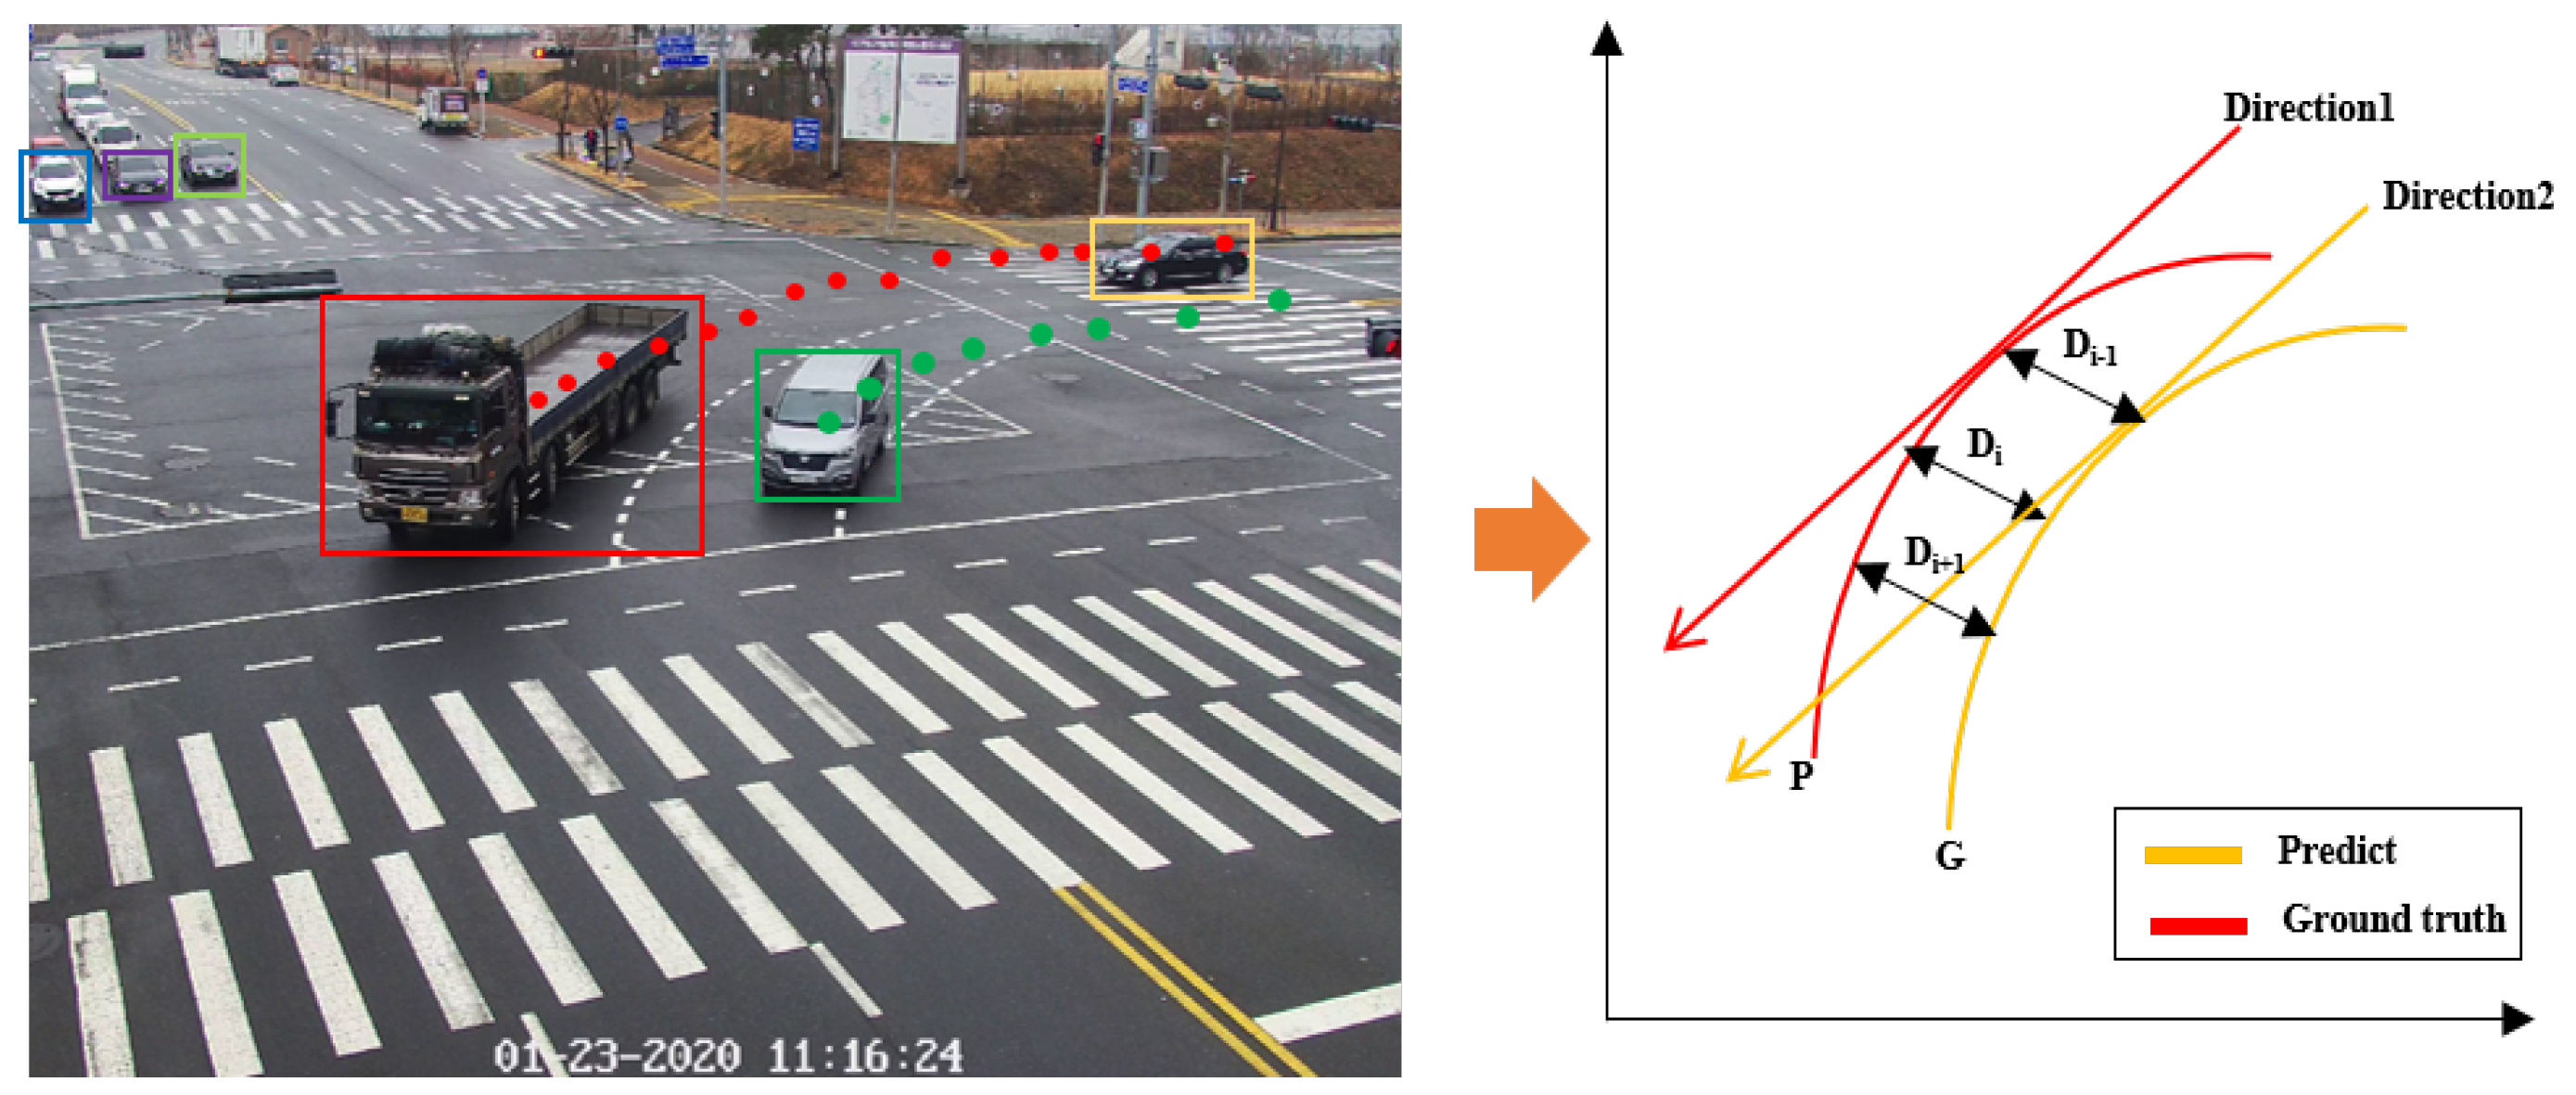
Verification of the vehicle path is verified by comparing the route that came out on the basis of the vehicle tracking result using Re-ID and the initial route determined by the initial system. If the vehicle route is correct, the location and shape of the graph are similar. Otherwise, the distance between the graphs increases and the path at the comparison point is different.
Figure 7 shows an example of comparing the route specified by the user with the actual measured route. Equation (
2) was created using the distance and slope of the graph, and the confidence in the vehicle route was determined based on this result. The distance of the position is the distance value of graph P and graph G, which is calculated using the Euclidean distance [
30]. If E is greater than the threshold value, the route is determined to be false; otherwise, it is determined to be true. The route confidence value using
E is as shown in Equation (
3).
Here, i denotes an individual frame. represents the minimum distance between the position of the vehicle in the i frame and the ground truth path in the corresponding direction. denotes the difference between the moving route of the vehicle in the i frame, and the moving route in the position on the route corresponding to .
The route is calculated using cosine similarity [
31]. If the route is similar, it is closer to 1; otherwise, it is closer to −1.
is used to weight route difference.
3.3.4. Method of Vehicle Error Determination
The error is determined using the vehicle type and the result of the vehicle route verification method. The error is determined using Equation (
4). The value of
is the weight value. The number of error lists is determined according to the value of
, and the number of errors decreases as the value of
increases, and the number of errors increases as the value of
decreases.
3.4. Save Part
The storage unit that creates the traffic volume generation file provides the user’s final review result in the form of a file. In the file, information on the total number of vehicle types for each route required for the traffic volume survey should be provided.
4. Experiment and Demonstration
In order to verify the effectiveness of the proposed method, experiments and demonstrations were conducted based on a demo system developed using images taken from actual traffic volume surveys.
4.1. Empirical Video Data
The empirical data video we used is a video taken by a road traffic survey company to obtain the traffic volume survey results. The road traffic volume survey is generated based on the traffic volume survey results obtained from various points such as general roads and highways. Therefore, we wanted to compare the performance at various points, so we chose the video for a total of 9 points. The 9 points are composed of a 3-way intersection, a 4-way intersection, a highway, a tollgate, a bridge, a ramp, a road, an overpass, and an underpass. The resolution of the video is 1280 × 720 and has a duration of 15 min.
4.2. Demonstration System
As suggested above, the overall system configuration is composed of a data input part, a screen display part, a verification part, and a table of the total number of vehicle types for each route, as shown in
Figure 8.
When users input video and traffic volume survey results into the system, they can see a screen divided by vehicle type and a table showing the number of vehicles by route, as shown in
Figure 8 and
Figure 9. Users can easily check whether the vehicle is classified well by the vehicle type on this screen.
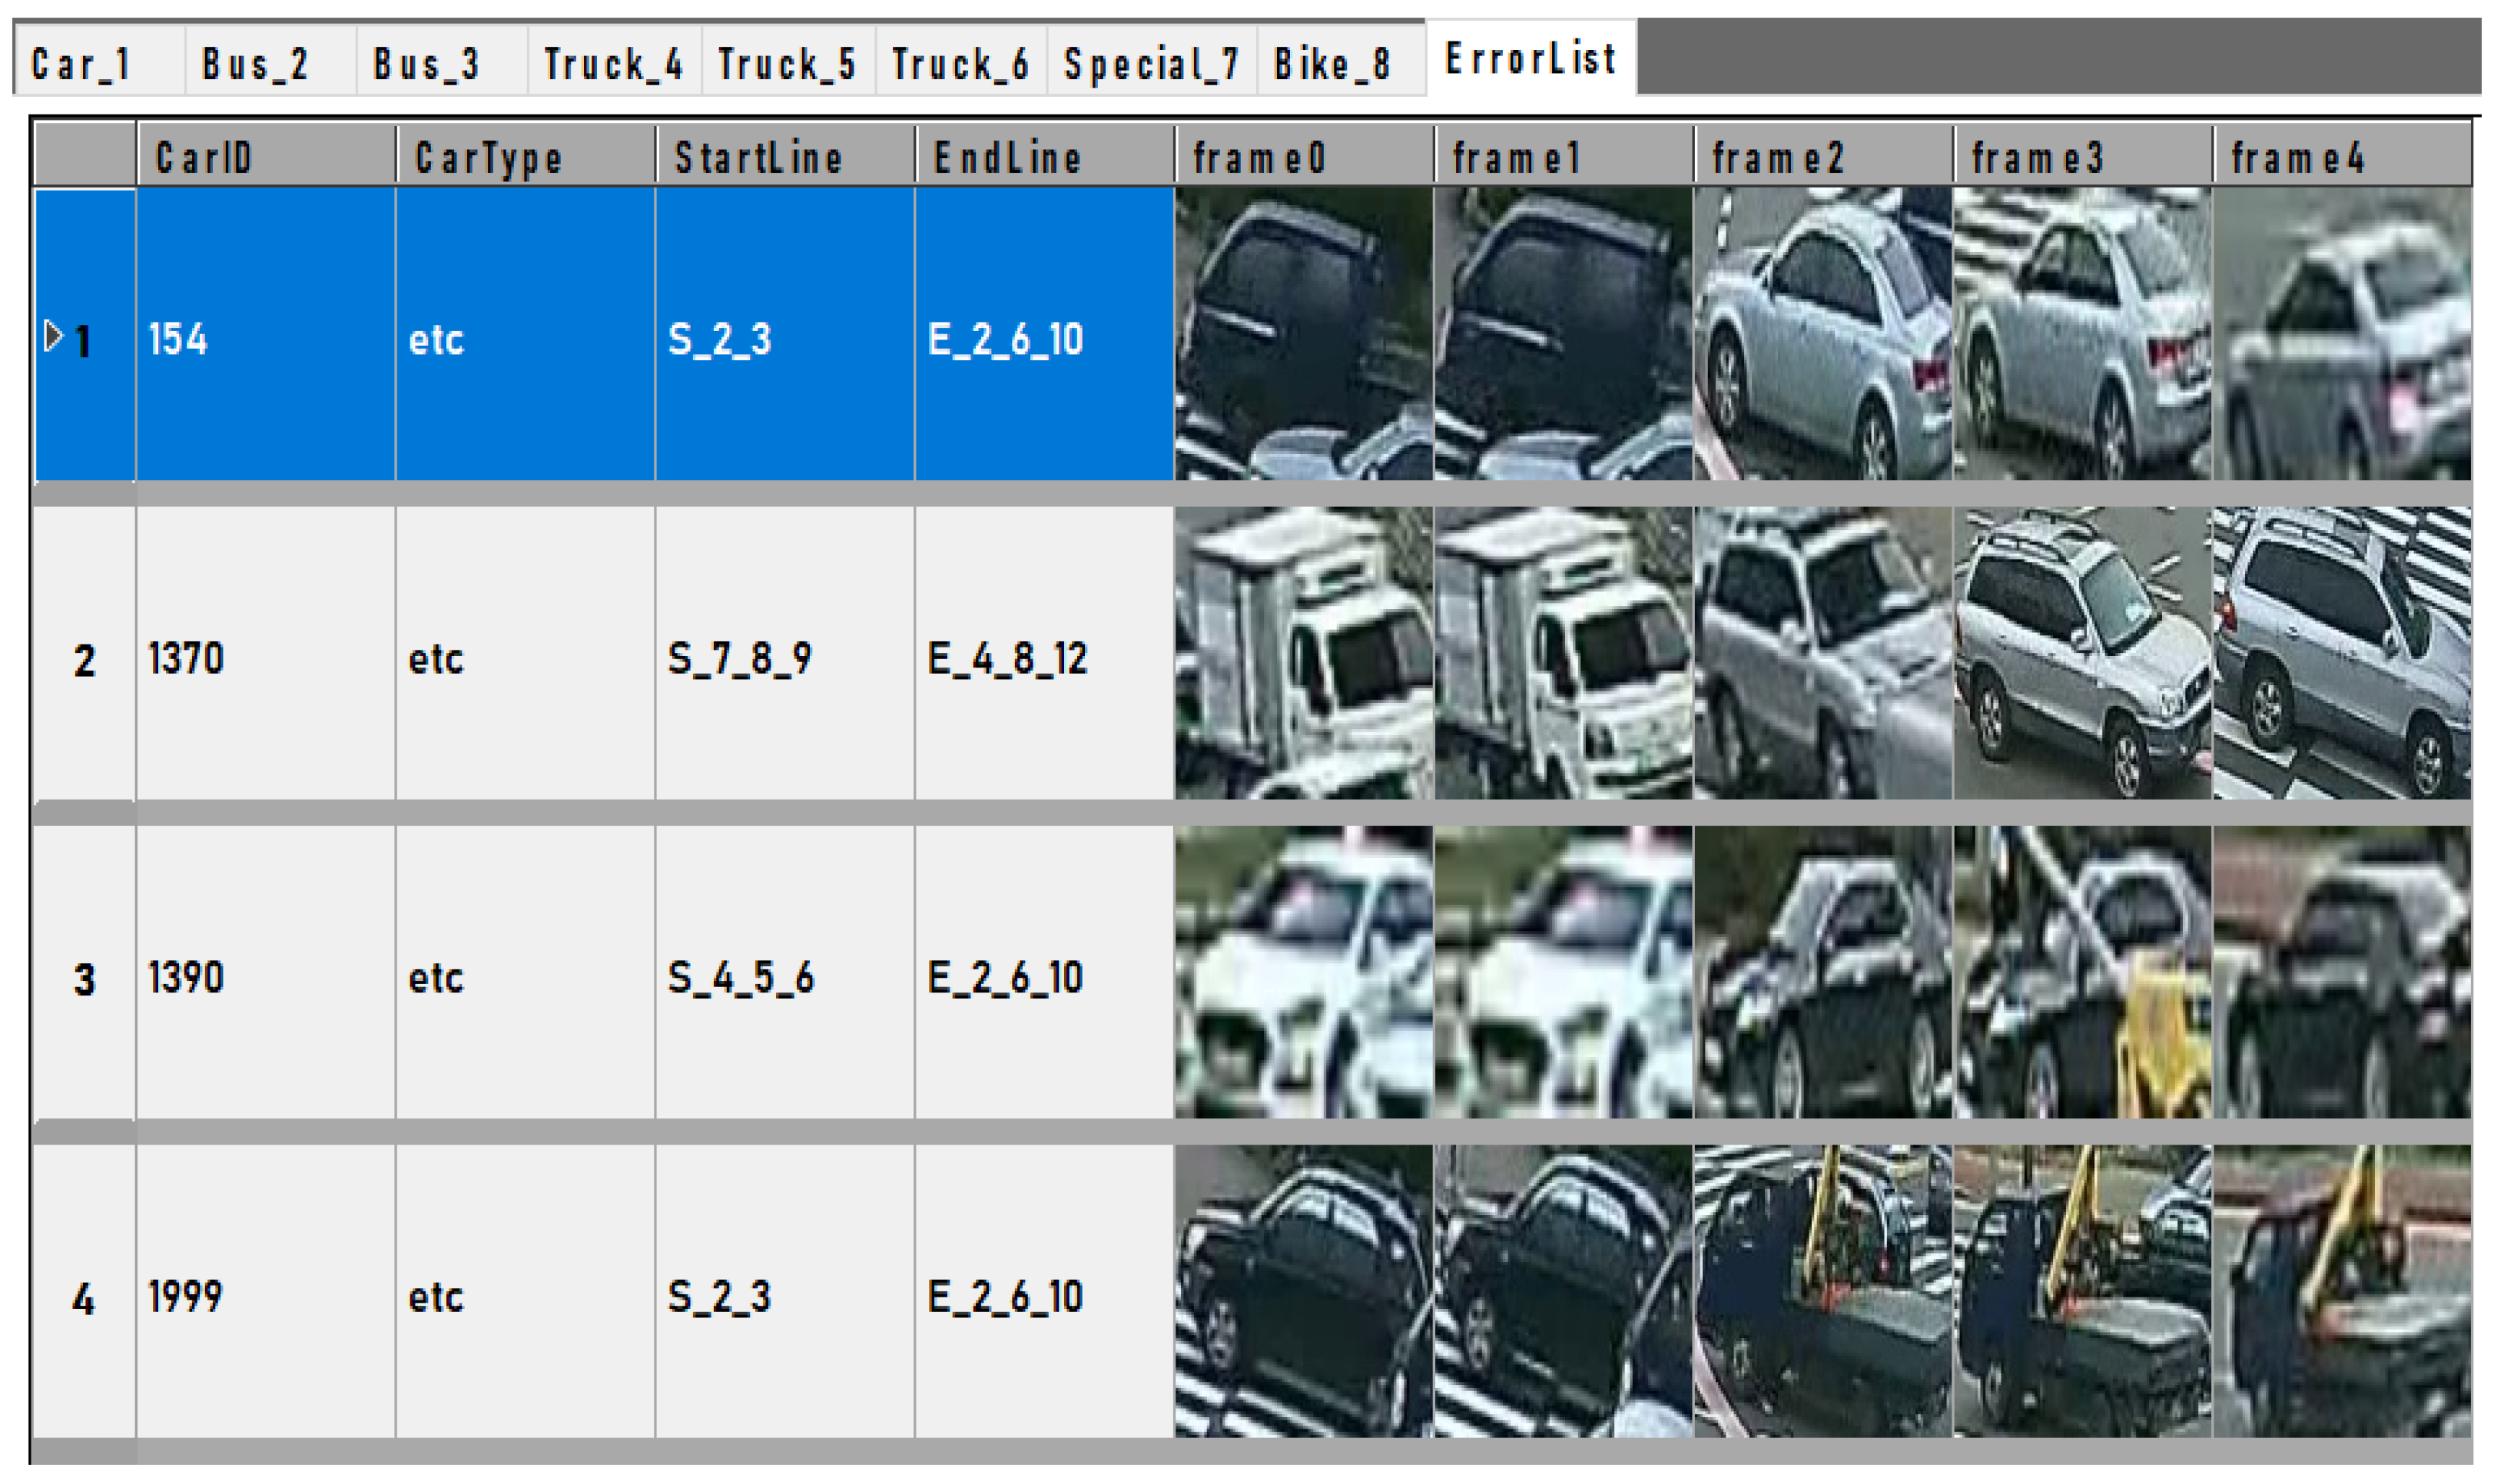
Figure 10 is a screen showing the list of errors extracted from the verification algorithm. Users can save verification time by first checking the list provided by the error list.
Figure 11 is a screen showing the original image of the vehicle. Users can know exactly the vehicle’s route and vehicle type on this screen. This screen provides all frames from the point where the vehicle first appears to the point where the vehicle disappears.
4.3. Verification Algorithm
4.3.1. Verification of Vehicle Type
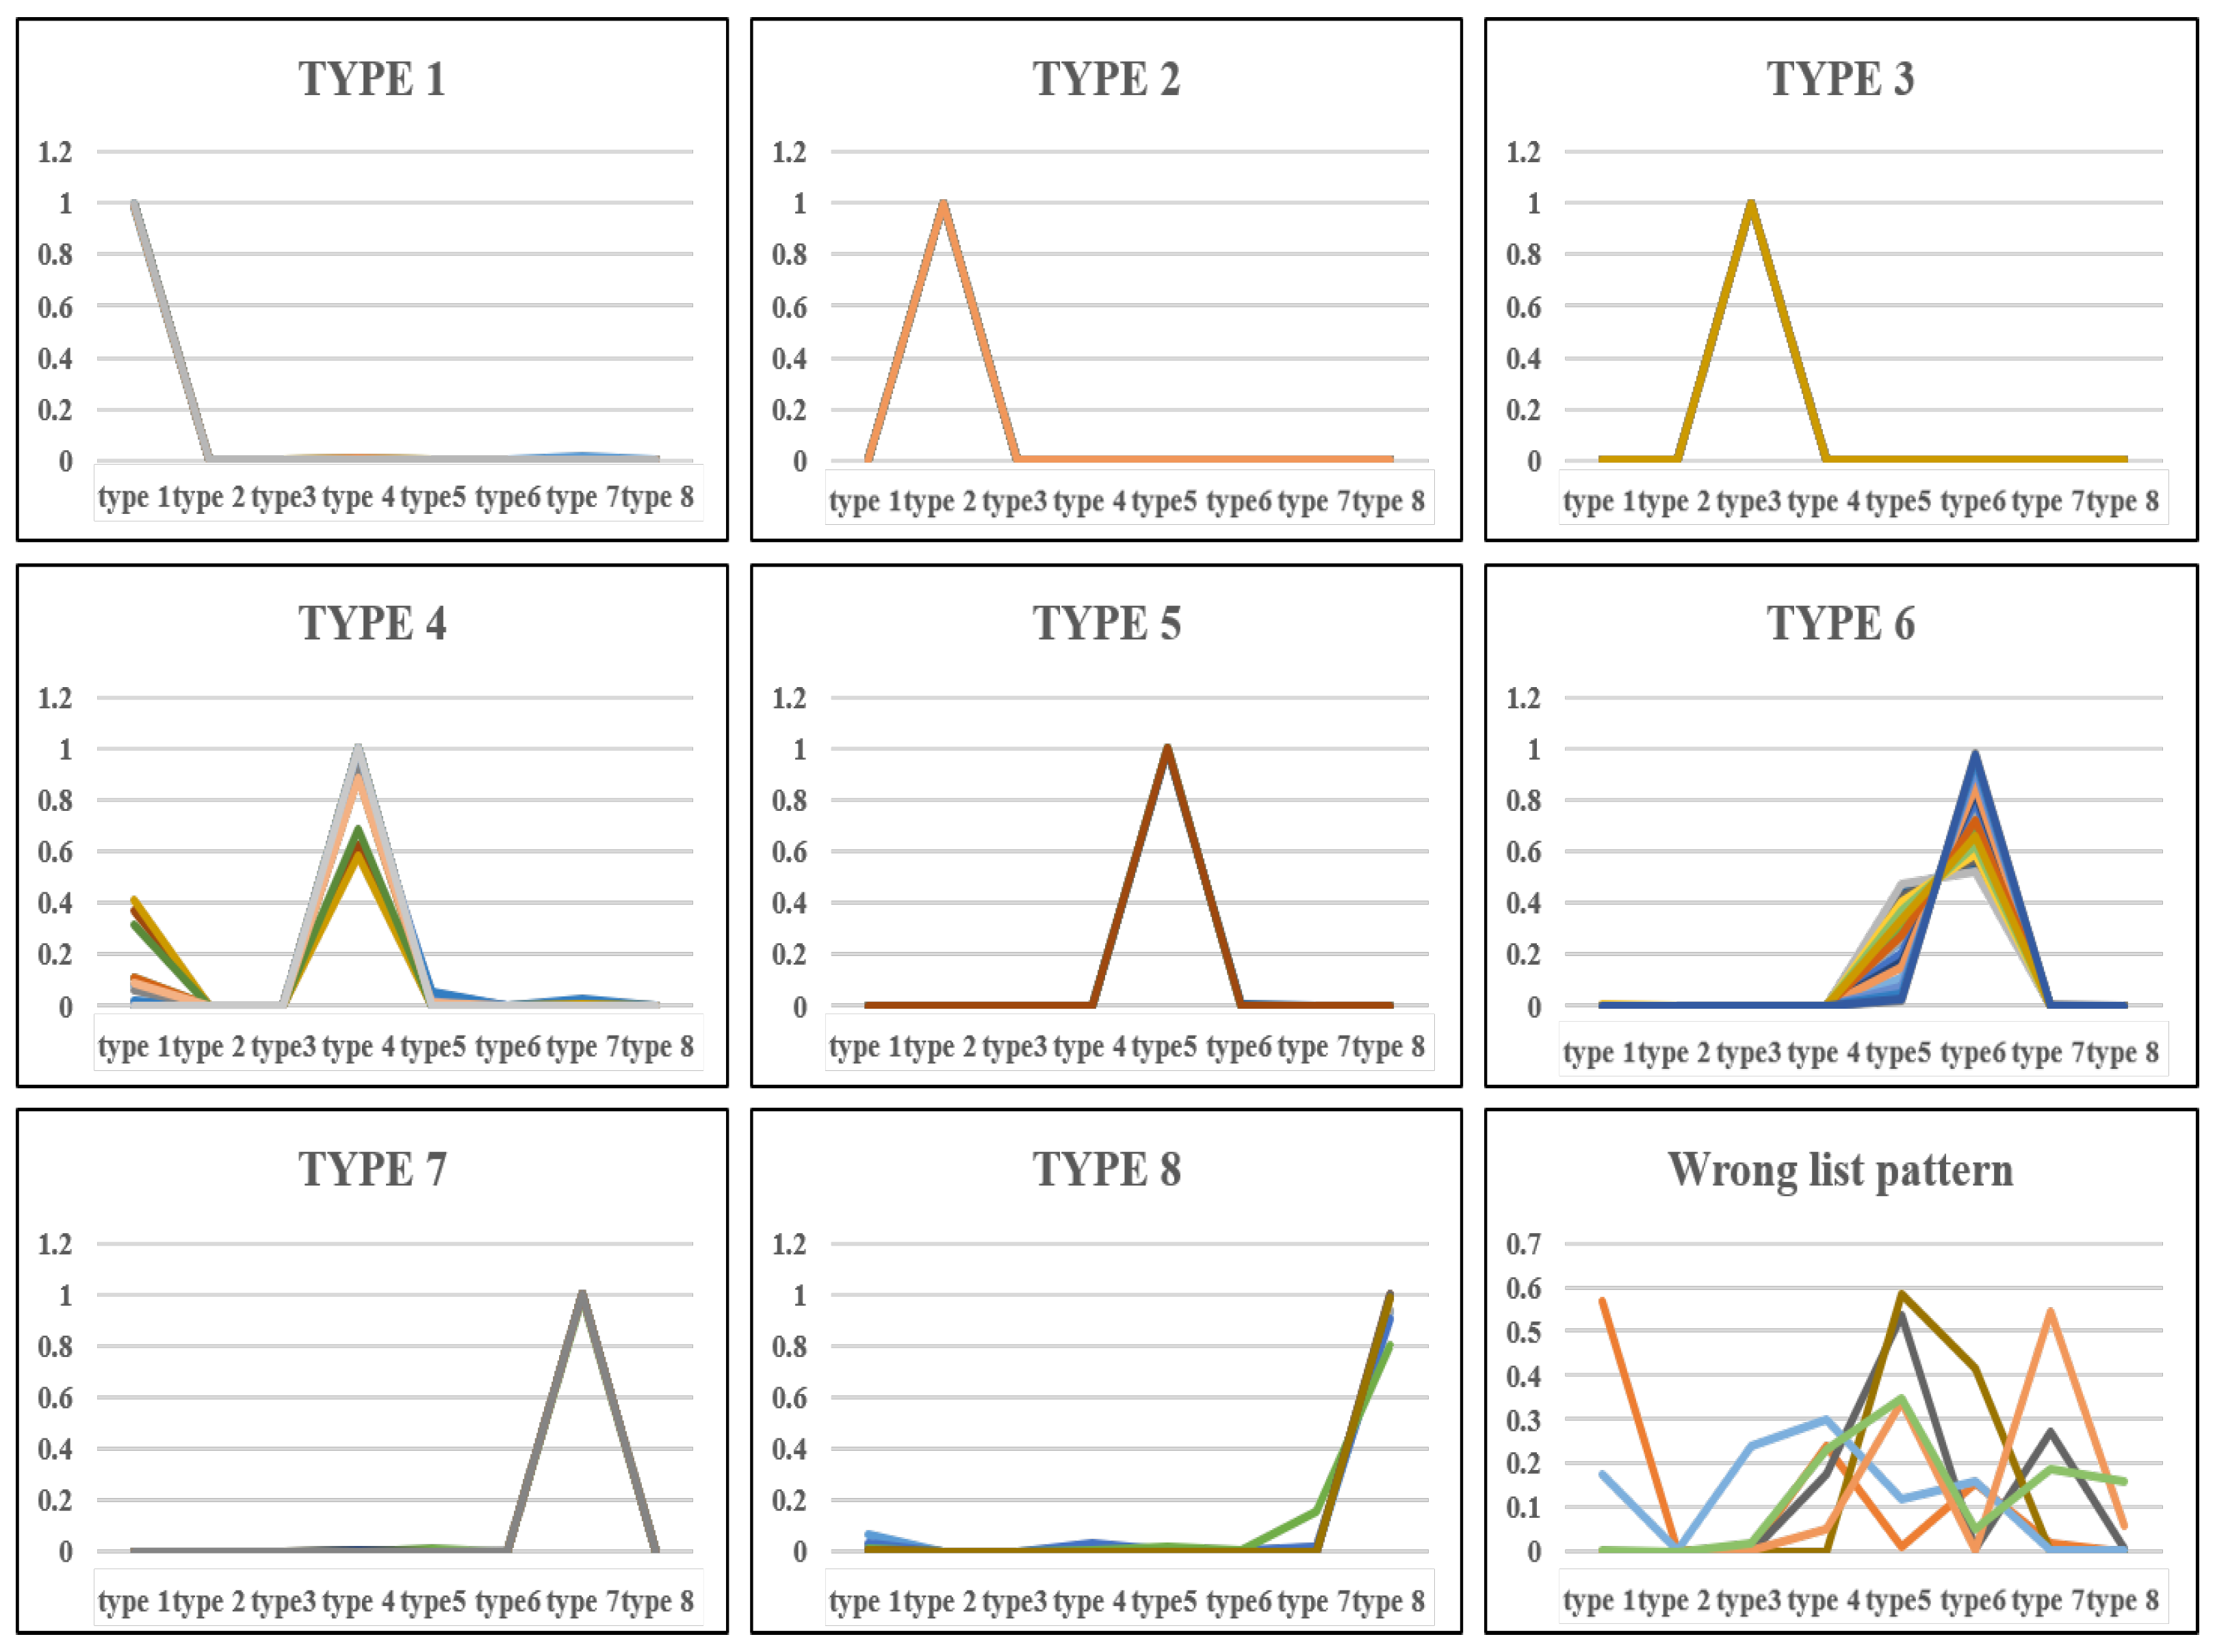
As shown in
Figure 12, the confidence patterns of each class are all different. If the class is well categorized, only the pattern value for one class is high. If there is an error, the confidence values for each class are all similar, and the pattern is not consistent. Based on this rationale, we designed a classifier that recognizes confidence patterns using SVM. The proposed vehicle classification verification technique shows 93% performance, as shown in
Table 1.
4.3.2. Verification of Vehicle Route
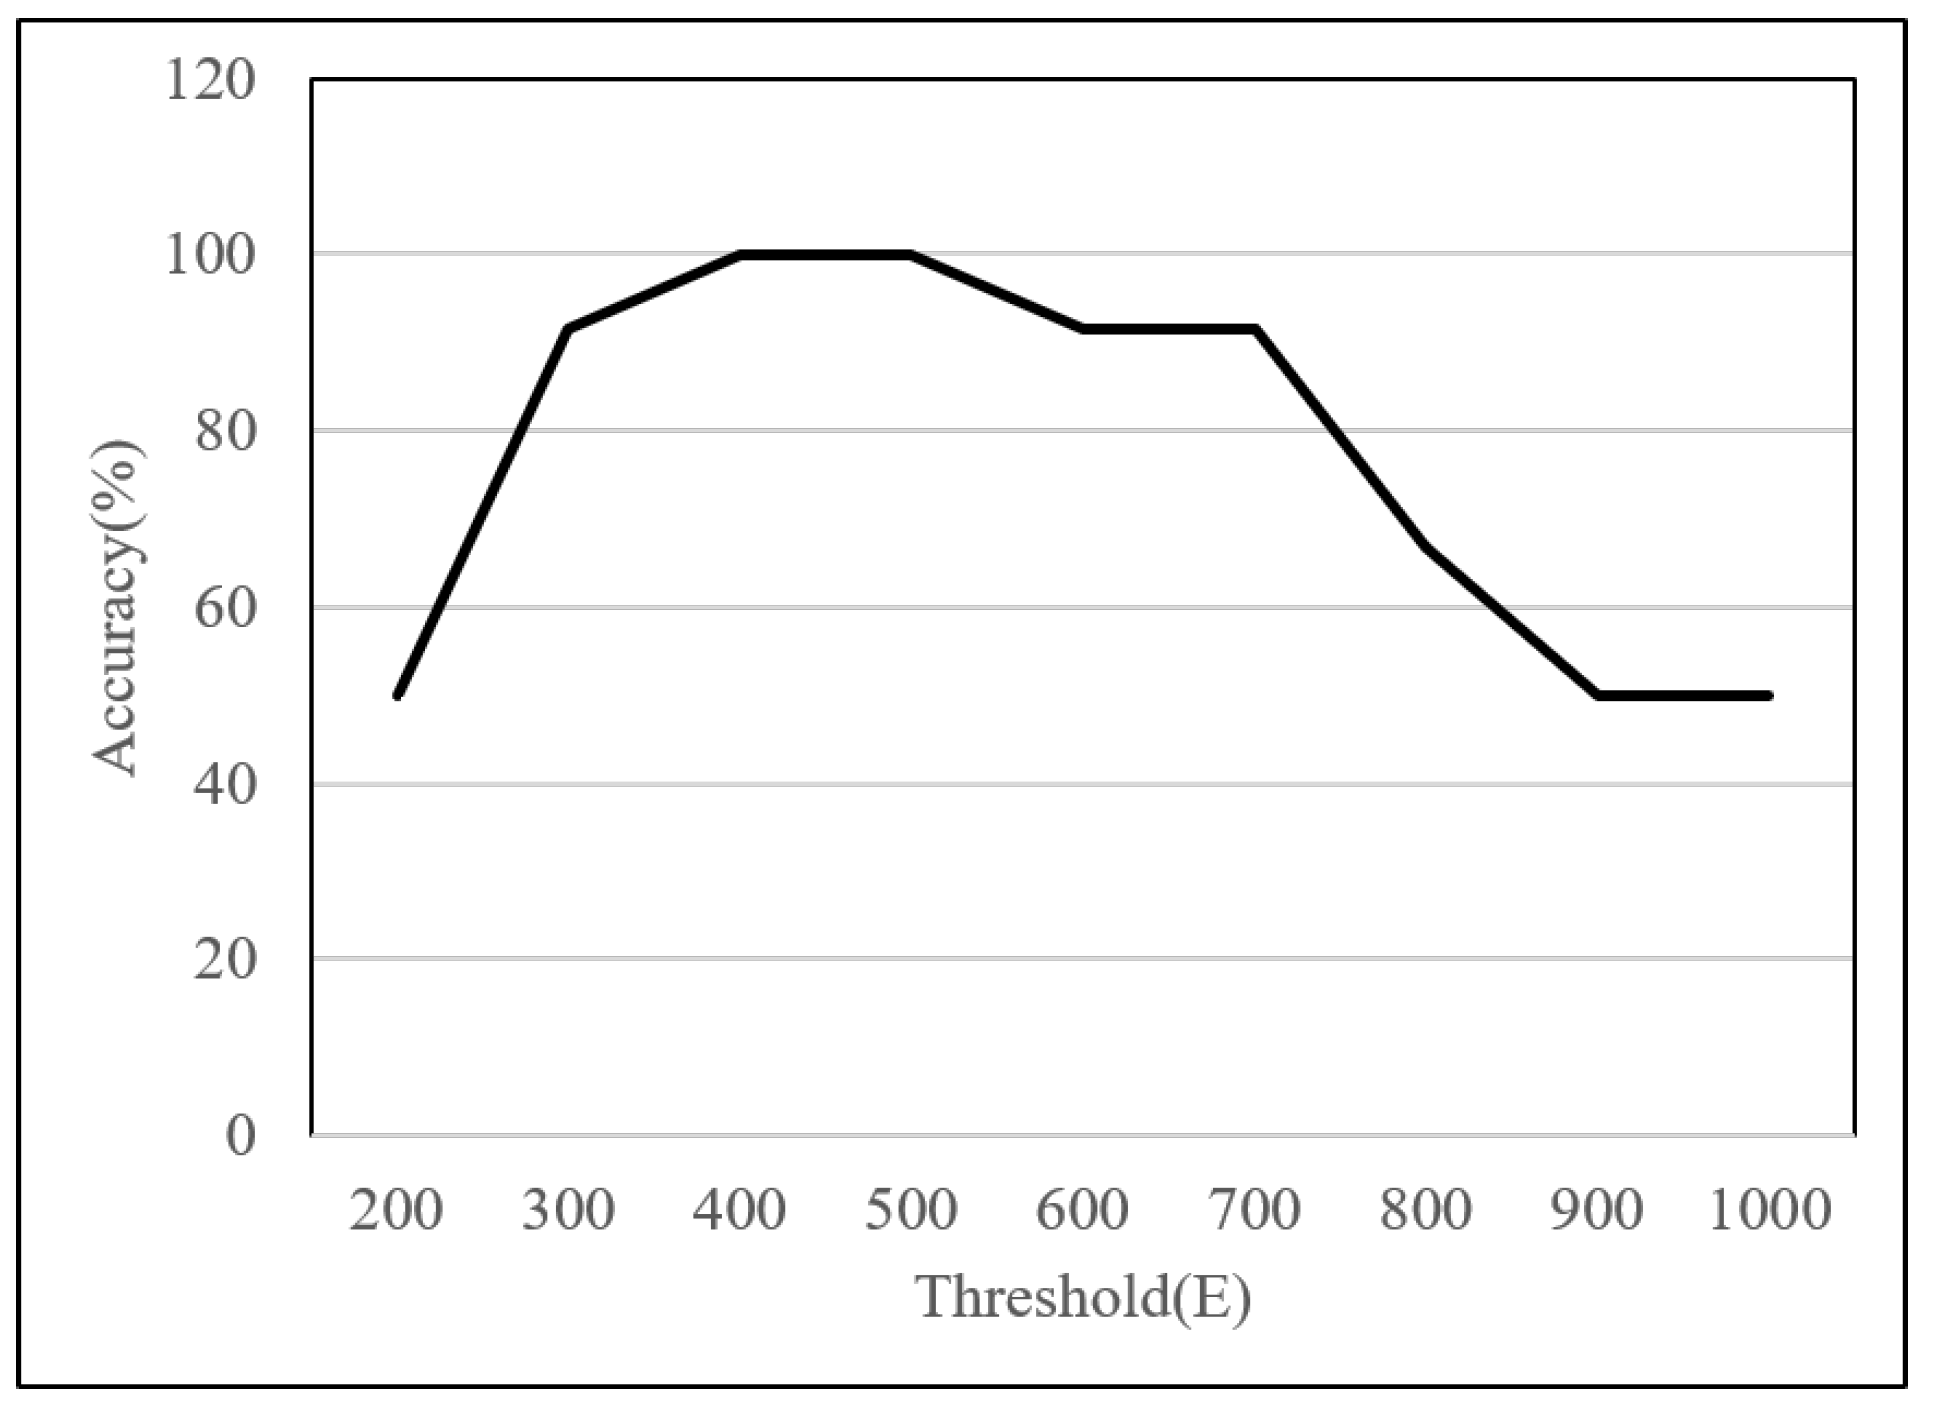
When verifying the vehicle route, the displacement uses the distance of the initially set route and the center point of the vehicle. As shown in
Figure 13, as a result of measuring the performance according to the threshold value with the weight value (
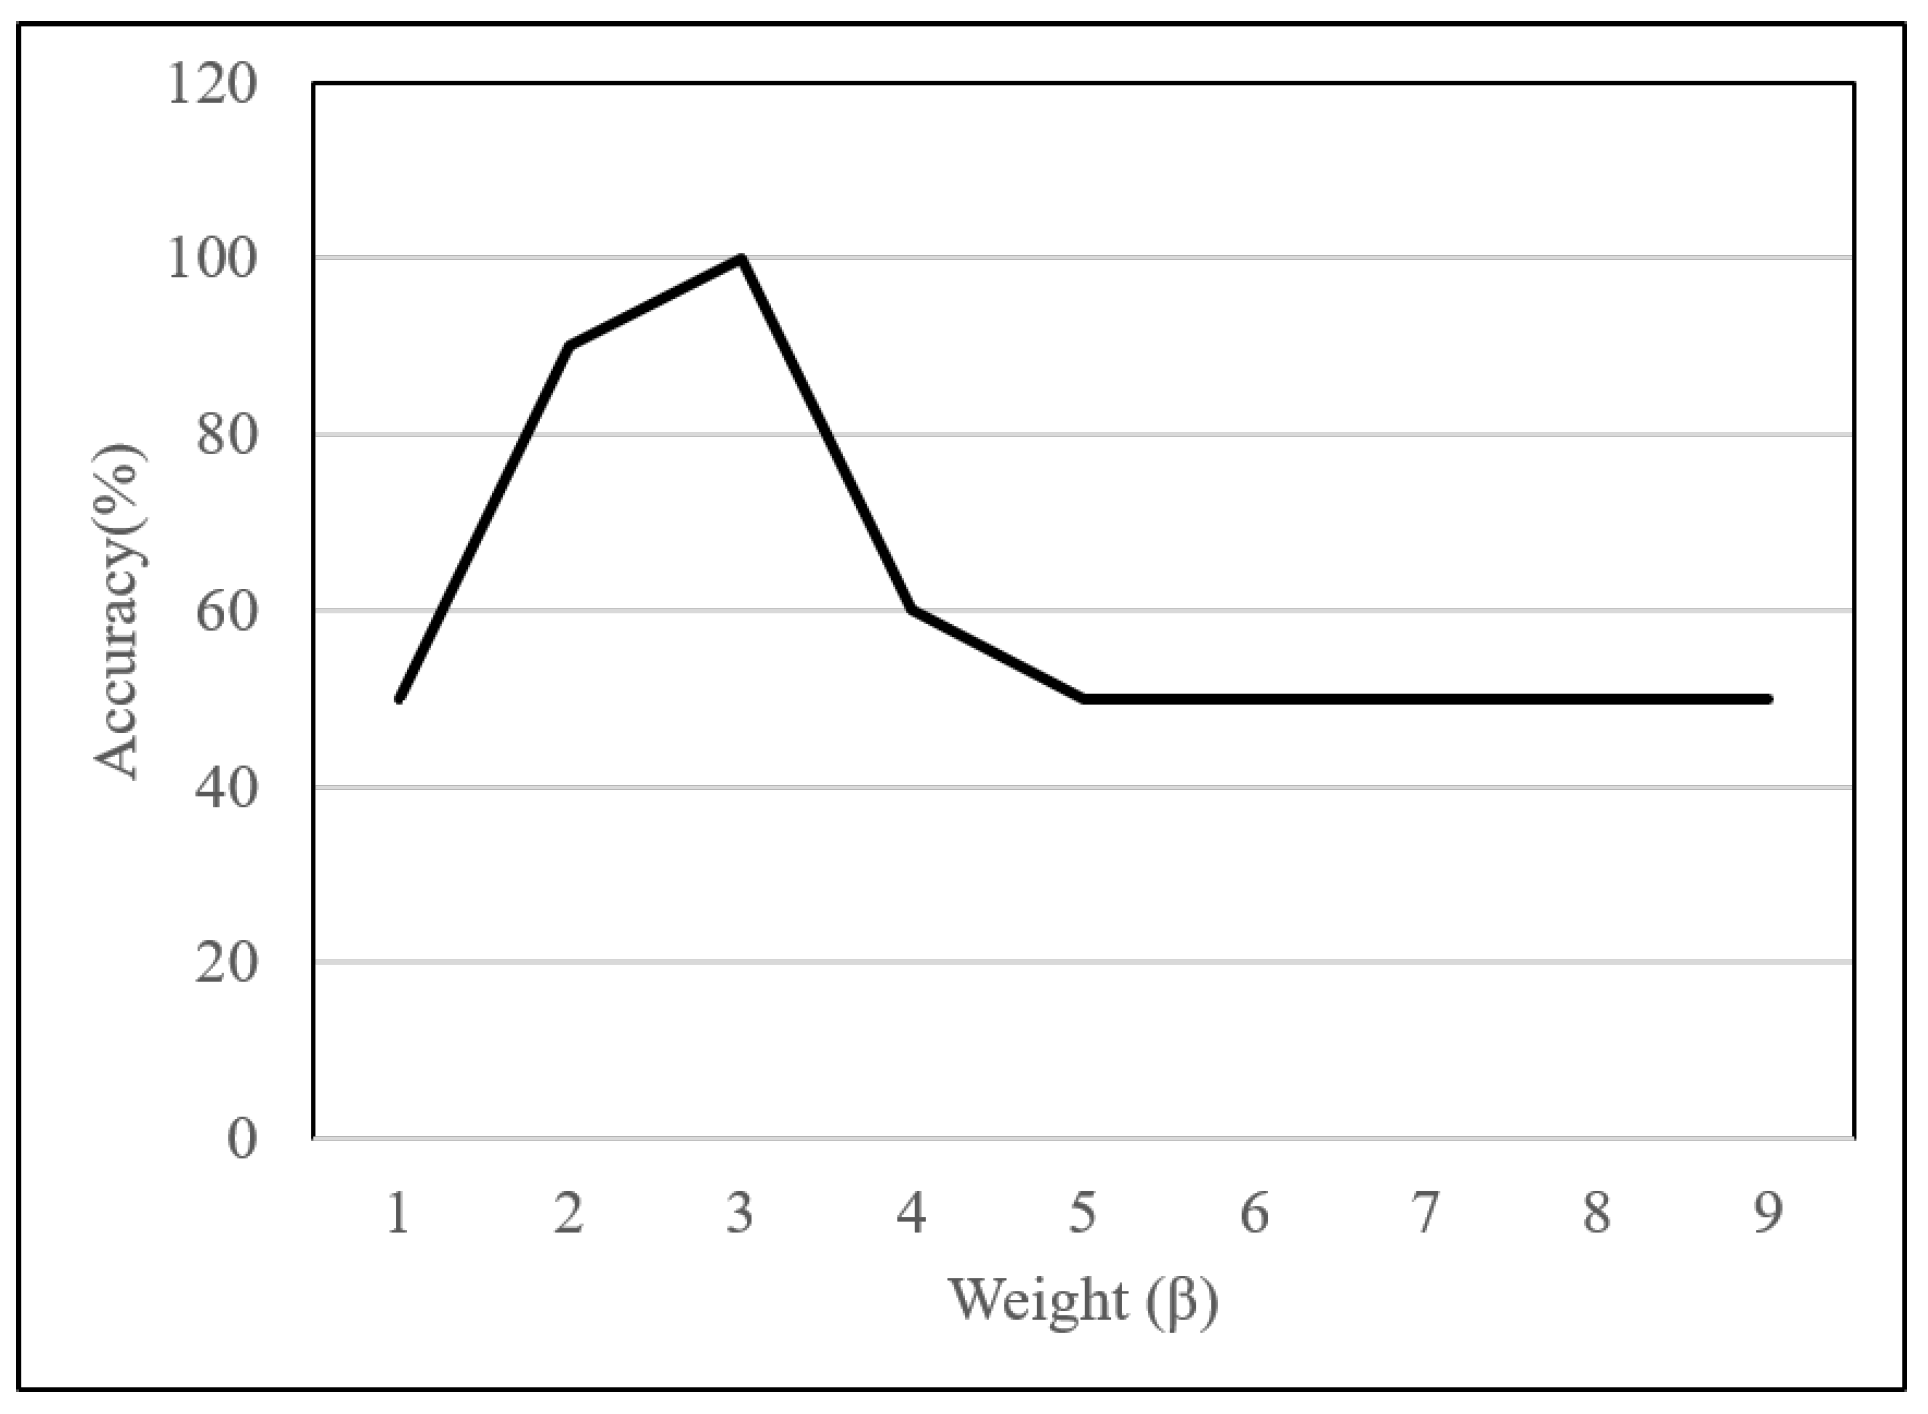
) set to 1, the highest performance was obtained when the threshold value was between 400 and 700. When the weight value is 1, most cases can be verified with the threshold value, but in the case where the distance of the initial vehicle is similar and the route is different from the end, the weight was required. This is especially the case when going straight and turning right. As shown in
Figure 14, when the threshold value is 500, the performance is highest when the weight is 3, and the performance decreases as the weight value increases.
4.4. Empirical Results
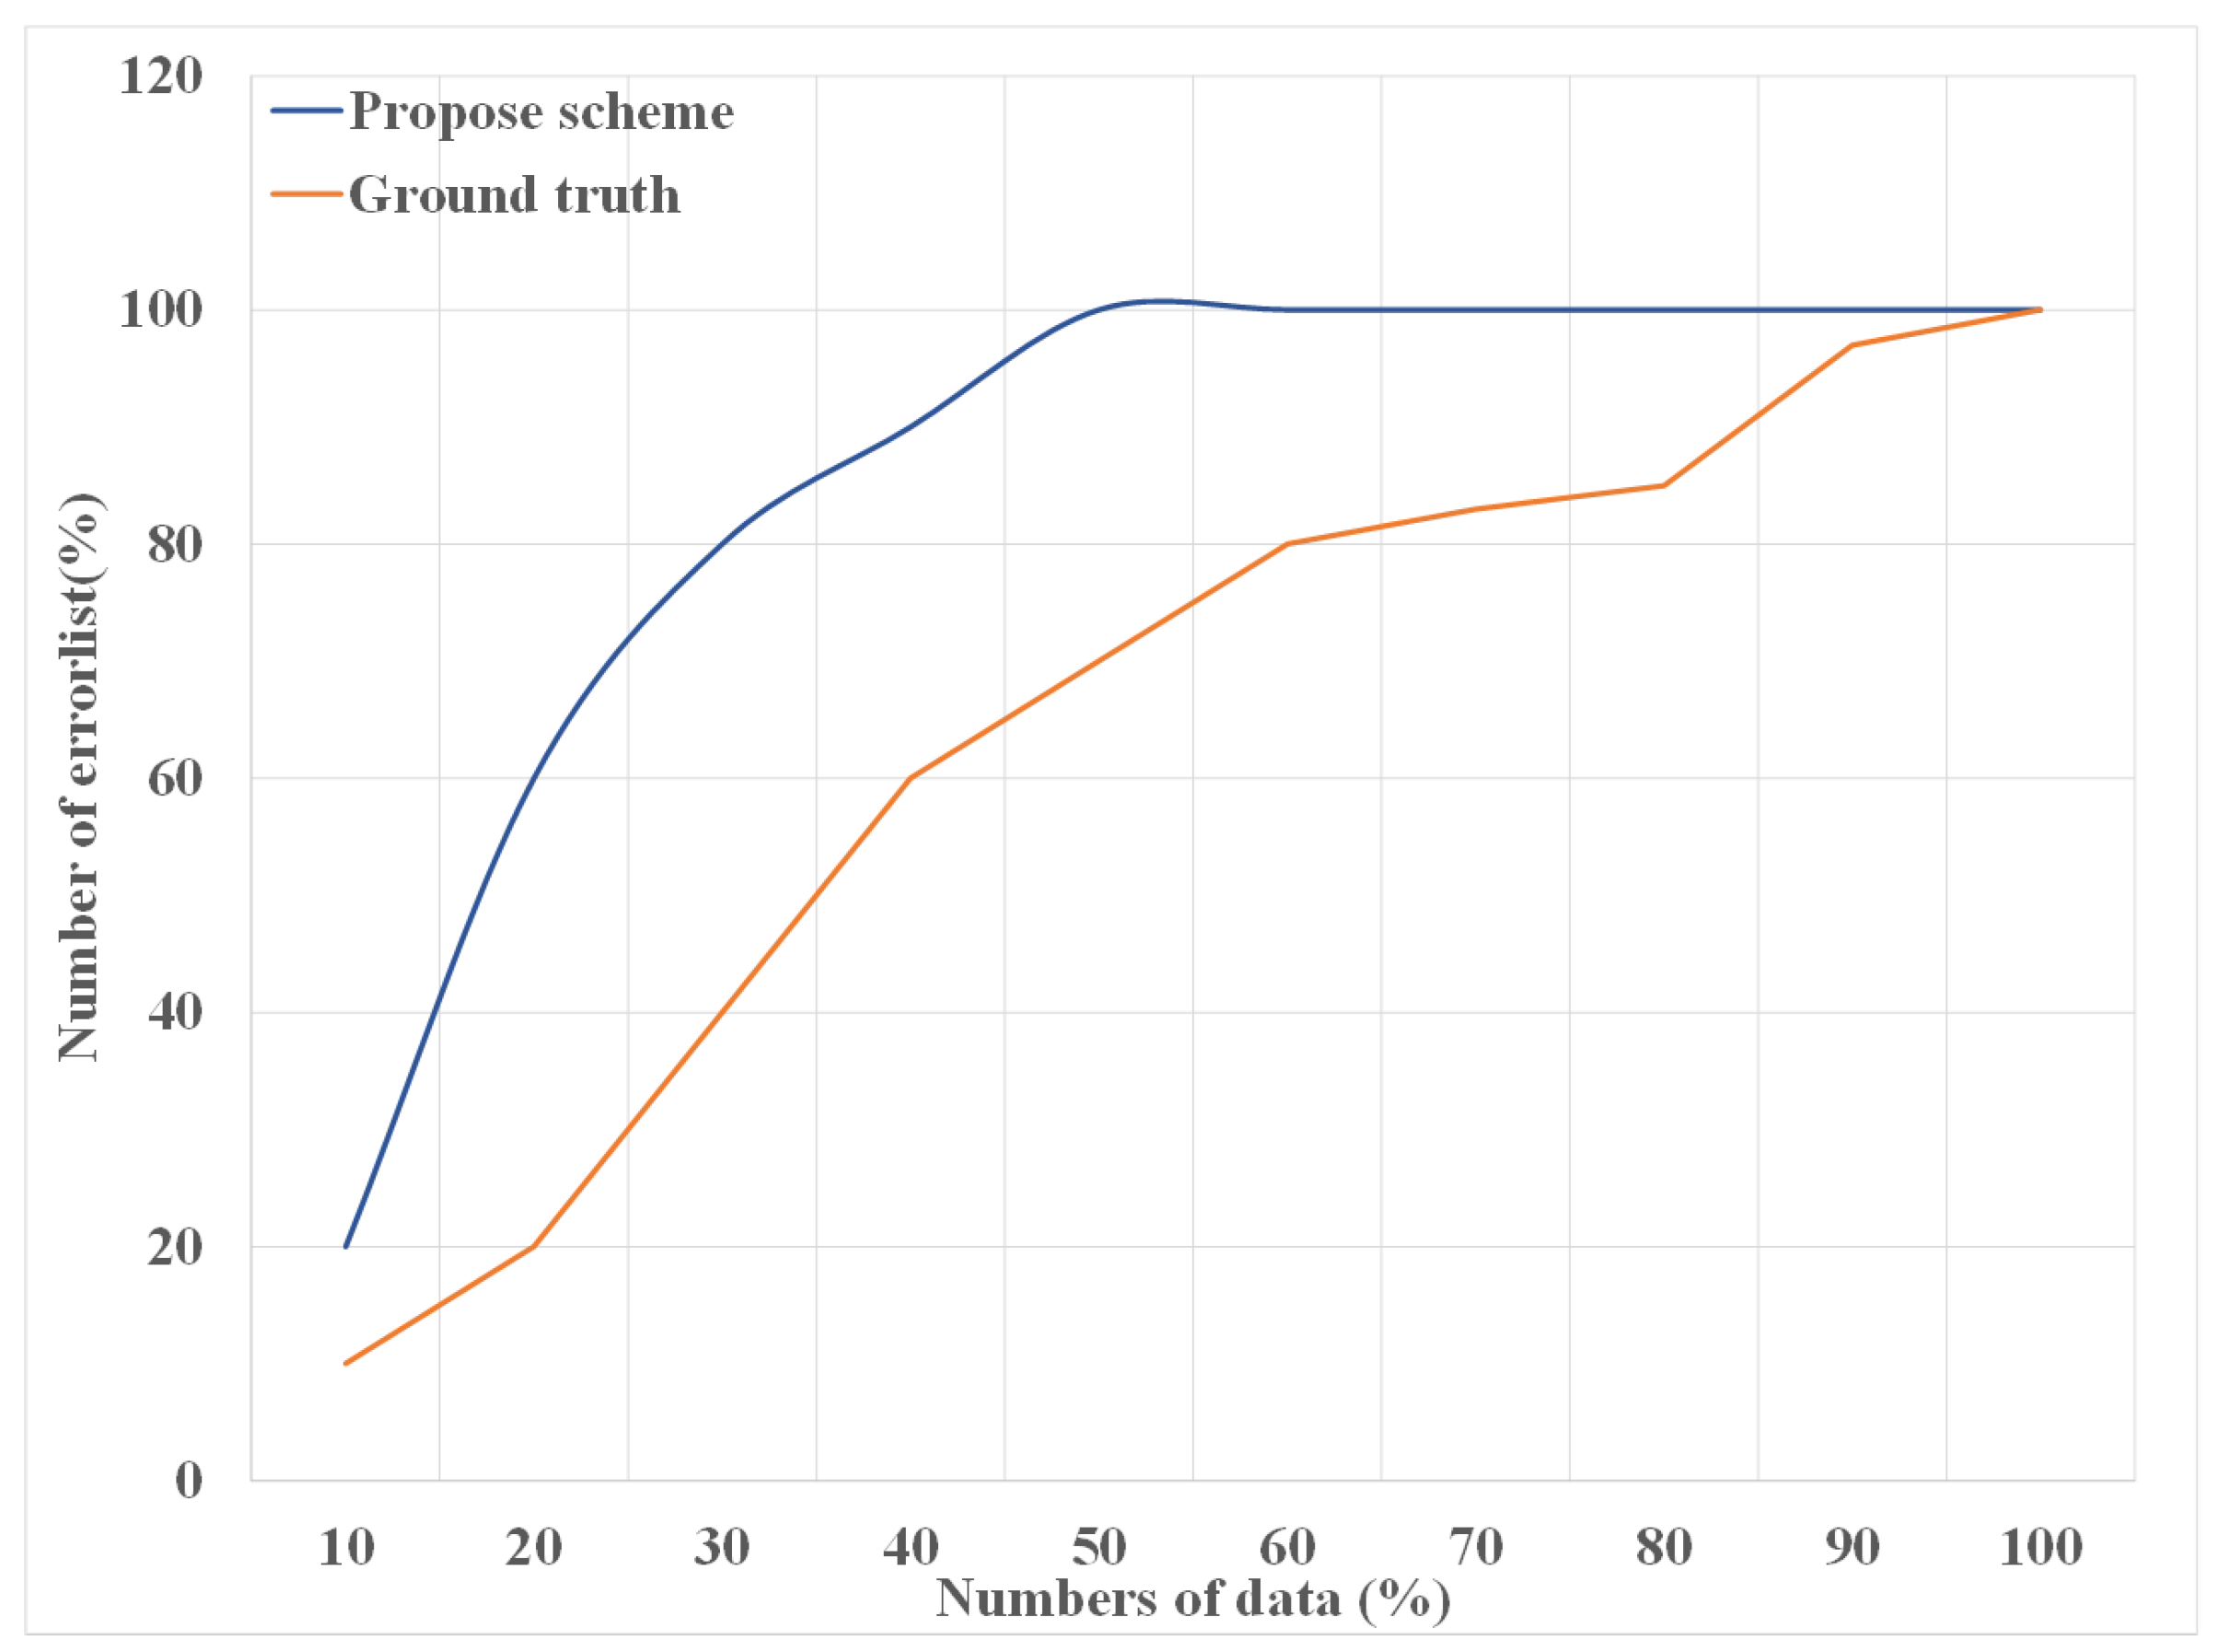
Our proposed method can shorten the time from two perspectives. One is that the time can be further reduced by using the user interface compared to the time of visual inspection. For the rest, if the error list function is used, a result with a completeness of 90% or more can be created without checking the entire data, so time can be saved. We used a road traffic survey specialist to prove the performance of our proposed method. Road specialists extracted the results from the same point using the existing method and the proposed method.
When the error list according to the value of
was determined using Equation (
4), it was compared with the number of errors of an actual expert. The threshold value in Equation (
2) was set to 500, and the number of errors according to the
was measured for all images. As shown in
Figure 15, it can be seen that more than 90% of the total errors can be detected when verifying 30–40% of the total data with the proposed method.
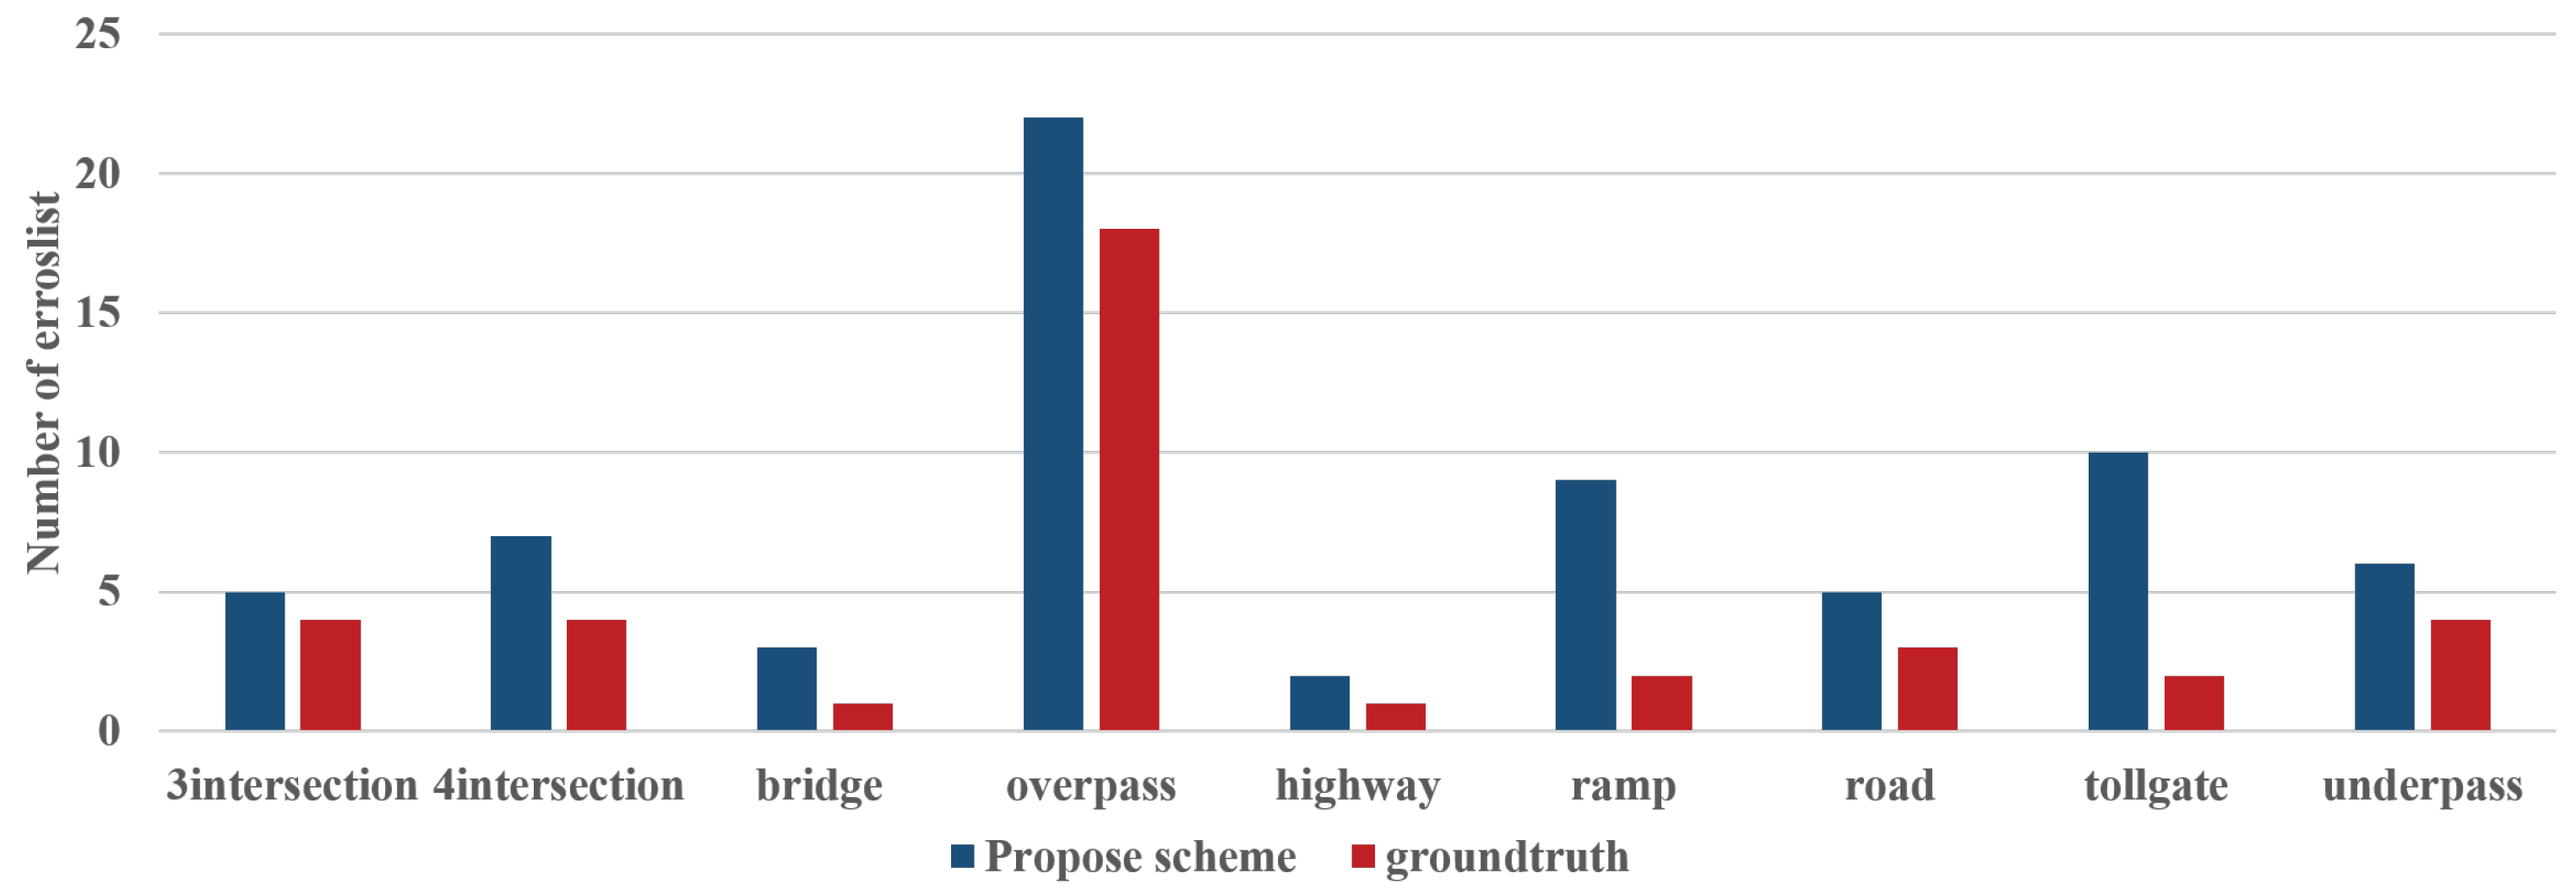
In addition, as shown in
Figure 16, as a result of measuring the error list based on
at each point, it was confirmed that there was no problem in detecting the actual number of errors.
We measured the time with the same video to see how much time the proposed method could save. When a person measured the vehicle type and the number of vehicles using the previous method, it took about 20–30 min per person based on a 15-min video. The total review time took a total of 40–60 min. When the proposed method was used, it took about 10–15 min from vehicle classification and route results to review, so it was found that more than a quarter of the time was saved.
Table 2 compares the result data of the previous method and our proposed method at the same point. In particular, in the case of 4, 5, and 6 vehicle classifications, it can be seen that the proposed method shows better performance than the result of using the previous method. Through this, it was found that the proposed method can save time and exhibit better performance than the previous method.
5. Conclusions
In this paper, we propose a method for generating highly reliable traffic volume survey data while minimizing human intervention in the road traffic volume survey process. The proposed method presents an efficient system for minimizing the load that occurs in the process of verification by human. The proposed method provides the total number of vehicle types for each route using the results extracted from the automated method. In addition, it provides a list with high error probability to the user with an algorithm that can verify vehicle type and route, thereby reducing processing time. When the proposed method was compared with the existing method, it was found that the proposed method not only saves time but also provides better performance. The proposed method can complement the disadvantages of the automatic traffic volume survey method, and can facilitate the user’s verification work. As a result, the proposed method improves the reliability of the traffic volume survey results due to more accurate results while reducing the research procedure and cost.
In spite of various advantages, in order to use the proposed method, there is a disadvantage in that the operator has to perform some initial setting tasks compared to the existing task of simply observing and counting videos. In addition, there are some possibilities of tracking errors due to overlapping vehicles and path errors due to narrow viewing angles. For this reason, there is a limitation that a video recording must be made over a wider range at a higher altitude than before. In the future, we plan to conduct research on how to improve the convenience of initialization work and solve the problem of performance degradation due to the video viewing angle.


