Article

Simulation and Characteristics Analysis of On-Shore OWC System Proposal as Distributed Generation Resource Considering the Irregular Wave Interaction

by
Josué Aarón López-Leyva
*,
Carolina Barrera-Silva
,
Luisa Fernanda Sarmiento-Leyva
and
María Fernanda González-Romero
Innovation and Design Center, Renewable Energy Engineering Program, CETyS Universidad, 22860 Ensenada, Mexico
*
Author to whom correspondence should be addressed.
Electronics 2021, 10(7), 773; https://doi.org/10.3390/electronics10070773
Submission received: 21 February 2021 / Revised: 18 March 2021 / Accepted: 22 March 2021 / Published: 25 March 2021
(This article belongs to the Special Issue Active Regional Energy Systems and Microgrids)

Abstract

:
This article presents the simulation and characterization of an on-shore oscillating water column (OWC) system as part of a distributed generation network considering the irregular interaction of sea waves. The main issue is the adequate calculation of the power generated considering the real variations of the sea waves, employing the stochastic analysis of the wave height and period. The characterization of the wave height was carried out using the Fisher-Tippett Type 1 function, and for the wave period, an empirical probability density function to obtain the instantaneous and accumulated power in an annual period. A basic on-shore OWC system was proposed with different physical dimensions. The theoretical and numerical results present a very similar performance for both turbines (600 W and 25 kW) analyzed. Regarding the 600 W turbine, the resulting accuracy is ≈94.5%, which implies that the annual generated power is 3.13 ± 1.02 MWh/year and the overall efficiency is 23.51% ± 1.9%. However, due to the reduced power generated, the chamber dimensions were modified, achieving 160.61 ± 9.99 MWh/year with an accuracy of ≈93.2%, based on an installed power capacity proposal using a 25 kW turbine. Also, the average overall efficiency for both turbines considering the irregular wave interaction is ≈23.5% and ≈21.1% for 600 W and 25 kW turbines, respectively.

1. Introduction

Nowadays, there are still many technological, social, and political issues that do not allow achieving the maximum energy generation in a particular region, considering both conventional and renewable sources, based on the natural and autochthone potential energy [1]. Thus, in various locations, the energy demand is greater than energy generation, which causes the necessity of importing energy at greater costs and the optimization management of the supply of energy, causing scheduled power outages to the electricity grid in certain regions to optimize consumption. The aforementioned factors also strongly impact the security energy of these regions [2]. In this way, a potential solution is the use of an active energy grid (AEG) based on distributed generation resources that considers a wide energy matrix, i.e., considering the largest number of energy sources, both conventional and renewable, which is the principal idea of energy democracy. As part of the mentioned wide energy matrix, it is crucial that each region design and implement integrated energy systems and microgrids clusters based on their potential energy, whether using renewable energy such as solar, wind, geothermal, or biomass, among others [3].
In particular, sea energy is a relevant option for certain locations around the world. In fact, there are many alternatives to obtain energy considering the sea, e.g., marine current power, osmotic power, ocean thermal energy, tidal power, and wave power, among other novel technical options. Regarding the wave power option, it aims to extract the energy of the waves for its use in the localities. The energy extraction is carried out utilizing various energy conversion methods, for example, the conversion of mechanical energy into electrical energy applied in point absorber buoys, surface attenuators, oscillating water columns (OWC), and overtopping devices, among others. Furthermore, the potential of ocean energy is quite higher than the global 16,000 TWh/year electricity demand, and medium- to long-term predictions of global wave energy resources are promising [4,5].
About the oscillating water column (OWC), it is a system proposed for extracting power from ocean waves based on collector chambers, which take power from the waves and transfer it to the air within the chambers. Next, a power take-off system is used to convert the pneumatic power into electricity. Thus, the chamber is the essential element in any OWC system, because it is where the pressure of the water column is variable depending on the natural oscillatory movement of the sea waves. Also, OWC systems have many variants in their design and implementation, for example, they can use multiple chambers and turbines connected in different ways, which allows the improvement of conversion efficiency [6,7]. Currently, there are three options for OWC systems, and they are related to where these systems are implemented, i.e., on-shore OWC (installed directly on the coast), off-shore OWC (installed more than 500 m from the coast), and near-shore OWC (installed less than 500 m from the coast). Firstly, an on-shore OWC system is usually built of solid material (e.g., concrete) resistant to the marine environment and is placed in shallow water on the coast [8,9]. In the case of the off-shore OWC system, it is a variant that works basically with the same principle as the on-shore OWC system, but instead of having a concrete structure, a greatly maneuverable structure is used. Also, due to the place where it is installed (i.e., off-shore), there are some different requirements in comparison with the on-shore OWC system, for example, buoyancy requirement, resistance to extreme salinity, and particular environmental conditions that could damage or render the power generation system inoperable. Besides, there are several widely used designs such as OWC Russell Rectifier, OWC mechanical with pumping system, OWC buoys, OWC pendulum, OWC Frog, OWC Raft, and U-duct, among others [10,11].
As for the possible scenarios that can cause damage to the structure of OWC systems or inaccuracies in the estimation of power generation, it is the irregular interaction of waves in on-shore OWC systems [12,13]. In particular, sea waves that are very well-defined in their temporal and spatial characteristics are regularly considered for the initial design of OWC systems, and these waves are called monochromatic waves. However, the real dynamics of the waves are not monochromatic, but rather present dynamic variations in the spatial and temporal characteristics, and these waves are called polychromatic waves [14,15]. Also, the polychromatic waves cause an irregular wave interaction with the OWC systems based on the wave spectra defined by significant wave height, peak frequency, and peak enhancement factor [16,17]. The performance of the OWC systems depends to a great extent on the resonance condition between the waves and the designed structure, so the consideration that waves are monochromatic considers a scenario to maximize the performance of energy generation, but due to the existence of polychromatic waves, this performance is affected [18,19]. Taking the above into account, the causes and effects of the irregular wave interaction with OWC systems have been treated in various ways, for example, considering that the nature of the irregularity of the waves is not modifiable, multiple characterizations and models for irregular waves have been proposed, based on Stoke parameters, Pierson-Moskowits spectrum, and JONSWAP spectrum, among others [20,21,22]. Also, designs and structures have been proposed for OWC systems to improve efficiency even with irregular waves, which is achieved through the tunable chamber and internal air pressure control employing various chambers geometries, as well as other potential solutions [23,24,25,26,27]. However, there are still many issues that must be solved to obtain the enhanced real power generation for particular locations around the world. The principal reason is that the majority of proposals based on the OWC concept that considers irregular interaction waves perform certain generalized and difficult considerations, which means that these considerations cannot be directly applied in wherever location [28,29].
In this paper, the power generation model of an on-shore OWC system considering real irregular wave interactions based on the probability density function of periods and height waves is analyzed. This proposal contemplates a distributed generation resource connected to the active electrical network of the state of Baja California in Mexico. Our work considers the potential sea energy of the state of Baja California, because it has 1380 km of coastline, corresponding to 740 km on the Pacific Ocean coast and 640 km on the Gulf of California coast. This means that the state of Baja California is the second place in Mexico regarding the length of coastline, the first place being the state of Baja California Sur with 2230 km of coastline. Also, the on-shore OWC system proposal is highly suitable because the Baja California state presents a power deficit of 550 MW [30]. In general, this paper considers the on-shore OWC proposal location in Ensenada City, Baja California, Mexico. In particular, the wave data were obtained in the breakwater (with a length of ≈1500 m), at ≈60 m from the natural coastline (see Figure 1). Considering the sea-bed conditions in the location mentioned, the wave data collected can be considered as near-shore. Also, with the support of other public and private institutions, we used a pressure sensor installed in a customized metallic structure on the sea-bed, at a water depth of ≈9.5 m (maximum operating depth is 10 m, and measurement range pressure from 50 kPa up to 100 kPa).

2. Mathematical Model

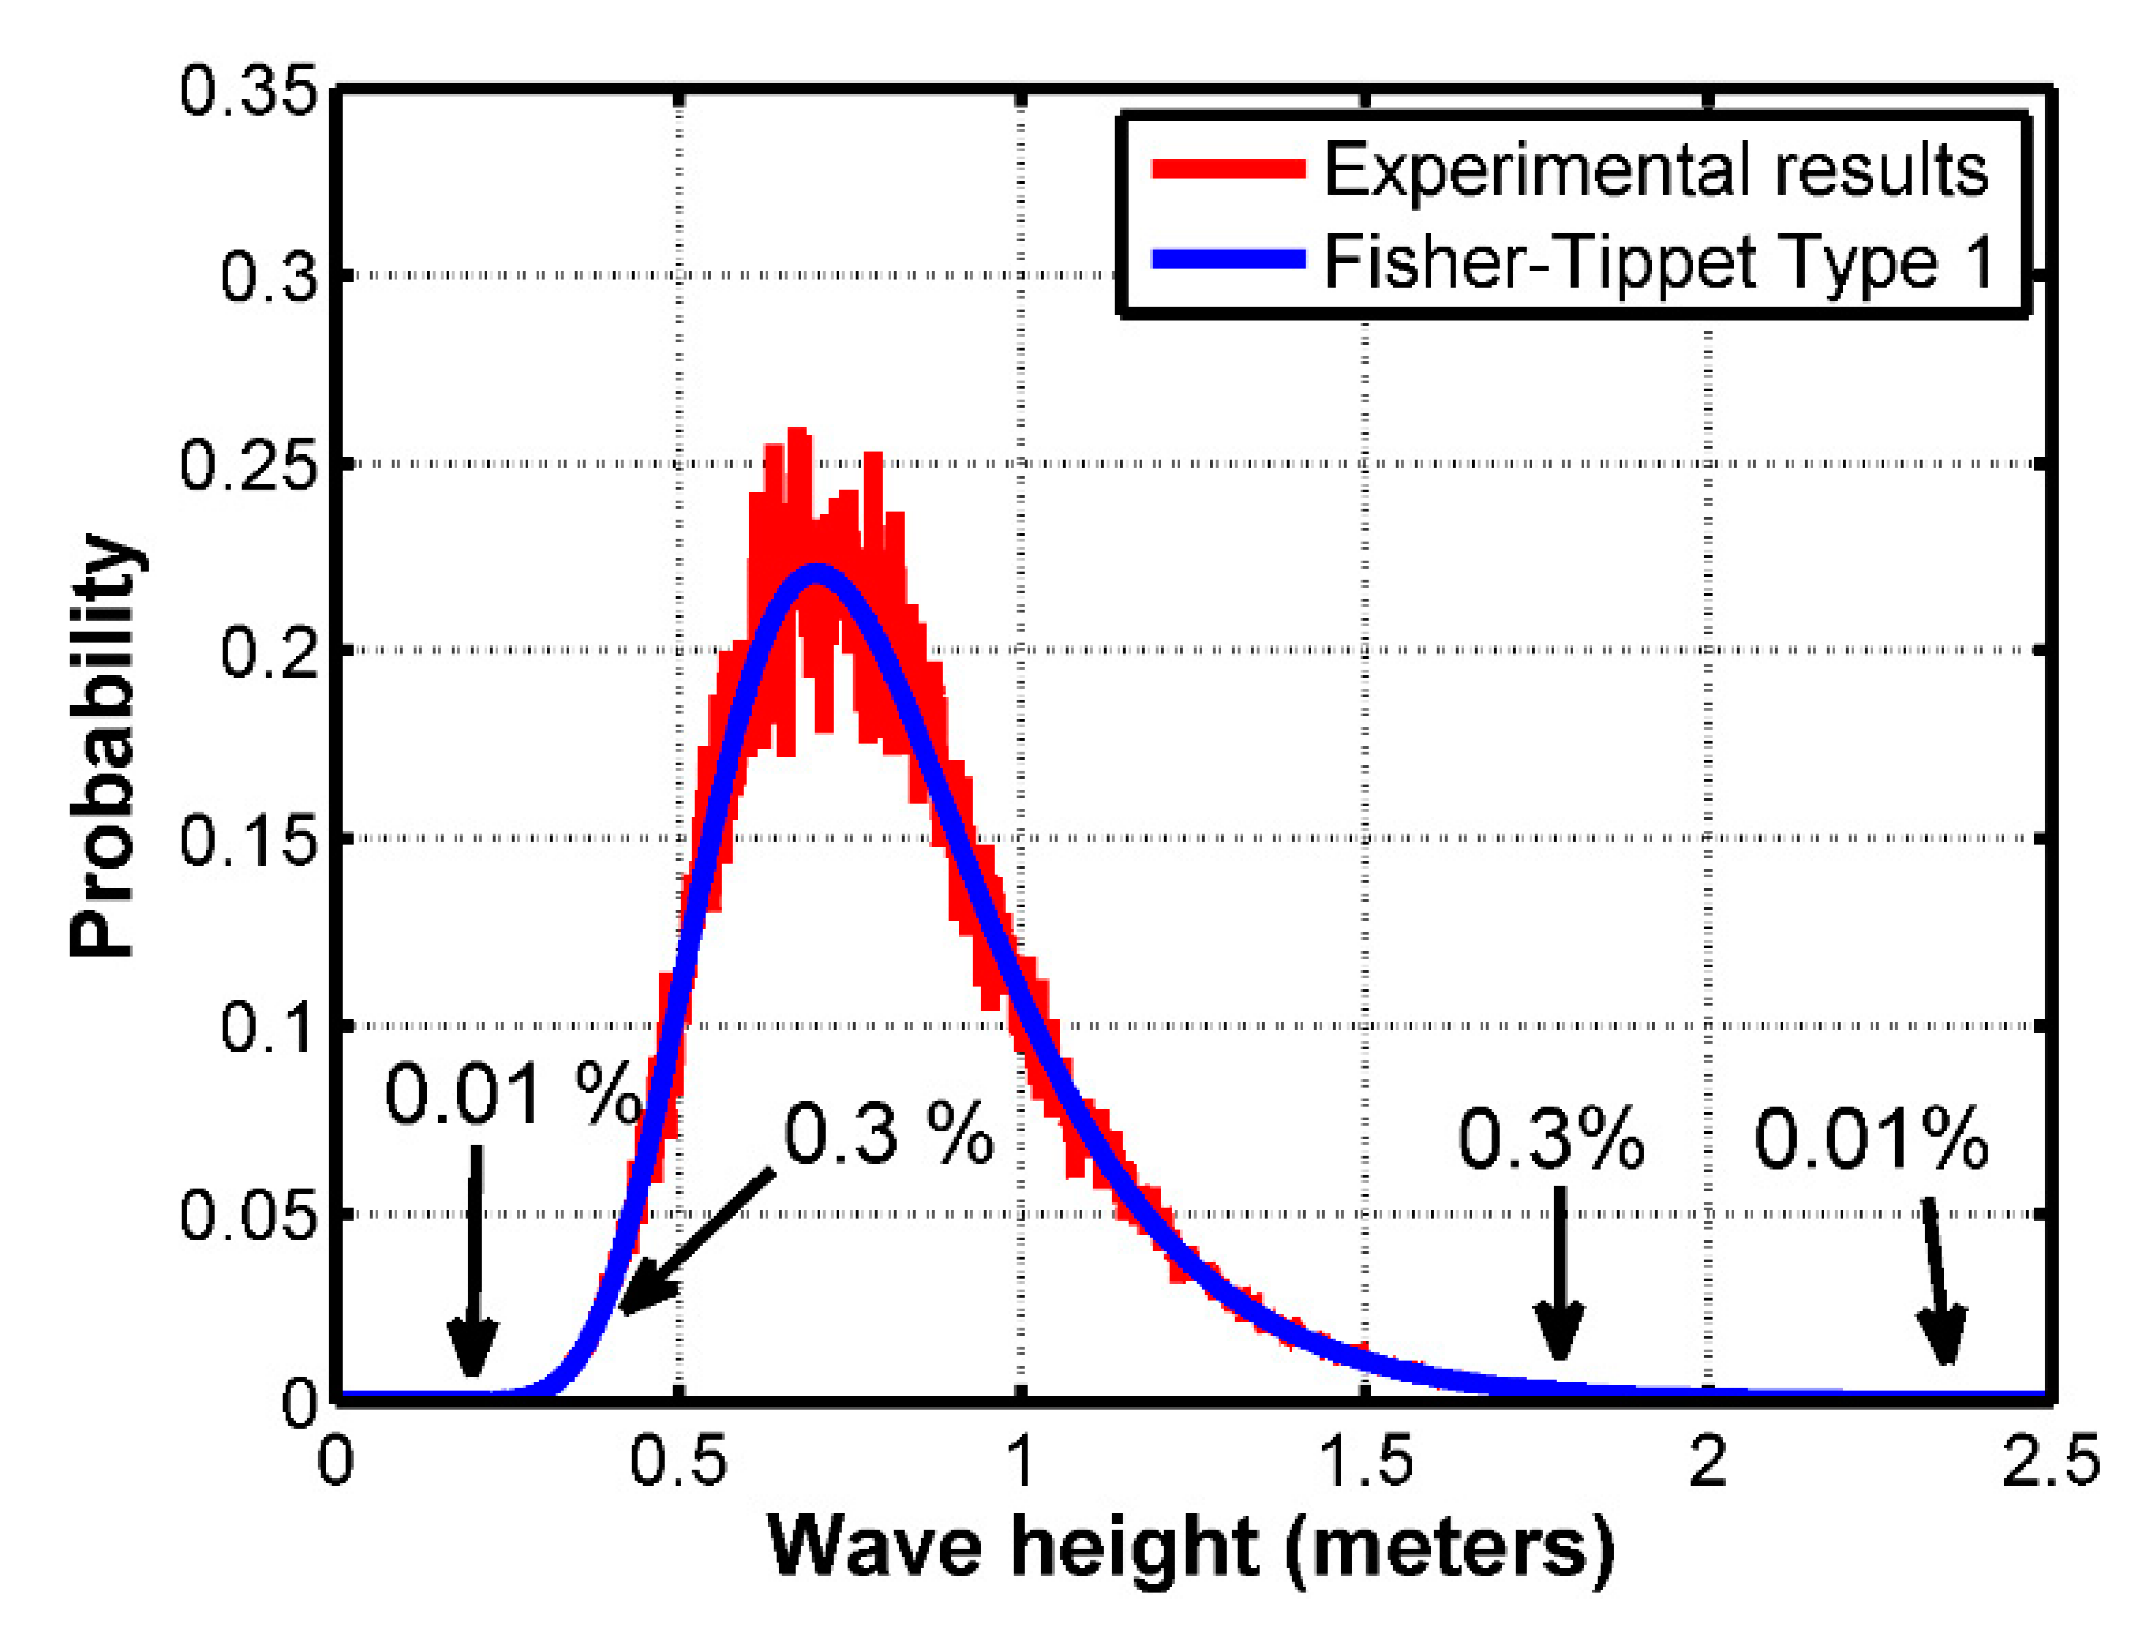
2.1. Linear Model for Sea Waves Based on Fisher-Tippett Type 1 Function
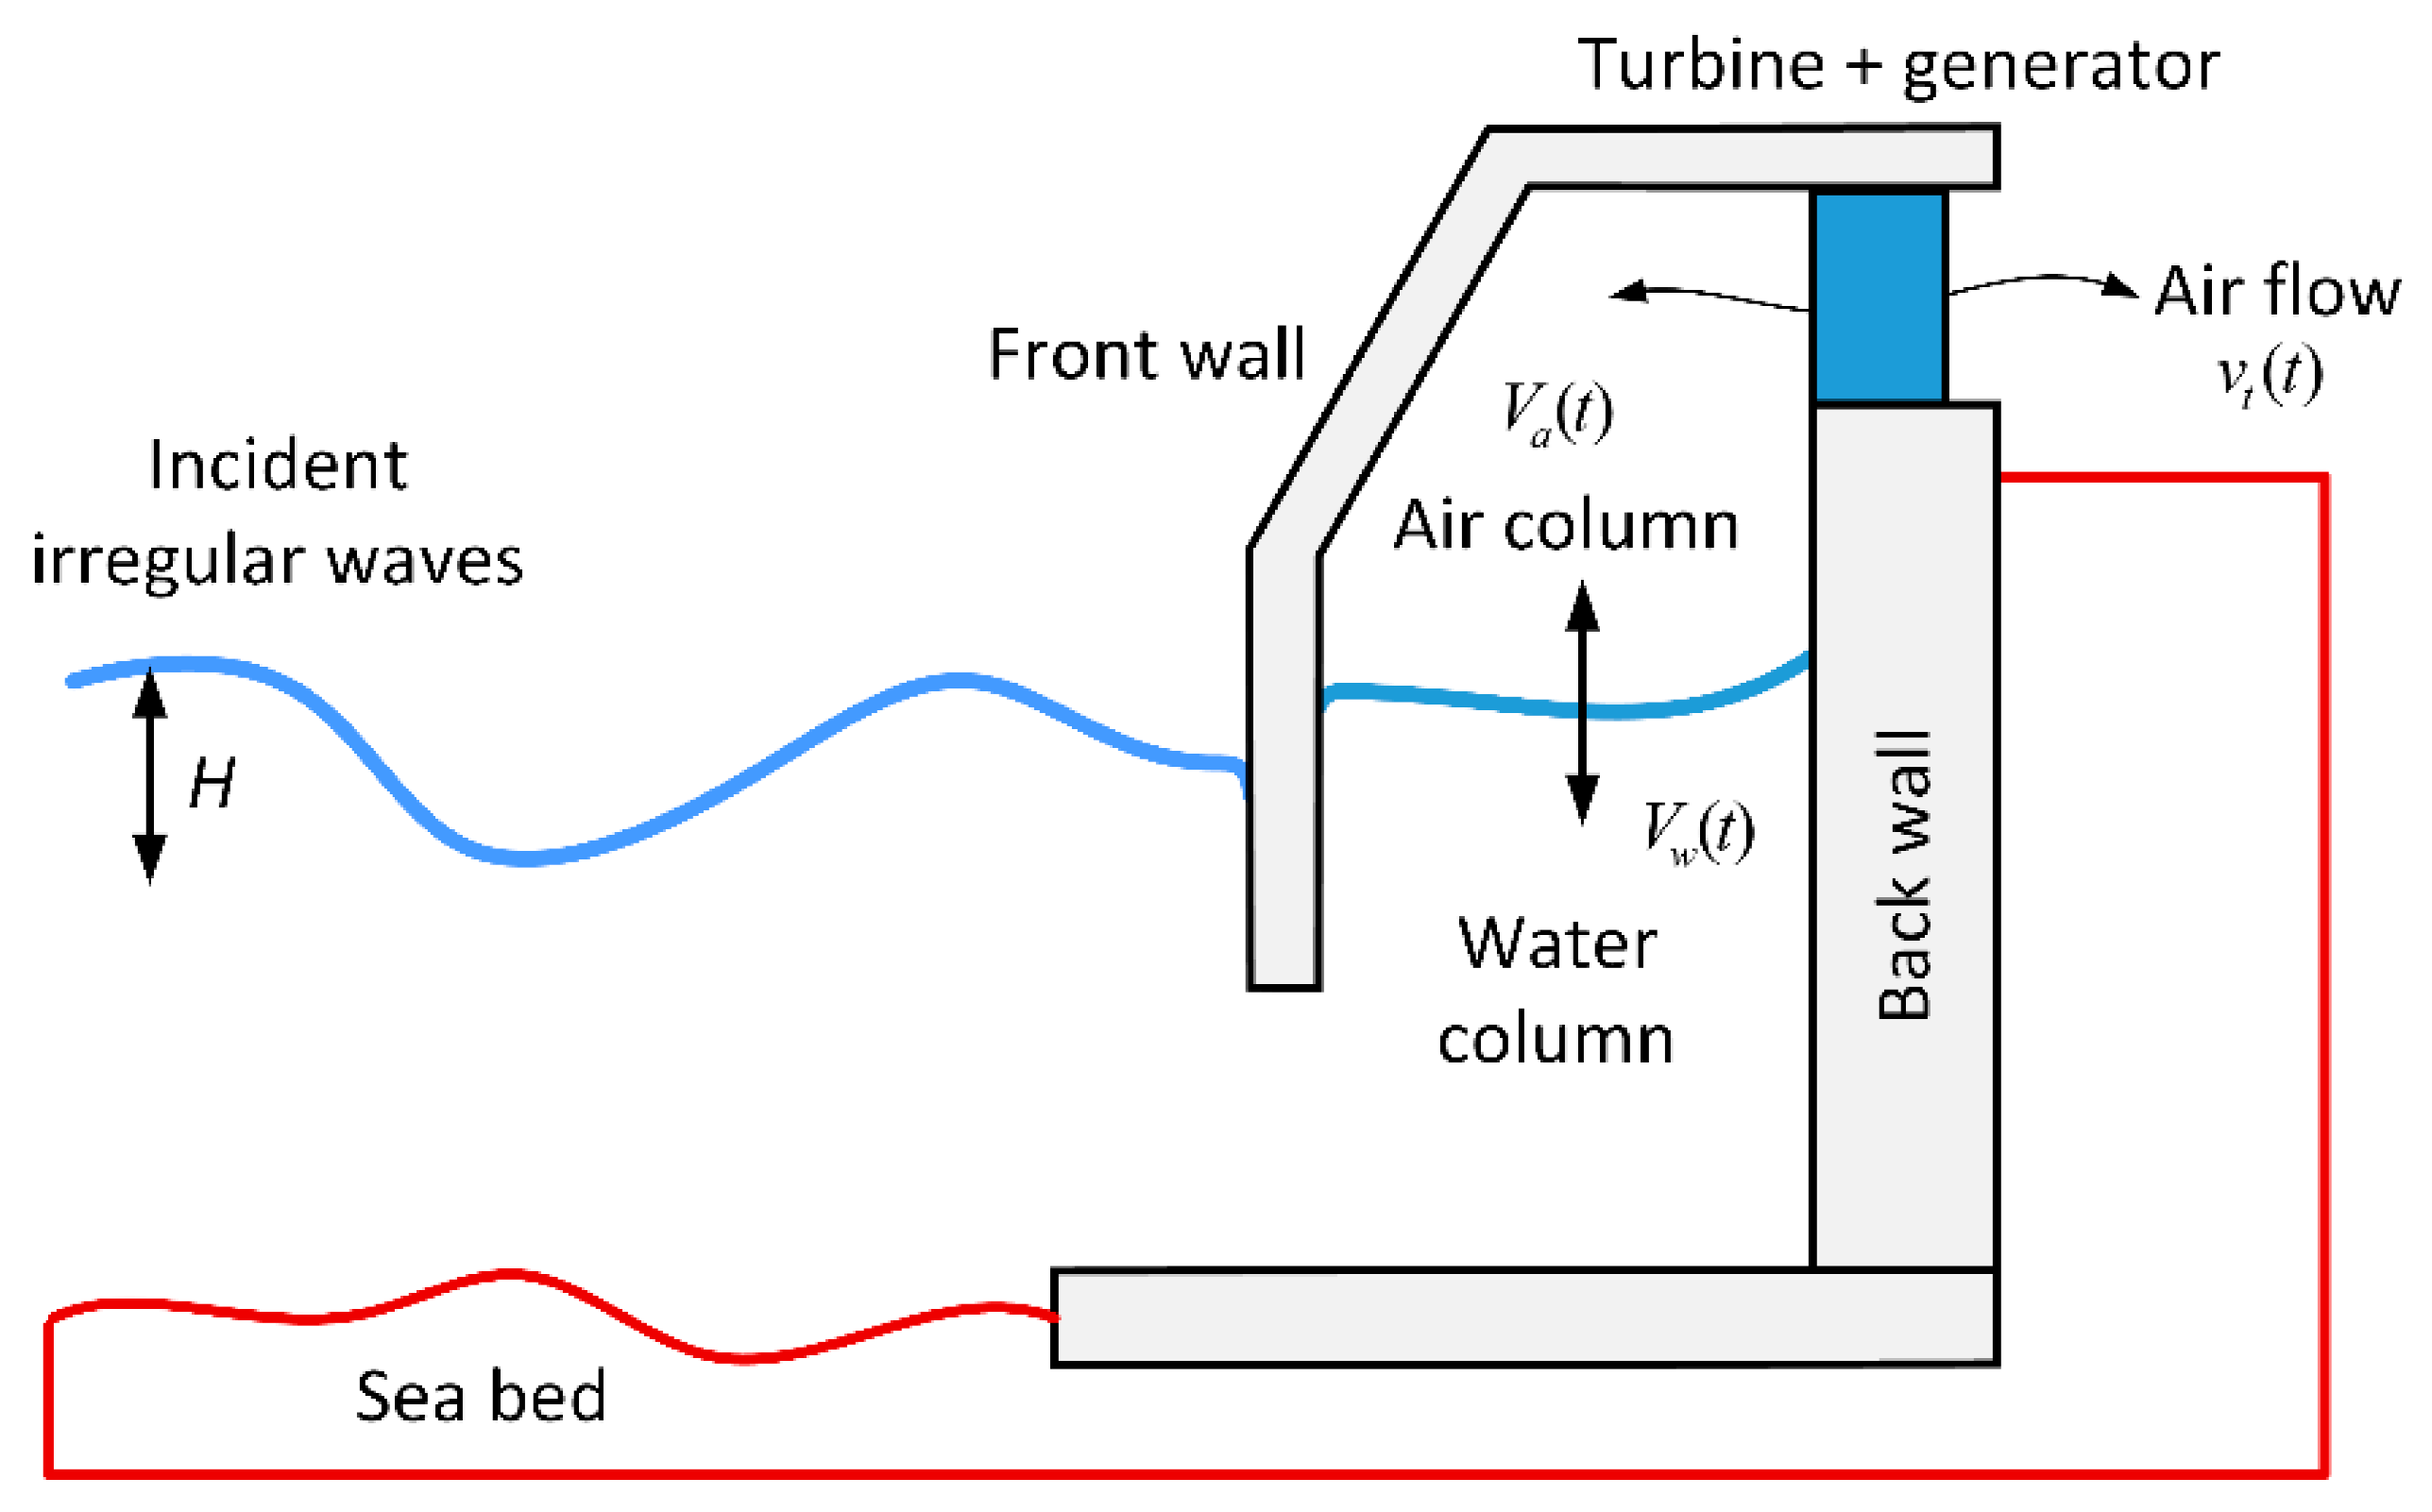
Firstly, it is important to analyze the dynamics of the surface of the waves considering the linear model for sea waves. Other references describing the irregularities of sea waves are based on Navier-Stokes equations, but our proposal will consider the stochastic information of some wave parameters to describe the wave irregularities as an element of the linear model [31]. The above forms part of the technical contribution of the paper. Because the sea waves ( y ) are a natural oscillator, and the oscillation has potential energy, the proposed system aims to obtain the sea energy and convert it to electrical energy. Thus, the spatial and temporal representation of the waves is described as follows:
y ( x , t ) = H 2 sin ( ω t K x ) ,
and the total energy of the wave ( E w a v e ), which is the sum of the kinetic ( E k ) and potential ( E p ) energy, is represented as follows:
E w a v e = E p + E k = λ ρ s g b s H 2 8 ,
where H denotes the wave height in meters, ρ s is the seawater density (kg/m3), g is the gravity force, b s is the crest width or wavefront length, ω = 2 π f is the angular frequency in radians per second, K is the wavenumber defined as K = 2 π / λ at cycles per unit distance or radians per unit distance, λ is the wavelength in meters, f is the frequency in Hertz, t is the time in seconds, and x is the spatial dimension in meters [32,33]. In general, these parameters are directly related to the wave profile of a given location. Hence, Equation (1) represents the surface dynamics of a monochromatic linear wave as a function of the wave parameters. It is essential to clarify that this work considers the OWC system will be installed in shallow waters that comply with the rule, λ / 20 < h < λ / 2 , where h is the depth of the sea in meters. Also, this rule allows to determine all corresponding values for many parameters, which are defined in a different way between shallow and deep waters. For example, the wave period in shallows waters is T = λ / g h [34].
Now, the term of the irregular wave interaction will be defined, which is related to the probability density function of the height (H) and periods (T) of the wave. The probability density function for waves’ height is Fisher-Tippett Type 1 (also called Generalized Extreme Value Distribution, although Weibull and Rayleigh functions can be used), which is given by the following equation:
H = f ( x | k , μ , σ ) = ( 1 σ ) e x p ( ( 1 + k x μ σ ) 1 / k ) ( 1 + k x μ σ ) 1 1 / k ,
where the condition that has to be satisfied for Type 1 is:
1 + k x μ σ > 0
and μ is the location parameter, σ is the scale parameter, and k is the shape parameter [35,36,37]. This implies that the on-shore OWC system analyzed considers the irregular wave interaction based on the probabilistic variation of the height of the waves. Also, the mean value for the wave height is determined considering the stochastic variable H and the Fisher-Tippett Type 1 function. Regarding the irregular behavior of the wave period, it was also characterized by means of an empirical probability density function.

2.2. Chamber Model

Next, the capture chamber model is described. In particular, the volume of water in m3 ( V w ( t ) ) in the chamber has to be calculated based on the complete volumetric dimension of the chamber in m3 ( V c ) to obtain the volume of air in m3 ( V a ( t ) ) that is expelled and introduced to the chamber, as follows (see Figure 2) [38]:
V a ( t ) = V c V w ( t ) .
Also, it is important to clarify that the value of V c remains constant and is related to the dimensions of the necessary fixed maritime infrastructure, while the values of V w ( t ) and V a ( t ) are variant- and time-dependent as a function of the temporal dynamics of the waves. After performing a two-dimensional integration of y ( x , t ) considering a chamber with a regular geometry, that is, either a square or a rectangle, V a ( t ) is calculated as follows:
V a ( t ) = V c + a H k sin ( k b 2 ) sin ( ω t ) ,
where, a is the width and b denotes the length of the chamber, both in meters. Once the volume of air in the chamber, V a ( t ) , has been obtained, it is necessary to determine the expression that represents the instantaneous airflow ( Q a ( t ) ), in m3 per second, that considers the expulsion and entry of air into the chamber [39]:
Q a ( t ) = a H λ f sin ( k b 2 ) cos ( ω t ) .
In this way, it is now necessary to determine the axial airflow speed of the turbine ( υ t ( t ) ) in meters per second in a specific section of the chamber with a particular area ( A ) (m2) of the duct where the turbine is, so that, υ t ( t ) = Q a ( t ) / A . Furthermore, it is important to calculate the kinetic energy ( E ) of the wind mass inside the chamber, as follows:
E ( t ) = 1 2 m υ t ( t )
where m is the air mass (kg) that enters and leaves the chamber. Considering wind energy, the wind power is calculated, utilizing the following equation [40]:
P i n ( t ) = 1 2 ρ A ( υ t ( t ) ) 3 + A p r ( t ) υ t ( t )
where ρ is the air density (kg/m3), A is the area of the passage—duct section (m2), and p r ( t ) is the pressure in the turbine duct in Pascals (Pa).

2.3. Wind Turbine Model

Then, the power that the rotor ( P R ) extracts from the wind power ( P i n ) is calculated:
P R ( t ) = η t η m [ 1 2 ρ A ( υ t ( t ) ) 3 + A p r ( t ) υ t ( t ) ]
Then, the wind turbine power ( P A G ) is calculated as follows:
P A G ( t ) = η t η m η e [ 1 2 ρ A ( υ t ( t ) ) 3 + A p r ( t ) υ t ( t ) ]
where C P = η t η m η e . In particular, C P is the overall power coefficient and it is dimensionless, and η t , η m , and η e represent the turbine, mechanical, and electrical efficiencies, respectively. Taking into account the aforementioned, now it is necessary to obtain the real power generation considering the wind speed and the technical characteristics of the wind turbine and electrical generator used for different cases related to the speed rate [41]:
P A G ( υ t | H , T ) = {           0 ,                   v t < v c   o r   v t > v f   P r ( v t 2 v c 2 v r 2 v c 2 ) ,     v c v t v r     P r ,                   v r v t v f
where P A G ( υ t ) is the real turbine power related to the rate turbine power, and v c , v f , and v r are the cut-in wind speed, cut-off wind speed, and rated wind speed, respectively. Thus, the real power generation of the on-shore OWC systems considering the irregular interactions of the wave’s height and period can be calculated. Now, the overall efficiency, η O W C ( H , T ) , of the system will be determined, which relates the value of P A G ( υ t | H , T ) to the potential energy of the waves in a given location. The overall efficiency is calculated as follows:
η O W C ( H , T ) = 16 π   P A G ( υ t | H , T ) ρ g 2 H 2 T 2
As shown in Equation (13), the wave height and period are parameters that significantly affect the efficiency, although all the other parameters that have been mentioned in this section affect the overall efficiency in some way, e.g., η t , η m , and η e , among others.

3. Results and Discussion

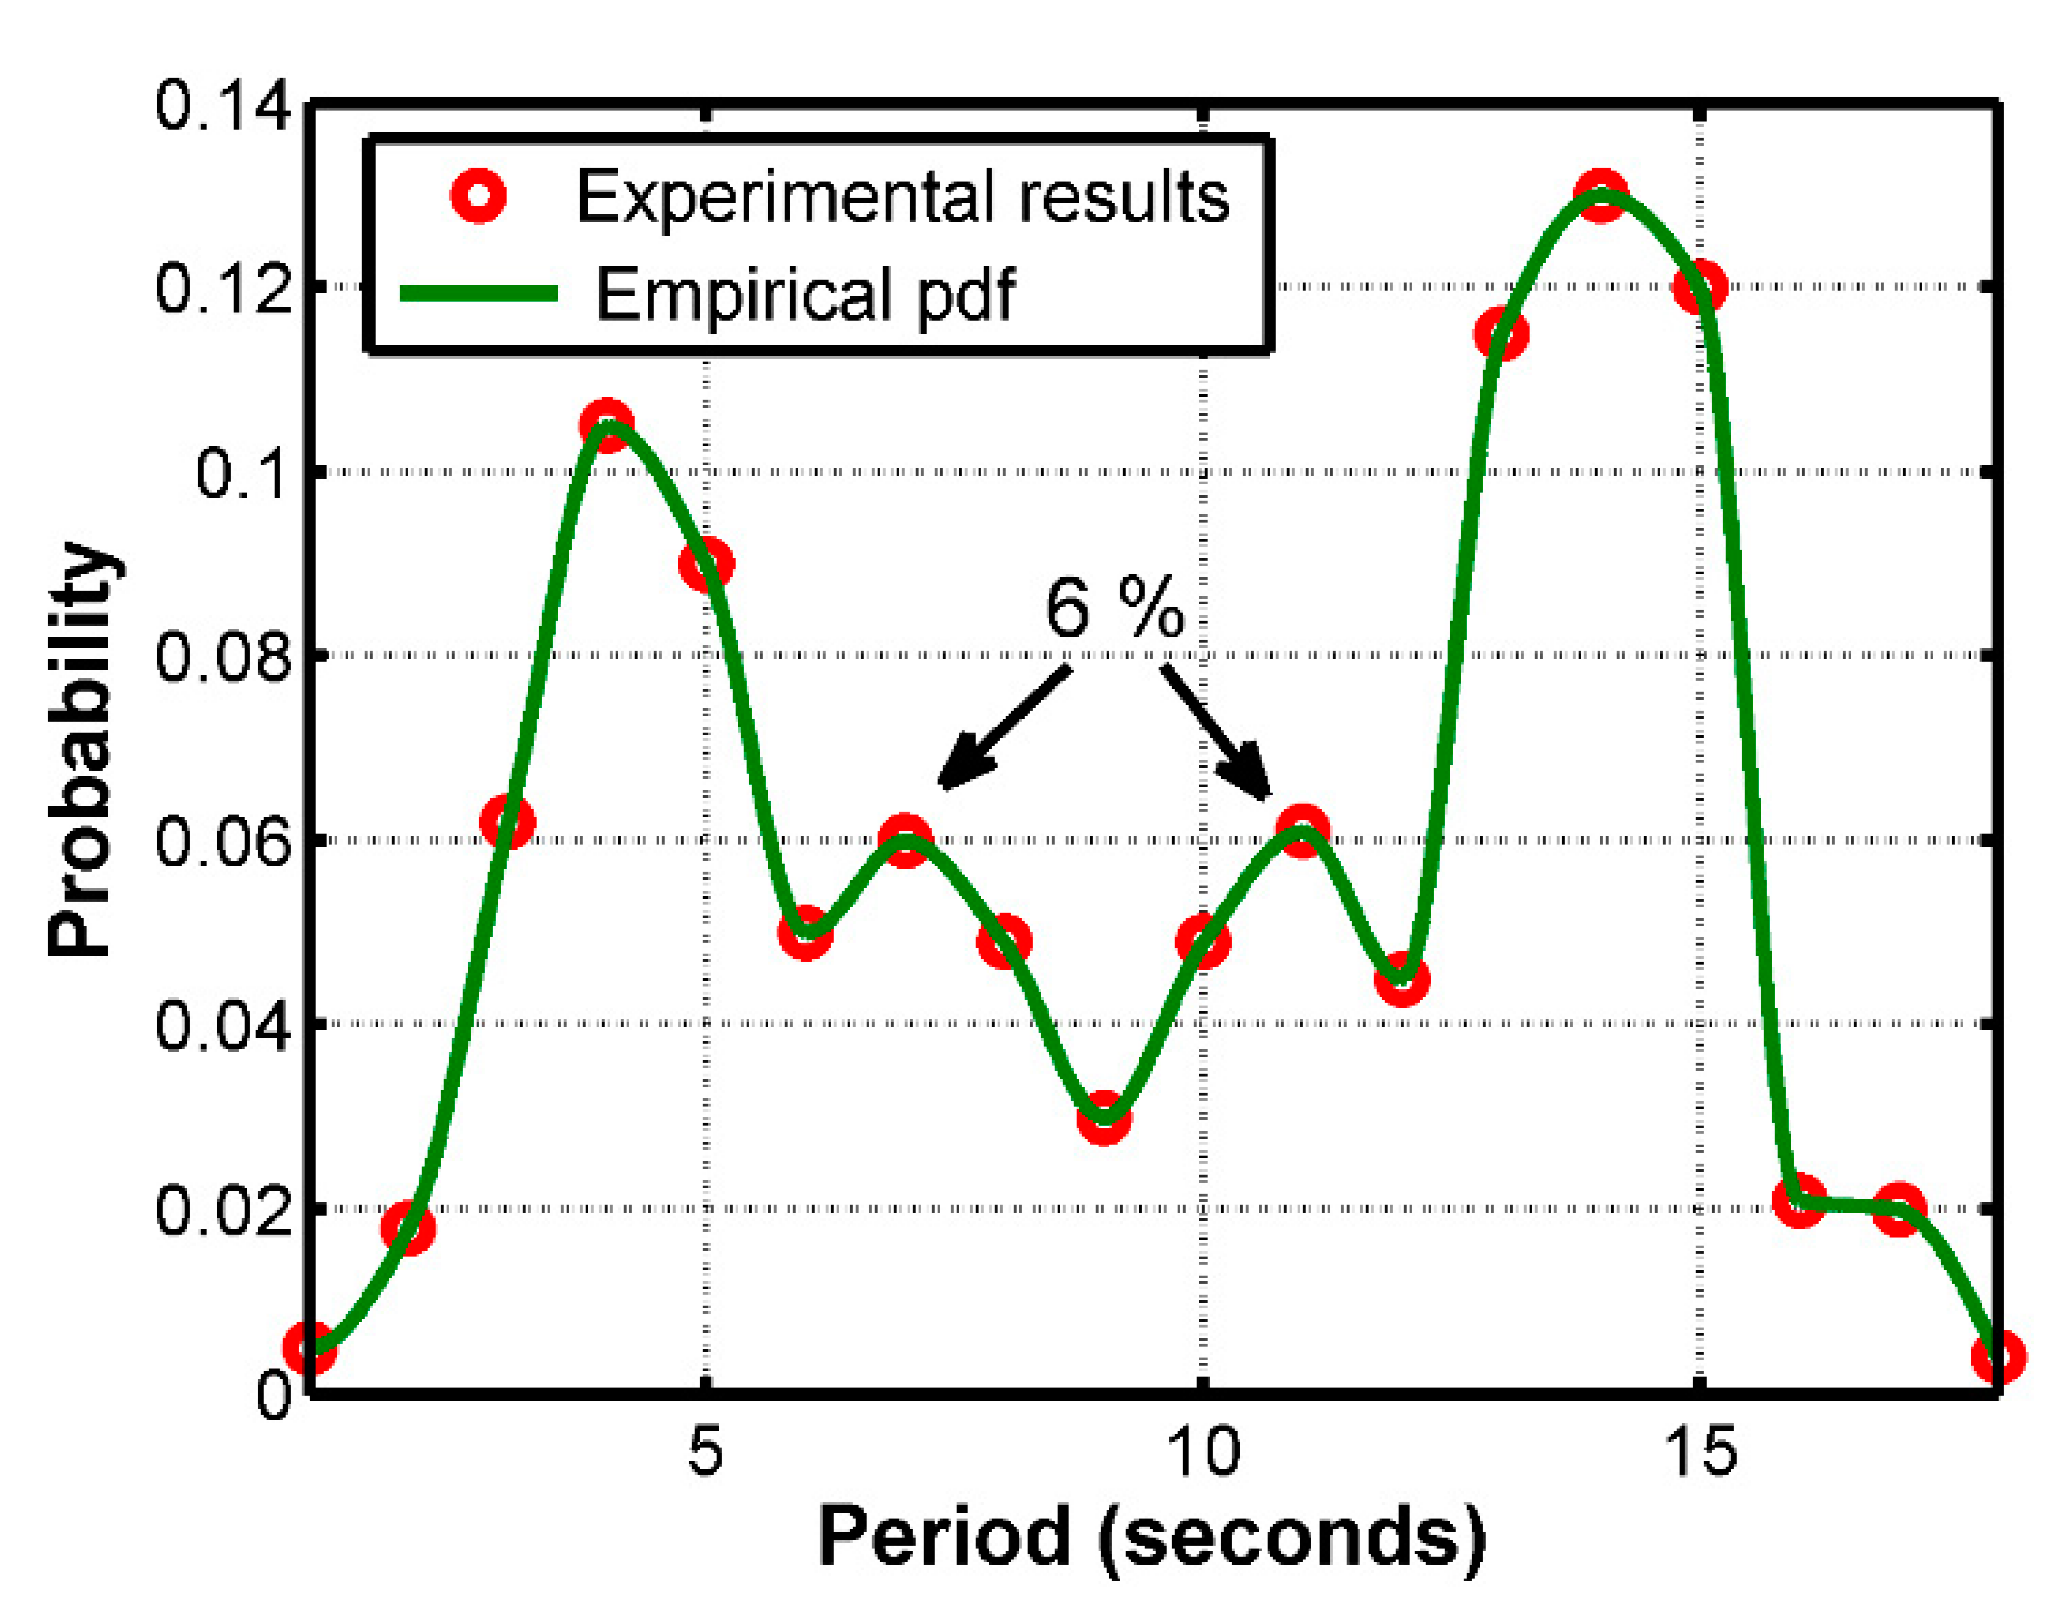
3.1. Stochastic Information of Wave Height and Period

In order to find the value of power generation considering the irregular interaction waves, firstly, the wave heights’ characterization in a locality was carried out to determine the probability density function. Figure 3 shows the wave heights data collected (i.e., experimental results) and the corresponding probability density function, which is Fisher-Tippett Type 1 with μ = 0.7 and σ = 0.2 . As shown, the height wave parameter presents a mean value of 0.7 m with a probability of ≈22%. Besides, the minimum and maximum wave height values with a significant probability are ≈0.40 and ≈1.75 m respectively, although there are extremely unlikely values for the winter and summer season, ≈2.4 and ≈0.25 m, respectively.
Also, the characterization of the wave period was performed, obtaining an empirical probability density function, as shown in Figure 4. In particular, the irregular behavior of the wave period, from a stochastic point of view, describes that the periods of 4 and 14 s are the most likely, ≈10.49% and ≈13.91% respectively, while the periods of 1 and 18 s are the least likely, ≈0.51% and ≈0.53%, respectively. An important aspect is that the periods of 7 and 11 s are almost the same probability, ≈6%. Furthermore, the empirical probability density function has several levels with almost the same probability, which is very different in comparison to the conventional probability density functions. Now, considering the stochastic analysis presented, the mean values of the height ( H ¯ ) and period ( T ¯ ) waves considering the Fisher-Tippett Type 1 and empirical probability density functions are 0.7 m and 10.043 s, respectively. The above will be used as the mean values that represent the irregular interaction of the waves considering the entire analysis period, i.e., the mean values remain constant in an annual period. However, final results will also be provided considering the complete information of both probability density functions to make comparisons between the power generation of the on-shore OWC system proposal and the nearest distributed generation circuit (based on solar energy) already installed near the shore. In order to clarify, the results showed in Figure 3 and Figure 4 make the assumption that incident water waves are polychromatic and unidirectional. Any other assumption (e.g., monochromatic unidirectional, monochromatic directional, among others) could modify the probability density functions of the wave height and period [15].

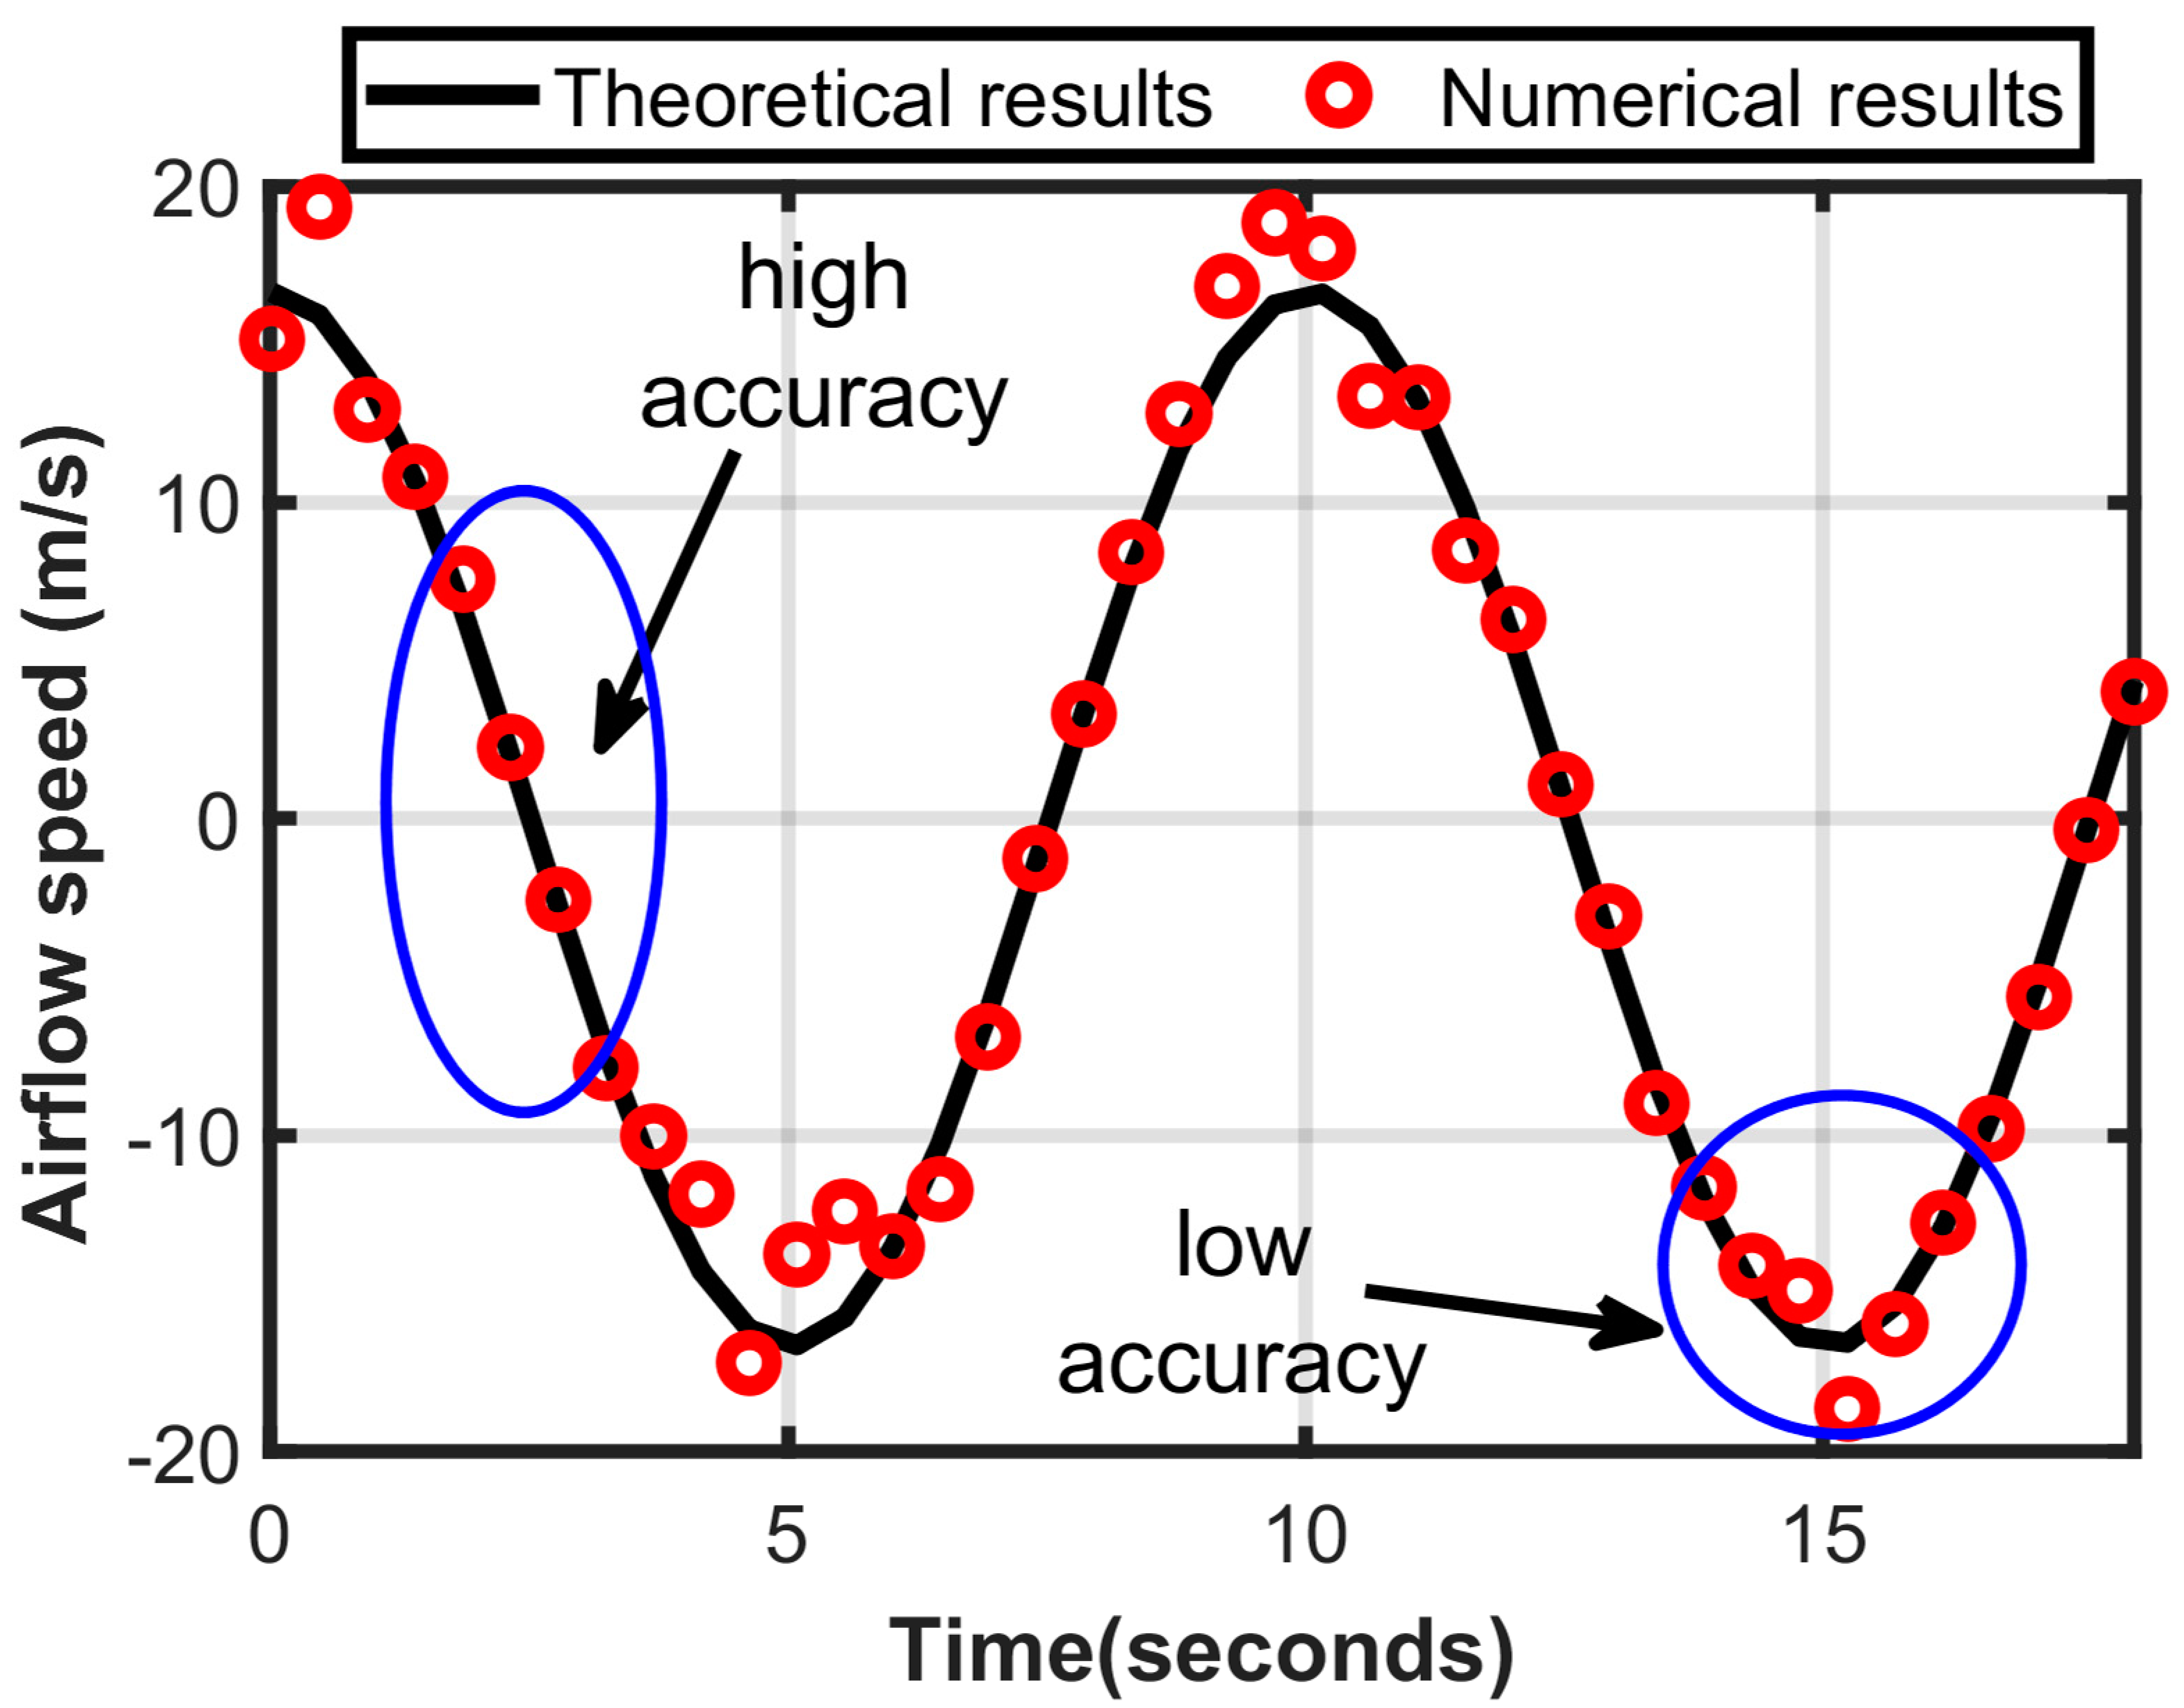
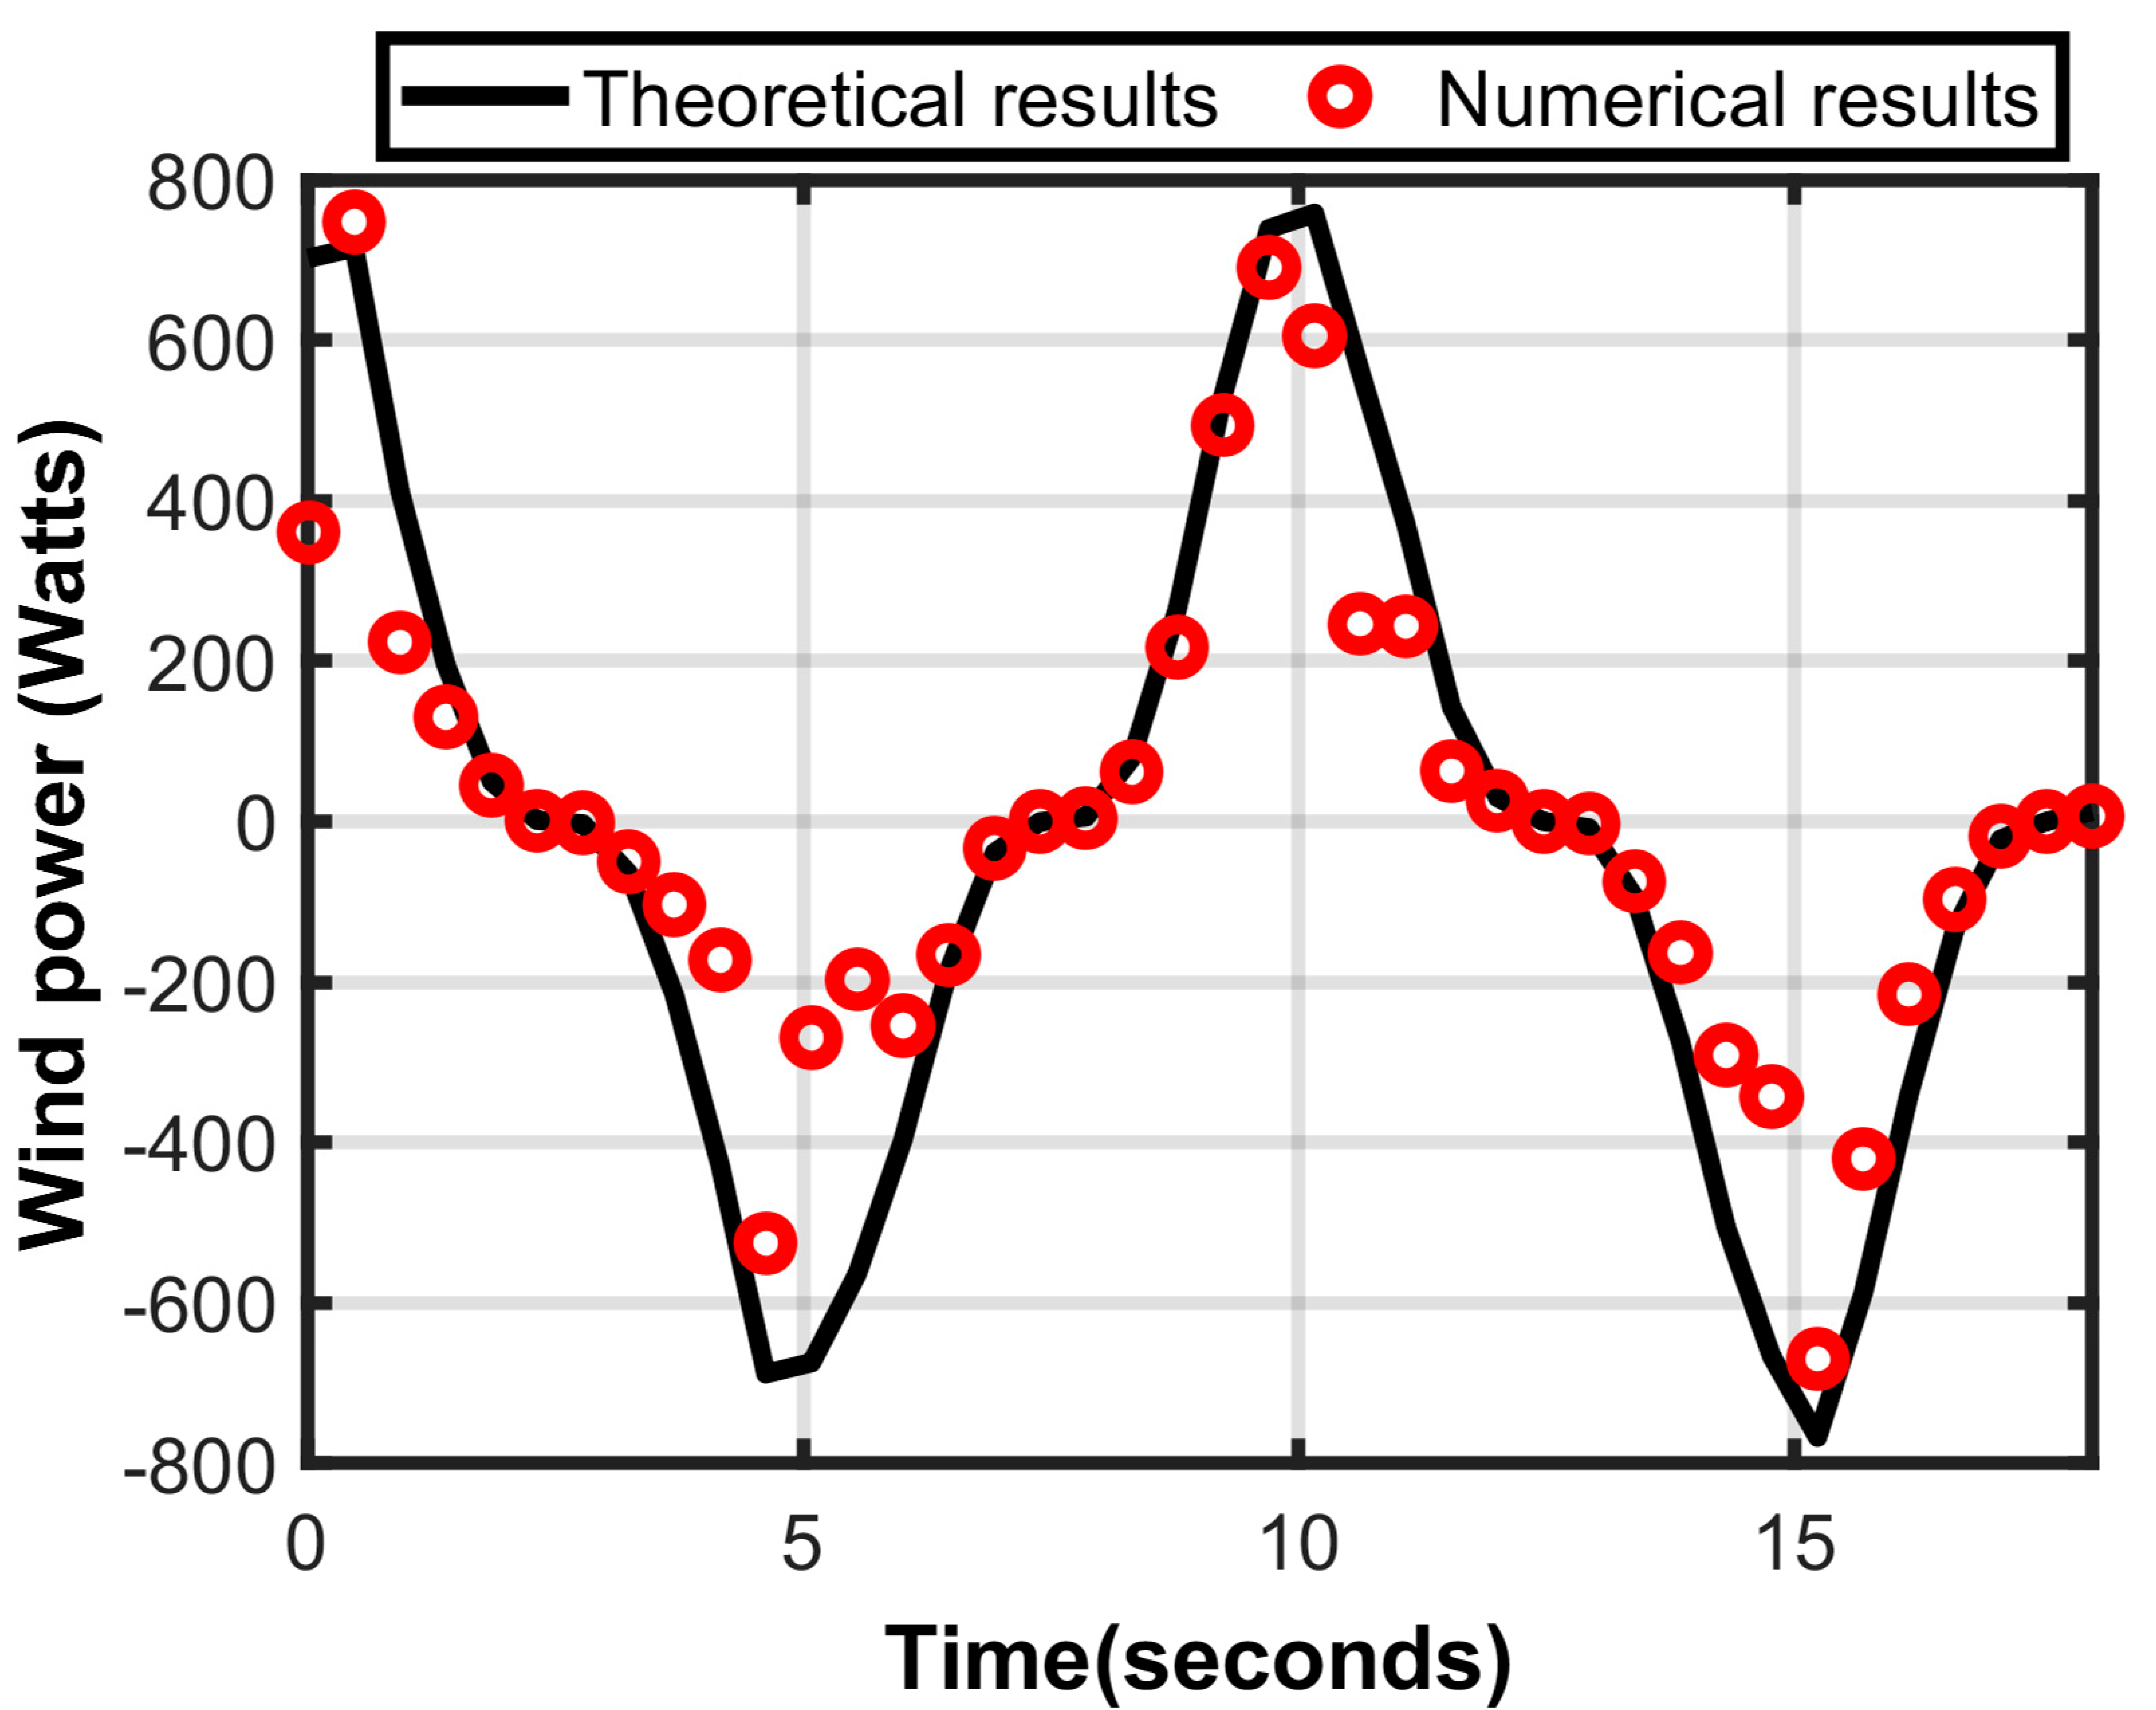
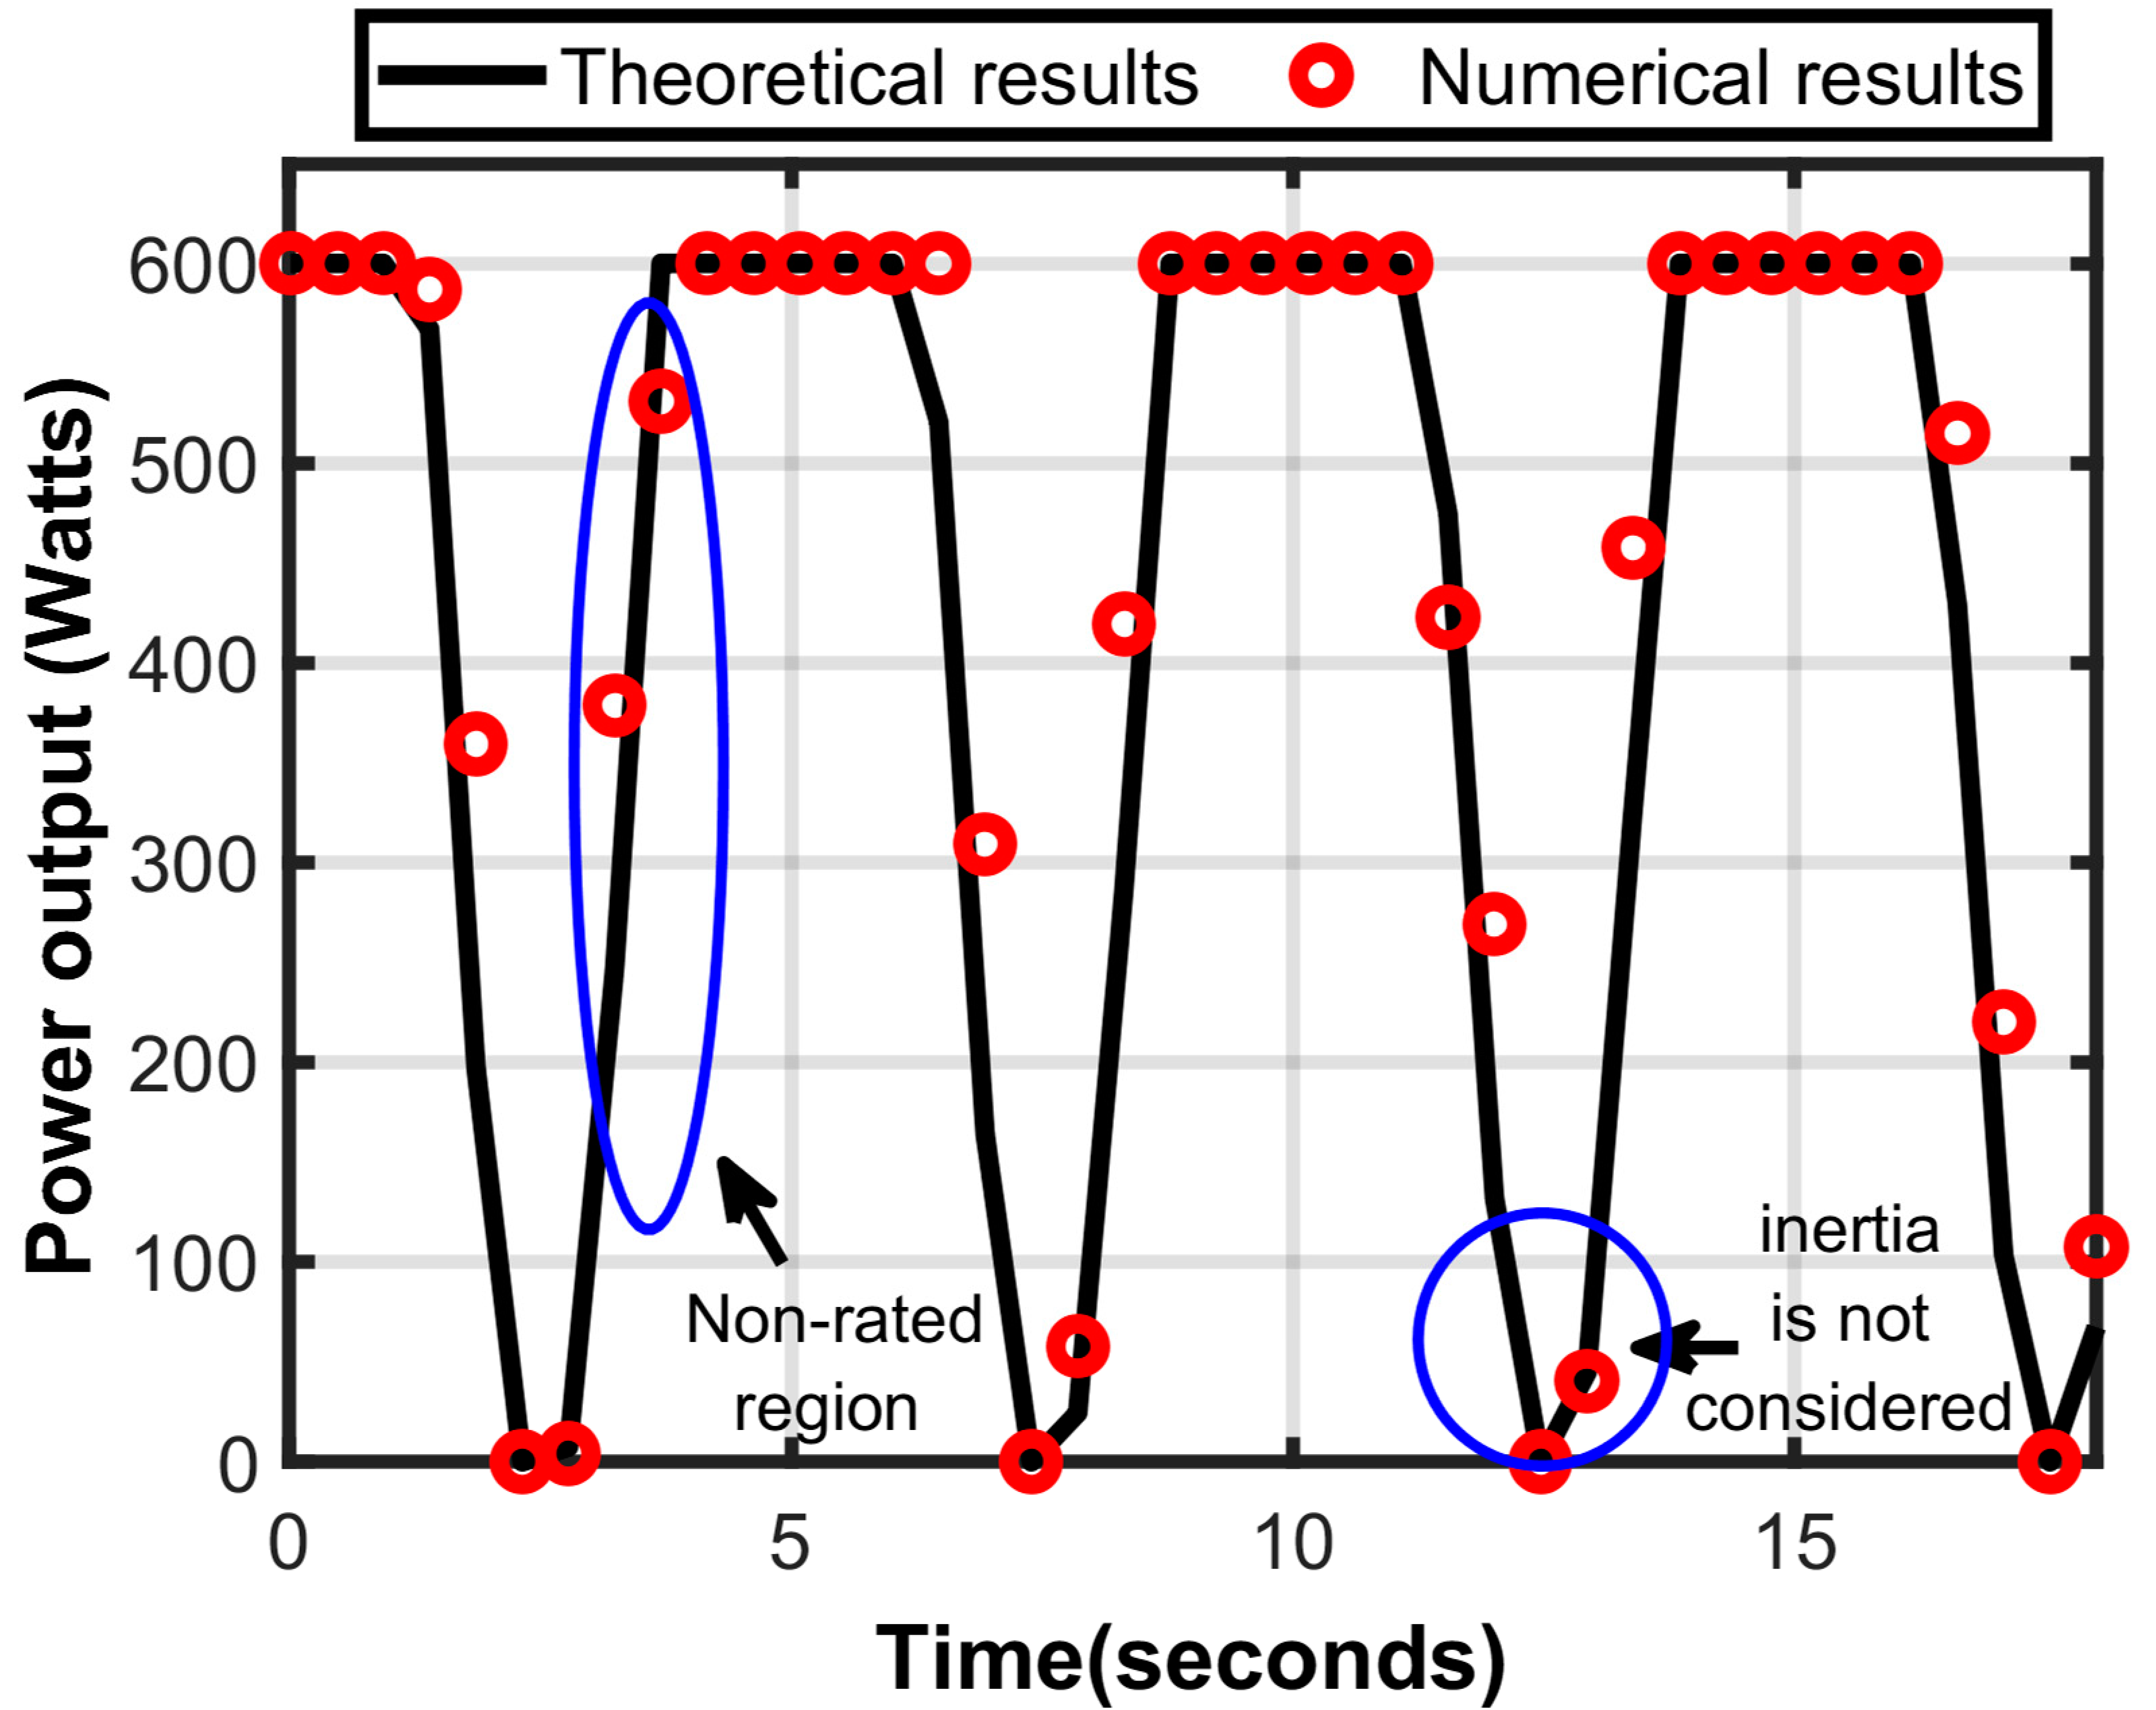
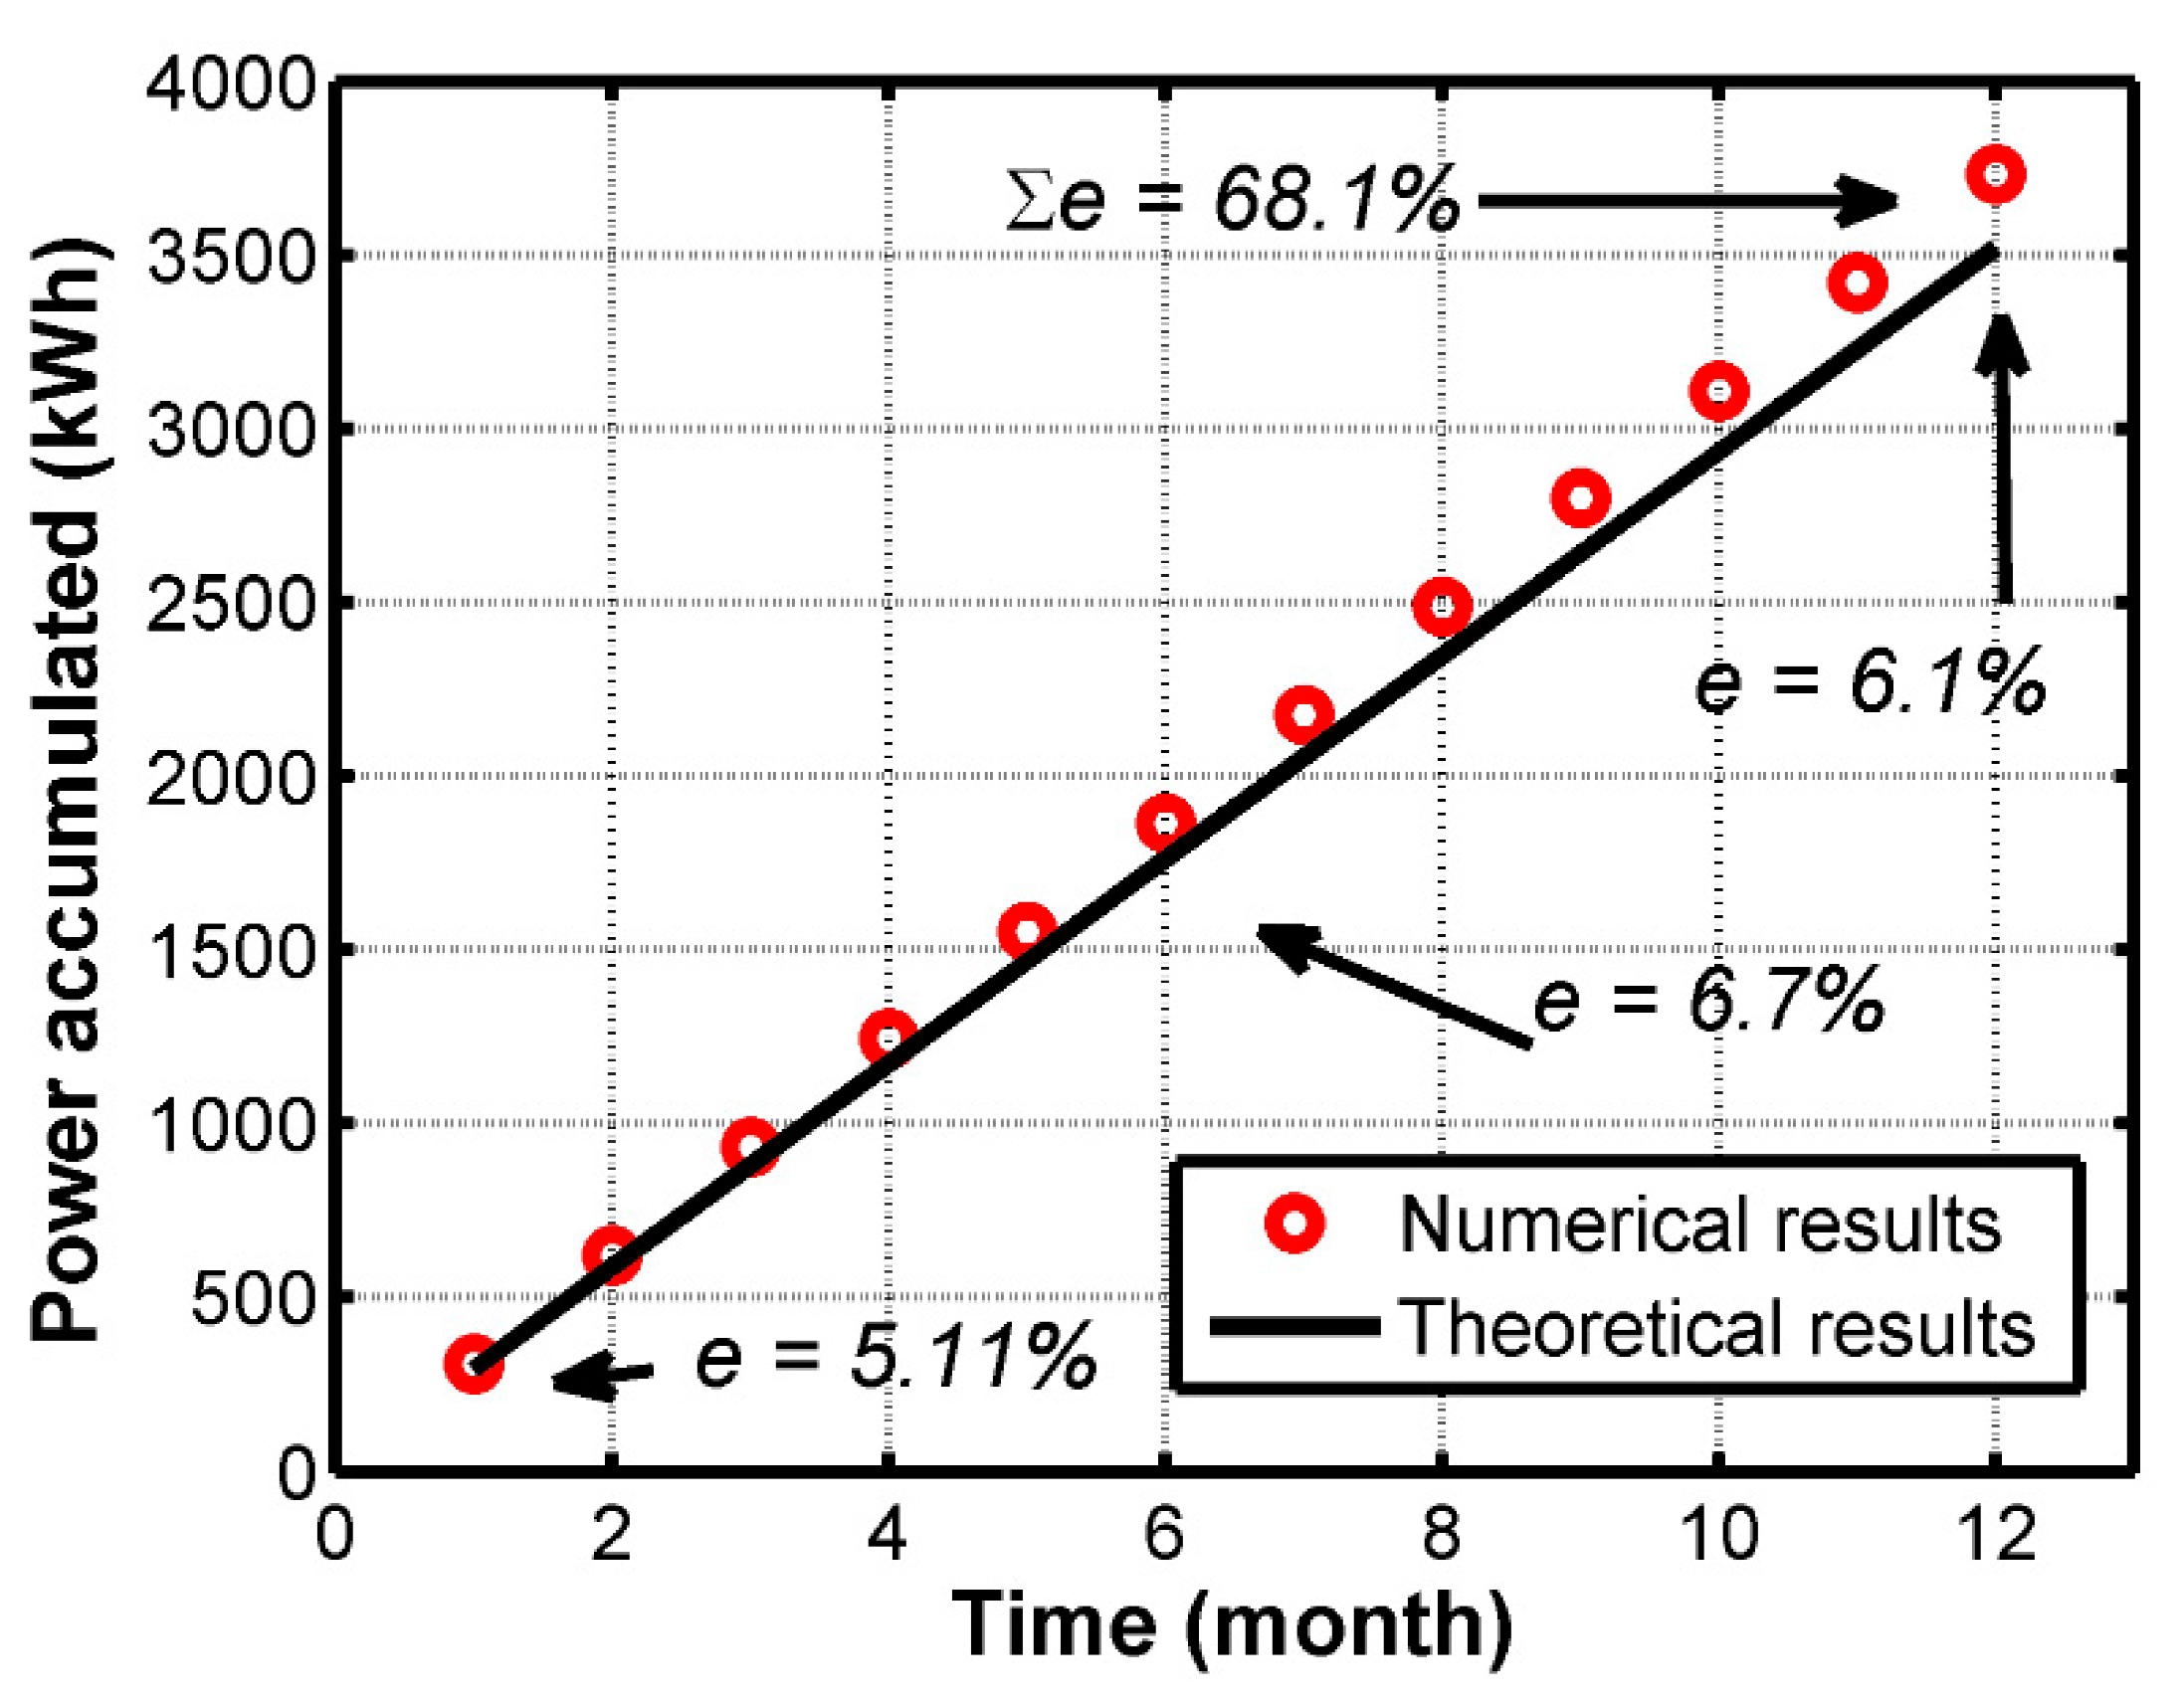
3.2. Performance of the OWC System Based on the Stochastic Information of Irregular Wave Interactions

Next, theoretical and numerical results are presented, where it is important to clarify that the theoretical results comply with the mathematical background and have high precision, while the numerical results present some uncertainty because they consider the information from the probability density functions shown. To obtain theoretical and numerical results based on the probability density functions related to the wave height and period, the dimension of the chamber was defined (a = 5 m and b = 3 m), as well as the depth of the sea (h = 3 m) where the chamber should be installed. Also, the efficiencies were considered as, η t = 0.7 , η e = 0.93 , and η m = 0.9 . In order to clarify, the theoretical results are directly related to the aforementioned mathematical background and the closed-form mathematical solution, and the numerical results are highly related to the data generated based on the probability density functions, i.e., both Fisher-Tippett Type 1 and empirical functions.
Considering the mathematical background explained in Section 2, the numerical results of the OWC system proposal are calculated to determine the power capacity generation as a distributed generation resource. Figure 5 shows the comparison of the theoretical and numerical results of the airflow speed, υ t ( t ) , based on Equation (7). In particular, due to the behavior of the Wells turbine used, the airflow enters and leaves the chamber, which is represented for the negative (−) and positive (+) signs of the airflow speed parameters, respectively. In fact, bidirectional airflow is the main factor of the Wells turbine efficiency compared with other turbine kinds. Furthermore, the airflow direction modification is related to the behavior of the oscillating water column into the chamber. The maximum airflow speed is ≈20 m/s for both airflow directions. Also, the theoretical and numerical results are close. Moreover, the numerical maximum airflow speed is υ t ( t ) ≈ ±19.5 m/s, with a variance of 0.1 m/s. Figure 5 shows that in the regions where the airflow speed is maximum, there are the greatest variations between the theoretical and numerical results, i.e., low-accuracy regions. Whereas in regions where airflow speed is low, a high-accuracy airflow speed occurs for both airflow directions.
Afterward, the wind power considering Equation (9) was obtained as shown in Figure 6. The maximum theoretical wind power is ≈700 W, even considering both airflow directions, while the numerical results show that the wind power is close to the theoretical results. In particular, the wind power numerical results present important variations based on the irregular wave height and period. The results shown in Figure 5 and Figure 6 allow to choose the optimal turbine that meets the requirements of airflow speed and wind power, and thus obtain the real output power of the on-shore OWC system as a first estimation to the overall distributed generation system and to validate the theoretical and numerical results. In this way, a turbine with a power rate of 600 W is used, output voltage 48 VAC ± 0.5%, v c = 2.5 m/s, v f = 45 m/s, and v r = 11 m/s.
Figure 7 shows the electrical power generated considering all the parameters related to Equations (11) and (12). As seen in the theoretical results, the maximum generation power reached is 600 W, while the minimum power is 0 W. The latter is because the electrical generator inertia constant is not considered, that is, considering the inertia constant, the minimum value of power generated should be greater than 0 W because the turbine rotor would never stop, considering a permanent airflow. Then, considering the cases presented by Equation (12), there are power values in the non-rated region of the turbine, i.e., power values less than 600 W and greater than 0 W, which implies a non-linear performance.
Finally, Figure 8 shows the performance of the proposed on-shore OWC system considering the irregular height and period parameters of sea waves during an annual period. In particular, because the proposal only considers a single chamber, the theoretical average power is ≈0.407 kW, while the numerical result is ≈0.432 kW, while the theoretical and numerical daily power is ≈9.77 and ≈10.36 kWh/day, respectively. Similarly, the annual theoretical and numerical generated power are ≈3519.62 kWh/year (≈3.51 MWh/year) and 3732.58 kWh/year (3.73 MWh/year), respectively. Furthermore, the theoretical and numerical results show an error margin regarding the power generated for each month of e ≈6% and a cumulative annual error of e = 68.1%.
Until now, the results presented only consider a single-chamber on-shore OWC proposal and the mean values of wave height and period based on the probability density functions mentioned. However, it is considered that the chamber dimension is reduced, so the power generated is also minimal. For example, for the dimensions of the mentioned chamber, the average power is 0.432 ± 0.15 W, while the daily power generation is 9.77 ± 0.25 kWh/day, and the annual power generation is 3.73 ± 0.12 MWh/year. Even with the annual power generation rate, the power of the on-shore OWC systems is minimal to be considered as a distributed generation resource with a significant penetration factor. To increase the power generation rate, and thus increase the impact on the active regional energy grid, the dimensions of the single chamber were modified, and the performance related to power generation was analyzed, as shown in Table 1. The maximum dimension of the single chamber is a = 20 m and b = 3 m, which implies a maximum airflow speed of 65 ± 4.22 m/s, an average power of 26.55 ± 2.45 kW, a daily generated power of 557.55 ± 6.53 kWh/day, and a power generated annually of 167.26 ± 8.72 MWh/year. To clarify, for the maximum physical dimension, i.e., a = 20 m and b = 3 m, a 25 kW power rated turbine is considered (29.8 kW peak power), 220/380 VAC, which presents the following technical values, v c = 3.0 m/s, v f = 25 m/s, v r = 11 m/s, and a survival wind speed of 52.5 m/s, which means that the maximum airflow speed of 65 ± 4.22 m/s has to be regulated.
Considering the irregular interaction of the waves under the same analysis conditions of the proposed on-shore OWC system, the generated power performance is calculated taking into account that the height and period of the waves are independent stochastic processes. Table 2 shows the numerical results of the power generated considering the complete stochastic information of H and T parameters. In particular, the power generated annually of the on-shore OWC system that uses the smallest chamber is 3.13 ± 1.02 MWh/year, while the power generated by the on-shore OWC system that uses the largest chamber is 160.61 ± 9.99 MWh/year. This implies that, in comparison with the results shown in Table 1, which considered the mean values of the wave height and period, the power generated annually is slightly lower, and the variability is greater. The main reason for the performance mentioned is the stochastic variation of the wave heights and periods associated with the particular probabilities, e.g., extremely large and small wave heights are unlikely, and therefore affect the average annual power generation.
Then, the overall efficiency of the on-shore OWC systems was calculated considering all the cases related to the change in the physical dimensions and the irregular interaction of the wave heights and periods, i.e., the overall efficiency was determined considering the mean values of wave height and period ( η O W C ( H ¯ , T ¯ ) ), as well as the overall efficiency, taking into account the complete behavior of the heights and period of the waves according to the characteristic probability density functions that describe each variable mentioned ( η O W C ( H , T ) ). Table 3 shows the numerical results of the overall efficiency for both turbines used. Regarding the 600 W turbine, the efficiency considering the mean value of wave height and period is ≈25%, with variations of up to ±1.51% for all used physical dimensions of the chamber, while the overall efficiency, η O W C ( H , T ) , presents a reduction of up to 3.1%, with an increase in variability of up to ±2.85%. Concerning the 25 kW turbine, the overall efficiency is slightly reduced and the variability is increased. For example, for the bigger chamber (a = 20 m and b = 3 m), η O W C ( H ¯ , T ¯ ) = 21% ± 2.82%, while the η O W C ( H , T ) = 20.69% ± 3.12%.
Regarding the nearest distributed generation circuit (see Figure 9) already installed near the shore, the voltage level is 13.8 kV, recommended power capacity is 1890 kW, but the installed power is 121 kW, and the limit power capacity circuit is 4000 kW. Considering the aforementioned results, mainly related to the 25 kW turbine, the on-shore OWC proposal would increase the installed power up to 146 kW. Furthermore, based on recommended power capacity, the implementation of multiple on-shore OWC systems is highly suitable. Also, increasing the physical dimension of the single-chamber on-shore OWC proposal is possible.

4. Conclusions

As an outcome, the impact of the irregular interaction of the sea waves has been calculated and determined, associated to the stochastic processes related to the height and period of the waves as the main random variables to determine the total power generated by an on-shore OWC system proposed for the state of Baja California in México. The wave height and period parameters were characterized using the Fisher-Tippett Type 1 and empirical probability density functions, respectively. Likewise, an analysis regarding the impact of the changes in the physical dimensions of the chamber was carried out, obtaining the annual power generation, as well as the overall efficiency for all physical dimensions for both turbines, 600 W and 25 kW. In general, it was found that the theoretical and numerical results are highly similar, and therefore they can be used as part of the design to improve the active electrical grid of the state of Baja California. Nonetheless, it is considered that the inertia constant of the electric generator should be added to the model to improve the precision of the results. Based on the characterization of wave height and period for the particular location, if the wave height and period are 2 m and 7 s respectively, the potential power generated can achieve up to 70 kW considering the minimum physical dimension of a single chamber (a = 5 m and b = 3 m). Finally, it is important to clarify that dynamic additional loads (e.g., tension loads, pressure variations, wave loads on bottom-sitting, and superficial wave loads, among others) that can negatively limit the service life of the on-shore OWC proposal are not considered in this paper. Also, the determination of the joint probability density function that relates both the height and period waves could help to enhance sea state description and improve the power generation prediction.

Author Contributions

Conceptualization, J.A.L.-L. and C.B.-S.; methodology, J.A.L.-L.; software, J.A.L.-L. and L.F.S.-L.; validation, L.F.S.-L. and M.F.G.-R.; formal analysis, J.A.L.-L.; investigation, C.B.-S. and L.F.S.-L.; resources, J.A.L.-L. and M.F.G.-R.; data curation, L.F.S.-L. and M.F.G.-R.; writing—original draft preparation, J.A.L.-L.; writing—review and editing, C.B.-S., L.F.S.-L. and M.F.G.-R.; visualization, J.A.L.-L.; supervision, J.A.L.-L.; project administration, J.A.L.-L.; funding acquisition, J.A.L.-L. All authors have read and agreed to the published version of the manuscript.

Funding

This research received no external funding.

Conflicts of Interest

The authors declare no conflict of interest.

References

  1. Boudet, H.S. Public perceptions of and responses to new energy technologies. Nat. Energy 2019, 4, 446–455. [Google Scholar] [CrossRef]
  2. Aslanturk, O.; Kıprızlı, G. The Role of Renewable Energy in Ensuring Energy Security of Supply and Reducing Energy-Related Import. Int. J. Energy Econ. Policy 2020, 10, 354–359. [Google Scholar] [CrossRef]
  3. Zhou, B.; Xu, D.; Li, C.; Chung, C.Y.; Cao, Y.; Chan, K.W.; Wu, Q. Optimal Scheduling of Biogas–Solar–Wind Renewable Portfolio for Multicarrier Energy Supplies. IEEE Trans. Power Syst. 2018, 33, 6229–6239. [Google Scholar] [CrossRef] [Green Version]
  4. Khan, N.; Kalair, A.; Abas, N.; Haider, A. Review of ocean tidal, wave and thermal energy technologies. Renew. Sust. Energ. Rev. 2017, 72, 590–604. [Google Scholar] [CrossRef]
  5. Zheng, C.W.; Wang, Q.; Li, C.Y. An overview of medium- to long-term predictions of global wave energy resources. Renew. Sust. Energ. Rev. 2017, 79, 1492–1502. [Google Scholar] [CrossRef]
  6. Shalby, M.; Dorrell, D.G.; Walker, P. Multi–chamber oscillating water column wave energy converters and air turbines: A review. Int. J. Energy Res. 2018, 43, 681–696. [Google Scholar] [CrossRef]
  7. Doyle, S.; Aggidis, G.A. Development of multi-oscillating water columns as wave energy converters. Renew. Sust. Energ. Rev. 2019, 107, 75–86. [Google Scholar] [CrossRef] [Green Version]
  8. Lindroth, S.; Leijon, M. Offshore wave power measurements—A review. Renew. Sust. Energ. Rev. 2011, 15, 4274–4285. [Google Scholar] [CrossRef]
  9. Drew, B.; Plummer, A.R.; Sahinkaya, M.N. A review of wave energy converter technology. Proc. Inst. Mech. Eng. A J. Power Energy 2009, 223, 887–902. [Google Scholar] [CrossRef] [Green Version]
  10. Zabihi, M.; Mazaheri, S.; Namin, M.M. Experimental hydrodynamic investigation of a fixed offshore Oscillating Water Column device. Appl. Ocean Res. 2019, 85, 20–33. [Google Scholar] [CrossRef]
  11. Yamaç, H.İ.; Koca, A. Shore type effect on onshore wave energy converter performance. Ocean Eng. 2019, 190, 106494. [Google Scholar] [CrossRef]
  12. Malara, G.; Arena, F. Response of U-Oscillating Water Column arrays: Semi-analytical approach and numerical results. Renew. Energy 2019, 138, 1152–1165. [Google Scholar] [CrossRef]
  13. Howe, D.; Nader, J.-R.; Macfarlane, G. Performance analysis of a floating breakwater integrated with multiple oscillating water column wave energy converters in regular and irregular seas. Appl. Ocean Res. 2020, 99, 102147. [Google Scholar] [CrossRef]
  14. Price, A.A.E.; Dent, C.J.; Wallace, A.R. On the capture width of wave energy converters. Appl. Ocean Res. 2009, 31, 251–259. [Google Scholar] [CrossRef] [Green Version]
  15. Esmaeilzadeh, S.; Alam, M.-R. Shape optimization of wave energy converters for broadband directional incident waves. Ocean Eng. 2019, 174, 186–200. [Google Scholar] [CrossRef] [Green Version]
  16. Zabihi, M.; Mazaheri, S.; Namin, M.M.; Mazyak, A.R. Irregular wave interaction with an offshore OWC wave energy converter. Ocean Eng. 2021, 222, 108619. [Google Scholar] [CrossRef]
  17. Gomes, R.P.F.; Henriques, J.C.C.; Gato, L.M.C.; Falcão, A.F.O. Time-domain simulation of a slack-moored floating oscillating water column and validation with physical model tests. Renew. Energ. 2020, 149, 165–180. [Google Scholar] [CrossRef]
  18. Elhanafi, A.; Macfarlane, G.; Fleming, A.; Leong, Z. Experimental and numerical investigations on the hydrodynamic performance of a floating–moored oscillating water column wave energy converter. Appl. Energy 2017, 205, 369–390. [Google Scholar] [CrossRef]
  19. Vyzikas, T.; Deshoulières, S.; Giroux, O.; Barton, M.; Greaves, D. Numerical study of fixed Oscillating Water Column with RANS-type two-phase CFD model. Renew. Energ. 2017, 102, 294–305. [Google Scholar] [CrossRef] [Green Version]
  20. Sarmento, A.J.N.A. Model-test optimization of an OWC wave power plant. Int. J. Offshore Polar Eng. 1993, 3, 1. [Google Scholar]
  21. Ferguson, T.M.; Penesis, I.; Macfarlane, G.; Fleming, A. A PIV investigation of OWC operation in regular, polychromatic and irregular waves. Renew. Energy 2017, 103, 143–155. [Google Scholar] [CrossRef]
  22. Vyzikas, T.; Deshoulieres, S.; Barton, M.; Giroux, O.; Greaves, D.; Simmonds, D. Experimental investigation of different geometries of fixed oscillating water column devices. Renew. Energy 2017, 104, 248–258. [Google Scholar] [CrossRef] [Green Version]
  23. Elhana, A.; Macfarlane, G.; Fleming, A.; Leong, Z. Experimental and numerical investigations on the intact and damage survivability of a floating-moored oscillating water column device. Appl. Ocean Res. 2017, 68, 276–292. [Google Scholar] [CrossRef]
  24. Cong, P.; Teng, B.; Bai, W.; Ning, D.; Liu, Y. Wave power absorption by an oscillating water column (OWC) device of annular cross-section in a combined wind-wave energy system. Appl. Ocean Res. 2021, 107, 102499. [Google Scholar] [CrossRef]
  25. Liu, C. A tunable resonant oscillating water column wave energy converter. Ocean Eng. 2016, 116, 82–89. [Google Scholar] [CrossRef]
  26. Wang, C.; Deng, Z.; Wang, P. Numerical Investigation of Dual-OWC-Devices System Composed by Offshore and Onshore Unit. In Proceedings of the 10th International Conference on Asian and Pacific Coasts, Hanoi, Vietnam, 25–28 September 2019; pp. 107–114. [Google Scholar]
  27. Mahnamfar, F.; Altunkaynak, A. Comparison of numerical and experimental analyses for optimizing the geometry of OWC systems. Ocean Eng. 2017, 130, 10–24. [Google Scholar] [CrossRef]
  28. Liu, Z.; Xu, C.; Shi, H.; Qu, N. Wave-flume tests of a model-scaled OWC chamber-turbine system under irregular wave conditions. Appl. Ocean Res. 2020, 99, 102141. [Google Scholar] [CrossRef]
  29. Viviano, A.; Musumeci, R.E.; Vicinanza, D.; Foti, E. Pressures induced by regular waves on a large scale OWC. Coast. Eng. 2019, 152, 103528. [Google Scholar] [CrossRef]
  30. Océanos y Mares de México. Available online: https://www.gob.mx/semarnat/articulos/oceanos-y-mares-de-mexico (accessed on 29 January 2021).
  31. Ley, J.; Moctar, O.A. A Comparative Study of Computational Methods for Wave-Induced Motions and Loads. J. Mar. Sci. Eng. 2021, 9, 83. [Google Scholar] [CrossRef]
  32. Le Roux, J.P. An extension of the Airy theory for linear waves into shallow water. Coast. Eng. 2008, 55, 295–301. [Google Scholar] [CrossRef]
  33. Elhanafi, A.; Fleming, A.; Macfarlane, G.; Leong, Z. Numerical energy balance analysis for an onshore oscillating water column–wave energy converter. Energy 2016, 116, 539–557. [Google Scholar] [CrossRef]
  34. Pond, S.; Pickard, G.L. Introductory Dynamic Oceanography, 2nd ed.; Elsevier Science: Amsterdam, The Netherlands, 2013; pp. 170–174. [Google Scholar]
  35. Carter, D.J.T.; Challenor, P.G. Methods of fitting the Fisher-Tippett type 1 extreme value distribution. Ocean Eng. 1983, 10, 191–199. [Google Scholar] [CrossRef]
  36. Harck Nørgaard, J.Q.; Andersen, T.L.; Burcharth, H.F. Distribution of individual wave overtopping volumes in shallow water wave conditions. Coast. Eng. 2014, 83, 15–23. [Google Scholar] [CrossRef]
  37. Mendez, F.J.; Losada, I.J. An empirical model to estimate the propagation of random breaking and nonbreaking waves over vegetation fields. Coast. Eng. 2004, 51, 103–118. [Google Scholar] [CrossRef]
  38. Sameti, M.; Farahi, E. Output power for an oscillating water column wave energy convertion device. Ocean Environ. Fluid. Res. 2014, 1, 27–34. [Google Scholar]
  39. Garrido, A.J.; Otaola, E.; Garrido, I.; Lekube, J.; Liria, P.; Mader, J. OWC wave power plants capture chamber modelling. In Proceedings of the OCEANS 2015—MTS/IEEE Washington, Washington, DC, USA, 19–22 October 2015; pp. 1–5. [Google Scholar]
  40. El Barakaz, A.; El Marjani, A. The oscillatory free water surface motion inside OWC chamber for wave energy conversion. In Proceedings of the 2016 International Renewable and Sustainable Energy Conference (IRSEC), Marrakech, Morocco, 14–17 November 2016; pp. 686–691. [Google Scholar]
  41. Sohoni, V.; Gupta, S.C.; Nema, R.K. A Critical Review on Wind Turbine Power Curve Modelling Techniques and Their Applications in Wind Based Energy Systems. J. Energy 2016, 2016, 8519785. [Google Scholar] [CrossRef] [Green Version]
Figure 1. On-shore oscillating water column (OWC) system location proposal in Ensenada City, Baja California. Adapted from Google Maps, 2021.
Electronics 10 00773 g001
Figure 2. Schematic of the on-shore OWC system.
Electronics 10 00773 g002
Figure 3. Irregular height wave interactions at the front wall of the chamber. The values for the Fisher-Tippett Type 1 are μ = 0.7 and σ = 0.2 .
Electronics 10 00773 g003
Figure 4. Irregular period waves interactions at the front wall of the chamber.
Electronics 10 00773 g004
Figure 5. Airflow speed results.
Electronics 10 00773 g005
Figure 6. Wind power results.
Electronics 10 00773 g006
Figure 7. Power output results.
Electronics 10 00773 g007
Figure 8. Overall power output results per annual period.
Electronics 10 00773 g008
Figure 9. On-shore OWC system location proposal and nearest distributed generation circuit in Ensenada City, Baja California. Adapted from Google Maps, 2021.
Electronics 10 00773 g009
Table 1. Numerical results of the power generated for different chamber dimensions considering the mean values of wave height and period.
ab υ t ( t ) kWkWh/dayMWh/year
5320 ± 0.250.432 ± 0.0159.77 ± 0.253.73 ± 0.12
10339 ± 1.103.11 ± 0.7168.21 ± 2.8325.91 ± 3.13
15358 ± 3.5214.40 ± 1.25316.12 ± 5.71110.65 ± 6.02
20365 ± 4.2226.55 ± 2.45557.55 ± 6.53167.26 ± 8.72
Table 2. Numerical results of the power generated for different chamber dimensions considering the probability density function of wave height and period.
ab υ t ( t ) kWkWh/dayMWh/year
5318 ± 2.250.470 ± 0.0688.70 ± 2.953.13 ± 1.02
10337 ± 3.103.01 ± 0.9865.32 ± 4.1323.19 ± 4.12
15356 ± 4.5113.20 ± 2.45310.21 ± 6.12108.13 ± 6.52
20361 ± 8.2224.66 ± 4.11547.51 ± 7.12160.61 ± 9.99
Table 3. Overall efficiency.
ab600 W Turbine25 kW Turbine
η O W C ( H ¯ , T ¯ ) % η O W C ( H , T ) % η O W C ( H ¯ , T ¯ ) % η O W C ( H , T ) %
5325.12 ± 1.1223.51 ± 1.923.21 ± 1.5222.53 ± 2.92
10324.84 ± 1.5124.14 ± 2.7222.82 ± 2.1122.11 ± 3.12
15324.33 ± 0.9522.31 ± 1.9922.01 ± 2.5121.18 ± 3.50
20324 ± 1.2221.56 ± 2.8521 ± 2.8220.69 ± 3.12
Publisher’s Note: MDPI stays neutral with regard to jurisdictional claims in published maps and institutional affiliations.

