Article

Low-Cost Electronics for Online I-V Tracing at Photovoltaic Module Level: Development of Two Strategies and Comparison between Them

by
José Ignacio Morales-Aragonés
1,
Sara Gallardo-Saavedra
1,
Víctor Alonso-Gómez
2,
Francisco José Sánchez-Pacheco
3,
Miguel Angel González
4,
Oscar Martínez
4,
Miguel Angel Muñoz-García
5,
María del Carmen Alonso-García
6 and
Luis Hernández-Callejo
1,*
1
Department of Agricultural Engineering and Forestry, Campus Universitario Duques de Soria, University of Valladolid (UVa), 42003 Soria, Spain
2
Department of Applied Physics, Campus Universitario Duques de Soria, University of Valladolid (UVa), 42003 Soria, Spain
3
Department of Electronic Technology, University of Málaga (UMA), 29071 Málaga, Spain
4
Department of Condensed Matter Physics, Crystallography and Mineralogy, Campus Miguel Delibes, University of Valladolid (UVa), 47011 Valladolid, Spain
5
Department of Agricultural Engineering and Forestry, Campus Ciudad Universitaria, Technical University of Madrid (UPM), 28040 Madrid, Spain
6
Photovoltaic Solar Energy Unit, Energy Department, Centro de Investigaciones Energéticas, Medioambientales y Tecnológicas (CIEMAT), 28040 Madrid, Spain
*
Author to whom correspondence should be addressed.
Electronics 2021, 10(6), 671; https://doi.org/10.3390/electronics10060671
Submission received: 15 February 2021 / Revised: 6 March 2021 / Accepted: 11 March 2021 / Published: 12 March 2021
(This article belongs to the Section Power Electronics)

Abstract

:
The measurement of current–voltage (I-V) curves of single photovoltaic (PV) modules is at this moment the most powerful technique regarding the monitoring and diagnostics of PV plants, providing accurate information about the possible failures or degradation at the module level. Automating these measurements and allowing them to be made online is strongly desirable in order to conceive a systematic tracking of plant health. Currently, I-V tracers present some drawbacks, such as being only for the string level, working offline, or being expensive. Facing this situation, the authors have developed two different low-cost online I-V tracers at the individual module level, which could allow for a cost-affordable future development of a fully automated environment for the tracking of the plant status. The first system proposed implements a completely distributed strategy, since all the electronics required for the I-V measurement are located within each of the modules and can be executed without a power line interruption. The second one uses a mixed strategy, where some common electronics are moved from PV modules to the inverter or combiner box and need an automated very short disconnection of the modules string under measurement. Experiments show that both strategies allow the tracing of individual panel I-V curves and sending of the data afterwards in numerical form to a central host with a minimum influence on the power production and with a low-cost design due to the simplicity of the electronics. A comparison between both strategies is exposed, and their costs are compared with the previous systems proposed in the literature, obtaining cost reductions of over 80–90% compared with actual commercial traces.

1. Introduction

The annual global market for photovoltaic (PV) solar energy has increased considerably in recent years. Specifically, in 2019, the figure of 100 GW was exceeded. The total accumulated capacity has been increased by 25%, reaching the value of 5785 GW. This supposes a substantial growth if it is compared with the 15 GW of the previous decade. The increased demand in emerging markets and Europe, due to a large extent to the continuous price reductions, has offset a substantial decline in the market in China that had consequences worldwide [1].
Self-consumption remained an important driver of the market for new systems distributed in some regions, and corporate purchases of PV solar energy expanded considerably, particularly in the United States and Europe. Around the world, mining, manufacturing, and other industries were installing PV (and other renewable) solar plants to supply power for their operations [1]. In the year 2018, investment was made in a new, more efficient production capacity and additional advances in solar PV technology. At the end of 2018, at least 32 countries had an accumulated capacity of 1 GW or more. PV solar technology played a significant and growing role in the generation of electricity in several countries, including Honduras (12.1%), Italy, and Greece (both around 8.2%), and by the end of 2018, one in five Australian households generated at least part of their electricity with solar PV [1].
In this scenario of the PV solar sector, it seems that the large production plants, as well as their energy production, will play a very important role. One of the major focuses of interest is the monitoring, inspection, and maintenance of PV solar plants, regardless of their power [2,3,4]. Operation and maintenance (O&M) are the main saving points for investors in solar PV, and for this reason, in recent years, there has been a greater emphasis on advanced techniques for PV systems design, operation, and maintenance [5].
PV power plants are exposed to numerous types of problems that can cause performance degradation due to elevated operating temperatures [6], but the main and most worrying are those related to PV modules and PV inverters, as concluded after the presentation of some research in which sixty-three real PV solar plants were analyzed [7]. Classically, there are numerous fault detection techniques for PV modules. Perhaps the most widely used method is infrared thermography (IRT), for hot spot detection [8,9]. Some authors use the thermographic images obtained by drones to subsequently use artificial intelligence systems for automatic fault detection [10]. Another important technique is based on electroluminescence (EL) images [11], where in some cases, low-cost systems are used [12], and in many cases, the use of drones is also possible [5]. All these techniques make an estimation of the type of faults from the images obtained.
Concerning the measurements in a module or PV plant, the I-V curves are the most interesting, since these curves provide accurate information about possible faults or degradation of the module or set of modules without the need of any estimation process [13,14]. Therefore, being able to have I-V curves of the individual modules allows decisions on the replacement of the specific faulty or degraded device. This decision is better taken based on a direct measurement than based on an estimation. Recalling the phrase by William Thomson Kelvin (Lord Kelvin), “if you cannot measure it, you cannot improve it”, it is critical to have actual measurements of PV systems, and if possible, at the PV module level.
The necessity of shutting down the PV plant area during the traditional I-V electrical inspection with commercial testers has led to an important reduction of the use of this technique applied to the module level. It is more frequently used at the string level, as it is much easier to disconnect the strings at the combiner boxes to perform the I-V curve tests than disconnecting each single module. In any case, the great workforce and time required for this traditional I-V inspection has been the reason for only checking a single percentage of the strings of the plants in the preventive maintenance plan performed nowadays by the operators, which is usually 5% of the strings per year [7,15,16]. Moreover, the identified underperforming strings with this methodology will have to be inspected afterwards to find the specific location of the defective modules. This subsequent examination has been traditionally done using manual thermography. As will be seen, the two proposed current–voltage (I-V) devices extremely facilitate this inspection in comparison with the commercial testers, performing online I-V curves and minimizing the workforce and the energy losses during the inspection.
There are many studies on I-V curve tracing systems in PV modules in the literature and several commercial testers. The different strategies are reviewed in this section. Some authors propose a monitoring system of a PV module based on a microprocessor where, in addition to the electrical parameters (V and I), the system measures irradiance and temperature [17], but it requires the module to be disconnected from the corresponding string.
In [18], an I-V tracer with a measuring strategy close to one of those proposed in this article is presented, but it is much more complex and expensive. It uses a relay to isolate the PV module under measurements from the string and connect it to the tracing device, and one minicomputer controls the entire system. Authors use the device to study the degradations of the PV modules (discoloration, cracks, and Potential Induced Degradation—PID) using the I-V curve.
Other authors propose an offline I-V curve tracer with extended capabilities that is able to trace I-V curves for a single PV cell [19]. This equipment provides great versatility, since it allows cell (or associations of them) traces to be made.
In [20], an inexpensive I-V curve tracer is presented. The device is based on an open-source platform with an integrated microcontroller, which allows electrical measurements and machine to-machine (M2M) communications.
Other authors present a portable I-V tracer for the characterization of PV modules outdoors [21]. The work is validated in a real environment, and this portable device is capable of making an I-V trace of a 6kV string.
There is a patent that proposes carrying out the I-V trace of a PV module, or a string, involving the PV inverter in the measurement and control [22]. The inverter has a first switch to disconnect its output from any device connected to it, a second switch to disconnect the input direct current (DC), and a discharge device to release any residual load in the input capacitor. The inverter also includes a voltage sensor and a current sensor on the DC side, as well as a data logger to record the I-V trace.
Another patent raises an I-V curve tracer through a fixed-value inductive or capacitive charging device [23]. The patent proposes the correlation between voltage and current samples using a voltage digital value as the address of a memory module and the current as the content of that address.
The patent in [24] also proposes a distributed online I-V tracer that includes an energy-storage device in order to keep the voltage supplied by the module under test while the measurements are made.
In recent years, some authors have done comparative work between different devices (commercial and ad hoc for research). Specifically, many devices, both commercial and research oriented, are presented in document [25]. Regarding those dedicated to research, the authors present five different methods: variable resistive load method, capacitive load method, electronic load method, four-quadrant power supply method, and DC–DC converter method. The authors create the following performance indicators: performance factor, deviation on critical points and full curve, fill factor, voltage and current ratio, and slope deviation. In this way, different devices can be compared objectively. The authors conclude that the DC–DC converter method shows the advantage of flexibility and effectiveness to synthesize the merits of fast speed, high accuracy, low-cost solution, and ease of control, but the high-frequency switching operation causes ripples and increases the difficulty of data acquisition. The dynamics of power converters also affect the operational speed for I-V curve tracing, but these issues can be overcome by improving power conditioners and control strategies. For all the methods analysed, the measurement points were unevenly distributed on the I-V curve, and the issue should be resolved to improve the acquisition accuracy and resolution.
An online I-V for a complete string is proposed in [26]. In this case, the proposed online I-V tracer topology does not require the plant to be brought offline to obtain the I-V trace. The circuit topology allows energy stored in the capacitor during the trace to be delivered to the load in the following state. The load does not experience any power interruption while the panels are isolated from the load during the trace. The circuit is retrofittable at the junction box level.
In summary, and after the analysis of the documents mentioned, it is possible to affirm that most of the proposed devices are quite invasive and time consuming, in the sense that in order to perform the measurements, it is necessary to disconnect the PV modules from the power line, and therefore, to interrupt the electrical circuit to the PV inverter, or they are complex and quite difficult to integrate in a real scenario because of its size, complexity, and cost. Therefore, research gaps have been identified. Then, the development and validation of low-cost, simple, and small devices that allow the layout of a PV module integrated into a power string, without the need to disconnect it (avoiding re-starting protocols and losses of production), seems a leap forward.
Often, solutions proposed in the research field for distributed monitoring and diagnostics, despite being fully operative, are difficult to be implemented in a real industrial environment because of their price.
A future commercial implementation of such a system depends strongly on the in-module electronics cost, since no monitoring and diagnostics system cost should represent a significant percentage of the module cost itself. For this reason, one of the main goals of this work is to obtain an electronic system that is not only able to accomplish online individual I-V tracings with quality but also to produce cost-effective hardware.
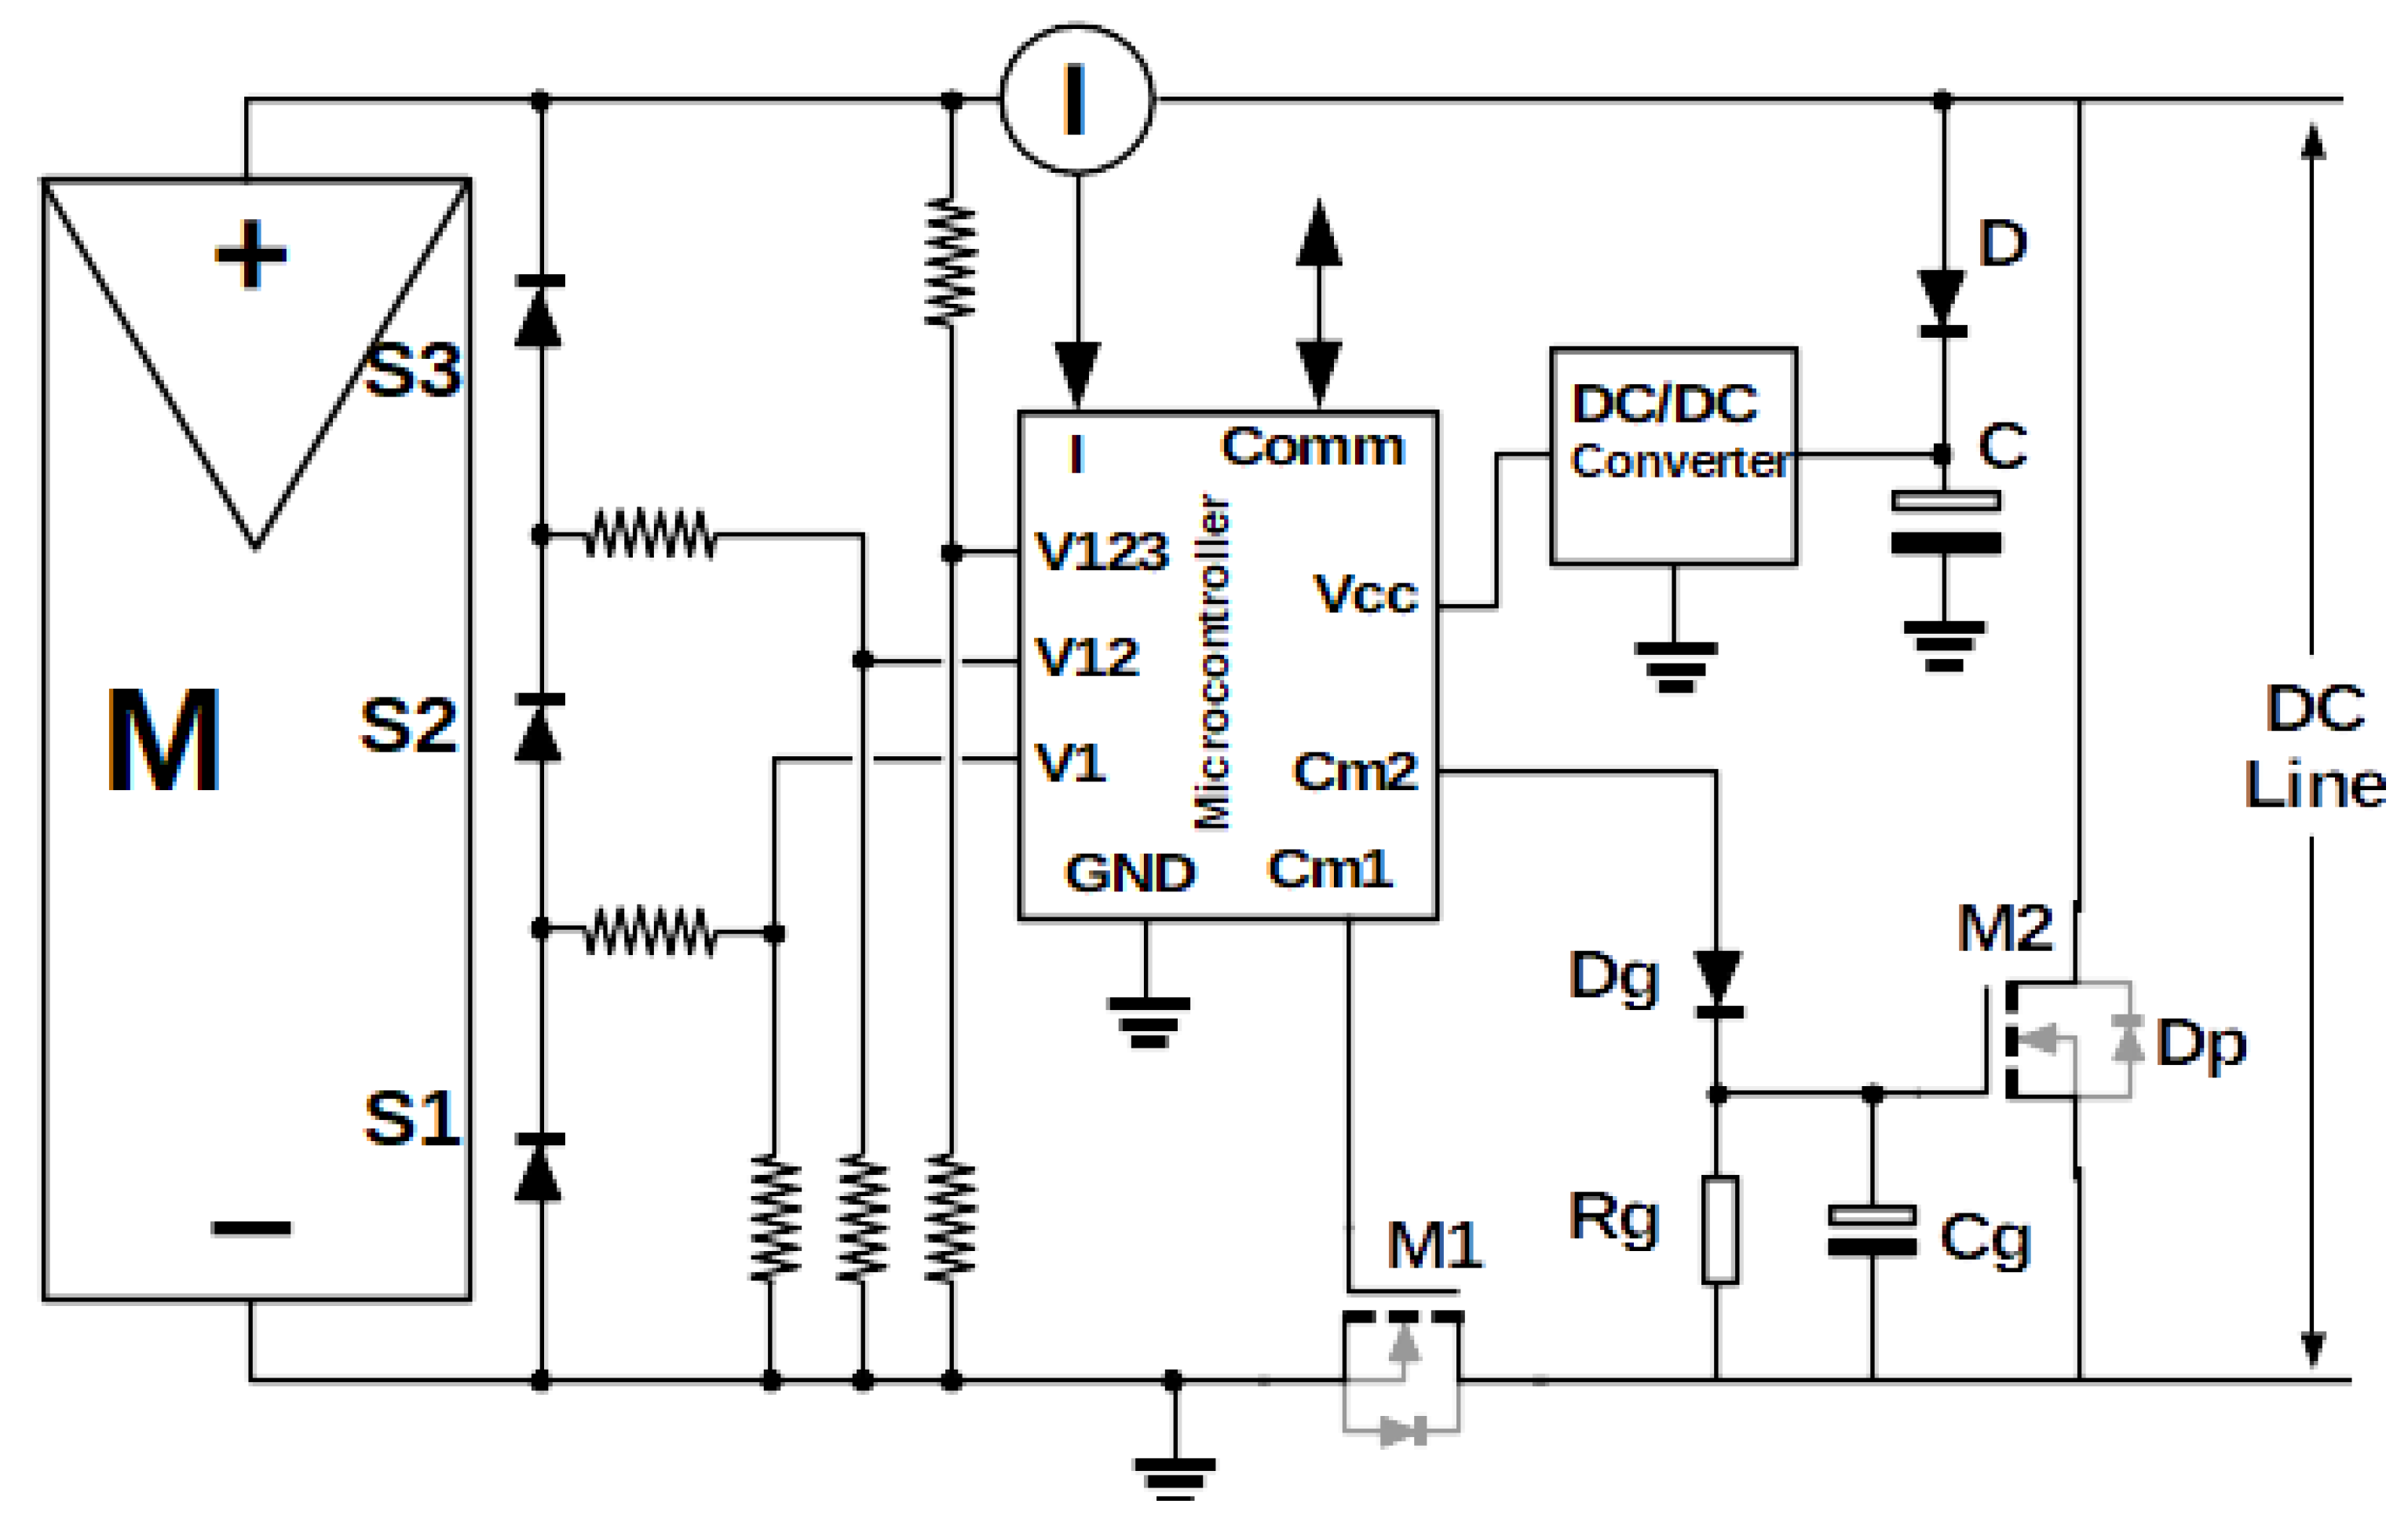
With the aim of improving the research gaps found, authors have developed and presented two different low-cost methods for performing not only individual I-V traces of the PV module but also concomitant measures of the partial voltages corresponding to the (usually three) substrings of the panel, each of them protected by means of a bypass diode, and all these measures being carried out online (without the need to disconnect the PV module from the string to which it is connected). The first strategy proposes installing a sweep block for each PV module (the authors propose calling this the distributed strategy), and a second one, installing a common sweeping block for all the modules composing the power string, which will be referred to as the mixed strategy.
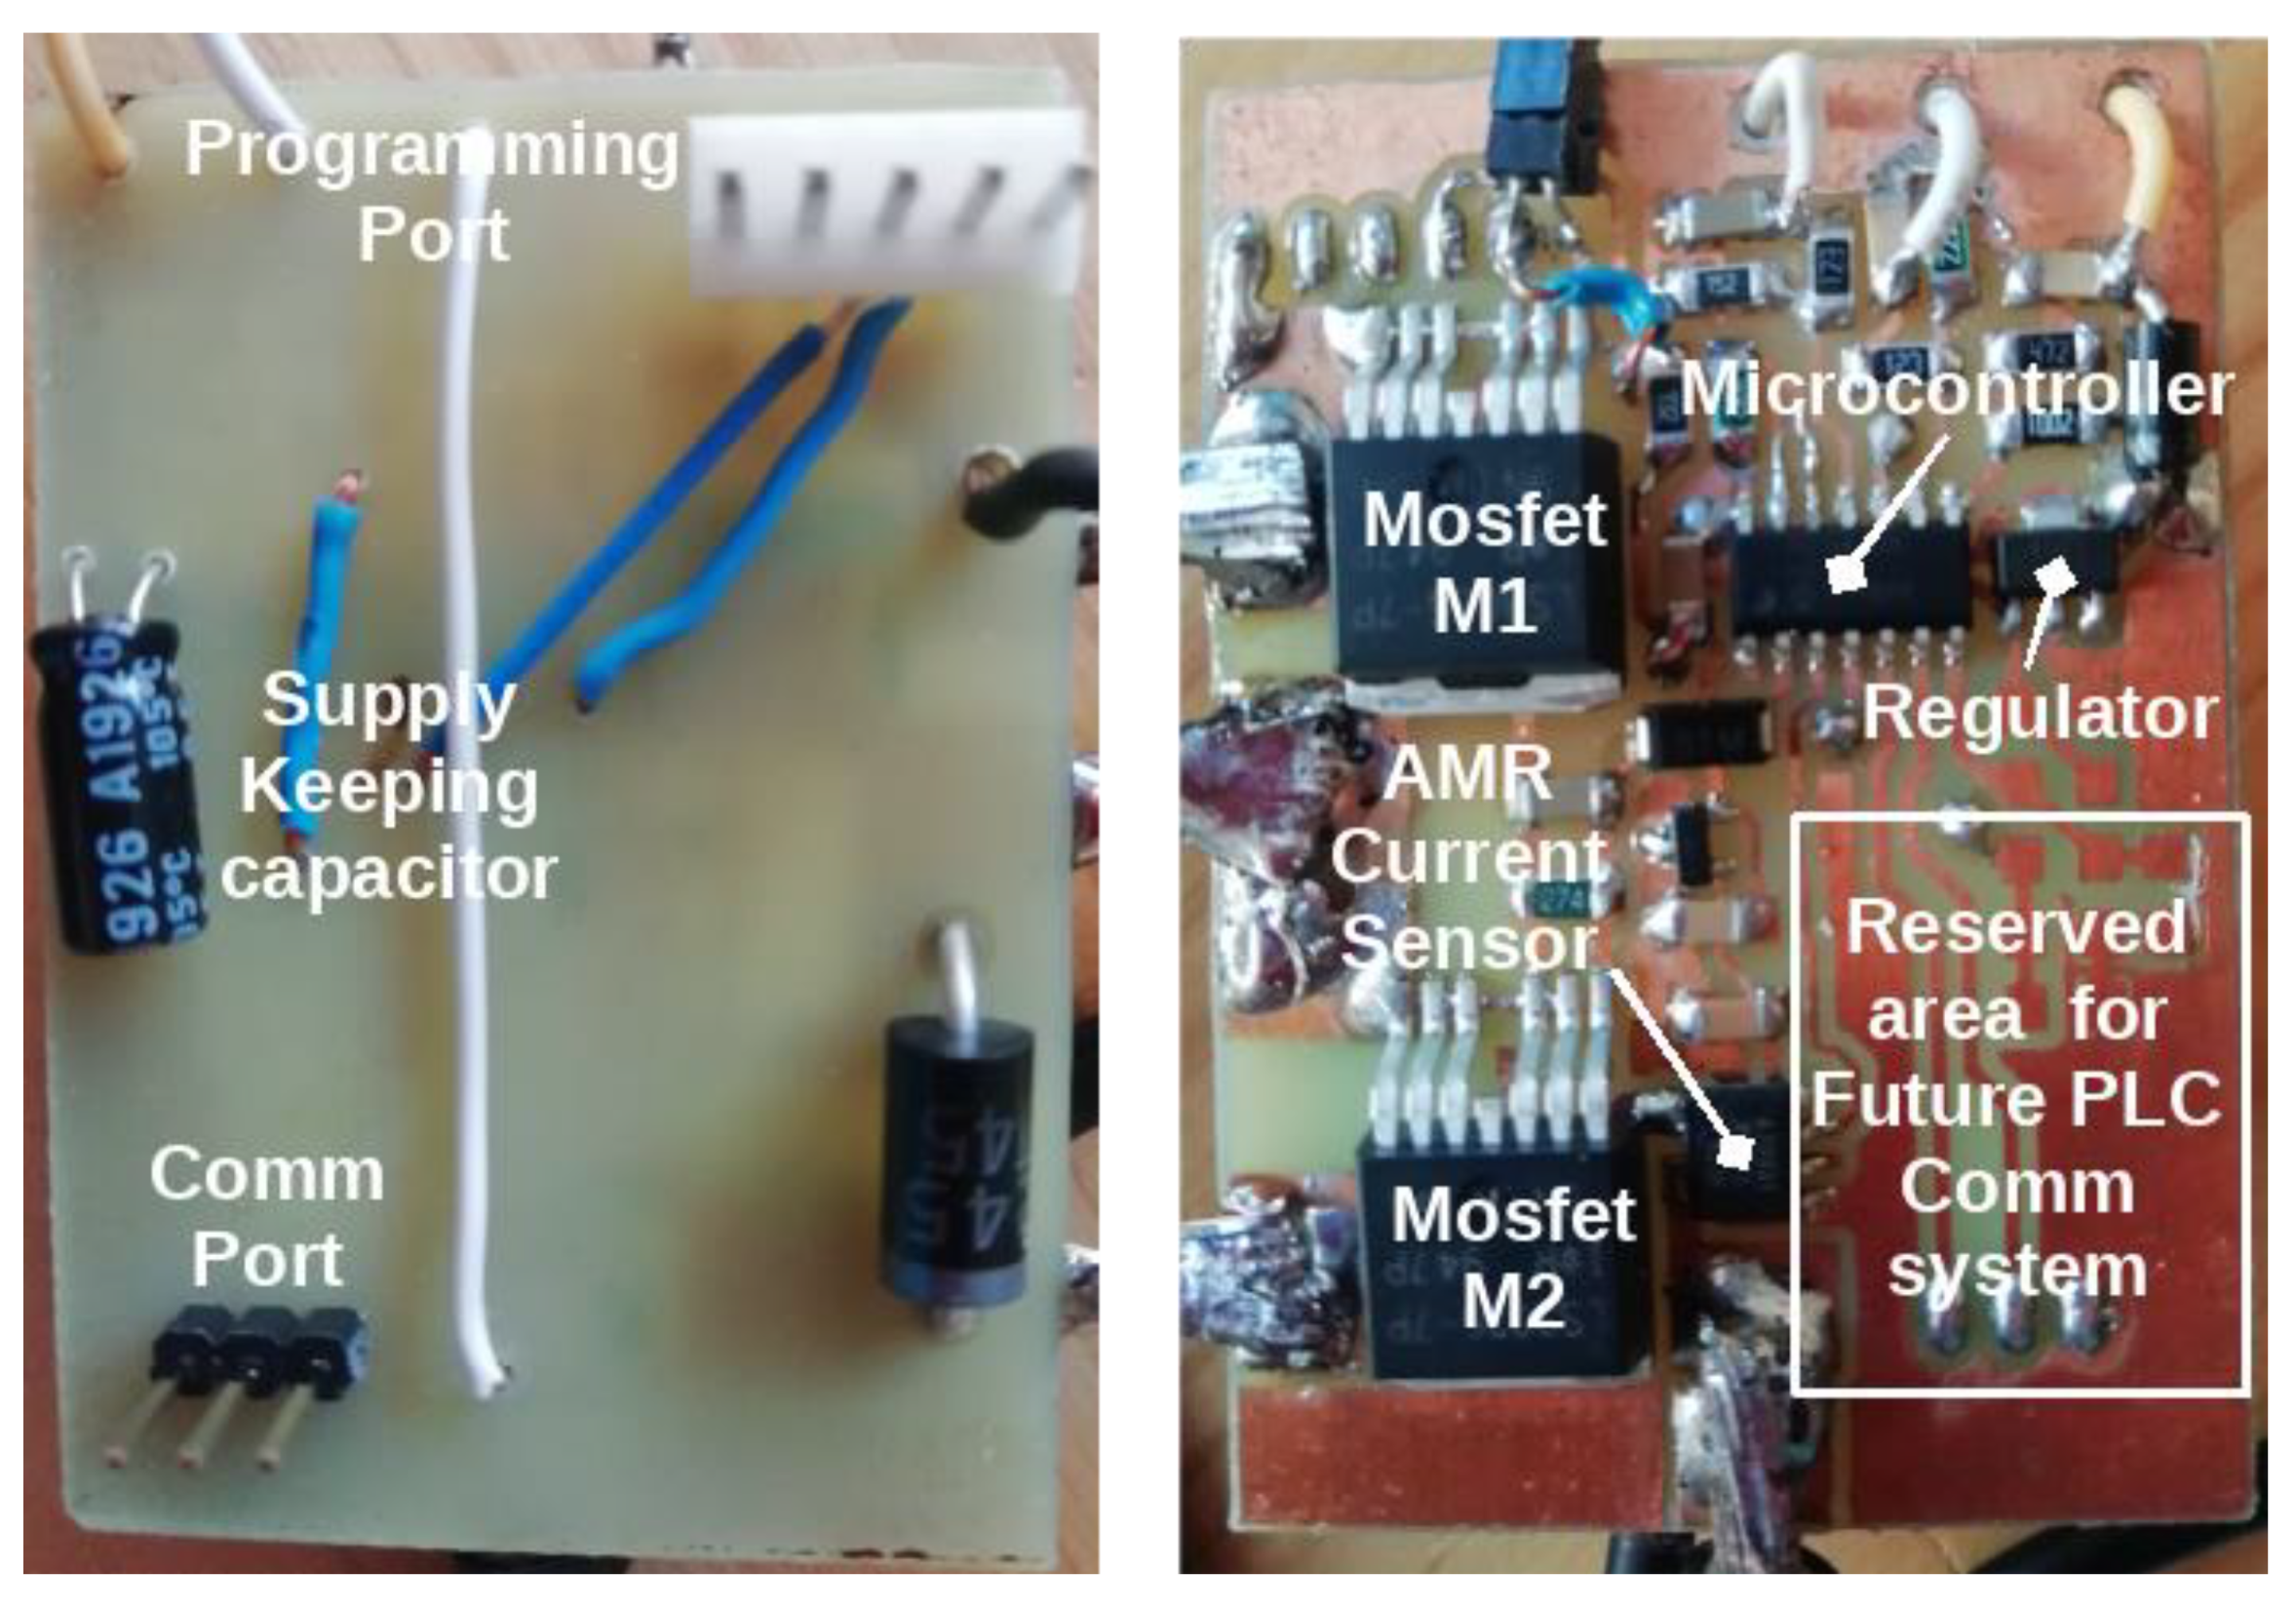
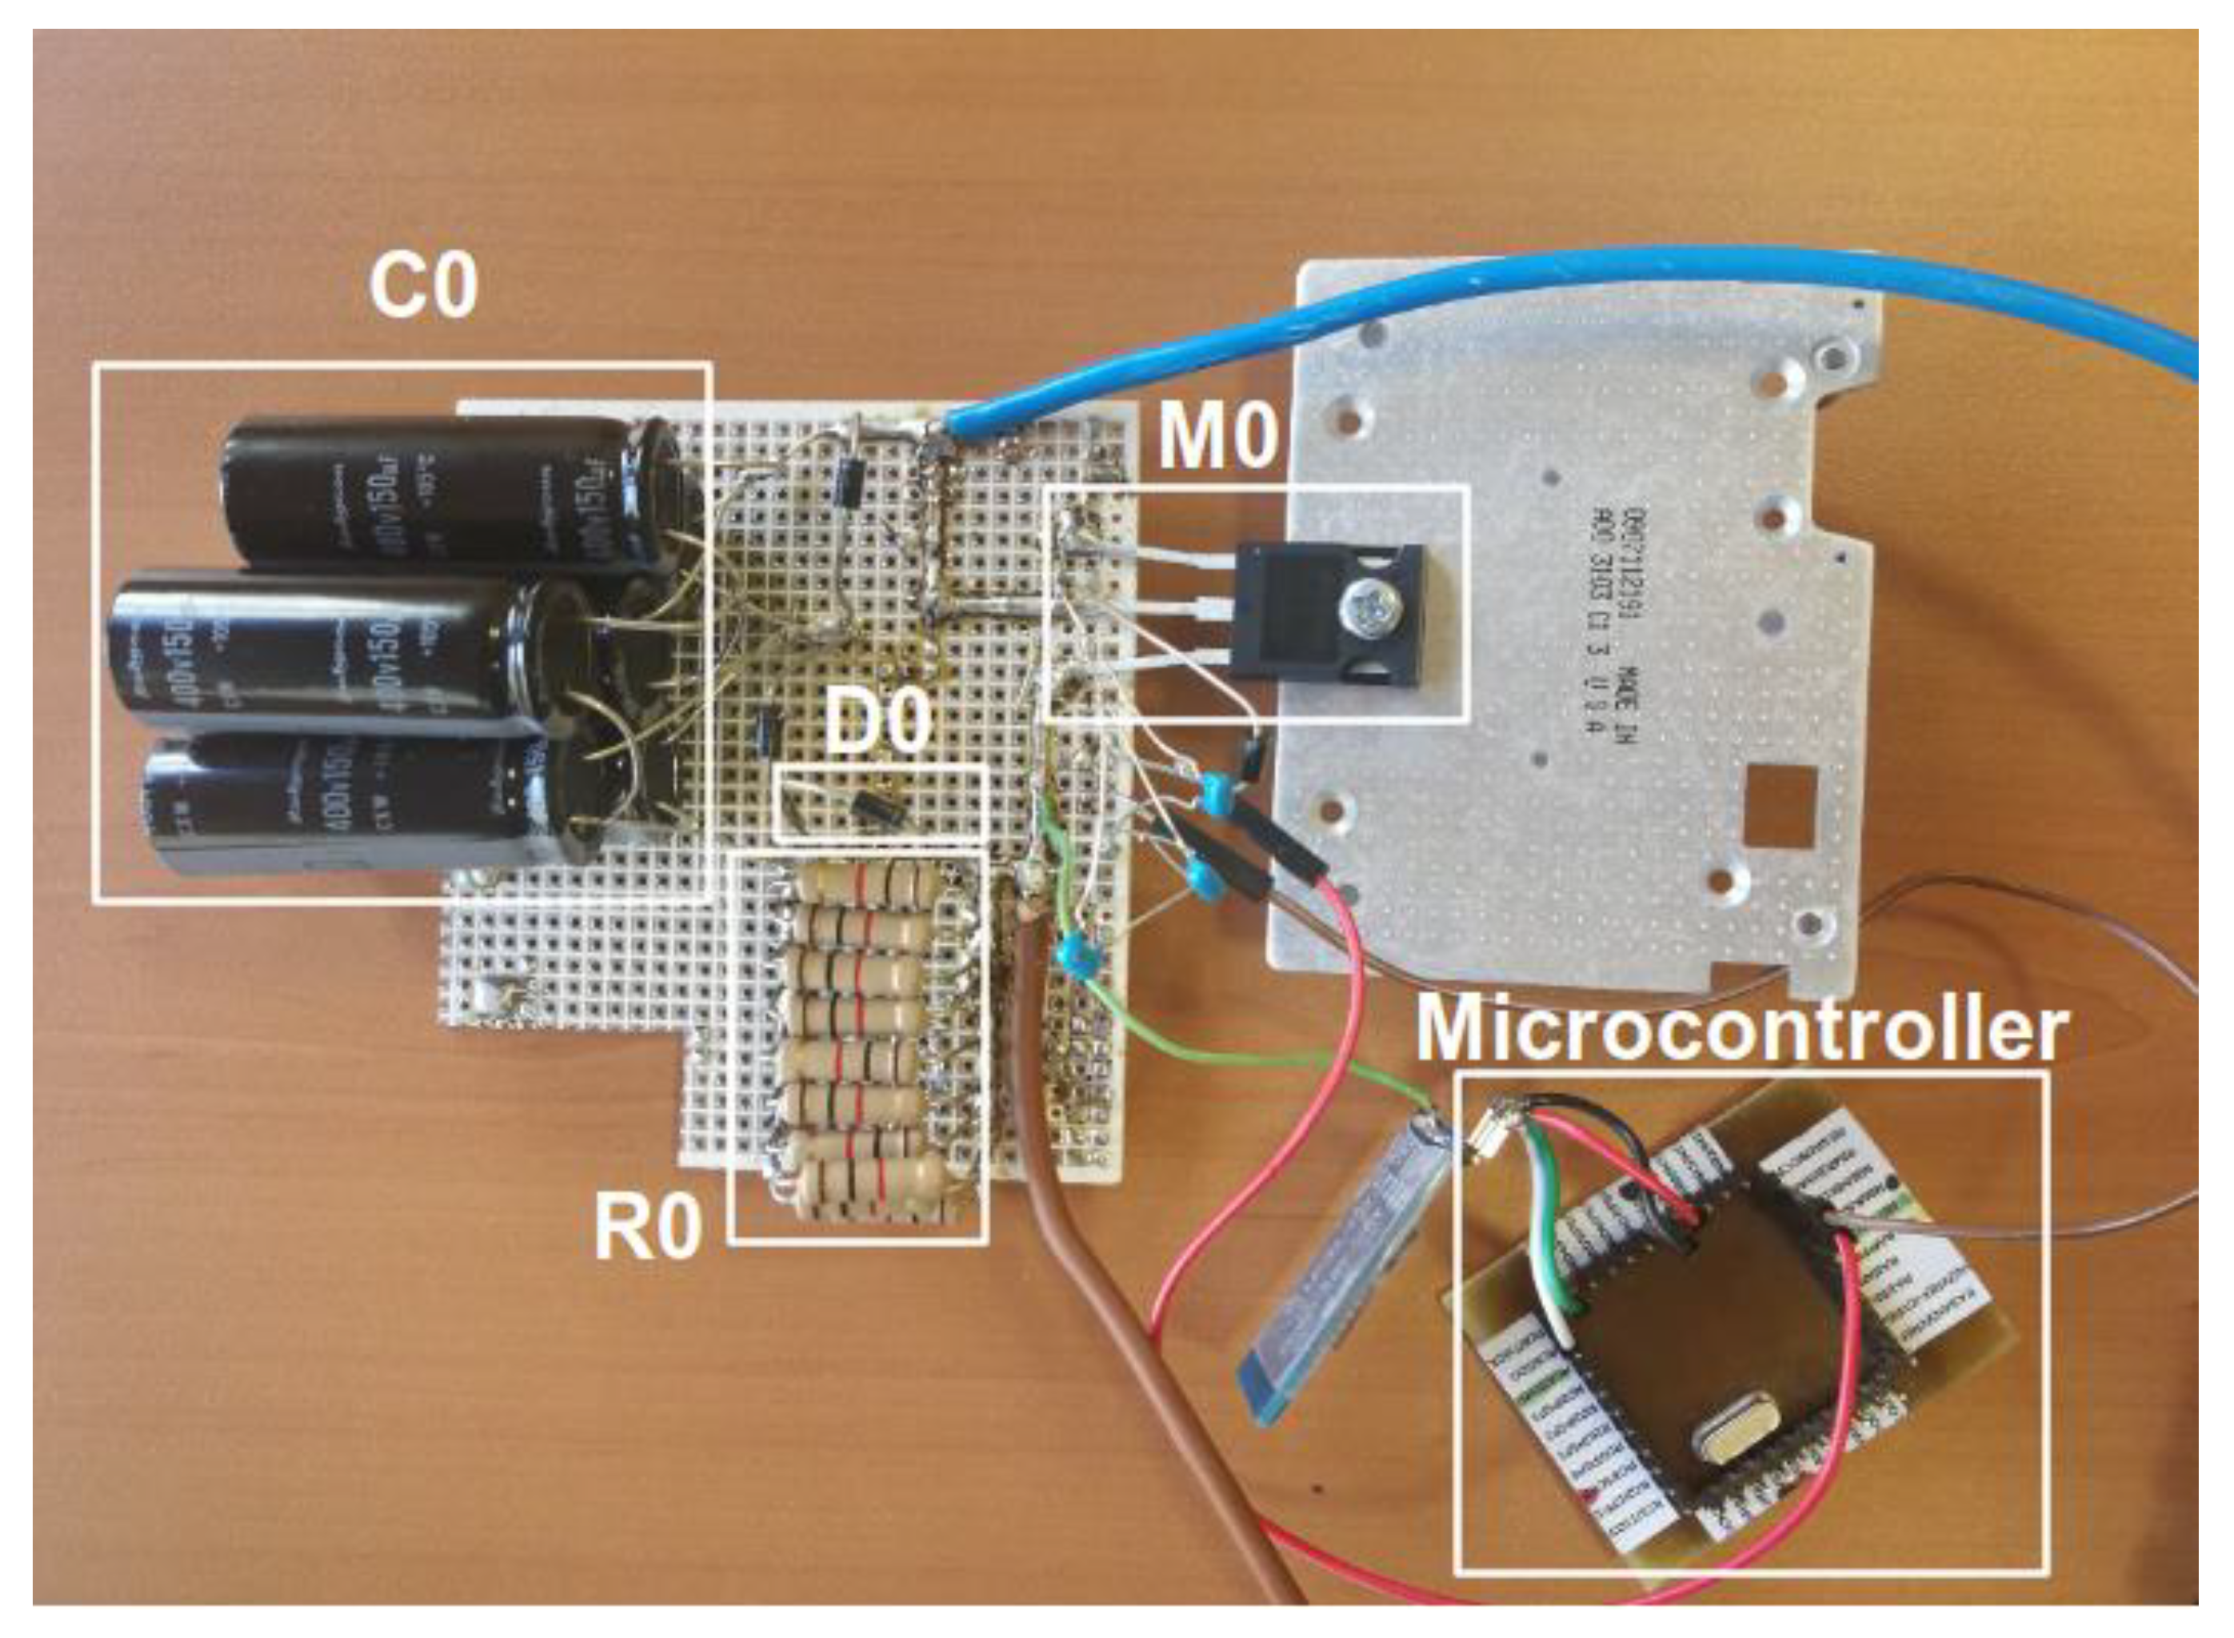
The main goal of both designs will be the low-cost and simplicity of the electronics, especially the ones installed within each module, due to its strong impact in the total cost of the system. Following this line, the authors have proposed the implementation of all the blocks previously mentioned (at least partially) with a low-cost 8 bit microcontroller. Of course, some extra external components will be necessary, but these will be only two inexpensive power MOSFET transistors, a linear voltage regulator, and a few passive components. For experiments, the communications block relies on a small Bluetooth module controlled via RS232 protocol from the microcontroller, but for the final version, our group is now developing a Power Line Communication protocol specific for PV wirings fully controlled in firmware from the same microcontroller, minimizing cost and complexity. Both developed strategies are compared with other actual I-V tracer devices regarding complexity, size, online or distributed measurement capability, power supply requirements, accuracy, resolution, and cost, with the objective of highlighting the relevance of the developed strategies.
As it will be detailed later, both methods have some advantages and drawbacks, and they will be suitable for different situations. In addition, this work has a second aim, which is to make a comparison between both methods presented, focusing on the advantages and disadvantages of each one of them.
The paper consists of the following sections: Section 2 presents the materials and methods used in the article; Section 3 presents the experimental results of the two models presented; Section 4 raises a discussion and comparison of both methods; and Section 5 shows the main conclusions and future work related to the research presented.

2. Materials and Methods

This section, the experimental setup used for validation is presented. Furthermore, the two strategies (distributed and mixed) are detailed and exposed.

2.1. Experimental Installation

The experiments have been carried out in the facilities of the Duques de Soria University Campus of the University of Valladolid, in Soria (Spain). The installation has three mini PV plants, all of them connected to independent grid-connected PV inverters. Specifically, the experience has been performed in one of the mini plants, consisting of 11 PV modules connected in series (string) to a 3 kW PV inverter. The nominal characteristics of the modules are shown in Table 1, and those of the inverter are as follows: Sunny Boy SMA SB3000, 3200 W, maximum voltage DC 600 V, maximum input current 12 A, MPPT number 1, maximum performance 95%, and single phase. Figure 1 shows a real photograph of the installation previously described.
Since this is an experimental PV mini plant, the modules have been intentionally installed with different kinds of degradation, failures, or performances, so it will be possible to check if the diagnosis system is able to properly show and locate any of them.
With the aim of comparing the measurements of the I-V curves of both proposed strategies, the experience has been completed with measurements of I-V curves obtained by a commercial tester. For validating the curves obtained from the two prototypes, the authors have used the commercial tester “Solar IV-e” from the manufacturer HT (ref. HT 0255) [27]. The curves from this commercial tester have been compared with the ones taken with the prototypes. Table 2 represents some of the main useful parameters that can be measured with this instrument.

2.2. Developed I-V Curves Strategies

PV module I-V characteristics tracing requires at least three basic electronics blocks:
  • A measurement and storage block composed of Analog to Digital Converters (ADCs) and enough memory to keep all data until they are transmitted out.
  • A sweeping block that forces the PV module to consecutive working points between the open circuit and the short circuit by means of any kind of variable load.
  • A communication block that takes generated data and transmits them to an external host.
If individual characteristics are desired to be obtained at the PV module level, the first and the third blocks must be installed within each PV module, but for the second block, the authors propose two possibilities: the obvious one, installing a sweep block for each PV module (the one the authors propose calling the distributed strategy), and a second one, installing a common sweeping block for all the modules composing the power string, which will be referred to as the mixed strategy. In both cases, the aim will be to obtain individual I-V curves for each PV module and even for the cells substrings.
While the so-called distributed strategy relies on some extra components in each of the module electronics in order to perform the load sweep, the second (mixed) strategy minimizes the electronic components at the module level and drives the load sweep from a centralized card for a complete series arrangement of modules. The second strategy requires synchronization between the electronics at the module level and the centralized sweep card via communications system.

2.2.1. Distributed Strategy

In order to implement this strategy, the electronic board installed on all the PV modules includes the sweeping electronics or variable load (the second block mentioned in the introduction). In the literature, there are several ways to perform the load sweep needed for the I-V tracing, but in our case, keeping in mind the low cost desired for the system, without disregarding the precision and linearity needed for the capture of samples evenly distributed along the curve, we have opted for implementing the variable load with a MOSFET whose gate is directly controlled by the microcontroller by means of a closed control loop implemented in firmware. This way, the complexity of the control relies on the firmware with a minimum hardware support.
This distributed strategy board, independently and individually, is responsible for making the I-V curve tracing process. The plant operator can request anytime an online individual measurement, and the electronic board will record the measurement for later download to an external host.
Regarding the distributed strategy, two options have been considered:
  • Disconnecting the module under measurement from the string while a bypass diode provides a path for the string current, performing the I-V trace, and reconnecting the module to the string.
  • Bypassing the module under measurement in the string by means of an electronic switch (MOSFET), performing the I-V trace, and reopening the bypass electronic switch in order to reinsert the module in the string.
Anyway, both strategies require two MOSFET models for proper tracing a full I-V curve (disconnection MOSFET and sweeping MOSFET in 1, and bypassing MOSFET and sweeping MOSFET in 2), so finally, the option adopted has been the second one, because in this case, no bypass diode is needed, minimizing the bill of components.
Figure 2 shows the circuit for the distributed strategy. It comprises a low-cost microcontroller, a DC/DC converter, a current sensor (I), two MOSFETs (M1 and M2), and a power supply holding circuit (diode D and capacitor C). In addition, the resistors used for voltage level adjusting in measurement are shown. The PV module is labeled as M (this module will be connected to the rest of the modules, forming a string of modules connected in series), and it is composed of three strings of cells S1, S2, and S3 connected in series. Bypass diodes within the PV module are also shown. All connecting points between each string are accessible, so it is possible to measure the voltages from the negative terminal to these points and to the positive terminal (V1, V12, and V123, respectively). These values allow us to determine the voltages corresponding to each string with simple subtractions.
The power supply needed by the electronics (5 V) will be supplied from the PV module (M) (usually 40–50 V); thus, a DC/DC converter will be needed in order to regulate the proper voltage. The input voltage for the DC/DC converter is obtained from the power supply holding circuit implemented with the capacitor C and the diode D, in such a way that when the PV module is short-circuited during an I-V tracing, the charge stored in C guarantees the power supply for the electronics until the end of the tracing, while the diode D blocks the discharge of C over the short-circuited module. The minimum value (Cmin) of capacitor C can be determined considering that the average current consumption of the circuit is about 30 mA, thus dV/dt = 0.03/Cmin V/sg. Since the typical short-circuit lapse is about 40 ms, dV = 0.03 × 0.04/Cmin volts = 0.012/Cmin volts, which represents the voltage decrement during the short-circuit. The typical module voltage is 45 V, and the minimum voltage needed at the DC/DC converter for proper operation is 6 V, so a maximum voltage drop of 45 − 6 = 39 V is acceptable. This leads us to a minimum capacitance Cmin = 0.012/39 = 307.7 × 10⁻⁶ F = 307.7 μF.
For the microcontroller, a low-cost 8-bit unit has been chosen. It has a 10-bit Analog to Digital Converter (ADC) integrated, and it allows at least four of the I/O pins to be programmed as analog input channels for the ADC: one for the current sensor (I) and three more for measuring the voltages at the PV module terminals (V1, V12, and V123). These four parameters can be measured in normal operation or synchronously with an I-V sweep performed through the two MOSFETs to obtain a full I-V characteristic of the module. The voltage level reduction needed to feed properly the ADC analog inputs (with a dynamic range from 0 to 5 V) is accomplished with simple resistor dividers, which are also visible in Figure 2. There are three main noise sources associated with this setup: thermal noise, interference noise, and quantification noise. The last one depends on the ADC resolution and the maximum dynamic range of the signals measured (adjusted with the resistive divisors in the case of voltages). For the module voltage, the resistor divider has been calculated for a full scale of 50 V, while the resolution of the 10 bit ADC is 210 levels, so the quantification noise has a maximum amplitude of 50/210 = 48.8 mV. Our direct measurements over the module with an oscilloscope show a composed noise (thermal + interference) with a maximum amplitude of 2 mV; thus, the main contribution to noise is the quantification one.
Regarding the current measurements, a sensor based on Anisotropic Magneto Resistive effect (AMR) has been used. This device supplies an output voltage proportional to the current across it. The model used has a measurement range of 0–5 A corresponding to an output voltage swing of 2 V. The manufacturer reports a maximum output noise of 4 mV, and in this case, the quantification noise is 2/210 = 1.9 mV, so the maximum noise amplitude is about 6 mV, corresponding to 6 mV × 5 A/2000 mV= 15 mA of current measurement noise.
For the commercial instrument (HT Solar I-V) used for validation, the manufacturer reports an uncertainty of 0.5% of full scale for voltage and current, which in turn means 25 mA for current measurements (with full scale of 5 A) and 250 mV for voltage measurements (with full scale of 50 V).
Since there is no time-critical operation in the firmware, for simplicity and cost reduction, the clock source for microcontroller is an internal precision oscillator at 16 MHz, so no quartz crystal is needed. The samples gathered during the I-V tracing process are stored in an internal RAM memory capable of keeping 1K words of 8 bits (8 Kbit). Since the samples from the ADC are 10 bits long, a compression process has been programmed in firmware to store a maximum of 660 samples that are 10 bits long (6.6 Kbit) when we take points with just a single sample for module voltage and a sample for current (curves with 330 points). If we want to take three voltage samples (including substrings) and a current sample, it is possible to store 792 samples 10 bits long (curves with 198 points). Finally, the microcontroller has also a Digital to Analog Converter (DAC) integrated in it that is capable of driving an output with 256 voltage levels (8 bits), which is intended for controlling the sweeping MOSFET (M1) gate and the sweeping process itself.
The I-V tracing strategy is executed by the microcontroller firmware as follows: In normal operation, the microcontroller drives MOSFET M1 closed and MOSFET M2 open. In this state, the module is connected to the DC line as usual. When an I-V tracing is demanded, the microcontroller closes M2, forcing the module to short-circuit. Then, a load sweep is started, controlling the gate voltage of M1, and the module is driven from the short-circuit to an open-circuit configuration. Simultaneously, measurements of the current and the three voltages are taken and stored in the microcontroller. Finally, M1 returns to an ON state, and M2 is opened, getting back to normal operation.
The proper control of the M1 gate in order to perform a load sweep as linear as possible is a key point for obtaining measuring points as evenly distributed as possible. In our case, we have used a closed control loop where the values of current and voltage sampled by the ADC are used as feedback to vary the gate voltage of M1 via the Digital to Analog Converter (DAC). Figure 3 shows a schematic of the closed control loop.
This configuration allows control to rely on the firmware programmed within the microcontroller, and this way, all the control loop parameters affecting the linearity of the sweep and stability can be programmed and tuned via microcontroller firmware. The algorithm programmed in firmware for the proper control of the sweeping process is shown in Figure 4. The sweep starts with the module in short circuit, and the maximum gate voltage of M1 (5 V). First, the gate voltage of M1 is lowered in a previously fixed quantity (step); then, the ADC takes samples of module current and voltage, obtains the increments with respect to the previous values measured, and compares these increments with some fixed thresholds (one for current and one for voltage). If any of the increments (V or I) is over the corresponding threshold, these last values measured are stored, and a new measure is taken; otherwise, a new step down in gate voltage is performed followed by a time delay. As our experiments have evidenced, adjusting the four parameters of the algorithm (gate voltage step, time delay, voltage threshold, and current threshold) allows the control of the sweep in the upper part of the I-V curve (where variation is mainly observed on the voltage and current variations are very small), but also in the right part of the I-V curve (with the opposite behavior, main variation in current and little changes in voltage), resulting in evenly distributed I-V points along all the curve, regardless of the section that is being traced.
During the I-V tracing process, the string production current externally fixed by the inverter always has a path to flow: through the module under measurement while storing the I-V points with a current value over the string current or through the protection diode inside MOSFET M2 (Dp). Figure 5 shows the current distribution in every phase of the I-V tracing process:
A.
In normal work, the string current flows across the module (Figure 5A).
B.
When a tracing is started, MOSFET M2 pushes the module to short-circuit, so the total current across it equals the short-circuit current (Isc), which is bigger than the string current (Figure 5B). In this phase, the string current keeps flowing across the module (blue line in Figure 5B), and the difference between Isc and the string current flows through M2 in the direction shown by the red line in Figure 5B (downward).
C.
In this phase, the load sweep has started reducing the current across the module, but the module current is still bigger than the string one, so the M2 current is reduced, but it keeps its direction downwards (red line in Figure 5C).
D.
In this phase, the sweeping process continues, and the module current has become smaller than the string current, so in order to keep the value of the last one, the M2 current direction is inverted, flowing now across the protection diode inside it. This way, the string current splits in two branches: across the module, and across the M2 protection diode, as shown in Figure 5D.
When I-V tracing is over, the system returns to the normal configuration in Figure 5A.
In order to drive the M2 gate properly with logic levels from the microcontroller, a special circuit has been designed. The current between the Drain and Source pins of the MOSFET in the active zone depends mostly on the Gate to Source voltage (Vgs). When in normal operation M1 is closed, the source pin of M2 is at ground potential, and the microcontroller output voltage Cm2 will drive M2 to the on state.
However, when M1 is opened later, the voltage in the M2 source pin rises over the ground potential, and the Vgs voltage will vanish or even turn into a negative value, making it impossible to keep M2 in an on state.
To overcome this issue, a gate driver circuit has been designed. It comprises a diode (Dg), a capacitor (Cg), and a resistor (Rg), which are connected as shown in Figure 2. With this arrangement, when M1 is closed, a high output level from the microcontroller will charge the capacitor Cg connected between the source and gate of M2 through the diode Dg. This capacitor will keep the voltage Vgs of M2 regardless of the voltage rise of the M2 source when M1 is opened. Diode Dg blocks the condenser discharge through the microcontroller output and protects it from the voltage rise. In this situation, M2 will remain in an on state as long as Cg holds enough gate voltage. Then, the only path to condenser discharge is the parallel resistor Rg, so by adjusting the discharging RC constant of Cg and Rg, it is possible to keep M2 in the on state for a long enough time for the I-V trace to complete.
The effect of the I-V tracing strategy over the DC line is a voltage drop of 1/N × 100% during the short time taken by the tracing (about 40 ms in our case), with N = number of PV modules associated in series within the power line. If N is big enough, the voltage drop will be small in percentage, and the inverter will manage to keep on operating, allowing the capture of I-V curves for individual modules without interrupting the power production and with a negligible loss or energy. The I-V data stored numerically in the microcontroller must be downloaded after the capture through a communications port. For our experiments, we have used a USART integrated in the microcontroller connected to a Bluetooth radio device as a communication system. This is a convenient way to test the boards, but following the low-cost philosophy of our system, a specific Power Line Communications (PLC) system is being developed now as part of this project. Figure 6 shows the picture of the electronic board installed in PV modules for the distributed strategy.

2.2.2. Mixed Strategy

Regarding this second strategy, an electronic card is installed in every PV module as well, but the components dedicated to forcing the I-V sweep and the current measurement are moved to a central card, which is common for a series arrangement of PV modules (string), and in this way, the sweep operation will affect all the PV modules in the string simultaneously. For the experiments, we have used the same boards used in the previous strategy but reprogrammed to just take measurements and manage communications. In a commercial application, the same module board design can be used, but to get a lower cost, the installation of the sweeping components could be avoided.
In this case, the measurement process will be as follows: when an I-V tracing is demanded, the central electronic card disconnects the string from the DC power line opening the switch Sw (Figure 7) and sends a start signal to the individual PV module cards via the communication system; then, an I-V sweep begins and, simultaneously, string current measurements (via sensor I in Figure 8). When the start signal from the central card is received by the PV module cards, these begin capturing voltages in such a way that sweeping and sampling are synchronized. In order to stop the capturing process in the PV module cards, the end of the sweep could be detected either by the absence of changes in successive samples or by fixing a capturing/sweeping time from the start point. Of course, this strategy requires proper coordination between the centralized card and the decentralized ones. When the measurement is finished, the central card reconnects the string to the solar plant by closing the switch Sw, as shown in Figure 7.
For this mixed strategy, the sweeping circuit must manage voltage values corresponding to the whole string modules arrangement (typically 400–800 V), so the previous implementation with a sweeping MOSFET whose gate is controlled will require a high power MOSFET, which in turn means expensive devices requiring some kind of cooling system. For this reason, in this case, a capacitive load-sweeping element has been chosen.
The circuit has been implemented by means of a high-voltage MOSFET switch (M0 in Figure 8) in parallel with a high-voltage capacitor (C0 in Figure 8) and a microprocessor capable of controlling the M0 gate, measuring the string current, and managing communications. For the reason explained above, the MOSFET will work in a low-power dissipation switch mode (on/off). Figure 9 shows a real picture of the common sweeping electronics.
In normal operation of the PV plant (production), the capacitor C0 is charged up to the power line working voltage. When an I-V trace is demanded and the switch Sw is opened (Figure 8), the capacitor voltage rises up to the open circuit string voltage. Then, the first step is closing M0 for discharging C0 and driving the string to short circuit. From this point, the microprocessor sends the start signal, reopens M0, and the charging process of the capacitor performs the I-V sweep. Caution must be taken during the capacitor discharge process, because just after closing M0, a high initial discharging current will flow through the MOSFET at the same time as the voltage is maximum. This means very high instant power dissipated by M0, which could destroy it easily. For this reason, a high-power resistor (R0) has been placed in the discharging way, so that R0 will dissipate the energy stored in the capacitor properly, thus protecting the MOSFET from damage. The diode D0 bypasses the resistor during charging in a way that R0 does not interfere with the sweep process.
This centralized card is also responsible for string current measurements during the I-V sweep via current sensor I in Figure 8. Placing the current sensor here helps minimize the components in individual PV module cards. Of course, it is quite important for the current measurements to be properly correlated to the corresponding voltage measurements in PV module cards. This will be guaranteed by the microprocessors firmware using synchronization signals via communications system, which in conclusion will allow the proper drawing of the I-V curve.
A possible issue due to the asymmetry of the PV modules composing the string must be considered for this sweeping strategy: when the complete string is pushed to short circuit, differences in the module efficiency or even local irradiance changes will result in the fact that not all the PV modules will reach the zero voltage point. Those with better characteristics will keep a residual voltage, while the worst ones will become dissipating charges with the module bypass diodes in the forward state. Considering that the total sum of residual direct voltages and dissipating voltages must be equal to zero when the string is in short-circuit, the maximum residual direct voltage corresponds to the (unlikely) situation where only one module acts as a generator while all the rest are charges. The maximum residual voltage measured in our experimental plant when the complete string is in short-circuit has been 6V, with a mix of modules of different aging and several faults.
This issue results in some module I-V curves not reaching the current axis (zero voltage point) when the mixed strategy is used. This is not a severe limitation, because it is feasible to make a good extrapolation in this section of the curve in order to complete it, and furthermore, the incomplete curves will correspond to the modules with the best performance characteristics, which in conclusion are the ones with no need of extra diagnosis.
This second strategy has been conceived as an option for reducing the cost of the system in those situations where a short disconnection of an entire string is acceptable, such as for example in big solar plants with many strings where power production does not depend on a single string. Energy losses per module as a result of I-V tracing are approximately equal to those derived from the distributed strategy, but in this case, the data acquisition is much faster because the whole string is measured at a time.

3. Results

For validating the curves obtained from the two prototypes described above, the commercial tester “Solar IV-e” from manufacturer HT (ref. HT 0255) has been used. The curves from this commercial tester have been compared with the prototype’s ones.
Measurements have been made in our local plant for the two strategies described before, and in order to validate the resulting I-V curves, measurements have been carried out successively with our prototypes and with the commercial tester.
Every measurement has been made in the same conditions for which each device has been intended, that is to say:
  • With the module disconnected from the string for the commercial tester measurements,
  • Under production with the prototype card connected to one module within the string, and the string connected to the inverter for distributed strategy,
  • Over the whole string (11 modules in series) disconnected from the inverter for the mixed strategy.
These prototypes aim at being able to get the same I-V characteristics under their own operating conditions as the commercial instrument does over an isolated module.
The time between the prototype and commercial tester measurements has been reduced as much as possible, and measurements have been performed in the central hours of a clear day, so they should be taken under the same irradiance and temperature conditions. Irradiance and temperature have been recorded for every measurement and checked out to be equal (within a 1% difference between the commercial tester and the prototype) for the same module. This way, a good comparison can be made between the commercial tester and prototype measurements.
In Table 3, the irradiation level, ambient temperature, and module temperature conditions in which the measurements have been taken are shown.

3.1. Distributed Strategy Results

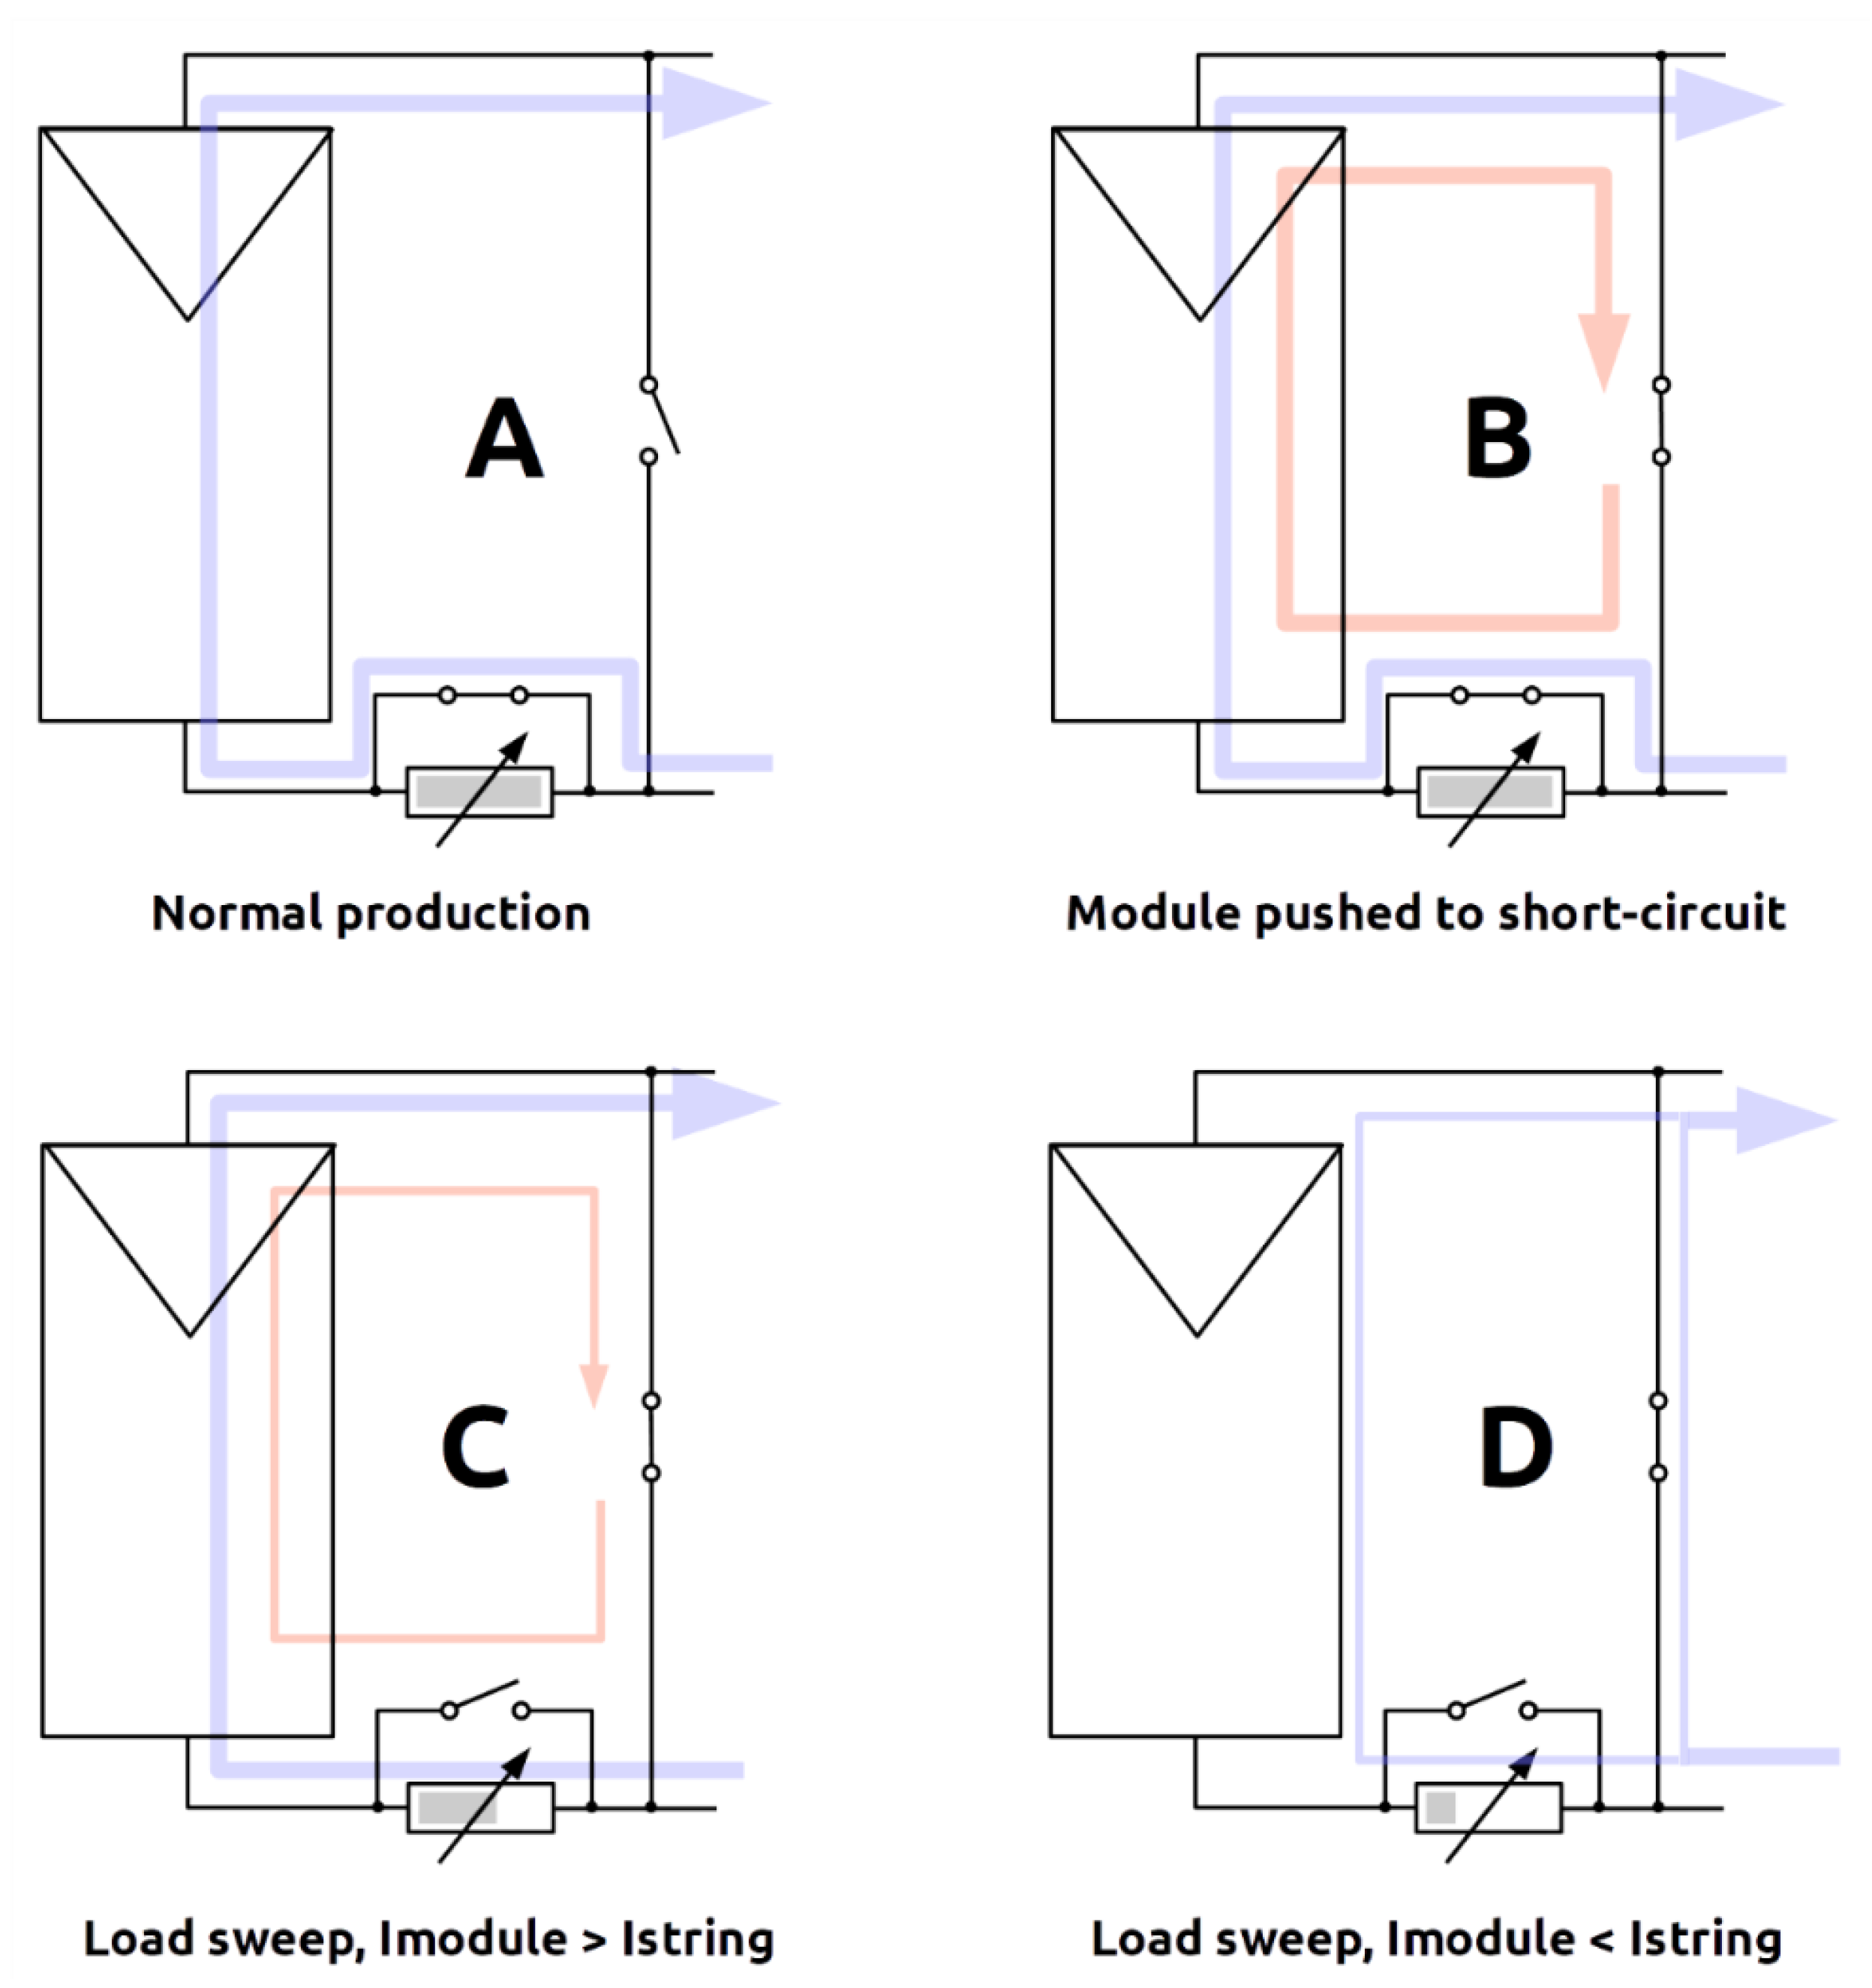
The electronics corresponding to the distributed strategy have worked as expected when an I-V tracing was demanded over one of the eleven modules forming the string of our mini-plant. The short voltage drop (during about 40 ms) was overcome by the power inverter without any power interruption. In our experiments, the string voltage drop was about 9% of the nominal value (one module shorted among eleven), which is close to a typical ratio in power plants. The low-pass filtering associated with the wiring inductance and the usual capacitive input stage of the inverters allow this strategy to work properly without the need of any storage device supplying energy during the measurement lapse, such as the one proposed in reference [24]. This is a key point to keep the electronic cost at its minimum, as the storage device (battery or condenser big enough) will have a price over the total cost of the whole card without it.
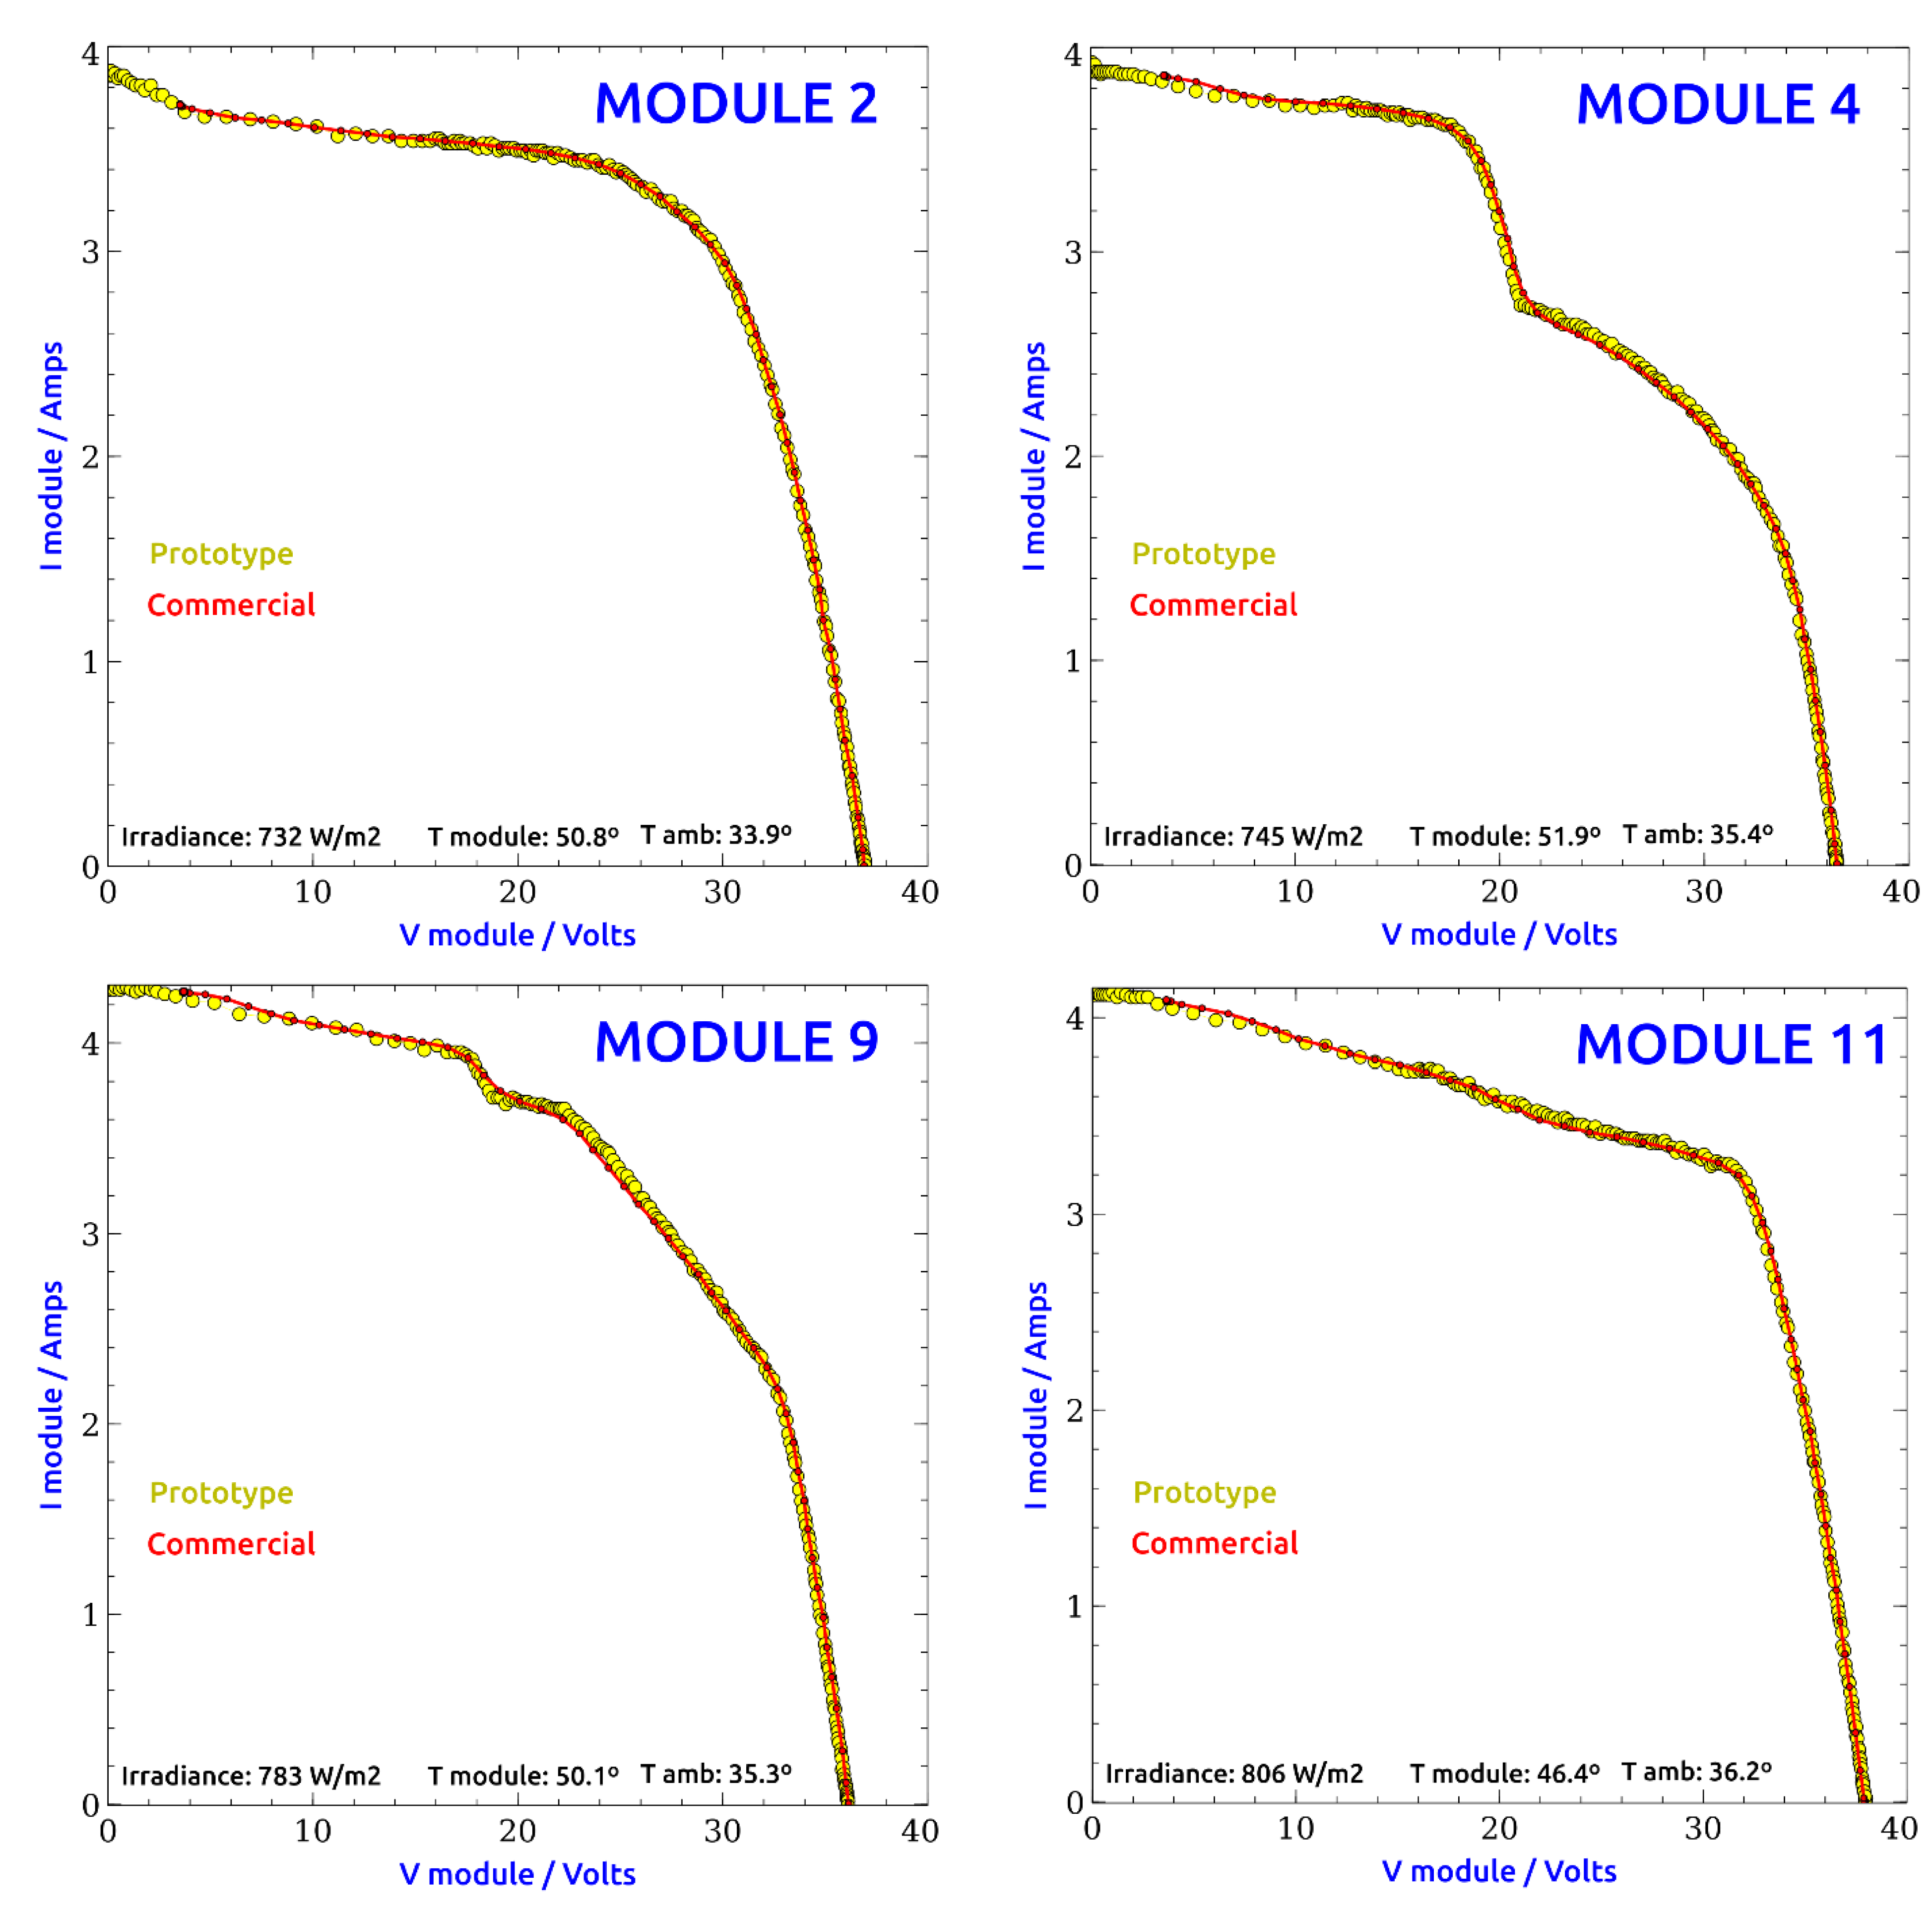
Figure 10 shows the most representative I-V curves obtained with the distributed strategy compared with the commercial tester ones. Each graph displays dashed yellow curves corresponding to RAW data from the prototype and continuous red curves with data points superimposed for commercial tester data.
The measurements have been carried out in our experimental plant, always with the string under production, over each of the modules composing the string. The modules in our plant have quite different performances, and several of them show different kinds of faults, resulting in a variety of curve shapes. Representative curves of modules with different types of faults and faultless ones are shown.
The fit between the commercial tester curves and the prototype ones has been evaluated by calculating the orthogonal distance between them. This led us to deviations lower than 0.5% except for the first sample from the commercial tester next to the short circuit. In this zone, next to the short circuit point, all the curves from the commercial tester show a straight segment between the first and second samples that is almost 3 V apart. The first sample from the commercial tester seems to be always misaligned with the prototype curve (sometimes over, sometimes under it), and direct measurement of the short circuit current corresponding to each curve shows that the current value from the prototype is the correct one. For this reason, this first sample has been discarded when comparing the curves, and the orthogonal deviations between prototype and commercial tester are kept within 0.5%. This percentage is the same as the uncertainty reported for the commercial tester, and it is small enough for diagnosis and monitoring purposes.
As shown in the graphs, the resolution along the prototype curves is higher than that from the commercial tester except for a short segment between 5 V and 14 V, where both resolutions are approximately equal. Regarding the resolution, it must be noted that the commercial tester takes 150 points/curve, but our prototype takes 330 points/curve. This reduced resolution of the prototype in the mid-early section of the curve is due to the fact that the firmware-controlled control loop (needed for performing the load sweep) takes some time to lock the desired voltage/time slope, as a consequence of the limited processing speed of the ultra-low-cost microcontroller used. Anyway, the resolution next to the short circuit point is as high as that out of this mid-early zone, allowing for a good determination of module parameters that very much depend on those next to the short-circuit zone.

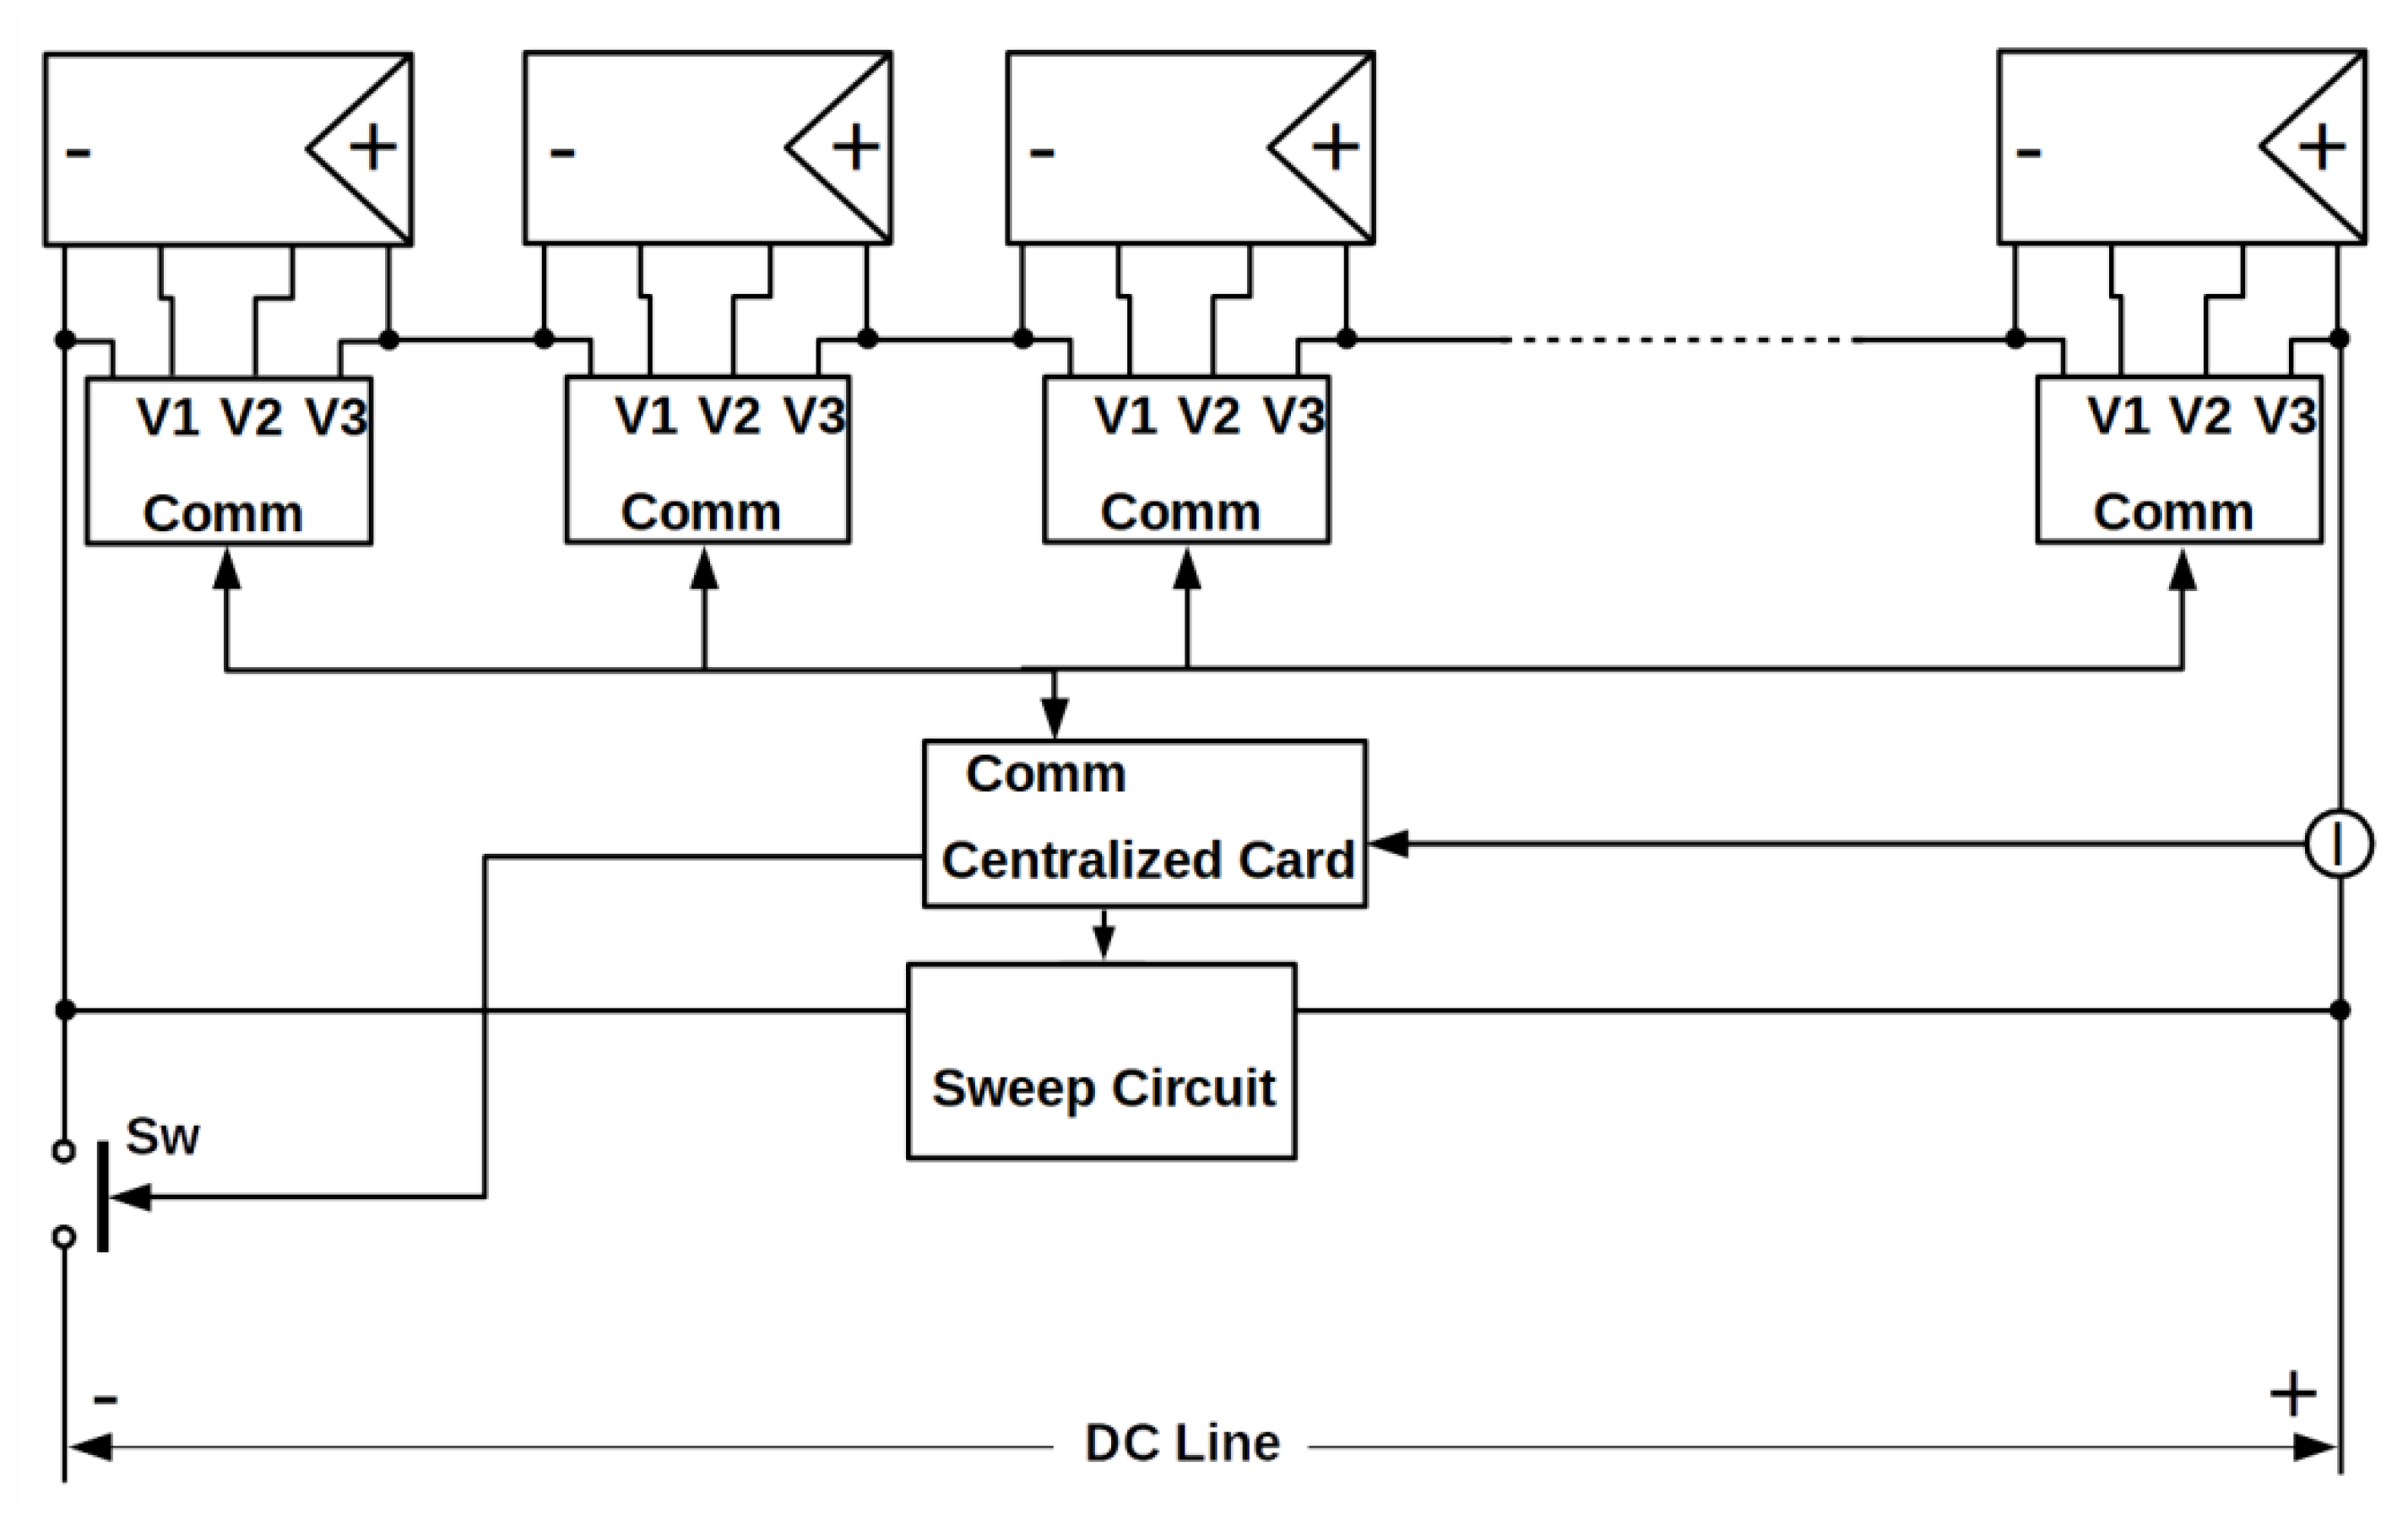
3.2. Mixed Strategy Results

The system using the mixed strategy has also worked successfully. In this case, the measurements have been carried out in our experimental plant by disconnecting the string from the inverter and connecting it to the sweeping electronics common for all the strings. The synchronization between the sweep card and the measurement cards installed in every module has been implemented for the experiment via RS232 protocol over a Bluetooth device
The sweeping card (that in this case manages about 500 V, corresponding to the whole string) was stressed by forcing up to 5000 sweeping cycles one second apart, and no fault was found. 
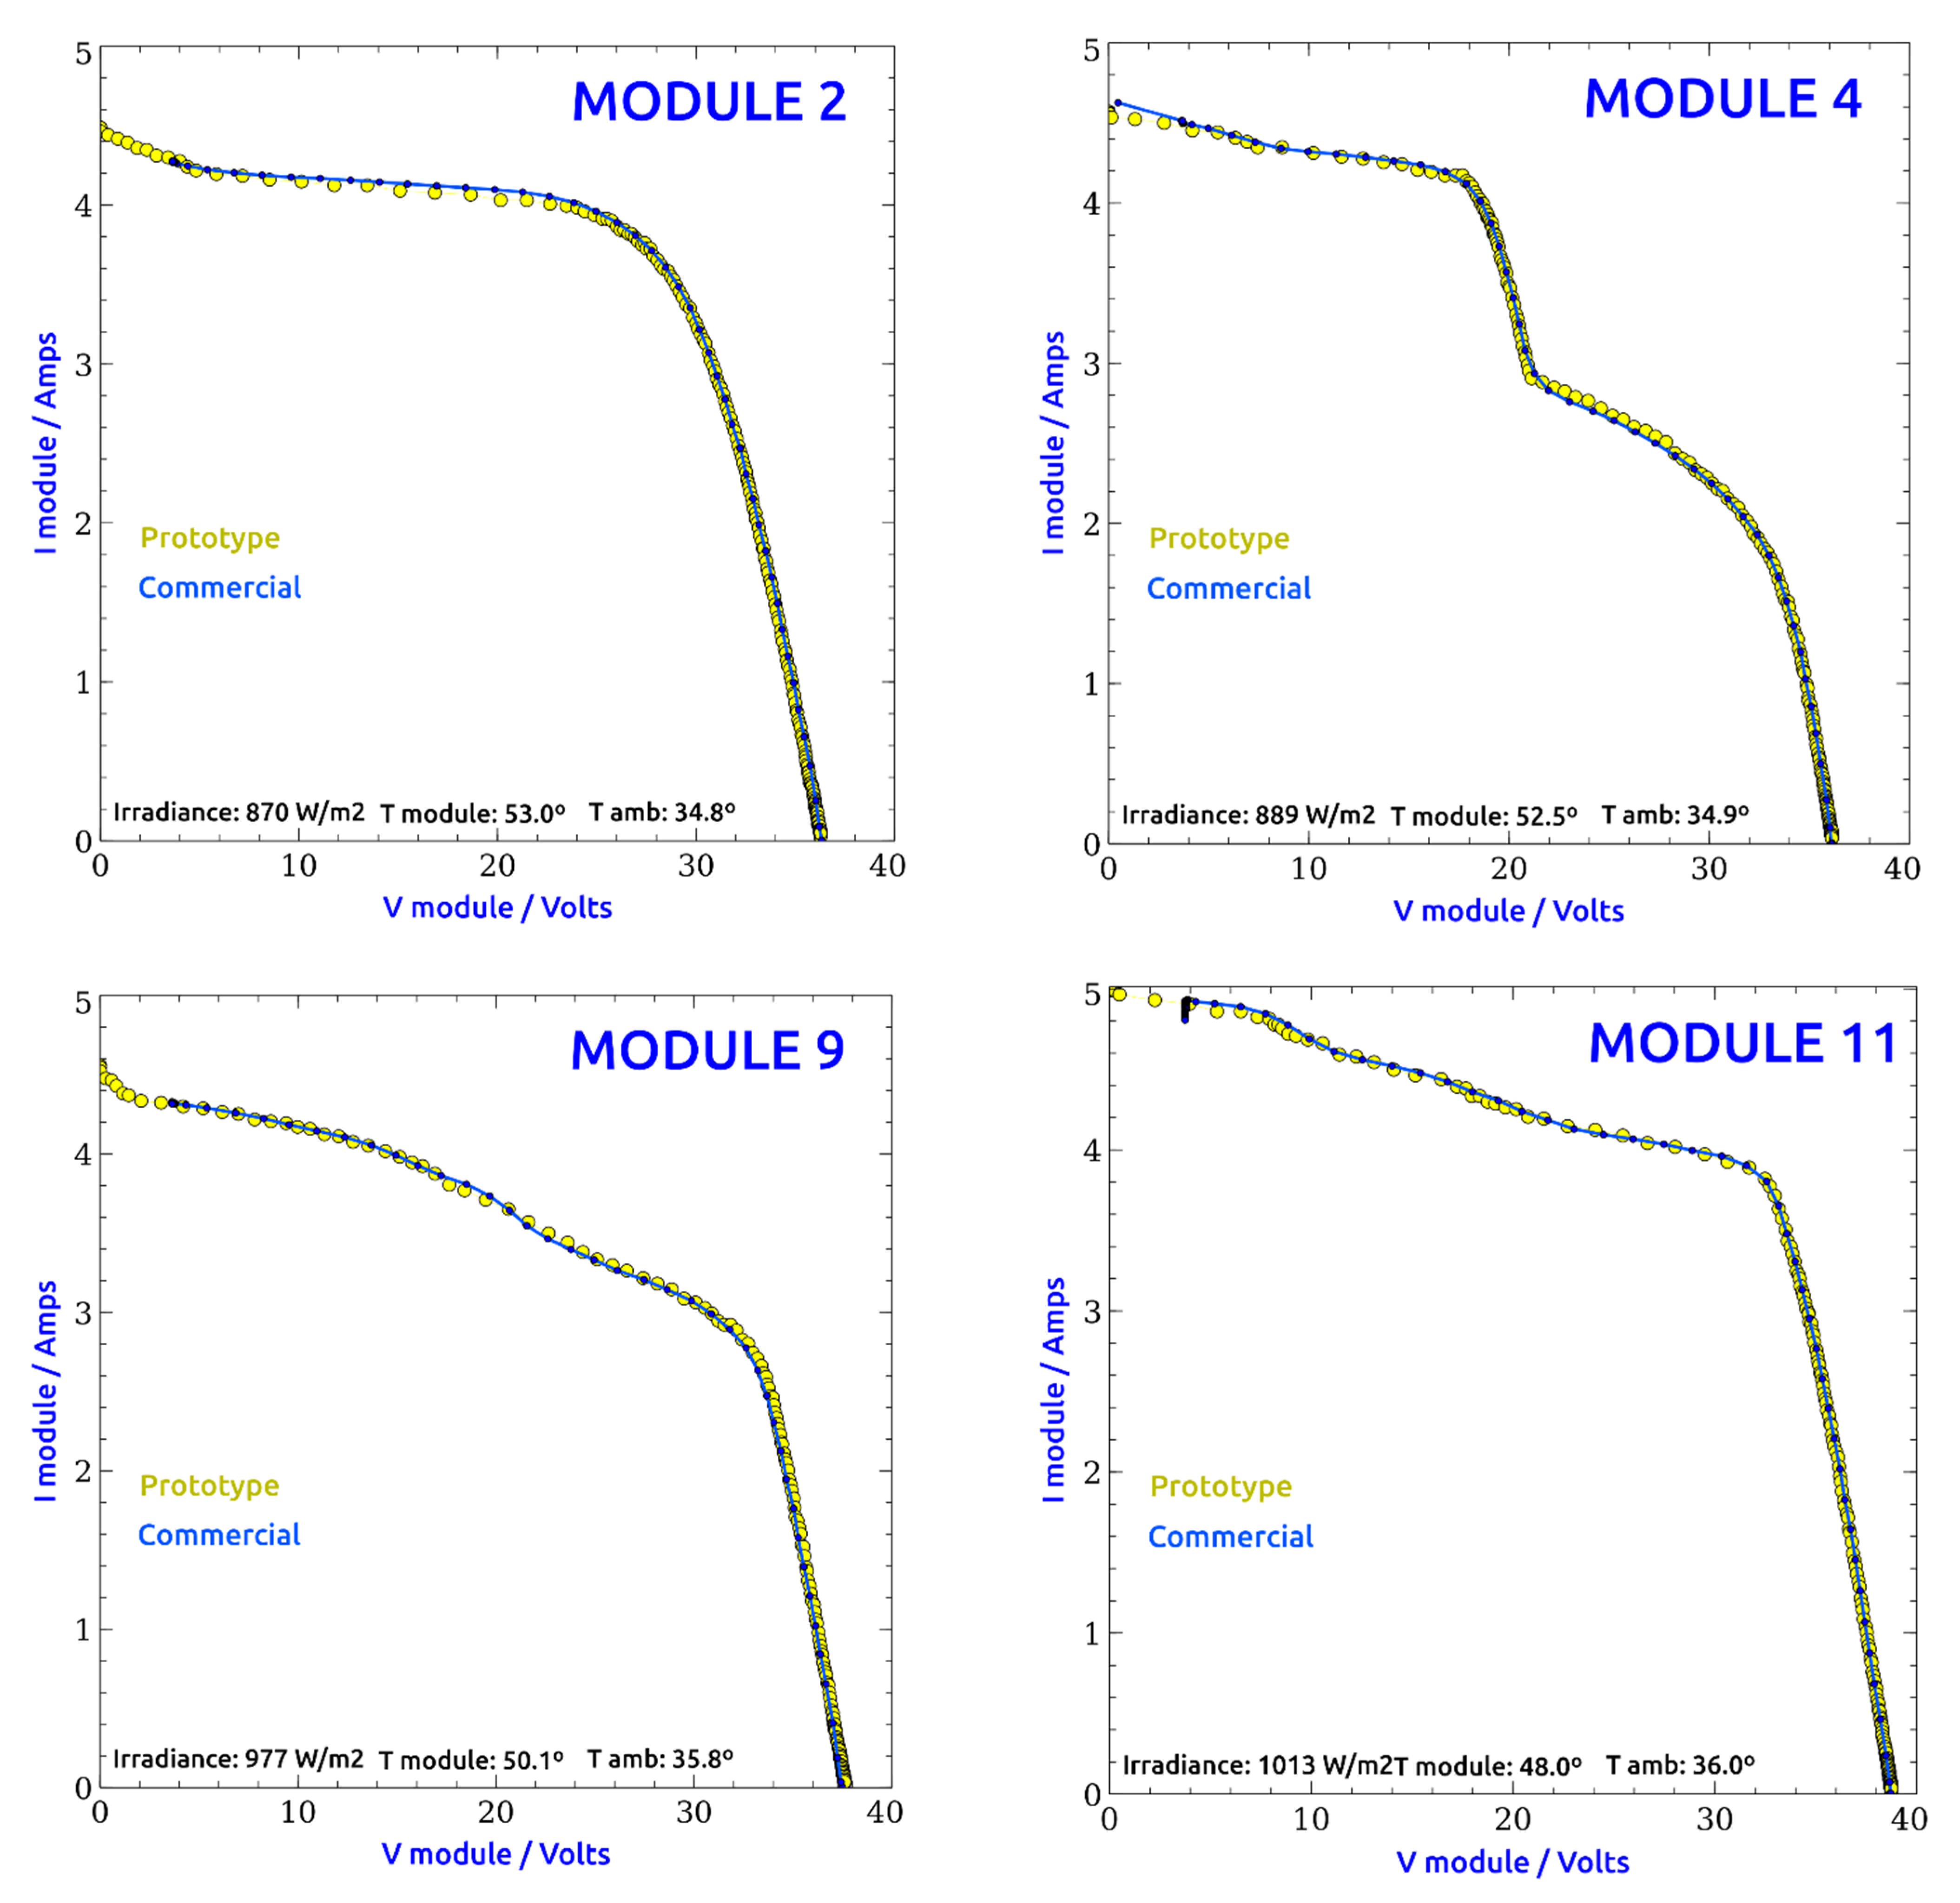
Figure 11 shows the most representative I-V curves obtained with the mixed strategy from the same modules as with the previous strategy, and the comparison with the commercial tester ones. Each graph displays dashed yellow curves corresponding to RAW data from the prototype and continuous blue lines corresponding to commercial tester data.
The curve from module 7 has been added in this second set of comparison curves because it reveals the effect of a mixed strategy prototype curve not reaching the zero voltage point, which is due to the issue described before regarding the asymmetry between the modules within the string. In the case of module 7, when all the strings are pushed to short-circuit, its best performance allows this module to remain as an active generator and its minimum voltage to reach about 6 volts, while most of the other modules behave as dissipative loads.
In this second set of curves, the first sample from the commercial tester shows the same strange behavior pointed out before; thus, it must be also disregarded for comparison. For the curves obtained with the mixed strategy, the orthogonal distance between the commercial tester curves and the prototype ones shows deviations lower than 0.8%, which are slightly bigger than the previous ones but small enough for monitoring and diagnosis purposes.
Regarding this mixed strategy, no control firmware of the sweeping process has been implemented, since a capacitive load has been used. This result in a lower resolution in the upper zone of the curves obtained than the one in the right zone, but anyway, the resolution is higher than the one of the commercial tester, and it is high enough for diagnosis purposes. The lack of a sweeping control for this strategy could be supplied by an adaptive capture rate programmed in firmware in a fashion that resolution in different segments of the curve could be equalized.

4. Discussion and Comparison

The word “online” along this document means that all the measurements are made without the need of a physical disconnection of the individual modules from the string. It could be considered that there is a short (in the order of milliseconds) disconnection for measurements, especially regarding the mixed strategy, but the fact that in both strategies, this disconnection is automated through semiconductor devices and short enough allows for the plant not to be stopped and power production uninterrupted, so the authors think that the term “online” is perfectly appropriate.
The reason for defining the two topologies presented is to try to meet the specific needs of two kinds of solar plant installations: small or domestic solar plants, whose power production depends on just one modules string, and big industrial solar plants, with many strings connected, where a short unavailability of one string can be assumed with monitoring and diagnostics purposes.
Both I-V tracing strategies described lead to curves with a reasonably good fitting in relation to the commercial tester ones, as it can be seen in Figure 10 and Figure 11, which are accurate enough for monitoring and diagnosis purposes.
The main goal of our work regarding the low cost of the system and the simplicity of the electronics in order to make its commercial introduction feasible has been successfully accomplished. Supposing an average PV module price of about 100 Euros, the cost of the distributed strategy cards is around 5–7% of the module price, and for the mixed strategy, the cost is around 4–5% (charging each module card with the corresponding fraction of the common sweeping card cost). On the other hand, for previously proposed online distributed I-V tracers based in microcomputers such as the Raspberry Pi, the cost of only these systems is around the 30% of the module price, or in the case of the systems that need an energy-storage device, it is approximately priced over the total cost of the cards proposed by the authors. Anyway, the complexity, physical size, and price of all the I-V tracers in the literature are over the corresponding characteristics for the two systems proposed here.
In the following Table 4, a comparison of I-V tracer devices regarding complexity, size, online or distributed measurement capability, power supply requirements, accuracy, resolution, and cost is performed. This table includes the comparison of a commercial I-V tracer [27], the two online tracers proposed in [18,26], and the two strategies proposed by the authors in this paper. As it can be seen in the last row of Table 4, the main goal of both designs, which was the low cost and simplicity of the electronics, has been achieved, since the total cost of the system is much lower than the cost of the current devices. The cost of our distributed strategy is 10€, and the one of our mixed strategy is 10€ per module and 30€ for the central card, versus 4500€ for the commercial HT Solar I-Ve tracer [27], which are 0.22% and 0.88% of the commercial price, respectively.
This success regarding the low cost, simplicity, and reduced size of the electronics makes it possible to consider the integration of the electronic cards within the PV modules. Therefore, the proposed strategies are really relevant for an actual PV system, leading to the possibility of a full monitored solar plant at the PV module level, which will be difficult to achieve based on bigger and more expensive devices such as those previously proposed in the literature.
Both methods have some advantages and drawbacks, and they will be suitable for different situations. In the following paragraphs, a comparison between both methods focusing on the advantages and disadvantages of each of them and their optimal scenarios is presented.
When the total cost of the system per module is the main goal, the mixed strategy is the cheaper option, but as mentioned above, it makes the complete string unavailable during the measurement, so it is better for those big plants with several panel strings connected in parallel, which guarantees the continuity of power production regardless of the disconnection of the string under measurement.
Furthermore, this mixed strategy uses sweeping electronics that operate at voltage levels typically between 400 V and 800 V (that of a complete string), and this usually means a reduced life for some components (as the power MOSFET and capacitor).
In addition, the choice of capacitive load as a sweeping device for mixed strategy makes the control of the sweeping slopes impossible, which in general will vary in an unpredictable way due to the complex shape of the string I-V curve, leading to successive steps in the capacitor charging current and the corresponding successive changes in the voltage slope. In practice, this lack of sweeping control does not represent a serious drawback, since if the sampling frequency is high enough, an adjustment is possible of the time between samples, in order to keep increments of voltage and current within reasonable values, and in any case, curves that will allow accurate diagnosis of the modules.
Regarding the distributed strategy, it makes the module under measurement unavailable during the short time necessary for the I-V tracing (typically 40 ms–100 ms), but the measurement sequence proposed guarantees that the power production of the panels string will be uninterrupted.
In terms of energy loss due to the I-V tracing process, both strategies have the same ratio loss/I-V trace, since both take the same time to perform each tracing.
Namely, supposing that one I-V trace (taking 40 ms) is done each day and a daily production time of 7 h in average, the order of daily energy loss could be approximated as 40/(7 × 3600000) = 0.00016%, which is almost negligible.
In small or domestic plants with just one string, the distributed strategy is the only choice if it is preferable for the energy production to be uninterrupted, since the mixed one makes the string unavailable for production during the measurement.

5. Conclusions and Future Work

This work has demonstrated the possibility of low-cost online I-V tracing viability at the module level with a minimum invasion, presenting two successful different strategies that lead to good quality measurement results. The main goal of our work regarding the low cost of the system and the simplicity of the electronics in order to make its commercial introduction feasible has been successfully accomplished. The cost of our distributed strategy is 10€, and the one of our mixed strategy 10€ per module and 30€ for the central card, versus 4500€ for other commercial tracers, which supposes 0.22% and 0.88% of the commercial price, respectively.
When the total cost of the system per module is the main goal, the mixed strategy is the cheaper option, but it makes the complete string unavailable during the measurement, so it is better intended for those big plants with several panel strings connected in parallel, which guarantees the continuity of power production regardless of the disconnection of the string under measurement. In small or domestic plants with just one string, the distributed strategy is the only choice if it is preferable for the energy production to be uninterrupted, since the mixed one makes the string unavailable for production during the measurement.
For both strategies, reliable low-cost communications play an important role, and because of this, our research group is currently developing a PV specific power line communication (PLC) system, which aims at implementing a half-duplex communication hardware over the existing power wires and a corresponding firmware loaded in the same low-cost microcontroller used for the I-V tracing, leading to a minimal circuitry (and cost) of the board.
This communication system must support the signaling and control of electronic boards and data transfer, and ideally, it could be fully controlled by firmware (even for the modulation/demodulation processes).
Finally, the I-V measurements made from our prototypes (and eventually any other data taken from sensors within the plant) must lead to the development of prediction and/or decision tools.
Following this line, our group will focus the research on three main streams:
  • Improved strategies and increased applications,
  • Sensors integration and the development of a reliable low-cost power line communication system,
  • Development of multi-criteria tools intended to help in the decision strategies leading to keeping production efficiency within PV plants.

Author Contributions

Conceptualization, L.H.-C. and J.I.M.-A.; methodology, L.H.-C., J.I.M.-A., S.G.-S., M.d.C.A.-G., V.A.-G. and M.A.G.; software, J.I.M.-A. and S.G.-S.; validation, L.H.-C., J.I.M.-A., S.G.-S., M.d.C.A.-G., V.A.-G. and O.M.; formal analysis, L.H.-C., M.A.M.-G., F.J.S.-P. and J.I.M.-A.; investigation, L.H.-C., J.I.M.-A., S.G.-S., M.d.C.A.-G. and V.A.-G.; resources, L.H.-C., F.J.S.-P., M.A.G. and V.A.-G.; data curation, J.I.M.-A., S.G.-S., M.d.C.A.-G. and M.A.G.; writing—original draft preparation, L.H.-C., J.I.M.-A., S.G.-S., M.d.C.A.-G. and O.M.; writing—review and editing, L.H.-C., J.I.M.-A., S.G.-S., M.d.C.A.-G., V.A.-G., F.J.S.-P. and M.A.M.-G.; visualization, L.H.-C., J.I.M.-A., S.G.-S., M.d.C.A.-G. and V.A.-G.; supervision, L.H.-C., M.d.C.A.-G. and V.A.-G.; project administration, L.H.-C.; funding acquisition, M.A.G., O.M., L.H.-C. and V.A.-G. All authors have read and agreed to the published version of the manuscript.

Funding

This research was funded by “Ministerio de Industria, Economía y Competitividad” grant number 386 “RTC-2017-6712-3” with the name “Desarrollo de Herramientas Optimizadas de Operación y Mantenimiento Predictivo de Plantas Fotovoltaicas—DOCTOR-PV”.

Conflicts of Interest

The authors declare no conflict of interest.

References

  1. National Technical University of Athens. Renewables 2019; Global Status Report; National Technical University of Athens: Paris, France, 2019. [Google Scholar]
  2. Canada, S.; Moore, L.; Post, H.; Strachan, J. Operation and maintenance field experience for off-grid residential photovoltaic systems. Prog. Photovolt. Res. Appl. 2005, 13, 67–74. [Google Scholar] [CrossRef]
  3. Grimaccia, F.; Leva, S.; Dolara, A.; Aghaei, M. Survey on PV Modules’ Common Faults after an O&M Flight Extensive Campaign over Different Plants in Italy. IEEE J. Photovolt. 2017, 7, 810–816. [Google Scholar] [CrossRef] [Green Version]
  4. Heinrich, M.; Meunier, S.; Samé, A.; Quéval, L.; Darga, A.; Oukhellou, L.; Multon, B. Detection of cleaning interventions on photovoltaic modules with machine learning. Appl. Energy 2020, 263, 114642. [Google Scholar] [CrossRef]
  5. Hernández-Callejo, L.; Gallardo-Saavedra, S.; Alonso-Gómez, V. A review of photovoltaic systems: Design, operation and maintenance. Sol. Energy 2019, 188, 426–440. [Google Scholar] [CrossRef]
  6. Grubišić Čabo, F.; Nižetić, S.; Giama, E.; Papadopoulos, A. Techno-economic and environmental evaluation of passive cooled photovoltaic systems in Mediterranean climate conditions. Appl. Therm. Eng. 2020, 169. [Google Scholar] [CrossRef]
  7. Gallardo-Saavedra, S.; Hernández-Callejo, L.; Duque-Pérez, O. Quantitative failure rates and modes analysis in photovoltaic plants. Energy 2019, 183, 825–836. [Google Scholar] [CrossRef]
  8. García Márquez, F.P.; Segovia Ramírez, I. Condition monitoring system for solar power plants with radiometric and thermographic sensors embedded in unmanned aerial vehicles. Meas. J. Int. Meas. Confed. 2019, 139, 152–162. [Google Scholar] [CrossRef] [Green Version]
  9. Herraiz, Á.H.; Marugán, A.P.; Márquez, F.P.G. A review on condition monitoring system for solar plants based on thermography. In Non-Destructive Testing and Condition Monitoring Techniques for Renewable Energy Industrial Assets; Elsevier: Amsterdam, The Netherlands, 2020; pp. 103–118. [Google Scholar]
  10. Huerta Herraiz, Á.; Pliego Marugán, A.; García Márquez, F.P. Photovoltaic plant condition monitoring using thermal images analysis by convolutional neural network-based structure. Renew. Energy 2020, 153, 334–348. [Google Scholar] [CrossRef] [Green Version]
  11. Chen, S.; Li, X.; Xie, Z.; Meng, Y. Time-Frequency Distribution Characteristic and Model Simulation of Photovoltaic Series Arc Fault with Power Electronic Equipment. IEEE J. Photovolt. 2019, 9, 1128–1137. [Google Scholar] [CrossRef]
  12. Vidal de Oliveira, A.K.; Bedin, C.; de Andrade Pinto, G.X.; Mendes Ferreira Gomes, A.; Souza Reis, G.H.; Rafael do Nascimento, L.; Ruther, R. Low-cost aerial electroluminescence (aEL) of PV power plants. In Proceedings of the IEEE Photovoltaic Specialists Conference (PVSC 46), Chicago, IL, USA, 16–21 June 2019; Institute of Electrical and Electronics Engineers (IEEE): Chicago, IL, USA, 2020; pp. 532–537. [Google Scholar]
  13. Wu, L.; Chen, Z.; Long, C.; Cheng, S.; Lin, P.; Chen, Y.; Chen, H. Parameter extraction of photovoltaic models from measured I-V characteristics curves using a hybrid trust-region reflective algorithm. Appl. Energy 2018, 232, 36–53. [Google Scholar] [CrossRef]
  14. Chen, Z.; Wu, L.; Cheng, S.; Lin, P.; Wu, Y.; Lin, W. Intelligent fault diagnosis of photovoltaic arrays based on optimized kernel extreme learning machine and I-V characteristics. Appl. Energy 2017, 204, 912–931. [Google Scholar] [CrossRef]
  15. Gallardo-Saavedra, S.; Hernandez-Callejo, L.; Duque-Perez, O. Image Resolution Influence in Aerial Thermographic Inspections of Photovoltaic Plants. IEEE Trans. Ind. Inform. 2018, 14, 5678–5686. [Google Scholar] [CrossRef]
  16. Gallardo-Saavedra, S.; Hernández-Callejo, L.; Alonso-García, M.; del Carmen Alonso-García, M.; Santos, J.D.; Morales-Aragonés, J.I.; Alonso-Gómez, V.; Moretón-Fernández, Á.; González-Rebollo, M.Á.; Martínez-Sacristán, O. Nondestructive characterization of solar PV cells defects by means of electroluminescence, infrared thermography, I-V curves and visual tests: Experimental study and comparison. Energy 2020, 205, 1–13. [Google Scholar] [CrossRef]
  17. Vega, A.; Valiño, V.; Conde, E.; Ramos, A.; Reina, P. Double sweep tracer for I-V curves characterization and continuous monitoring of photovoltaic facilities. Sol. Energy 2019, 190, 622–629. [Google Scholar] [CrossRef]
  18. Sarikh, S.; Raoufi, M.; Bennouna, A.; Benlarabi, A.; Ikken, B. Implementation of a plug and play I-V curve tracer dedicated to characterization and diagnosis of PV modules under real operating conditions. Energy Convers. Manag. 2020, 209, 112613. [Google Scholar] [CrossRef]
  19. Hernández-Martínez, B.; Gallardo-Saavedra, S.; Hernández-Callejo, L.; Alonso-Gómez, V.; Morales-Aragonés, J.I. General purpose I-V tester developed to measure a wide range of photovoltaic systems. In Proceedings of the Communications in Computer and Information Science, Soria, Spain, 7–9 October 2019; Springer: Berlin/Heidelberg, Germany, 2020; pp. 135–145. [Google Scholar]
  20. Papageorgas, P.; Piromalis, D.; Valavanis, T.; Kambasis, S.; Iliopoulou, T.; Vokas, G. A low-cost and fast PV I-V curve tracer based on an open source platform with M2M communication capabilities for preventive monitoring. Energy Procedia 2015, 74, 423–438. [Google Scholar] [CrossRef] [Green Version]
  21. García-Valverde, R.; Chaouki-Almagro, S.; Corazza, M.; Espinosa, N.; Hösel, M.; Søndergaard, R.R.; Jørgensen, M.; Villarejo, J.A.; Krebs, F.C. Portable and wireless IV–curve tracer for > 5 kV organic photovoltaic modules. Sol. Energy Mater. Sol. Cells 2016, 151, 60–65. [Google Scholar] [CrossRef] [Green Version]
  22. Handleman, C.K.P. Inverter Integrated Instrumentation Having a Current–Voltage Curve Tracer. U.S. Patent 6111767A, 29 August 2000. [Google Scholar]
  23. Warner, T.H.; Cox, C.H., III. I-V Curve Tracer Employing Parametric Sampling. U.S. Patent US4456880A, 4 February 1982. [Google Scholar]
  24. Gillispie, K.; Wrisley, P. Wireless Current-Voltage Tracer with Uninterrupted Bypass System and Method. U.S. Patent 8952715B2, 10 February 2015. [Google Scholar]
  25. Zhu, Y.; Xiao, W. A comprehensive review of topologies for photovoltaic I-V curve tracer. Sol. Energy 2020, 196, 346–357. [Google Scholar] [CrossRef]
  26. Joglekar, A.V.; Hegde, B. Online I-V Tracer for per string monitoring and maintenance of PV panels. In Proceedings of the IECON 44th Annual Conference of the IEEE Industrial Electronics Society, Washngton, DC, USA, 21–23 October 2018; Volume 1, pp. 1890–1894. [Google Scholar]
  27. HT Solar I-Ve. Available online: https://www.ht-instruments.co.uk/en-gb/products/photovoltaic-testers/performance-check/solar-i-ve/ (accessed on 1 January 2021).
Figure 1. Experimental installation implemented in the Duques de Soria University Campus of the University of Valladolid, Soria (Spain).
Electronics 10 00671 g001
Figure 2. Schematics of the electronic board installed in each module for the distributed strategy.
Electronics 10 00671 g002
Figure 3. Schematic of the sweeping closed control loop.
Electronics 10 00671 g003
Figure 4. Flow chart showing the basic sweeping control algorithm.
Electronics 10 00671 g004
Figure 5. Current distribution during a current–voltage (I-V) sweep.
Electronics 10 00671 g005
Figure 6. Picture of the electronic board installed in PV modules for the distributed strategy.
Electronics 10 00671 g006
Figure 7. General schema of setup for mixed strategy.
Electronics 10 00671 g007
Figure 8. Detail of the centralized card schematic with sweeping circuit on the right.
Electronics 10 00671 g008
Figure 9. Picture of the common sweeping electronics.
Electronics 10 00671 g009
Figure 10. Distributed strategy/commercial tester comparison curves.
Electronics 10 00671 g010
Figure 11. Mixed strategy/commercial tester comparison I-V curves.
Electronics 10 00671 g011aElectronics 10 00671 g011b
Table 1. Main nominal data of photovoltaic (PV) modules.
ModuleModelPower (W)Voc (V)Vmpp (V)Isc (A)Impp (A)
1S-E7EOPLLY17544.3536.265.454.83
2S-E5EOPLLY17544.3536.265.454.83
3E3EOPLLY17544.3536.265.454.83
4S-E4EOPLLY17544.3536.265.454.83
5S-E3EOPLLY17544.3536.265.454.83
6S-E1EOPLLY16543.9235.645.234.63
7S-E2EOPLLY17544.3536.265.454.83
8S-E6EOPLLY17544.3536.265.454.83
10S-V1EGNG18044.435.45.355.08
11S-S1SKY GLOBAL-SOLAR MODULE17542.635.55.524.93
Table 2. Parameters measurement capabilities of “Solar IV-e” photovoltaic (PV) tester.
SymbolDescriptionRangeResolution
PmaxMaximum nominal power of a module50–4800 W1 W
VocOpen circuit voltage15–99.99 V
100–320.0 V
0.01 V
0.1 V
VmppVoltage on point of maximum power15–99.99 V
100–320.0 V
0.01 V
0.1 V
IscShort circuit current0.5–15 A0.01 A
ImppCurrent on point of maximum power0.5–15 A0.01 A
Table 3. Irradiation level, ambient temperature, and module temperature conditions in which the measurements have been taken.
Module DistributedMixed
Commercial HTDeveloped StrategyCommercial HTDeveloped Strategy
1W (W/m2)723726865862
T amb (°C)33.333.434.334.2
T module (°C)49.649.655.255.0
2W (W/m2)732732873870
T amb (°C)33.833.934.834.8
T module (°C)50.750.853.653.0
3W (W/m2)824825871870
T amb (°C)36.436.635.535.7
T module (°C)48.950.052.152.5
4W (W/m2)744745891889
T amb (°C)35.435.435.034.9
T module (°C)51.351.952.752.5
5W (W/m2)745745922923
T amb (°C)33.940.136.536.5
T module (°C)48.949.050.050.1
6W (W/m2)823826958967
T amb (°C)33.633.635.835.7
T module (°C)45.245.150.250.1
7W (W/m2)762764985995
T amb (°C)36.236.035.034.9
T module (°C)51.851.944.544.4
8W (W/m2)776777985983
T amb (°C)37.137.235.335.6
T module (°C)51.852.046.847.2
9W (W/m2)781783982977
T amb (°C)35.135.335.435.8
T module (°C)50.050.150.250.1
10W (W/m2)8118159911000
T amb (°C)35.335.535.835.9
T module (°C)52.252.648.047.6
11W (W/m2)80380610111013
T amb (°C)36.136.236.036.0
T module (°C)46.446.448.048.0
Table 4. Comparison of I-V tracer devices regarding complexity, size, online or distributed measurement capability, power supply requirements, accuracy, resolution, and cost.
DeviceHT Solar I-Ve [27]Sarikh et al. [18]Ashish V. Joglekar [26]Our Distributed StrategyOur Mixed Strategy
ComplexityCommercial
Modules
15NONONO
Estimated
Prototype Electronic Components
NO20–50403328 (per module)
12 (Central Card)
Size (mm)235 × 165 × 75300 × 500 × 15060 × 80 × 4050 × 70 × 3050 × 70 × 30 (per module)
70 × 80 × 40 (central card)
Online Measurement CapabilityNOYES 1YESYESYES 2
Distributed Measurement CapabilityYESYESNOYESYES
Power SupplyLocal BatteryMains (220 AC)String under measurementSame module under measurementSame module under measurement
Accuracy (% of full Scale) V-I0.5–0.51.5–3.5Not reported0.1–0.50.1–0.5
Resolution (points/Curve)128601500256256
Estimated Cost (€)4500200–40080–1201010 (per module) + 30 (Central Card)
1. The strategy in order to keep the string working during the I-V tracing is not explained in this paper, so authors are not sure that this device is capable of performing online measurements in the sense of making them without a string power interruption. 2. A short disconnection of the string under measurement is needed (100 ms). In a plant with several strings, the power production is not interrupted.
Publisher’s Note: MDPI stays neutral with regard to jurisdictional claims in published maps and institutional affiliations.

