Abstract
LP-FBMC (low peak-to-average power ratio filter bank multicarrier) was recently proposed to ameliorate the high peak-to-average power ratio (PAPR) issue of filter bank multicarrier (FBMC). The previous simulation study showed that LP-FBMC achieves a similar PAPR as that of single carrier frequency division multiple access (SC-FDMA) while being very robust to inter-user timing/frequency offsets. However, the simulation results that were obtained assuming the stereotyped channel model and the simple nonlinearity model of analog circuits substantially differ from the performance results in a real channel with a real transceiver. To address this, the main purpose of this work is to compare the performances of three waveforms, i.e., SC-FDMA, FBMC, and LP-FBMC, in a real uplink indoor channel. We investigate how the bit error rate (BER) performance gaps of three waveforms in the indoor channels change by the system parameters, such as the carrier frequency within sub-3.5 GHz band and the number of sub-carriers or the sub-carrier spacing, which was not found in the previous simulation study. Our investigation confirms that LP-FBMC is a suitable waveform for real indoor applications.
1. Introduction
The single-carrier frequency division multiple access (SC-FDMA) scheme was adopted as the uplink scheme in 4G and 5G wireless networks [1]. SC-FDMA has lots of merits, such as low implementation complexity, low peak-to-average power ratio (PAPR), and ease of application to massive multiple-input and multiple-output (MIMO) systems. However, the SC-FDMA system is very sensitive to inter-user timing/frequency offsets and it has high out-of-band (OOB) emission, and solving these problems has been challenging [2,3]. Especially, for the heterogeneous network or the massively connected applications in 5G network scenario, the waveforms with highly localized spectrum are required to mitigate interference between users (or systems) in adjacent bands caused by inter-user (or inter-system) timing/frequency offsets. Thus, many studies on new multiple access schemes are being conducted in order to prepare the standards for the future generations [4,5,6].
As an alternative to SC-FDMA for next-generation networks, various modulation waveforms are being considered, such as the filtered orthogonal frequency division multiplexing (f-OFDM), filter bank multicarrier (FBMC), universal filtered multicarrier (UFMC), and generalized frequency division multiplexing (GFDM) schemes. Among those waveforms, FBMC has the lowest OOB emission and, thus, inter-user interference that is caused by inter-user timing/frequency offsets can be eliminated using only one guard subcarrier. Additionally, inter-carrier interference that is caused by a multipath fading channel can be overcome without using a cyclic prefix (CP) [6,7]. Because of these benefits, FBMC has been considered to be a promising candidate for multiple access schemes of next-generation communications. Meanwhile, an enhanced version of FBMC, called LP-FBMC (low PAPR FBMC), was proposed to reduce the PAPR of the conventional FBMC by applying discrete Fourier transform (DFT) spreading with special conditions [8,9,10].
The performances of SC-FDMA, conventional FBMC, and LP-FBMC were intensively compared by computational simulations in [6]. It was shown that LP-FBMC achieves a substantially improved bit error rate (BER) performance than SC-FDMA in a uplink channel with inter-user timing/frequency offsets and signal clipping. However, it is difficult to generalize the simulation results in a theoretical channel model to the real channel performance. This is because too many irregular factors to simulate are involved in the real channel response. For instance, the multipath fading and shadow fading are highly subject to the physical propagation environments, and the hardware impairment factors, such as transceiver’s digital-to-analog-converter/analog-to-digital-converter nonlinearities, oscillators’ phase noises, and high-power amplifier (HPA) nonlinearity, are determined by the radio frequency (RF) circuitry of the transceiver and the carrier frequency band. In addition, the problem with the artificial computational experimental model for channels or hardware impairments is that it is likely to be biased or friendly to one particular waveform. To address this, the main purpose of this work is to compare these three waveforms, i.e., SC-FDMA, FBMC, and LP-FBMC, in a real uplink indoor channel from various perspectives and confirm that LP-FBMC is a practically competitive solution for beyond-5G indoor applications.
In the 5G standard, the millimeter wave (mmWave) band of 28 GHz and the mid-band below 6 GHz are used interchangeably, and the mid-band range is allocated for indoor wireless networks, because mmWave signals suffer severe propagation attenuation in indoor environments [11]. Various studies on the SC-FDMA system in indoor wireless communication bands are being widely conducted, because SC-FDMA has been adopted as the standard uplink access scheme since 4G [12,13,14,15]. On the other hand, there has not been a field test study on FBMC (or modified version of FBMC) in indoor wireless communication bands, and it has not been verified that FBMC (or modified version of FBMC) can solve the problems of SC-FDMA in the real indoor wireless environment. For reference, there have been few studies on the spectrum shape of FBMC waveforms [16,17].
In this study, we intensively analyse the performance of SC-FDMA, FBMC, and LP-FBMC via a field test in a real indoor wireless environment. To this end, we implement a test bed utilising a software defined radio (SDR) device. As for the indoor wireless channel, we test the various sub-3.5 GHz bands when considering the different indoor wireless band allocations in the different countries (3.5 GHz band for South Korea; 600 MHz, 2.5 GHz, and 3.5 GHz bands for US; and, 700 MHz and 3.5 GHz bands for Europe [18]). Specifically, the three waveforms (The three uplink schemes in comparison, SC-FDMA, FBMC, and LP-FBMC differ basically in the waveforms. Hence, the terms ’three waveforms’ and ’three uplink schemes’ are used interchangeably for referring to {SC-FDMA, FBMC, LP-FBMC} in this paper.) are compared in the following aspects:
- spectral density of the transmit waveform affected by the RF circuit and the HPA;
- point-to-point link performance according to distance and carrier frequency in two distinct environments: line-of-sight (LoS) and non-line-of-sight (NLoS) environments;
- uplink BER performance according to the time/frequency offset among the users, distance, and carrier frequency; and,
- uplink BER performance according to the subcarrier spacing, and the number of subcarriers.
The remainder of this paper is structured, as follows. Section 2 describes the mathematical waveform models of SC-FDMA, FBMC, and LP-FBMC. Section 3 describes the SDR test-bed for the field experiments in indoor wireless channels. The BER performances are intensively tested and compared among the waveforms from various perspectives in Section 4. Finally, we make conclusions in Section 5.
2. Waveform Models for SC-FDMA, FBMC, and LP-FBMC
2.1. SC-FDMA
Figure 1 shows the structure of an SC-FDMA transmitter for the kth uplink user. The number of users is denoted by K, the number of carriers allocated to each user is denoted by N, and the number of symbols per data frame is denoted by M. The m-th complex data symbol transmitted to the n-th subcarrier under SC-FDMA is expressed as , and the m-th complex data symbol vector is expressed as , where denotes the transposed matrix. In Figure 1, is the N-point discrete Fourier transform (DFT) output for input . If the n-th component of is expressed as , then the k-th user’s transmit signal can be expressed, as follows [6]:
where T is the data symbol duration, is the symbol duration, including the cyclic prefix (CP), and . The variable is the subcarrier index that is allocated to the nth element of N-point DFT output of the k-th user. We consider the block sub-band (SB) allocation, and one guard subcarrier between adjacent subcarrier blocks, which are common to FBMC and LP-FBMC for fair comparison [19]. Therefore, is expressed as .
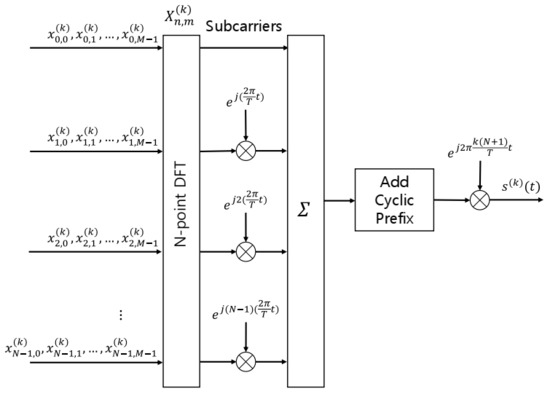
Figure 1.
Structure of the k-th user’s single carrier frequency division multiple access (SC-FDMA) transmitter.
2.2. FBMC
Figure 2 shows the structure of a conventional FBMC transmitter for the k-th uplink user’s, where and are the real and imaginary parts of the input, and represents the impulse response of a prototype filter [20]. The m-th complex data symbol transmitted to the n-th subcarrier of the k-th user denoted by is expressed, as follows:
where and are the real and imaginary parts of the . Subsequently, the FBMC signal of k-th user is expressed, as follows [8]:
where is expressed in the same way as in SC-FDMA.
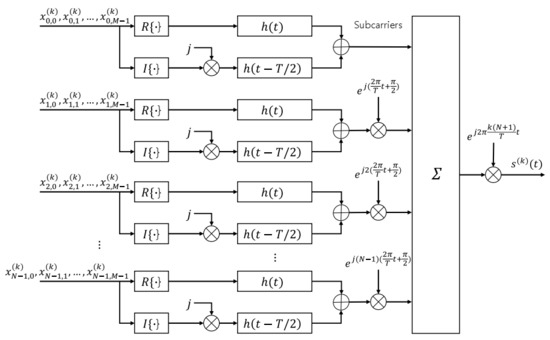
Figure 2.
Structure of the k-th user’s filter bank multicarrier (FBMC) transmitter.
2.3. LP-FBMC
In [8], it was reported that simply applying DFT spreading to FBMC cannot achieve the PAPR reduction effect, and there exist a special condition of phase coefficients to maximize the single carrier effect of DFT spreading for PAPR reduction. This condition is called the identically time-shifted multicarrier (ITSM) condition. In addition, in order to further reduce the PAPR, LP-FBMC generates four ITSM-conditioned signal candidates for each subframe and concatenates the ones with the lowest PAPR to form a frame. Figure 3 shows the transmitter structure for the k-th subframe of LP-FBMC. The four versions of signal candidates are generated according to two switching control bits and , as shown in Table II of [8].
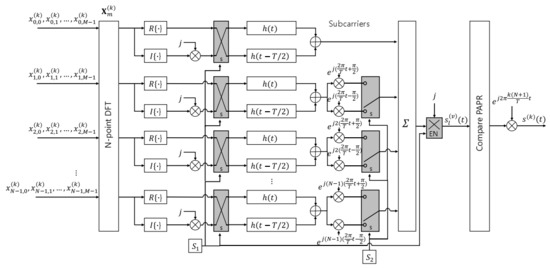
Figure 3.
Structure of the the k-th user’s low peak-to-average power ratio filter bank multicarrier (LP-FBMC) transmitter.
In Figure 3, a complex vector denotes the DFT output vector of complex data symbols, and the n-th element of is given, as follows:
where and denote the real and imaginary parts of , respectively. The transmitter structures of LP-FBMC and FBMC are almost the same, except that the DFT is performed on the modulated data symbols, and two switches were added, as shown in Figure 2 and Figure 3. After generating four transmission signal candidates according to the two switches, the candidate signal with the lowest PAPR is selected for transmission. In the l-th data block of the k-th user, the v-th candidate of transmit signal , can be expressed, as follows [10]:
where W denotes the number of offset quadrature amplitude modulation (OQAM) symbols in the l-th data block, and and are expressed, as follows [10]:
At the final stage, we successively concatenate the selected candidates. The concatenated waveform up to the l-th block of the k-th user can be expressed, as follows [10]:
where is a candidate index that is selected in the l-th data block of the k-th user.
3. Test-Bed and Field Trial Environment
3.1. Test-Bed Configuration
In order to implement a test-bed in a real wireless channel, we used an SDR device (USRP-2901) and LabVIEW Comms 3.0 as a software platform. Table 1 shows the RF specifications of the SDR device, and Figure 4 shows the overall configuration of the test-bed. A Vert900 antenna was used for performance tests in the sub-1 GHz band, and an LP0965 antenna was used in the band higher than 1 GHz.

Table 1.
RF specifications of the software defined radio (SDR) device and the antennas.
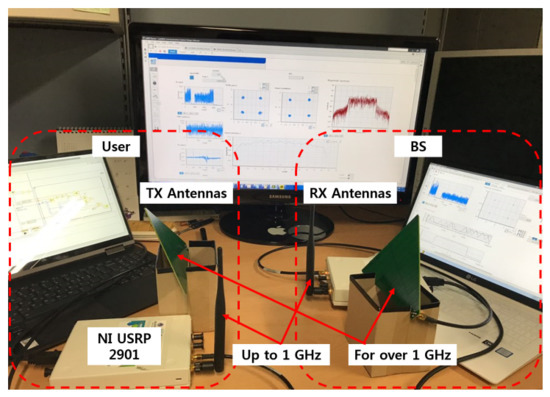
Figure 4.
Test-bed configuration.
The overall operation processes of the test-bed are as follows. On a host PC, the transmit signal is modulated using LabVIEW Comms 3.0 and it is sent to the SDR device. In the SDR device, the modulated signal is converted into a continuous analog signal and it passes through I-Q mixing and up-conversion. Subsequently, an RF signal is generated and it is propagated to the chosen frequency band through the RF antennas, Vert-900 or LP0965. The SDR device of the receiver performs the reverse process of the transmitter. The received signal is transmitted to the host PC, and then the host PC performs synchronization, demodulation, and bit detection.
3.2. Indoor Wireless Channel Environment Set-Up
Line-of-sight (LoS) and non-line-of-sight (NLoS) environments were both implemented to measure the BER performance in typical indoor situations. The BER measurement was performed in the various spots on the 3rd floor in the IT building at Yeungnam University, Korea.
Figure 5 and Figure 6 shows the transmitter (TX) (or user) and receiver (RX) (or base station (BS)) location set-up for LoS and NLoS environments, respectively, in the floor map of the building. The BS was tested at each of the three different positions specified with BSi . In the uplink system, the inter-user interference (IUI) from the very next (left and right) sub-band (SB) is dominant over the those from the other SBs. Hence, for an efficiently down-scaled field test, three consecutive subbands are allocated to three uplink users (See Figure 7), and, then, we measured the performance of only the middle user who undergoes the IUIs from the left and right SBs.
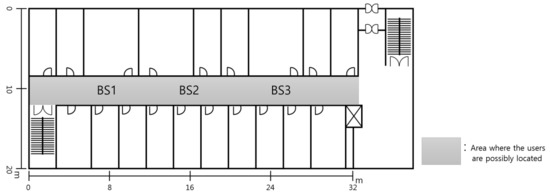
Figure 5.
User area (shaded) and base station (BS) location in line-of-sight (LoS) environment.
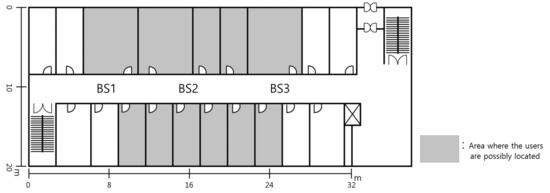
Figure 6.
User area (shaded) and BS location in non-line-of-sight (NLoS) environment.
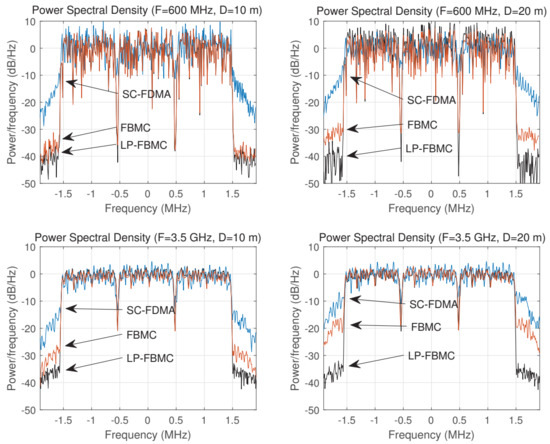
Figure 7.
Power spectra of the SC-FDMA, FBMC, and LP-FBMC, K = 3, N = 64, LoS environment, = 15 kHz.
The maximum straight distance between the TX and BS is 24 m and 12 m for LoS and NLoS environments, respectively. In the NLoS environment, the TXs were placed inside the rooms (shaded area in Figure 6), and the BS was placed in the corridor. Thus, there are more than one wall between TX and BS. Figure 8 is a sample shot of the NLoS environment set-up. The locations for the three equipments labelled by BS1, BS2, and BS3 in Figure 8 correspond to the points that are specified by BS1, BS2, and BS3 in Figure 5 and Figure 6, respectively. At each of three BS positions, the average uplink BER was separately measured and then it was averaged. Note that, by the channel reciprocity of either direction between two positions, i.e., TX → BS, and TX ← BS, the field test results that are obtained with the TX and BS location combinations in Figure 5 and Figure 6 inherently include the case when the locations of TX and BS are switched.
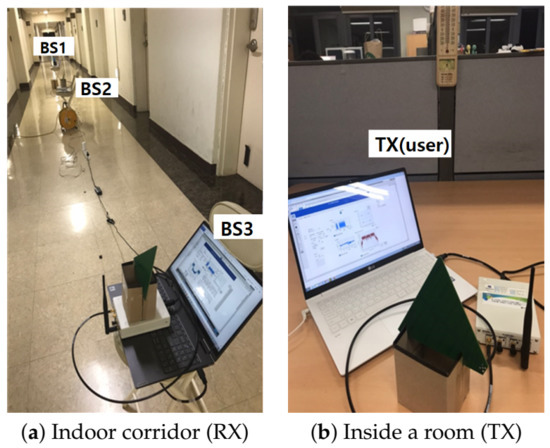
Figure 8.
Bit error rate (BER) performance measurement set-up for NLoS environment.
To synchronize the transmission(access) timings of the uplink users, or to apply the intended (To realize the effect of the practical inter-user synchronization process, we intentionally apply timing offsets at the transmission stage. The field test results for this case are coverer in Section 4.3.) timing offsets among the users, the SDR devices of the users’ TXs are wired to a clock distribution device. Figure 9 shows the configuration of host PCs for users, SDR devices for users’ TXs, and the clock distribution device.
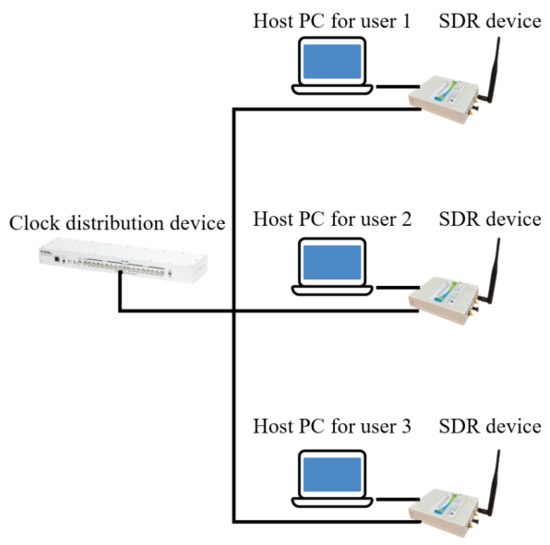
Figure 9.
Configuration of host PCs for users, SDR devices for users’ transmitters (TXs), and clock distribution device.
4. Experiment Results
In this section, we analyse and compare the temporal and spectral characteristics of the three waveforms, i.e., SC-FDMA, FBMC, and LP-FBMC, and then we compare the field-tested BER performance of the three waveforms in various real uplink wireless channels. Table 2 shows the major system parameters that are used for the performance measurements.

Table 2.
Major system parameters.
4.1. Spectra of SC-FDMA, FBMC, and LP-FBMC
In a previous study [6], we confirmed that LP-FBMC is robust to signal clipping, because it achieves low PAPR. However, because a HPA in RF circuitry has different nonlinearities, the actual transmit signal may be significantly different from the result assuming a simple nonlinear model, such as signal clipping. In addition, the theoretical PAPR curve has a limitation for quantitatively assessing how the waveform degrades with this practical nonlinearity. Hence, we compare the spectra of SC-FDMA, FBMC, and LP-FBMC when they go through the actual nonlinearity of RF circuits in the SDR device.
Figure 7 shows the received power spectra of the three waveforms when the carrier frequency is 600 MHz and 3.5 GHz in the LoS environment of Figure 5, and the uplink power control is performed so that the power of each user is the same in the BS. The number of subcarriers N is 64, the subcarrier spacing is 15 kHz, and the distances between the transmitter and receiver are 10 m and 20 m. In accordance with the well known drawback of OFDM-based waveforms, it is shown that SC-FDMA has the highest OOB emission among the three waveforms. Whereas, since the FBMC-based waveforms are filtered for each carrier, the its OOB emission is quite suppressed as compared to SC-FBMC. However, the field test results shown in Figure 7 also confirmed that the OOB emission of FBMC increases significantly as the distance increases from 10 m to 20 m. This is because, as the distance increases, the transmit power is accordingly increased to compensate path loss and, thus, the FBMC undergoes signal distortion due to its high PAPR characteristics. This issue is even more critical in millimeter band (i.e., 3.5 GHz in our field test), where the path loss is more severe when compared to the lower frequency bands (i.e., 600 MHz in our field test). On the other hand, the OOB emission of the LP-FBMC is maintained almost the same, irrespective the frequency band and the distances. Based on these results, the LP-FBMC system maintains the superb OOB suppression, not only in theoretical signal clipping model, but also in real RF circuits and wireless channels.
It is also shown in Figure 7 that the indoor wireless channel in the 600 MHz band has higher frequency selectivity than in the 3.5 GHz band. This confirms a well known property that the multipath delay spread gets smaller as the frequency increases.
4.2. BER Comparison According to Carrier Frequency and Distance
Figure 10 shows the BER performance of the three waveforms, according to the distance between RX and TX (=D) and carrier frequency (=F). For the averaged performance over the area, 10 different locations in the shaded areas in Figure 5 and Figure 6 for LoS and NLoS environments, respectively, were tested for each pair of (D, F), and then the measured BERs are averaged. In general, as D increases, the TX power amplification gain (power gain in short) should be increased in order to compensate the path loss. However, if the power gain is set too high considering only the pass loss, then the performance is degraded by the nonlinear distortions of the transceiver circuit. Figure 11 shows the received signal power versus the power gain of the employed SDR device (USRP-2901) for different distances. In order to see the overall end-to-end link nonlinearities, i.e., not only HPA in TX, but also LNA (low noise amplifier), down-conversion circuit, and analog-to-digital converter (ADC) in RX, the received signal power was measured at the ADC output of RX. Meanwhile, TX and RX were placed at the outdoor open space to exclude the channel effect in the nonlinearity measurement. The received power tends to saturate when the power gain is larger than a certain level (about 18 dB) by the nonlinear distortion, as shown in Figure 11. Except that, due to the path loss, the graphs shift vertically according to the distance, the overall nonlinear characteristics remain the same, irrespective of the distance. Note that, even with the smaller received power due to the increased distance (12 m), the received power still saturates at the identical range of power gain. This implies that the main factor for the overall non-linearity is in the TX side, i.e., HPA in the TX. Hence, we experimentally searched the optimal power gain at each location of the user. Figure 12 shows an example plot of the measured BER versus the power gain for the three waveforms in LoS environment when F is 700 MHz and distance between TX and RX is 12 m. It is shown that the BER is minimized at a gain of 16 dB for FBMC and at a gain of 17 dB for LP-FBMC and SC-FDMA. The smaller optimal power gain for FBMC when compared to those for LP-FBMC and SC-FDMA confirms the higher PAPR of FBMC as compared to those for LP-FBMC and SC-FDMA. This is because, as PAPR becomes larger, the power gain needs to be more tightly controlled to avoid nonlinear distortion.
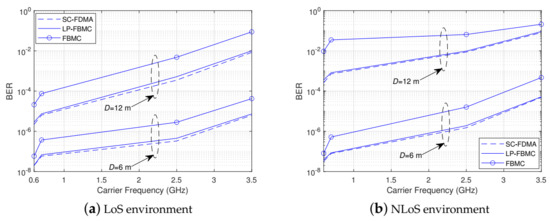
Figure 10.
BER of the SC-FDMA, FBMC, and LP-FBMC, according to the distance and carrier frequency, N = 64, = 15 kHz.
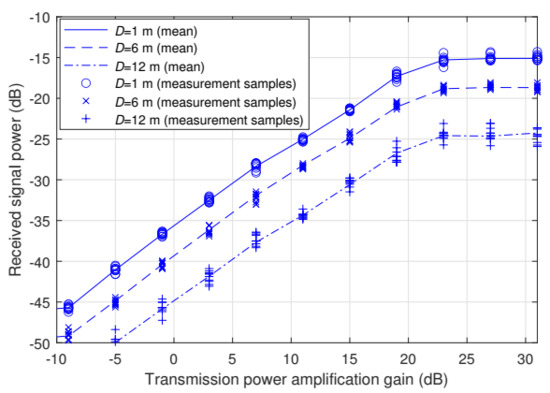
Figure 11.
Received signal power versus the transmission power amplification gain of the SDR device (USRP-2901) in an outdoor open space.
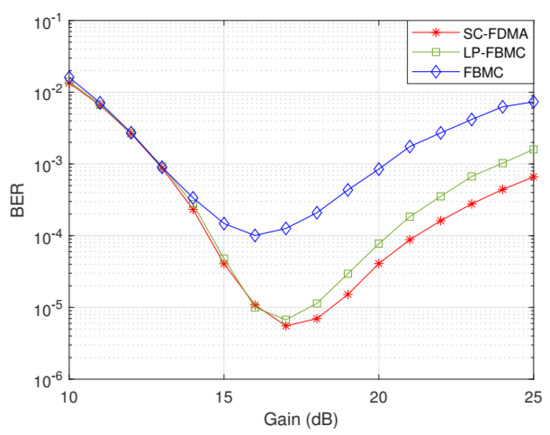
Figure 12.
BER of the SC-FDMA, FBMC, and LP-FBMC according to the transmit power amplification gain, F = 700 MHz, distance between TX and RX = 12 m, LoS environment.
In Figure 10, commonly to the three waveforms, the BER performance deteriorates as the distance increases. This is because, as the distance increases, even optimal transmit power gain cannot fully compensate the path loss in order to avoid the unacceptable nonlinear distortion of the HPA. Hence, in the NLoS environment where the path loss is more serious as compared to LoS environment, BER degrades more rapidly as the distance increases. The BER degradations are more critical in higher carrier frequency due to higher path loss.
FBMC has the significantly higher BER when compared to SC-FDMA due to high PAPR. The BER gap between FBMC and SC-FDMA increases as the carrier frequency decreases with larger distance. This is because. as the carrier frequency decreases, the frequency selectivity increases and SC-FDMA exploits frequency diversity by DFT spreading, whereas FBMC cannot exploit frequency diversity. Hence, in the NLoS environment where the channel is more frequency-selective when compared to LoS environment, the BER gap between FBMC and SC-FDMA further increases. On the other hand, LP-FBMC achieves almost the same BER as that of SC-FDMA over the entire considered region of distance and carrier frequency. This is because LP-FBMC has similar PAPR performance as that of SC-FDMA, and its signal generation also includes DFT spreading. All of these trends are common to LoS and NLoS environments.
4.3. BER Comparison According to Timing/Frequency Offsets
Even with inter-user (inter-node) synchronization, there exist inevitable timing and frequency offsets among the uplink users. This is due to the imperfect dynamics of ranging process between BS and the users or inexpensive oscillators having insufficient resolution in the low cost user equipments. Note that the global reference timing set-up in Figure 8 provides perfect synchronization among the users’ TXs. Hence, in our field test, we apply intentional timing/frequency offsets to the modulated waveforms for various offset ranges among the users. This allows for us to realize the practical inter-user synchronisation effects without being tackled with the implementation of the complicated inter-user synchronisation process. Note that the term ’timing/frequency offsets’ here refers to the offsets among the users, i.e., inter-user offsets. These offsets cannot be eliminated by the basic receiver synchronization process, because the receiver (BS) synchronization process only separately tracks the frequency and timing of each user’s received signal.
In addition, a power control process was performed in order to ensure that the received powers of the user signals are identical. To this end, we first optimize the transmit power amplification gain of the furthest user from the BS by trading off between high signal strength and low signal distortion in HPA. Subsequently, we adjust the amplification gain of the other users, so that the received signal power is the same as the furthest user.
Figure 13 shows the field-tested uplink BER results for various carrier frequencies for the case when each uplink user’s timing and frequency offsets are uniformly distributed in and in , respectively. The parameter denotes the symbol interval (=T)-normalized inter-user timing offset limit and the parameter denotes the subcarrier spacing (=1/T)-normalized inter-user frequency offset limit. Hence, and are unit-less parameters. We randomly generated timing/frequency offset for each data frame until the average measured BER converges to obtain the averaged performance over the various uplink users’ link environment. In addition, 60 different combinations of the users’ locations randomly distributed in all of the shaded areas in Figure 5 and Figure 6 were tested. The measurement procedure is structured, as follows: first, once the three user positions have been set, we perform out the aforementioned power control process. Second, the BERs were separately measured for all pairs of (,) in Figure 13. Third, for each of 60 combinations of the users’ locations, the first and second steps that are mentioned above are repeated. Lastly, 60 measured BERs for each pair of (,) are averaged. Note that, in order to fully include inter-user interference, we measured the BER of the user allocated to the middle of the three consecutive subbands, as mentioned previously.
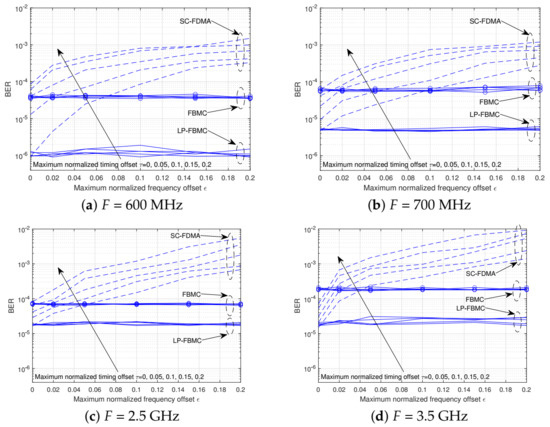
Figure 13.
BER of the SC-FDMA, FBMC, and LP-FBMC, according to timing/frequency offset for various carrier frequencies, N = 64, = 15 kHz.
It is shown that the BERs of SC-FDMA abrubtly increase as and increase. Even with low PAPR advantage of SC-FDMA over FBMC, SC-FDMA performs worse than FBMC if and become larger than the corresponding limits. These agree with computational simulation results shown in [6]. However, note that, as compared to the theoretical simulation results of [6] (see Figure 5, Figure 6 in [6]), the performance degradation of SC-FDMA by inter-user interference is more drastic in Figure 13. This comes from the difference between the channel that is assumed in the computational simulation of [6] and the actual channels in our field test. In [6], the Vehicular-A channel model in the international telecommunications union-radio communication (ITU-R) sector was used. Thus, it is revealed that there is more inter-user interference in the real indoor channel than in the Vehicular-A channel. Note that this trend is most emphasized in the lowest carrier frequency, i.e., F = 600 MHz in our field test. This implies that the inter-user interference becomes more detrimental as the frequency selectivity increases. Meanwhile, the BERs of FBMC and LP-FBMC are almost invariant to and . In particular, no matter how large and are given in the considered region, LP-FBMC achieves the identical BER performance to that of perfectly synchronized SC-FDMA. Again, the BER performance gains of LP-FBMC over FBMC and SC-FDMA are biggest in the lowest carrier frequency, i.e., F = 600 MHz.
4.4. BER Comparison According to Per-User Bandwidth
We can change the bandwidth (equivalently data rate) per user by two different ways. One is to change the subcarrier spacing while keeping the number of users and the other way is to change the number of subcarriers while keeping the subcarrier spacing. Figure 14 shows the BER results with the same system parameters as those for Figure 13d, except that the per-user bandwidth is enlarged twice as that of Figure 13d by doubling the number of sub-carriers N. It is shown that the BER of LP-FBMC decreases due to increased frequency diversity by increased DFT-spreading size (equal to N). This also holds for SC-FDMA, but it is limited to the case with perfect inter-user synchronization. Whereas, owing to lack of DFT-spreading, FBMC is relatively much worse than SC-FDMA and LP-FBMC.
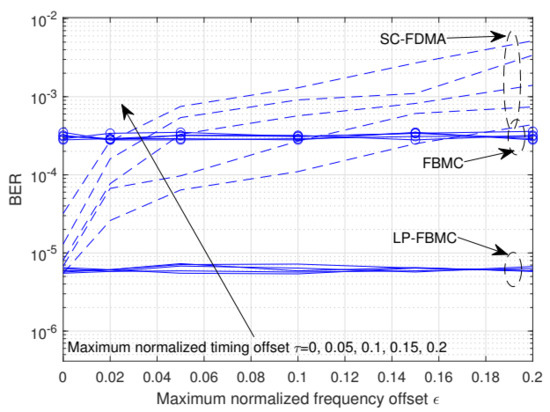
Figure 14.
BER of the SC-FDMA, FBMC, and LP-FBMC according to timing/frequency offset, 128, = 15 kHz, F = 3.5 GHz.
In 5G and beyond, various subcarrier spacings (i.e., = = 15 kHz, 30 kHz, and 60 kHz) are used to support high-quality service [1]. Figure 15 shows the case when the per-user bandwidth is enlarged twice by doubling the subcarrier spacing. For doubling the subcarrier spacing, the symbol duration decreases to one half of that presented in Figure 13d and, thus, the CP length (=) also decreases to one half. The reduced CP results in larger inter-symbol interference (ISI) to SC-FDMA. This explains a remarkable result in Figure 15 that SC-FDMA more severely deteriorates with increasing timing offset as compared to the case in Figure 14. Summing up, the BER performance gain of LP-FBMC over SC-FDMA is more increased for lower carrier frequency, larger subcarrier spacing, and larger timing/frequency offset among the users.
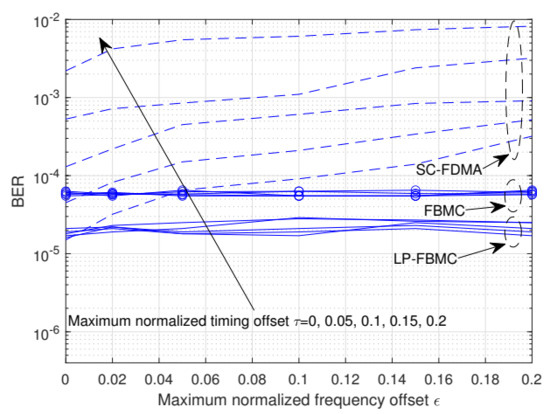
Figure 15.
BER of the SC-FDMA, FBMC, and LP-FBMC according to timing/frequency offset, = 30 kHz, N = 64, F = 3.5 GHz.
5. Conclusions
In this study, we intensively analysed the performance of SC-FDMA, FBMC, and LP-FBMC via field test using SDR devices in the real indoor wireless environments. As for indoor wireless channel, we tested the various sub-3.5 GHz bands when considering the different indoor wireless band allocations in the different countries. Basically, the benefits of LP-FBMC over FBMC and SC-FDMA, i.e., low PAPR, and the robustness against inter-user synchronization errors were confirmed in our field test. For instance, LP-FBMC achieves a BER of less than 1/10 of that of the FBMC in a practical indoor distance between the BS and user. In addition, no matter how large inter-user timing/frequency offset ranges are given in the considered region, LP-FBMC achieves the identical BER performance to that of zero offset case, whereas SC-FDMA severely degrades, even with slight offsets. Summing up the major observations of our field test, the BER performance gain of LP-FBMC over SC-FDMA is more increased for lower carrier frequency, larger subcarrier spacing, and larger timing/frequency offset among the users. In light of these results, we expect that LP-FBMC is a promising waveform solution for beyond 5G uplink waveforms in indoor sub-3.5 GHz Bands.
Author Contributions
Writing—review and editing, K.C.; writing—original draft preparation, D.N.; Implementation and field test, S.J.; project administration, W.-G.S.; resources, W.-G.S. All authors have read and agreed to the published version of the manuscript.
Funding
This research was supported by the MSIT (Ministry of Science and ICT), Korea, under the ITRC (I nformation Technology Research Center) support program (IITP-2020-2016-0-00313) supervised by the IITP (Institute for Information & communications Technology Planning & Evaluation. This research was supported by the National Research Foundation of Korea(NRF) grant funded by the Korea government (MSIT) (No. 2021R1A2C1010370).
Conflicts of Interest
The authors declare no conflict of interest.
References
- Herminawan, F.; Higashino, T.; Okada, M. Investigation of Cross Modulation for SC-FDMA Signals in Radio over Fiber Mobile Link. In Proceedings of the IEEE Asia-Pacific Microwave Conference, Hong Kong, China, 8–11 December 2020. [Google Scholar]
- Ihalainen, T.; Viholainen, A.; Stitz, T.H.; Renfors, M.; Bellanger, M. Filter bank based multi-mode multiple access scheme for wireless uplink. In Proceedings of the 17th European Signal Processing Conference, Glasgow, UK, 24–28 August 2009. [Google Scholar]
- Schaich, F.; Wild, T. Waveform contenders for 5G—OFDM vs FBMC vs. UFMC. In Proceedings of the 6th International Symposium on Communications, Control and Signal Processing (ISCCSP), Athens, Greece, 21–23 May 2014. [Google Scholar]
- Kang, H.; Song, Y.; Kwon, D.; Kim, D. Key Techniques and Performance Comparison of 5G New Waveform Technologies. In Proceedings of the Korean Institute of Communications and Information Sciences (KICS), Seoul, Korea, 1 January 2016; Volume 41, pp. 142–155. [Google Scholar]
- Zhang, N.; Wang, J.; Kang, G.; Liu, Y. Uplink Nonorthogonal Multiple Access in 5G Systems. IEEE Commun. Lett. 2016, 20, 458–461. [Google Scholar] [CrossRef]
- Jang, S.; Na, D.; Choi, K. Comprehensive Performance Comparison between OFDM-based and FBMC-based Uplink Systems. In Proceedings of the International Conference on Information Networking (ICOIN), Barcelona, Spain, 7–10 January 2020. [Google Scholar]
- Dore, J.; Cassiau, N.; Ktenas, D. Low complexity frequency domain carrier frequency offset compensation for uplink multiuser FBMC receiver. In Proceedings of the European Conference on Networks and Communications (EuCNC), Bologna, Italy, 23–26 June 2014. [Google Scholar]
- Na, D.; Choi, K. Low PAPR FBMC. IEEE Trans. Wirel. Commun. 2018, 17, 182–193. [Google Scholar] [CrossRef]
- Choi, K. Alamouti Coding for DFT Spreading-Based Low PAPR FBMC. IEEE Trans. Wirel. Commun. 2019, 18, 926–941. [Google Scholar] [CrossRef]
- Na, D.; Choi, K. DFT Spreading-based Low PAPR FBMC with Embedded Side Information. IEEE Trans. Commun. 2019, 68, 1731–1745. [Google Scholar] [CrossRef]
- Nandhakumar, P. A Review on Next Generation Mobile Communication-5G. Sci. Bull. Electr. Eng. Fac. 2019, 19, 16–20. [Google Scholar] [CrossRef]
- Vitucci, E.M.; Yu, F.; Possenti, L.; Zoli, M.; Fuschini, F.; Barbiroli, M.; Degli-Esposti, V. A Study on Dual-Directional Mm-wave. In Proceedings of the European Conference on Antennas and Propagation, Krakow, Poland, 31 March–5 April 2019. [Google Scholar]
- Bera, S.; Sarkar, S.K. Review on Indoor Channel Characterization for Future Generation Wireless Communications. Adv. Commun. Devices Netw. 2019, 537, 349–356. [Google Scholar]
- Perez, J.R.; Torres, R.P.; Rubio, L.; Basterrechea, J.; Penarrocha, R.; Reig, J. Empirical characterization of the indoor radio channel for array antenna systems in the 3 to 4 GHz frequency band. IEEE Access 2019, 7, 94725–94736. [Google Scholar] [CrossRef]
- Huang, F.; Tian, L.; Zheng, Y.; Zhang, J. Propagation characteristics of indoor radio channel from 3.5 GHz to 28 GHz. In Proceedings of the IEEE 84th Vehicular Technology Conference, Montreal, QC, Canada, 18–21 September 2016; pp. 1–5. [Google Scholar]
- Nadal, J.; Nour, C.A.; Baghdadi, A.; Lin, H. Hardware prototyping of FBMC/OQAM baseband for 5G mobile communication. In Proceedings of the 2014 25th IEEE International Symposium on Rapid System Prototyping (RSP), New Delhi, India, 16–17 October 2014; pp. 72–77. [Google Scholar]
- Barlee, K.W.; Stewart, R.W.; Crockett, L.H.; MacEwen, N.C. Rapid prototyping and validation of FS-FBMC dynamic spectrum radio with simulink and ZynqSDR. IEEE Open J. Commun. Soc. 2020, 2, 113–131. [Google Scholar] [CrossRef]
- Lee, J.; Tejedor, E.; Ranta-aho, K.; Wang, H.; Lee, K.-T.; Semaan, E.; Mohyeldin, E.; Song, J. Spectrum for 5G: Global Status, Challenges, and Enabling Technologies. IEEE Commun. Mag. 2018, 56, 12–18. [Google Scholar] [CrossRef]
- Riback, M.; Medbo, J.; Berg, J.; Harrysson, F.; Asplund, H. Carrier Frequency Effects on Path Loss. In Proceedings of the IEEE 63rd Vehicular Technology Conference, Melbourne, Australia, 11–12 May 2006. [Google Scholar]
- Farhang-Boroujeny, B. OFDM Versus Filter Bank Multicarrier. IEEE Signal Process. Mag. 2011, 28, 92–112. [Google Scholar] [CrossRef]
Publisher’s Note: MDPI stays neutral with regard to jurisdictional claims in published maps and institutional affiliations. |
© 2021 by the authors. Licensee MDPI, Basel, Switzerland. This article is an open access article distributed under the terms and conditions of the Creative Commons Attribution (CC BY) license (http://creativecommons.org/licenses/by/4.0/).