Article

A New RFID-Identification Strategy Applied to the Marble Extraction Industry

by
Leonardo Andrade
1,2,
João Figueiredo
3,* and
Mouhaydine Tlemçani
1
1
Mechatronics Department, University of Évora, R. Romão Ramalho 59, 7000-671 Évora, Portugal
2
Metal Viçosa Lda, 7250-909 Alandroal, Portugal, and Marmetal-Marmores e Materiais de Construção, SA 7150-101 Borba, Portugal
3
IDMEC, Mechatronics Department, ICT-University of Évora, R. Romão Ramalho, 59, 7000-671 Évora, Portugal
*
Author to whom correspondence should be addressed.
Electronics 2021, 10(4), 491; https://doi.org/10.3390/electronics10040491
Submission received: 25 January 2021 / Revised: 9 February 2021 / Accepted: 15 February 2021 / Published: 19 February 2021
(This article belongs to the Section Industrial Electronics)

Abstract

:
This paper aims to improve the marble industry production chain by proposing new technological approaches using the Radio Frequency Identification (RFID) systems. The dynamic capabilities of the RFID read-write tags allow the storage of physical characteristics of stone blocks, according to electrical, ultrasound and three-dimensional image characterization tests. These characterization non-destructive tests allow the evaluation of important parameters of the original stone blocks, by analyzing the internal structure of the rocks. Then, these parameters can be stored in databases through RFID-tags, in order to optimize their subsequent cutting and transformation processes. RFID identification technology when integrated into an ethernet communication network enables automatic communication with cutting and processing equipment, building an intelligent industrial platform, integrating PCs (Personal Computers) and PLCs (Programmable Logic Controllers) within an Industry 4.0 environment. Another huge advantage of RFID technology is that it allows full product traceability, namely by enabling the end consumer to reverse the production path. A laboratory prototype was implemented and a detailed analysis and discussion of the obtained functionalities is shown at the end of this paper.

1. Introduction

According to European Parliament [1], the term “Industry 4.0” was created by the German Government describing and encapsulating the changes in manufacturing technologies. Numerous and detailed explanations involving Industry 4.0 can be found in the literature [2,3,4], but it basically focuses on the bellow summarized paradigms:
  • Horizontal Integration: This integration spreads collaboration between value chain companies, directly linked to manufacturing and process planning. Using their information and communication technologies (ICT), efficient data exchange between service providers (materials and energy suppliers) and contractors (logistics, production, marketing), and other companies that are part of the value chain, increasing the added value;
  • End-to-End Digital Integration: Proper use of information systems that enable digital support throughout the product life cycle. Tracking the product from the material line, manufacture, costumer use and end of life;
  • Vertical Integration: It refers to the integration of the different business levels of the company (such as ERP, MES, and field equipment), allowing flexibility and reconfiguration of the manufacturing systems.
Industry 4.0 incorporates current and emerging technologies, such as Internet of Things (IoT) and Cyber-Physical Systems (CPS), to improve industry [3]. The Internet of Things (IoT) has several currently generalized descriptions; however, it can be summarized as the integration of the main 4 entities: Internet of things; Internet of Data; Internet of Services and Internet of People.
Industry 4.0 Smart factories use advanced data analytics from thousands of cloud storage agents due to huge storage requirements. Given the interaction of thousands of agents, automatic identification is of crucial importance. RFID technology, being a dynamic identification technology, which allows updating read-write labels as opposed to data code systems that rely on static technology without possible updates, assumes a privileged position in the context of Industry 4.0. In this context, often the level of automation within the industry depends directly on the size of the company, where product traceability assurance is the main goal [5].
This paper presents an experimental approach to improve the marble industry production chain using new developed technologies, mainly RFID systems. The dynamic capabilities of the RFID (read-write) tags allow the physical characterization of the original block, through measured parameters, resulted from non-destructive tests that analyze the internal structure of the rocks, allowing the optimization of their subsequent cutting and transformation processes.
The main contribution of this paper is in the development of a proof-of-concept prototype where it is shown a way to digitalize new scientific information in the domain of the marble extraction industry, where RFID identification is the key factor to gather the scientific laboratory tests with the on-line databases needed to allow the optimization of the cutting and transformation processes in the plant.

1.1. RFID System Characterization

Industrial identification technologies have an important role regarding data integrity and reliability in the industry. It improves data quality and therefore allows more efficient regulatory actions optimizing the decision-making process [6]. Industrial identification introduces operational savings and improved efficiency, having a positive impact on public opinion, bringing transparency and confidence to clients and partners on the products. RFID systems allow automatic and independent identification of objects and people, mainly in indoor environments. This technology is based on the communication between tags and readers, through antennas, and by sending and receiving a unique identification through radio waves [7]. The fundamental limitations of RFID technology appear in electromagnetic restrictions; namely, the radiation properties of antennas and propagation phenomena [8]. RFID properties depend mainly on the frequency band (from low frequency to microwaves). High Frequency (HF) RFID systems can be used for mid-range and compact environments (<30 cm), while Ultra High Frequency (UHF) RFID systems allow for bulk reading and for considerably higher ranges (≈10 m), due to higher transmission speeds. RFID tags are unique identifying labels containing data that can be attached to objects. A tag typically has three components: (i) an integrated circuit that stores data and decode/code radio frequency signals; (ii) an antenna to receive and transmit signals; (iii) and a third system that is activated by a reader signal. When a tag passes in the proximity of the reader’s field, its antenna stores energy, allowing the tag to send radio waves [9].
As mentioned in [10,11], the tags can be grouped into three categories: Passive tags, Active tags and Semi-Active tags.
  • Passive Tags: dependent on the electromagnetic field generated by RFID reader in order to get activated (cheaper);
  • Active Tags: having built-in batteries which increase the range of the whole system as the tags do not depend on the reader’s electromagnetic field in order to get activated;
  • Semi-Active Tags: Theses tags have batteries; however, they can work like passive tags, allowing for activation without an internal power source.
Common tags can include read-only; write-once, or read/write data. Tags can be used for data storage, especially passive ones; however, a problem is the limited amount of memory available, so it is very common to register only the tag’s ID in the database and use it as a pointer to access the desired data [12]. RFID tags can have multiple physical characteristics: flexible/rigid, large/small, fragile/robust, and, depending on the application, have a single or multiple use. The tag’s performance depends on the properties of the marked product, since it can be solid, powder or liquid, influencing dielectric and permissiveness properties, and, consequently, the reading range [13].
As briefly mentioned above, RFID can be differentiated by the frequencies at which the system works. Commonly, different applications are allocated to different frequency ranges. Table 1 shows the commonly used frequency ranges and correspondent applications.
Currently, dual frequency (DF) tags are already used, making it possible to explore the advantages of UHF and HF at the same time, being an advantage over single frequency (SF) tags [14]. Finally, a brief comparison between RFID systems and the most commonly used identification systems—barcode 1D/2D—is summarized, in terms of advantages and disadvantages [9,11].
  • RFID Advantages:
    • Drastic reduction of workload. While Barcode systems can only read items, one by one, RFID systems allow multiple-tags readings;
    • RFID systems allow readings at longer distances (usually up to 10 m) while Barcode system needs visual contact;
    • RFID systems allow to read and write new data, updating the stored data. Barcode Systems can only read static data.
  • RFID Disadvantages:
    • RFID systems are more expensive than Barcode systems, especially when referring to active tags.

1.2. RFID Application Fields

RFID systems are being continuously spread in the majority of technological domains where data integrity and reliability are key business factors. In fact, the use of RFID tags can be seen in many different sectors as it can be briefly exemplified: (i) Manufacturing: where the use of RFID systems has enabled SAP [15] to be used in Enterprise Resource Planning (ERP), allowing efficient communication between producers and retailers [15]; (ii) Aerospace sector: where RFID tags allow better and cheaper maintenance of airport infrastructures [16]; (iii) Retail sector: where RFID tags are used to monitor temperature during frozen food transportation [17]; (iv) Health: where RFID tags allow to monitor the dynamic behavior of patients in hospitals [18] or traceability of blood bags [19]; (v) Logistics: where RFID systems allow tracking Marine Containers in stock [20]; (vi) Defense: where greater accuracy is obtained when RFID tagged parts are used in shipping/receiving materials [21]; (vii) Construction: where RFID systems are used in tracking pipes from the manufacturing plant to the delivery location [22]; (viii) Fashion: RFID tags are largely used in cloths in a way to improve the supply chain, reducing shrinkage, increasing efficiency and preventing stock leaks in warehouses [23].
Finally, Figure 1 illustrates the significant potential use of RFID systems following the entire Marble life cycle, beginning in the Lab-tests, where the structure of the Block is simulated through the evaluation of mathematical models running with experimental data from non-destructive tests (electrical, Ultrasound and Image: see Section 2) and ending at the customers.

2. Instrumentation in the Marble Extraction Industry

As reported in [24], the starting point of the marble industry is the quarrying of natural blocks, using several methods and tools. The natural blocks are properly cut in certain size, according to stone quality constraints and customer requests and then sent to manufacturing companies. Further, in these companies, many different stone-products are made by using different techniques such as cutting, resizing, filing, calibration and polishing. A crucial point in the value-chain of the extraction industry is the optimization of the cutting surfaces in order to maximize the quality and dimensions of the stone blocks avoiding the color and texture discontinuities due to different rock compositions. Therefore, the detection of such discontinuities by means of non-destructive tests is a continuous active research domain. This paper focuses on three of these methods that analyze the internal structure of the rocks, in order to optimize their subsequent cutting and transformation processes, thus enhancing their market value, reducing waste, environmental costs and transportation costs. These methods are known as: (i) Electrical Measurements; (ii) Ultrasound Measurements and (iii) Image Measurements.

2.1. Electrical Measurements

In line with [25], it is possible to run a non-destructive electrical test by measuring the internal resistivity of several points on the rock. This method is called the Electrical Resistivity Tomography (ERT). The ERT has three possible settings to work: Wenner, Schlumberger and Dipole-Dipole. In this paper the Dipole-Dipole method (Figure 2) was used, as this arrangement has low electromagnetic coupling between the current and potential circuits.
ERT has a simple operating principle, in which two points are chosen: one to inject the electric current (Electrodes A-B) and another to measure the voltage difference (Electrodes M-N). Considering Figure 2, where “a” is the distance between electrodes at each point (usually kept constant), and “L” is the distance between the pairs, apparent resistivity ρ can be evaluated by means of Equation (1):
ρ = π Δ V I L ( L 2 a 2 ) a 2
The above evaluated apparent resistivity is then used to identify the material composition of the measured area. Table 2 shows the resistivity and conductivity of some metamorphic stones, including marble. An important feature of the measurements is reached when the resistivity value is very high (infinite). In this case it means that the surface has internal spaces and consequently the stone present cracks, which are important to be mapped.

2.2. Ultrasound Measurements

According to [26], ultrasound measurements are useful when trying to find out if there are discontinuities inside the rock under analysis. This test uses a pulse generator, an oscilloscope and several transducers to send and receive signals, located in specific geometric points of the rock. The analysis is made on the Time of Flight (ToF) of the signal through the material. When unexpected delays appear, it indicates the existence of possible discontinuities. Figure 3 shows a typical set-up for ultrasound measurements. The Young’s Modulus can be calculated through Equation (2).
v e l o c i t y =   Y o u n g s   M o d u l u s D e n s i t y

2.3. Image Measurements

The study of the image is directly linked to the human ability to analyze images and therefore to classify stone discontinuities related to its surface appearance. The automation of this methodology uses video-cameras, digitalization and image processing. The digitalization process is the way computers can recognize images by splitting the image surface into a large number of digital pixels. The second process is the data-processing itself, in which computational algorithms analyze image characteristics [24]. In the case of the marble industry, image processing algorithms classify stones by surface colors and possible fractures [24]. Additional information on the subject can be found in [27,28,29].

3. Modelling of the Marble Block Structure

In this section the evaluated model of the block structure is shown, based on the above described non-destructive tests: electrical, ultrasound and image measurements. The large amount of data resulting from these measurements are necessary to build the block structure model. This data is then stored in a data base. An RFID tag, due to its storage capacity, records only the pointers that allow the costumer to rebuild the model and therefore to know the block internal structure.

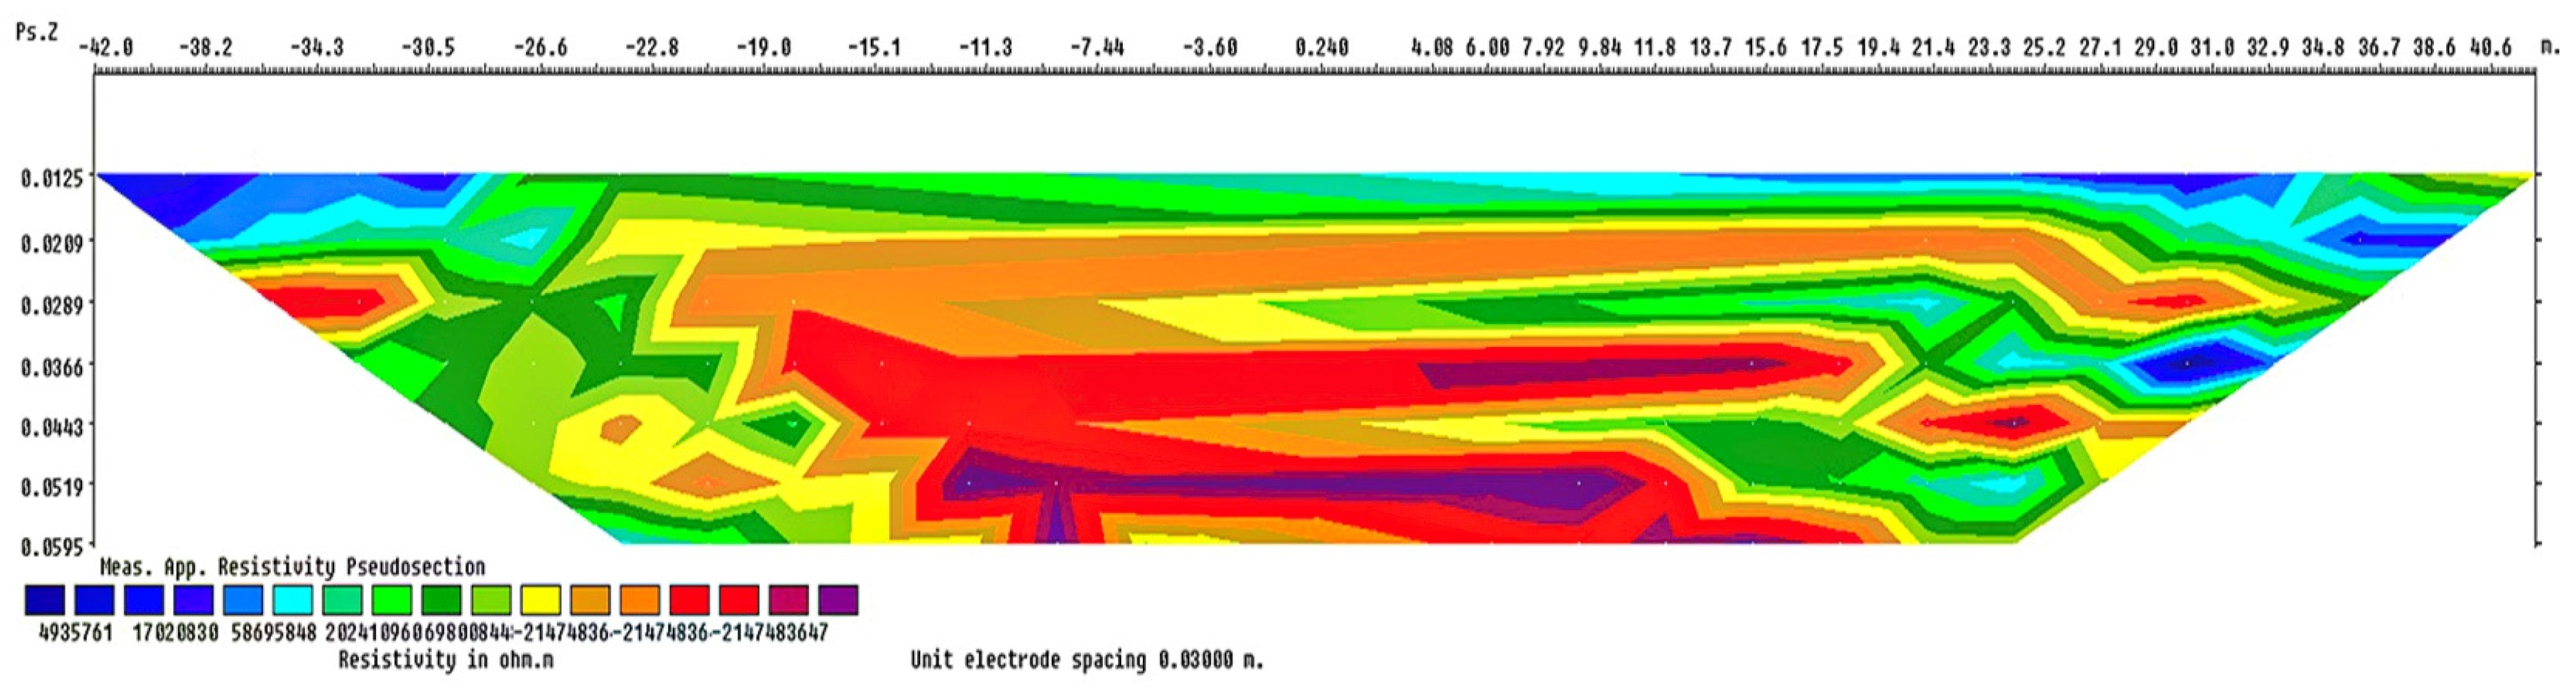
3.1. Electrical Tests: Modeling the Internal Structure

As previously explained, the methodology used to obtain the data from electrical test was the ERT with dipole-dipole arrangement, obtaining the apparent resistivity of the stone (Equation (1)). However, there is a need to process the data in the software-RES2DINV/RES3DINV [30]— that uses the Gauss-Newton least squares inversion technique with smoothness restriction to generate 1D, 2D and 3D images of the stone block. Figure 4 shows an example of the generated data (A-position, B-position, M-position, N-position, resistance, voltage, current and apparent resistivity). The data is structured in the output file, after processing, where the number of lines corresponds to the number of entry points.
In Figure 5 the processed data is shown resulting from the surface local resistivity measurements, where the colors represent the local resistivity values. Geometries showing light colors have low electrical resistivity and geometries showing dark colors have higher resistivity. Thus, measuring the electrical resistivity of all surfaces of the stone block it is possible to reconstruct a 3D-image, pointing out the location of discontinuities (cracks) in the rock.

3.2. Ultrasound Measurements: Modeling the Internal Structure

Using the above presented Equation (2), the ultrasound measurement model works with the flight time/speed of the sound model, applied to marble stone. Having a ultrasound sensor to measure the velocity and considering that marble has a theoretical density of 2500 kg/m3, the stone young’s modulus can be calculated (Equation (2)). Following the hypothesis that lower values of the speed of sound may represent cracks, because there are no barriers for the generated wave to pass, this is reflected directly in the young’s modulus, since it is possible to observe its lower values, meaning that there is less rigidity in the stone medium. Figure 6 shows the structure data obtained from typical Ultrasound measurements (DENSITY > SPEED > YOUNG’S MODULUS > POSITION-X > POSITION-Y > POSITION-Z).

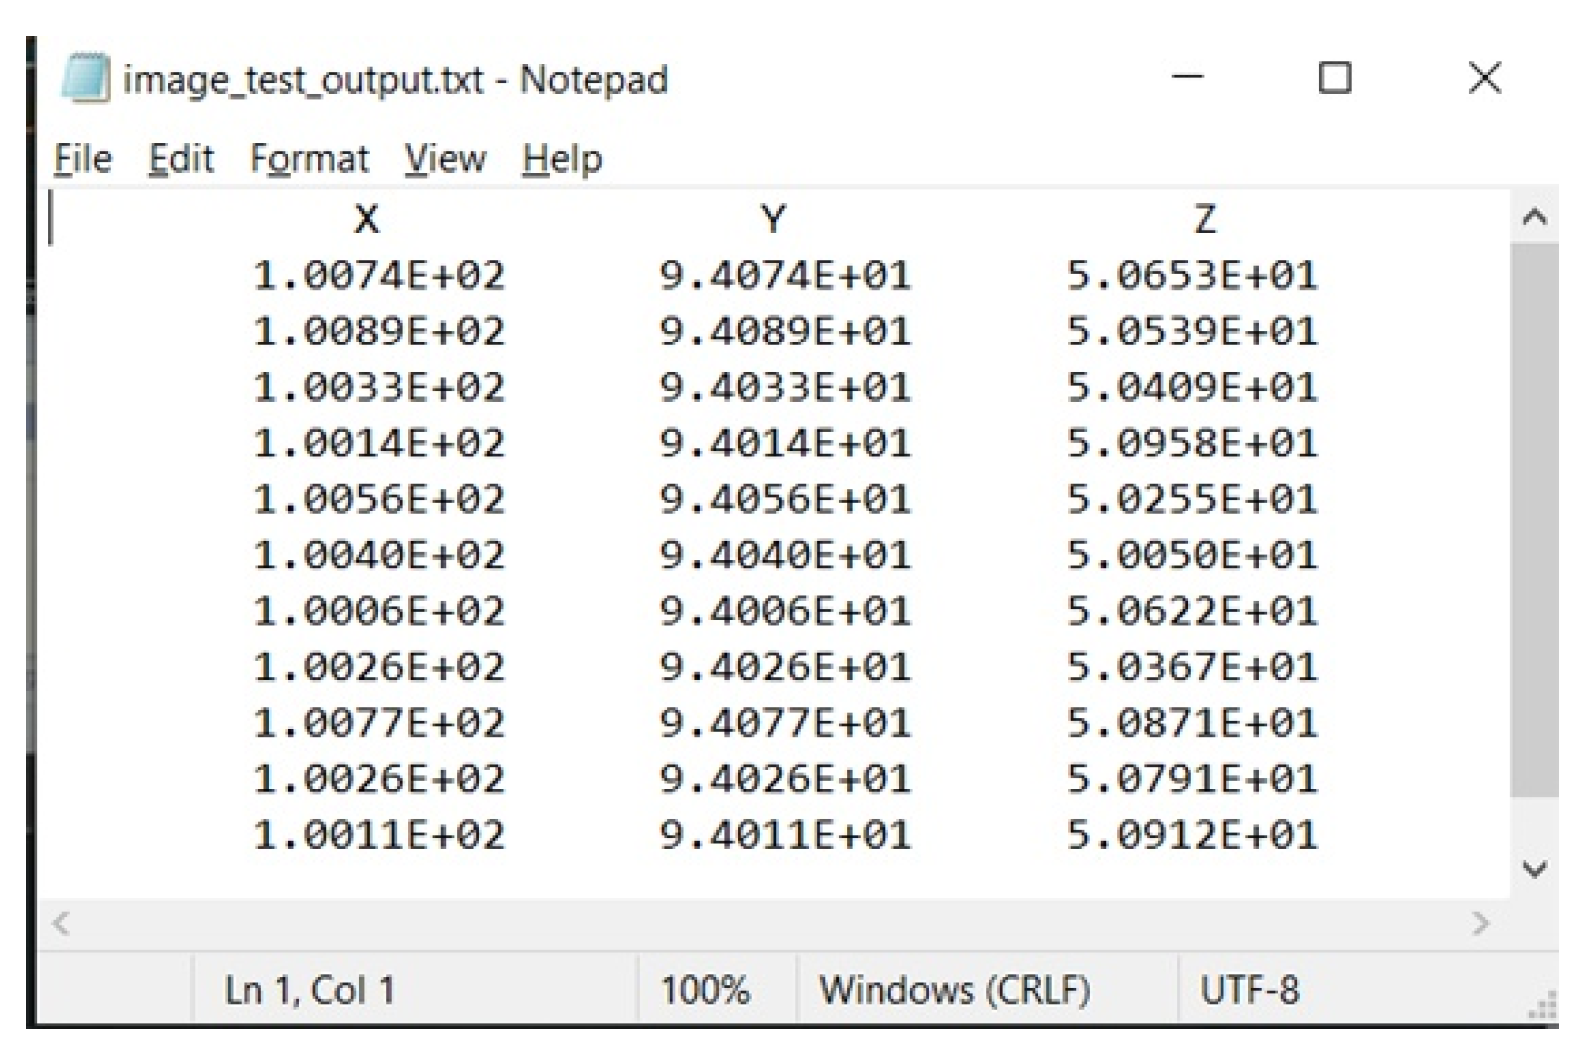
3.3. Image Tests: Modeling the Internal Structure

The three-dimensional image model is created from at least 3 images knowing, in advance, the dimensions of the block. Summarizing this process, the image processing is applied to each image with the MATLAB software [31] by initially transforming the RGB image in gray-scale image and then a threshold-filter to detect discontinuity lines that are potentially considered fractures. The identified fracture regions are treated by a curve fitting algorithm, obtaining the representative curve of that region and finally, again curve fitting is used to obtain the final image of crack location. Figure 7 shows the data structure of image tests locating cracks in the block surfaces (position-X; position-Y; position-Z).
Figure 8 shows the final output of the image processing tests, where computer-image algorithms process 3-perpendicular surface planes of the marble block, searching for superficial veins, and at the end it is supplied a 3-D image reconstruction, identifying crack location in the analyzed geometry.

4. Prototype Implementation

In this section, a proof-of-concept prototype will be presented where a way to digitalize new scientific information in the domain of the marble extraction industry is shown, where RFID identification is the key factor to gather the scientific laboratory tests with the on-line databases needed to allow the optimization of the cutting and transformation processes in the plant. The implemented prototype focuses on the study of two phases of the Marble Life Cycle (see Figure 1): Block-Parameter Tests (Laboratory Measurements) and Block-Production (Cutting). Figure 9 illustrates the designed communications strategy for both platforms, where the RFID systems play a critical role in the process of data saving, data updating and data recovering, as it will be seen later in Section 4.3.
The used specific equipment to run the tests on the Laboratory Prototype (as illustrated in Figure 9) is described below:
  • BLOCK-PARAMETER TESTS
    (i)
    RFID Read/write Sensor and Antenna: RFU620-10100 from SICK [32], that performs reading/writing on UHF tags, has UHF working frequency (860–960 MHz), adjustable integrated antenna with power of 0.25 W (or ERP, 24 dBm) and circular working space (angle of 100° opening), range up to 2 m and support connection with protocols: Ethernet, PROFINET, Serial RS-232, CAN, USB 2.0, Profibus DP
    (ii)
    RFID Tags: Alien H3 EPC Global Gen 2 Passive UHF tag from Alien Technology [33], with working frequency of (860–960 MHz), low power consumption, 10m range with suitable antenna, ISO/IEC 18000-6C certified, has 800 bits of total memory (1oo bytes), of which 512 bits of user memory (64 bytes) and 96 bits (12 bytes) for EPC (Electronic Product Code), extensible to 496 bits (62 bytes), depending on the use of the other parts of the memory.
  • BLOCK-PRODUCTION
    (i)
    SCADA—Supervisory Control and Data Acquisition: SIMATIC PC STATION— WINCC RT ADVANCED from SIEMENS [34], used for process visualization and control, allows to generate process data csv/txt files and connection to Microsoft SQL SERVER databases, among other features.
    (ii)
    PLC—Programmable Logic Controller: S7-1200 (CPU 1214AC/DC/Relay) from SIEMENS [35], with integrated features—14 digital inputs, 10 digital outputs (relay), 2 analogical inputs 0–10 volts (10-bit resolution) and PROFINET communication interface.
    (iii)
    HMI—Human Machine Interface: KTP600 HMI from SIEMENS [36], with 6 “display, 256 TFT color, touchscreen and PROFINET communication interface.
    (iv)
    RFID Read/write Sensor and Antenna: equipment similar to that presented previously in Block-Parameter Tests.
    (v)
    RFID Tags: equipment similar to that presented previously in Block-Parameter Tests.

4.1. Block-Parameter Tests

As stated earlier, the implemented prototype focuses on the study of the integration of RFID-systems in the improvement of the block extraction industry. Therefore, a RFID system was added in this phase, showing the huge potential of bringing the digitalization into the process of block measuring and data saving, using the RFID systems as a vehicle to promote this integration. Figure 10 and Figure 11 show the hardware schematic layout and an overview of the laboratory test bench, located at the laboratory of University of Évora, Portugal.

4.2. Block-Production Tests

Concerning the Block-Production platform, the hardware schematic layout is illustrated in Figure 12. Figure 13 shows the correspondent implemented platform in the Laboratory of the University of Évora, Portugal, pointing out the selected hardware.
In the Block-Production platform it was used a Scada server, for data acquisition and management and a SIEMENS PLC to communicate with the virtual cutting machine. All equipment was connected by Ethernet-bus.

4.3. RFID-System Operation

As already shown in the last section, the necessary data to be recorded for each stone block largely surpasses the memory limit of usual RFID-tags. Therefore, a communication protocol was developed for the RFID reader. The developed protocol uses the tags’ UUI (Universally Unique Identifier) to write an identification string (ID) that will be the primary search key in the new developed database tables. SOPAS engineering software [37] was used to configure the communication protocol (see Figure 14). The obtained data can be sent to the data base by two different entities, as shown previously in Figure 9: (i) PC-application (Block-Parameter Tests); (ii) SCADA Server-application (Block-Production).
The PC-application has been developed in Delphi Language [38] to run with the RFID readers, following the developed protocol. Figure 15 shows the application’s structure. The application has several developed functions such as: TCP/IP connections; online database connection; register a new object, choose area.
Below follows a brief explanation of the functionalities of the developed Delphi-Application:
  • TCP/IP: The use of this protocol was conditioned to the sensors used, mainly because it is a protocol that is widely used and easily inserted in commercial systems;
  • ONLINE DATABASE: The online database is a necessary tool when real-time solutions are needed. This type of structures is much more suitable when compared to the existing File-data storage possibilities (txt, excel, or even local bases);
  • REGISTER NEW OBJECT: It allows the system that is operated by the PC-LAB to immediately add new objects and register new data files;
  • CHOOSE AREA: Following the idea that the system has the possibility to track the object in several geographical areas, the user can indicate the location that corresponds to the received data: PC-LAB station, future life cycle stations—as transport or retail sector, etc. (see Figure 1). This feature makes the system scalable.
As it was already referred, when pointing out the advantages of Online Databases, this application was designed to work with Online Databases. Therefore, an Online platform (Web-platform) has been developed to perform the following tasks: (i) receive data from the application (DATE-TIME-UUI-AREA); (ii) register new objects to be monitored; (iii) register new areas; (iv) register new file-attachments; (v) search for Object-registers (DATE-TIME-AREA and FILES). An illustration of the developed features is shown in Figure 16.
The following functionalities have been implemented on the Web-Platform:
  • OBJECTS: Register or remove new objects from the database table (“TABLE_OBJECTS”);
  • AREAS: Register or remove new areas from the database table (“TABLE_AREAS”);
  • FILES: Register or remove new files from the database table (“TABLE_FILES”);
  • SEARCH OBJECTS: Search the database for records (scans and files) pointing the name of the object.
  • SCANS: View all scans registered in the database.

5. System Analysis and Discussion

In this section, the capabilities of the developed system are analysed and discussed. As already referred in Section 1, the focus of this proof-of-concept implementation was to illustrate the key role of RFID systems as integrators of laboratory data with Plant requirements. Therefore, the analyses of the performance of the developed Web-Platform (characterized in Section 4.3) gives a significant overview of the system functionality. The requests implemented on the developed Web-Platform were: (i) to monitor real-time objects; (ii) to consult historic records; (iii) and to access physical properties of the rock.
The direct connection between the SCADA-Server and the online database was hampered by a compatibility problem, since common SCADA-Servers only support SQL SERVER databases and the developed Web-Platform found it more appropriate to use the MYSQL. Therefore, it was necessary to develop a conversion application, in Delphi, that converts the SQL SERVER, where the query is processed to MYSQL where the data will be stored. This conversion application also assures that the data to be sent is the same as that already existing in the table. Additionally, a Visual Basic script (VBS) was developed to send the data from the SCADA system to the SQL SERVER, observing the following sequence: (i) RFID sensor reads and sends the data to the PLC; (ii) PLC sends the read data to both the HMI and the Scada server; (iii) Both HMI and SCADA server show the Users the received data; (iv) SCADA server updates the data and activates the VBS script to send the data to SQL SERVER; (v) The developed Delphi-Application (“DATATRANSFER”) checks if the last new data in SQL SERVER is equal to the last record in MYSQL, if Not, add it, if Yes, ignore it to avoid repetition.
Referring now to the main features of the developed Web-Database, as is it common to all Databases, this platform needs a data manager to maintain the consistency of the recorded information, namely the connection between each tag-ID and the correspondent file-records relating the measured data (Electrical resistivity, Ultrasound and Image data) along with administrative functions that are established for security reasons. However, as the real time access is free, it is important the existence of an automatic function, defined from the application, to identify that a new object is registered on the database. The developed structure, to organize the data in the database, follows the graph shown in Figure 17.
As shown in Figure 17, the DATE—TIME—UUI—AREA data is sent to the database, specifically for the “TABLE_SCANS” table. The UUI is the name of the object that passed through the sensor, it is identified in the table of registered objects (“TABLE_OBJECTS”) by its registration code, and finally this code is what you will see in the file table (“TABLE_FILES”), where the registered data of the object is stored.
Finally, Figure 18 shows two Menus of the implemented Web-Platform. The back image corresponds to the start Menu where the registered data from real-time tracking (DATE-TIME-ID-AREA) are shown. The ordering of the shown data follows: the last input object is the first out, so the first records are the most recent. The front image shows the result of an object search, namely OBJECT-10000, where the platform links the Tag-ID with the measurement data of the three tests (Electrical resistivity, Ultrasound and Image tests).
Analysing Figure 18, we can see that the purpose of the implemented Prototype was completely fulfilled. It is clearly demonstrated that RFID systems can match in the developed Web-context a specific stone block with its specific physical characteristics evaluated by the models, based on electrical, ultrasound and image processing measurements.

6. Conclusions

This work presents an implementation strategy which is seen as a valuable asset for the marble industry, as it demonstrates through a Proof-of-concept prototype how the integration of RFID-systems and web platforms, are key players to support the connectivity among the business partners in the production chain. The use of RFID systems along with the developed Web-Platforms bring a new digitalization context where all partners (end customers, engineers, architects) will be able to choose suitable marble products, according to their visual surfaces, or electrical properties, even before the stone is cut, still in the quarry.
This paper shows a way to digitalize new scientific information in the domain of the marble extraction industry, where RFID identification is the key factor to gather the scientific laboratory tests with the on-line databases needed to allow the optimization of the cutting and transformation processes in the plant.
For future work, it is envisaged to design a fully automated decision support system for the material’s cut. The system will have the ability to suggest cutting plans based on criteria for optimizing material, energy, and other processing costs associated with the visible patterns on the material’s surface, resulting from the cut. These patterns will be analyzed in a database by intelligent algorithms in order to optimize the total gain according to the market demand.

Author Contributions

Formal analysis, J.F.; Funding acquisition, M.T.; Investigation, L.A. All authors have read and agreed to the published version of the manuscript.

Funding

This research was funded by ALT20-03-0247-FEDER-017659/Portugal 2020, Portugal 2020.

Conflicts of Interest

The authors declare no conflict of interests.

References

  1. European Parliament. European Study. 2016. Available online: http://www.europarl.europa.eu/RegData/etudes/STUD/2016/570007/IPOL_STU(2016)570007_EN.pdf (accessed on 6 February 2021).
  2. Otles, S.; Sakalli, A. Industry 4.0: The Smart Factory of the Future in Beverage Industry. In Production and Management of Beverages; Elsevier Inc.: Amsterdam, The Netherlands, 2019. [Google Scholar]
  3. Sishi, M.; Telukdarie, A. Implementation of Industry 4.0 technologies in the mining industry—A case study. In Proceedings of the 2017 IEEE International Conference on Industrial Engineering and Engineering Management (IEEM), Singapore, 10–13 December 2017; pp. 201–205. [Google Scholar] [CrossRef]
  4. Bartodziej, C.J. The concept Industry 4.0. In The Concept Industry 4.0; Springer Fachmedien Wiesbaden: Wiesbaden, Germany, 2017; pp. 27–50. [Google Scholar] [CrossRef]
  5. Frankó, A.; Vida, G.; Varga, P. Reliable identification schemes for asset tracking and production in industry 4.0. Sensors 2020, 20, 3709. [Google Scholar] [CrossRef] [PubMed]
  6. Gladysz, B.; Ejsmont, K.; Kluczek, A.; Corti, D.; Marciniak, S. A method for an integrated sustainability assessment of rfid technology. Resources 2020, 9, 107. [Google Scholar] [CrossRef]
  7. Denuwara, N.; Maijala, J.; Hakovirta, M. Sustainability benefits of RFID technology in the apparel industry. Sustainability 2019, 11, 6477. [Google Scholar] [CrossRef] [Green Version]
  8. Škiljo, M.; Šolić, P.; Blažević, Z.; Perković, T. Analysis of passive RFID applicability in a retail store: What can we expect? Sensors 2020, 20, 2038. [Google Scholar] [CrossRef] [PubMed] [Green Version]
  9. Dolgui, A.; Proth, J.M. RFID technology in supply chain management: State of the art and perspectives. IFAC Proc. Vol. 2008, 41, 4464–4475. [Google Scholar] [CrossRef]
  10. Domdouzis, K.; Kumar, B.; Anumba, C. Radio-Frequency Identification (RFID) applications: A brief introduction. Adv. Eng. Inform. 2007, 21, 350–355. [Google Scholar] [CrossRef]
  11. Tanner, D. Applications for RFID Technologies in the Food Supply Chain. In Reference Module in Food Science; Elsevier: Amsterdam, The Netherlands, 2015. [Google Scholar] [CrossRef]
  12. Álvarez López, Y.; Franssen, J.; Álvarez Narciandi, G.; Pagnozzi, J.; González-Pinto Arrillaga, I.; Las-Heras Andrés, F. RFID technology for management and tracking: E-health applications. Sensors 2018, 18, 2663. [Google Scholar] [CrossRef] [PubMed] [Green Version]
  13. El Khamlichi, M.; Melcon, A.A.; Mrabet, O.; Ali Ennasar, M.A.; Hinojosa, J. Flexible UHF RFID tag for blood tubes monitoring. Sensors 2019, 19, 4903. [Google Scholar] [CrossRef] [PubMed] [Green Version]
  14. Barge, P.; Biglia, A.; Comba, L.; Aimonino, D.R.; Tortia, C.; Gay, P. Radio frequency identification for meat supply-chain digitalisation. Sensors 2020, 20, 4957. [Google Scholar] [CrossRef]
  15. Mary, B.; Connor, C.O. LEGO Puts the RFID Pieces Together. RFID Journal. 2006. Available online: http://www.rfidjournal.com/articles/view?2145 (accessed on 6 February 2021).
  16. Collins, B.J. RFID Lands at Frankfurt Airport. RFID Journal. February 2005. Available online: https://www.rfidjournal.com/rfid-lands-at-frankfurt-airport (accessed on 6 February 2021).
  17. Collins, B.J. SYSCO Gets Fresh With RFID. RFID Journal. June 2005. Available online: https://www.rfidjournal.com/sysco-gets-fresh-with-rfid (accessed on 6 February 2021).
  18. Collins, J. RFID Delivers Healthy Return for Hospitals. RFID Journal. 2005. Available online: http://www.rfidjournal.com/articles/view?1537 (accessed on 6 February 2021).
  19. Fanti, A.; Casu, S.; Mazzarella, G. A numerical estimation of a RFID reader field and SAR inside a blood bag at UHF. Electronics 2016, 5, 77. [Google Scholar] [CrossRef] [Green Version]
  20. Gambon, J. RFID Contains Solution to Chinese Shipping Problems. RFID Journal. 2006. Available online: http://www.rfidjournal.com/articles/view?2707 (accessed on 6 February 2021).
  21. Roberti, B.M.; Tracking, A.; Diego, S.; Thomas, B. Navy Tracks Broken Parts from Iraq. RFID Journal. 2005. Available online: http://www.rfidjournal.com/articles/view?1982 (accessed on 6 February 2021).
  22. Collins, B.J.; Industries, S.; Wood, C. Case Builds for RFID in Construction. RFID Journal. 2004. Available online: http://www.rfidjournal.com/articles/view?720 (accessed on 6 February 2021).
  23. Wessel, R. Clothing Manufacturer Invests Its ROI in RFID—RFID Journal. RFID Journal. 2006. Available online: http://www.rfidjournal.com/articles/view?2547/3 (accessed on 6 February 2021).
  24. Akkoyun, O. An evaluation of image processing methods applied to marble quality classification. In Proceedings of the ICCTD 2010—2010 2nd International Conference on Computer Technology and Development, Cairo, Egypt, 2–4 November 2010; pp. 158–162. [Google Scholar] [CrossRef]
  25. Loke, D.M. Electrical imaging surveys for environmental and engineering studies—A practical guide to 2-D and 3-D surveys Copyright. August 2000, 200, 61. [Google Scholar]
  26. Boudani, M.; Wilkie-Chancellier, N.; Martinez, L.; Hébert, R.; Rolland, O.; Forst, S.; Vergès-Belmin, V.; Serfaty, S. Marble Characterization by Ultrasonic Methods. Procedia Earth Planet. Sci. 2015, 15, 249–256. [Google Scholar] [CrossRef]
  27. Amit, Y. 2D Object Detection and Recognition. In Learn Computer Vision Using OpenCV; The MIT Press: London, England, UK, 2002. [Google Scholar] [CrossRef]
  28. Muguercia, L.; Bosch, C.; Patow, G. Fracture modeling in computer graphics. Comput. Graph. 2014, 45, 86–100. [Google Scholar] [CrossRef]
  29. Rosin, P.L.; Žunić, J. 2D Shape Measures for Computer Vision. In Handbook of Applied Algorithms: Solving Scientific, Engineering and Practical Problems; Wiley-IEEE Press: Hoboken, NJ, USA, 2007; pp. 347–371. [Google Scholar] [CrossRef] [Green Version]
  30. Software, G. RES2DINVx64 Features. 2014. Available online: http://www.geotomosoft.com/ (accessed on 6 February 2021).
  31. MATLAB 2020a, The MathWorks, Inc., Natick, Massachusetts, United States. Available online: https://www.mathworks.com/products/matlab.html (accessed on 6 February 2021).
  32. SICK. “RFU62X”, RFU620-10100 Datasheet. November 2020. Available online: https://cdn.sick.com/media/pdf/2/52/052/dataSheet_RFU620-10100_1062599_en.pdf (accessed on 6 February 2021).
  33. Alien Technology. HIGGS 3 EPC Class 1 Gen 2 RFID Tag IC, Higgs 3 Datasheet. February 2020. Available online: https://www.alientechnology.com/download/higgs-3-datasheet/?wpdmdl=7560&ind=QUxDLTM2MCBIaWdncy0zIDIwMjAtMDItMjEucGRm (accessed on 6 February 2021).
  34. Siemens. SIMATIC HMI WINCC. WinCC Runtime Advanced Readme. December 2017. Available online: https://cache.industry.siemens.com/dl/files/803/109753803/att_937533/v1/ReadMe_WinCC_RT_Advanced_V15_enUS.pdf (accessed on 6 February 2021).
  35. Siemens. SIMATIC S7-1200 CPU 1214C. 6ES7 214-1BG40-0XB0 Datasheet. October 2020. Available online: http://www.tic.co.th/file_upload/download/20180308095829.pdf (accessed on 6 February 2021).
  36. Siemens. SIMATIC HMI KTP 600 Basic Color PN. 6AV6 647-0AD1-3AX0 Datasheet. December 2020. Available online: https://datasheet.octopart.com/6AV6647-0AD11-3AX0-Siemens-datasheet-12174366.pdf (accessed on 6 February 2021).
  37. AG, SICK. SOPAS ET 2018.4_EN. Available online: https://www.sick.com/ag/en/sopas-engineering-tool-2018/p/p367244 (accessed on 6 February 2021).
  38. Technologies, E.; International, B. Delphi Language Reference. Available online: http://docwiki.embarcadero.com/RADStudio/Rio/en/Delphi_Language_Reference/ (accessed on 6 February 2021).
Figure 1. Marble Life Cycle.
Electronics 10 00491 g001
Figure 2. Dipole-Dipole Array.
Electronics 10 00491 g002
Figure 3. Speed of Sound Measurement.
Electronics 10 00491 g003
Figure 4. Post-processing data structure from electrical test.
Electronics 10 00491 g004
Figure 5. Surface electrical resistivity of a marble block.
Electronics 10 00491 g005
Figure 6. Post-processing data structure from ultrasound tests.
Electronics 10 00491 g006
Figure 7. Post-processing data structure from image tests.
Electronics 10 00491 g007
Figure 8. 3D image reconstruction identifying crack location from the processing of 3 perpendicular surface images.
Electronics 10 00491 g008
Figure 9. Communications strategy in the Laboratory Prototype: (i) Block-Parameter Tests and (ii) Block-Production.
Electronics 10 00491 g009
Figure 10. Schematic layout of RFID-System used in the Block-Parameter Tests.
Electronics 10 00491 g010
Figure 11. Block-Parameter Tests: Experimental Implementation at University of Evora: 1 = RFID Read/write Sensor and Antenna (SICK RFU620-10100), 2 = Data Acquisition system (NI DAQ-6009), 3 = Passive RFID-tag (Alien H3 EPC Global Gen 2), 4 = Current Source (Keithley 228A) and Digital Multimeter (Agillient 34410A).
Electronics 10 00491 g011
Figure 12. Schematic layout of RFID-System used in the Block-Production Tests.
Electronics 10 00491 g012
Figure 13. Block-Production: Experimental Implementation at University of Evora: 1 = SCADA server PC where the SCADA application runs, 2 = RFID Read/write Sensor and Antenna (SICK RFU620-10100), 3 = PLC - Programmable Logic Controller (SIEMENS Simatic S7-1200), 4 = HMI -Human Machine Interface (HMI SIEMENS Simatic KTP600).
Electronics 10 00491 g013
Figure 14. Structure of the communication protocol developed for RFID-reader.
Electronics 10 00491 g014
Figure 15. Structure of the developed Delphi-Application for RFID integration.
Electronics 10 00491 g015
Figure 16. Structure of the developed Web-Platform.
Electronics 10 00491 g016
Figure 17. Data Structure of the developed Web-Platform.
Electronics 10 00491 g017
Figure 18. Structure of the developed Web-Platform.
Electronics 10 00491 g018
Table 1. Frequency Ranges and Applications.
Frequency RangeRangeApplications
(125–134) kHzLFAnimals Identification
13.56 MHzHFAccess and Security
(433–956) MHzUHFLogistics
2.45 GHzUHFMobile Communication
5.9 GHzSHFIntelligent Transportation System (ITS)
LF = low frequency; HF = high frequency; UHF = ultra-high frequency; SHF = super-high frequency.
Table 2. Resistivity/Conductivity of Metamorphic Rocks.
MaterialResistivity (Ω × m)Conductivity (S/m)
Granite 5 × 10 3   10 6 10 6 2 × 10 4
Basalt 10 3   10 6 10 6   10 3
Slate 6 × 10 2   4 × 10 7 2.5 × 10 8   1.7 × 10 3
Marble 10 2   2.5 × 10 8 4 × 10 9   10 2
Quartzite 10 2   2 × 10 8 5 × 10 9   10 2
Publisher’s Note: MDPI stays neutral with regard to jurisdictional claims in published maps and institutional affiliations.

