Article

A Hierarchical Approach for Android Malware Detection Using Authorization-Sensitive Features

1
Shenzhen Key Lab for High Performance Data Mining, Shenzhen Institute of Advanced Technology, Chinese Academy of Sciences, Shenzhen 518055, China
2
Shenzhen College of Advanced Technology, University of Chinese Academy of Sciences, Shenzhen 518055, China
3
College of Mathematics and Informatics, Fujian Normal University, Fuzhou 350007, China
*
Author to whom correspondence should be addressed.
These authors contributed equally to this work.
Electronics 2021, 10(4), 432; https://doi.org/10.3390/electronics10040432
Submission received: 15 January 2021 / Revised: 4 February 2021 / Accepted: 7 February 2021 / Published: 10 February 2021
(This article belongs to the Special Issue Data Security)

Abstract

:
Android’s openness has made it a favorite for consumers and developers alike, driving strong app consumption growth. Meanwhile, its popularity also attracts attackers’ attention. Android malware is continually raising issues for the user’s privacy and security. Hence, it is of great practical value to develop a scientific and versatile system for Android malware detection. This paper presents a hierarchical approach to design a malware detection system for Android. It extracts four authorization-sensitive features: basic blocks, permissions, Application Programming Interfaces (APIs), and key functions, and layer-by-layer detects malware based on the similar module and the proposed deep learning model Convolutional Neural Network and eXtreme Gradient Boosting (CNNXGB). This detection approach focuses not only on classification but also on the details of the similarities between malware software. We serialize the key function in light of the sequence of API calls and pick up a similar module that captures the global semantics of malware. We propose a new method to convert the basic block into a multichannel picture and use Convolutional Neural Network (CNN) to learn features. We extract permissions and API calls based on their called frequency and train the classification model by XGBoost. A dynamic similar module feature library is created based on the extracted features to assess the sample’s behavior. The model is trained by utilizing 11,327 Android samples collected from Github, Google Play, Fdroid, and VirusShare. Promising experimental results demonstrate a higher accuracy of the proposed approach and its potential to detect Android malware attacks and reduce Android users’ security risks.

1. Introduction

With the popularity of mobile Internet, smartphones have been integrated into everyone’s life. According to the China Internet Information Center statistics, mobile Internet users’ proportion in China’s total Internet users increased year by year from 2016 to 2019 [1]. By June 2019, the number of mobile Internet users in China reached 847 million, the proportion of mobile Internet users in China has gained 99.1%. This shows that access to the Internet through smartphones has become the primary way for Internet users. Smartphones store more and more personal privacy information; consequently, more and more attackers develop mobile malware to attack smartphones, bringing substantial security risks to mobile users.
By February 2020, the iOS operating system’s global market has exceeded 20%, while that of Android has surpassed 74%. The two mobile operating systems occupy almost all mobile markets [2]. Due to the closeness of the iOS platform and the strict review process when the application is released, there are very few attacks against the iOS platform. Compared with iOS, Android is an open-source mobile operating system. There is no unified APP store. Users can download the installation package from the third-party APP store or manually install the program, enabling users to control their mobile phones more flexibly. However, this flexibility of Android also makes the Android platform more vulnerable to malware attacks. Mobile malware refers to infectious and destructive mobile phone programs, including malicious fee deduction, privacy theft, remote control, malicious communication, tariff consumption, system damage, fraud and rogue behavior, etc. [3].
There are various methods to detect malware, e.g., dynamic behavior methods [4] monitor a program’s behavior when running. It is difficult to achieve real-time dynamic behavior monitoring and analysis on mobile phones. Static behavior methods [5] are to extract the malware’s static characteristics, which is not effective in detecting that malware that uses obfuscation, encryption, or polymorphism techniques. A hybrid analysis [6] is a technology that combines dynamic and static methods to analyze unknown programs. Although the hybrid method has the advantages that dynamic and static methods do not, it generally needs to consume more system resources and spend more time analyzing programs. With the rapid development of deep learning in recent years, many researchers [7,8] began to use it for malware detection. Although deep learning technology has a significant effect on malware detection due to its incomprehensibility, the deep learning model’s performance in different environments is quite different because of the massive dependence on data sets and extracted features. These works were just focused on the detection or classification of malware. They did not consider the details of the similarities between malware software.
Correspondingly, there are two types of features: static analysis features and dynamic analysis features. Static analysis features can be extracted from the application, scanned, such as header scan, tail scan, and integrity check, to obtain information. Static analysis features include requested permissions [9,10,11,12], Application Programming Interface (API) calls [13,14,15,16], and basic blocks [17], usually acquired by disassembling the program and analyzing an AndroidManifest file [18]. Dynamic analysis features contain system function, network feature, API, and so on, which can be gained by running a program to be detected and monitoring its execution in a controlled environment, such as on a virtual machine or physical device. For instance, papers [19,20] have mainly focused on features at native level API calls. Hou et al. [21] extracted the Linux system API invoked by the application through dynamic analysis. Most of the recent works only pay close attention to a single feature or two features.
We found the following problems from the above-mentioned literature to the best of our knowledge and proposed our solution to overcome these issues. Firstly, an application contains many functions, including system functions and user functions customized by the developer. However, the primary way of an Android application interacting with the system is through the system functions, but the number of times each system function is called is different. Therefore, after research and analysis, we find non-key functions (user functions and functions that are just called one time) account for more than key functions are called twice and more. If all functions are processed, non-key functions will consume a vast amount of system resources. This paper then extracts the key functions and digitizes them through the sequence of API calls, which improves the application’s analysis performance and reflects the original function of the program. Secondly, instead of extracting and analyzing the whole program directly, we take a basic block as a research unit, which is a set of instructions that cannot be branched into or out of, and it represents the overall characteristics of an application. Thirdly, there are always some drawbacks to using a simple feature; we develop hierarchically extract authorization-sensitive features to identify the most significant features that can be effective in distinguishing between benign and malicious applications. As the malicious software has gradually become diverse and complex due to the rapid increase of its development, the traditional malware detection methods, i.e., static, dynamic, and hybrid method appear inefficient for tackling such harmful programs. Therefore, we focused on the similarities of malware software and proposed a hierarchical approach that combines machine learning technology with deep learning to deal with the unpredictable malware’s variety. The hierarchical approach extracts authorization-sensitive features that can be effective in distinguishing between malicious and benign applications. According to the extracted different features, we adopt the hierarchical classification method for Android malware detection. The significant contributions of this paper include the following aspects:
  • Instead of extracting and analyzing all Android static and dynamic features separately, we hierarchically extracted four authorization-sensitive features: basic blocks, permissions, API calls, and key functions.
  • We extract basic block features based on the proposed multichannel transforming method. Mapping Table and Finding Adjacent Free Pixels method are put forward to deal with pixel conflict. Except for macro features, we extract permissions and API calls to build a feature library. We also pay close attention to key functions called by the application. A key function call graph is generated to research the key function call relationship.
  • The novelty of our proposed hierarchical malware detection approach is as follows: firstly, for the system functions, we use traditional techniques to hash key function and calculate the similarity of a similar module to test; secondly, taking into account the permissions and API calls, eXtreme Gradient Boosting (XGBoost) is used to classify; thirdly, for the given basic block features, CNN classifier is used for detection; finally, CNNXGB model that integrates XGBoost and CNN models is built to improve the classification accuracy.
  • Apart from the novelty, another contribution is the collection of Android samples (67,577) between 2014 and 2020 to initialize a similar module feature library for our experiments. Secondly, we adopt 11,327 Android samples to train the deep learning model. Then we conduct an extensive evaluation of our dataset to compare the detection results with widely used detection methods.
The rest of this paper is organized as follows. Section 2 reviews the related work concerning this paper. Section 3 presents the proposed method, including feature extraction and malware detection methods. Section 4 describes the experimental setup, results, and evaluation. Finally, we conclude the paper and outline the main directions for future research in Section 5.

2. Related Work

This section elaborates the different literature reviews, which are essential to acknowledge the malware detection methods for Android applications.

2.1. Malware Detection Methods

Scholars at home and abroad conducted various detection schemes in the face of the increasingly severe Android malware trend. The detection methods of mobile malware mainly include the signature, dynamic analysis, static analysis, and deep learning. The malware detection methods based on signature focus on signature codes [22,23,24], such as semantics [25], threat behavior sequence [26], similarity [27,28,29,30,31], etc. Many manufacturers widely use these methods, which have a great advantage in detection efficiency, but they depend entirely on the signature database’s size. In addition, mobile devices’ storage and computing capacity are limited, which further limits the application of the detection method based on signature in mobile devices.
Dynamic analysis methods [22,23] monitor a program’s network behaviors, process calls, and interprocess communication to analyze whether the program has harmful behaviors. These methods can effectively detect malicious programs with encrypted code. However, the Android system’s fragmentation is severe, and each mobile phone manufacturer has added a customized part to the Android system. Static behavior methods are to extract the features that represent the program’s behavior without executing the program, and then detecting the malware according to the data. The common static features include API calls, bytecode, permission data, Dalvik, etc. [32,33]. Nevertheless, static behavior methods cannot detect some malicious programs that are executed by downloading malicious code from a regular program.
Recently, machine learning has shown state-of-the-art performance for malware detection. This approach is based on learning the characteristics of the malware. This detection process can be generally split into two steps: feature extraction and classification. In the first step, kinds of features are extracted from samples including malware and benign, to represent the program, and then a classifier is trained to automatically recognize the malware. Li et al. [34] used the API calls and permissions in danger level as features and then used Deep Belief Network (DBN) model to train. The training accuracy on the data set Drebin was 90%. Luo et al., directly transformed APK (Android application package) files into images and then extracted image textures with the DBN model as a part of the features, API calls, permissions, and activities as another part of the features. The training accuracy on the Drebin dataset was 95.6% [35]. The machine learning method is dependent on data sets and extracted features.

2.2. Supportive Features for Malware Detection

There are several features for detecting malicious applications on Android. Generally, they mainly revolve around permissions requested, API calls, and system calls extracted with static analysis or dynamic analysis techniques. There are other features for malware detection, such as native layer code, the whole application, Dalvik, etc.
Permission is a security mechanism proposed by Google for component access between applications and the restriction of some security-sensitive items within applications. Android is a permission-separated operating system, whose permissions are easy to extract [36], so permission features have become the most widely used Android malware detection features. However, there are some problems: (1) Android system has a large number of permissions; if we use all of the permissions it will consume substantial computing resources, (2) abuse of permission may cause a high positive false rate, and (3) some programs may bypass permission checking using special skills which makes the permission-based method invalid.
API is a call interface left by the operating system to the application, making the operating system execute the application commands (actions). API called by an application program is the embodiment of its behavior. Therefore, some researchers [15] propose to detect malware by finding features with API calling in the system, but (1) the number of APIs is relatively large, and if all of them are used, it is easy to cause excessive resource consumption, (2) Android applications tend to integrate third-party libraries, which also call many APIs, and (3) no consideration is given to the difference in the frequency of using API by malicious and regular programs.
The function interfaces provided to applications by the framework layer of Java are called Android system functions. System functions provide useful functions to applications such as window, network, string, and other related operations. Therefore, analyzing the system functions can obtain accurate information about the applicants’ behaviors. Li and Qiao [37] proposed a method based on simhash to detect function reuse from high-volume code. The similar code blocks are extracted and determine whether the applications are similarly based on the calling relationship between function codes. Ruttenberg et al. [38] proposed an identifying shared components method to find malware code functional relationships. These methods focus on code reuse, and the complexity of code similarity determination is high, which will result in less efficiency and unable to adapt to the rapid growth of malware.
The detection methods based on permission, API, and system functions usually focus on the program’s locality. Some researchers also use transforming malicious programs into images and then combining them with deep learning to detect malware. Qiao and Jiang [39] proposed a multichannel visualization method for malware detection with deep learning in Windows. Three 256 × 256 matrices were extracted from the original Windows malicious program like the three channels of RGB image, which were combined to generate an RGB image. LeNet5 trained the image to obtain the detection model. Nataraj [40] and Xue [41] put forward to convert the whole application into the image, and then input the image as a feature to the CNN network. CNN requires that the size of input images are the same, so how to change the different sizes of applications into the same size images is a difficult problem. Nataraj [40] solved that problem by separately outputting the different sizes of programs into various sizes of images for training, which is difficult to be applied to the CNN network. Xue [41] used functions can obtain accurate information about the applicants’ behaviors. Qiao [37] proposed a method based on simhash to map applications to the same size images. Still, it could not effectively solve the problem of pixel point burst under the same coordinate by the simple summation, which would lose some original information. Luo [35] converted the whole program as a binary stream into an image without ignoring the non-program code files, such as pictures, audios, videos, etc., which would cause relatively large irrelevant noise in the generated picture. We found few related studies about the Android malware detection method with a hierarchical approach, such as [42] proposed a two-level hierarchical denoise network method utilizing LSTM. It detects the malware by decompiling the Android files. However, this hierarchical approach is not flexible due to only two-level structures that can encounter accuracy issues with different features. Our proposed hierarchical approach has different levels, which facilitate the various features to detect Android malware. As mentioned earlier, these pieces of literature encouraged us to propose a novel method for Android malware detection.

3. Proposed Method

This section presents the overall workflow of our approach. Figure 1 illustrates the system architecture of the hierarchical approach for Android malware detection using authorization-sensitive features. It consists of five significant steps: Data Collection, Decompilation, Feature Extraction, Classification Algorithms, and Malware Detection Model. The outline of our proposed method is following as:
  • Data Collection: We collected 67,577 Android samples (.apk) between 2014 and 2020 to initialize a similar module feature dataset which contains the benign and malicious applications.
  • Decompilation: To analyze the Android application, we transferred the unreadable program code to a readable file, for which we unzipped the Android application, got its .Dex file, which decompiled a .Dex file into a smali file.
  • Feature Extraction: First of all, we extract binary code stream features, basic block by using RGBA (multichannel picture) method; next, extract local features, permissions, and API calls; and then extract system functions to get key function call graph. Moreover, we built a similar module feature library.
  • Classification Algorithms: Based on the extracted features, we use the hierarchical classification method. On account of the key functions, we use the sequence of API calls to serialize them, calculate the similarity of a similar module. In contrast, for the permissions and API calls, the XGBoost classifier is used to classify. Similarly, for the extracted basic block features, the CNN classifier is utilized for classification.
  • Malware Detection Model: When an anonymous sample comes for detection, we check the similarity, if there is a record in the similar module database before or not. If there is, then it is malicious, and it will be added to a similar module feature library, which is dynamically expanded. Otherwise, we use a combinatory deep learning model CNNXGB, with specific conditions, if the probability p > 0.5 , then the program is malicious or else benign. If it is malicious, it will be added to a similar module feature library.
We provided a detailed process of feature extraction and malware detection models in this section for the broad-range explanation of these steps. However, the other steps will be elaborated on the experimental section.

3.1. Feature Extraction

In this paper, we extracted four different types of features. The comprehensive process of these feature extraction is given below.

3.1.1. Basic Block Features

The application’s binary code stream harbors important information for malware detection. We take the basic block as a research unit to process the whole application to a multichannel 1024 × 1024 PNG picture. That is taking images as the characteristics of the program. As mentioned earlier [39,40,41], there are still the following problems with converting the whole application into a picture representation:
  • How to change the different sizes of applications into the same size pictures?
  • How to effectively solve the problem of pixels burst under the same coordinate?
  • How to reduce the irrelevant noise of the generated picture?
This subsection proposes its novel solution for the problems mentioned above. We map each basic block to a 1024 × 1024 pixels picture of 1,048,576 pixels (about 1 million), enough to hold most of the basic blocks for the first question. This method can keep the same size of all the pictures. For the second question, we add A channel based on the RGB method to deal with conflict. The value of A channel can be acquired by the Mapping Table and Finding Adjacent Free Pixels method. For the third question, the standard approach is to open the program in the form of a binary stream, read the program data in 8-bit as a unit [40]. Assuming that a program’s size is S bytes, then a program can finally be represented by an S dimensional vector. The composition of a program includes not only code but also many resource files used by the program, such as pictures, audio, etc. Therefore, the generated picture contains a lot of noise. Our method is to unpack the Android applications, discard all resource files such as pictures, audio, and videos used in the program, and only keep the files storing the program code. The detailed processes will be presented in the following paragraph.
A program is composed of some algorithms which contain many conditional judgments in the specific implementation, and different results of conditional decisions will lead to executing different code branches. Therefore, we use conditional judgments as a division point; a program is divided into many basic blocks. Figure 2 shows many basic blocks separated by a program and the relationship among them.
After extracting all the basic block instructions, a sequence is mapped into a 44-bit binary sequence using the simhash method [43]. This binary sequence is divided into 10, 10, 8, 8, and 8 binary sequences, from the most significant to the least significant. The values and meanings of each sub-sequence are shown in Table 1.
The picture is composed of pixels. This paper takes the upper left corner of the picture as the coordinate system’s origin, stretches to the right as the x-axis, drawn down as the y-axis, respectively. The whole picture is divided into grids with unit 1 as the length. Each grid represents a pixel. The default initialization color value of the pixel is (0, 0, 0, 255).
Mapping conflicts comprise of two different types: the same colors’ mapping conflicts and the different colors’ mapping conflicts under the same coordinate. For these two conflicts, this study offered two different solutions. For the first conflict, if the basic block’s mapping coordinates are the same and the color is the same, then the value of channel A with the range of [0, 255] is used to represent the frequency of conflict. The paper defines the mapping table between the value of channel A and the conflict frequency, which is shown as Table 2. For example, we suppose that a basic block after conversion is mapped to (245, 418), and RGB color is (50, 56, 168). For the first mapping, its default value of channel A is 255, so its corresponding RGBA color is (50, 56, 168, 255). If the pixel point has 1500 conflicts, the corresponding value of channel A is 150, taking into account in Table 2, so its RGBA color is (50, 56, 168, 150), as shown in Figure 3.
For the second conflict, the paper proposes a new algorithm, which is the Finding Adjacent Free Pixels method, then the conflicting pixels will be placed in the free pixels searched. That is, if the coordinate of the conflicting pixel is ( x , y ) , then take ( x , y ) as circle, define the coordinate of ( x , y ) with a radius of r as ( x i , y r ) , ( x i , y + r ) , ( x r , y + j ) and ( x + r , y + j ) , and i [ r , r ] , j [ 1 r , r 1 ] . The importance of the pixels with the same radius is regarded as equivalent. Search for free pixels from the top left corner in turn and end when the free pixel is found, then the free pixel is used as the filling point. Each Android application will eventually become a 1024 × 1024 RGBA image by Finding Adjacent Free Pixels. Those images that represent the features of the application will be stored in the Android feature library. The pixel where the radius r is 1 ( r = 1 ) shows in Figure 4, the orange pixel in the center is the conflict pixel, while the free pixels used to fill are blue.
Discarding the mapping or fusing the mapping value with the existing pixel points will lose the original and current information. The pixel space of a 1024 × 1024 picture is about 1 million. For most programs, the space is sufficient, and there must be some empty unfilled pixels. The problem of image size inconsistency and mapping conflict is solved through Finding Adjacent Free Pixels. At the same time, the original information of the application program is effectively preserved. The malicious and benign sample image features of Android are shown in Figure 5 and Figure 6, respectively.

3.1.2. Permission and API Calls Features

Except for the basic block features, we also focus on each system function called in the basic blocks, as Figure 7; wherein the red boxes represent the basic block, the underlines indicate the functions called. However, calling different functions requires the system’s permission, and access to operating system functionality and system resources need API calls used by the android application. Therefore, the permissions and API calls represent the local feature of an application.
Permission Extracting: If an application wants to use a system function in the Android operating system, it needs to apply to the system for the corresponding permission. Therefore, permissions are an essential characteristic of application behavior. With the continuous development of the Android system, it provides more and more permissions. By analyzing the source code of Android 4.0 to 10.0, the number of native permissions in each version of the Android system is shown in Figure 8. It shows that the latest Android 10.0 version has more than 500 permissions. If all permissions are extracted as features, the feature dimension will increase dramatically. We select 22 necessary permissions [36] as research objects. The names and corresponding meanings of each permission are shown in Table 3. The vector corresponding to the permission feature is F P = ( x 1 , x 2 , , x 22 ) , and F P i corresponds to the i th component in Table 3. By traversing all permissions requested by the application program, if the requested permission is the ith component in Table 3, set x i to 1, otherwise to 0.
API Calls Extracting: Although permission features can reflect programs’ behavior to a certain extent, because of the universality of permissions, and some applications apply for particular permission but not necessarily use it at runtime, it is not reliable to detect malicious programs only with permissions. A program that wants to interact with the system must invoke the the system’s API interface, so the system API gathered in the program is also a reflection of program behavior. The frequency of some system API calls by Android is different in malicious programs and benign programs [15]. Therefore, we propose API Calls Frequency Difference method to make statistics on the system API calls of benign and malicious programs in the sample set. The detailed steps are as follows:
  • Read the smali file, extract the code between “.method” and “.endmethod” to obtain the function body, which reflects the structural information among API calls.
  • Extract the APIs, which is called by the Android system.
  • Travel the entire application, and repeat steps 1 and 2.
  • Count the times that the benign applications in the dataset call each API, and calculate each API’s frequency in the benign applications.
  • Count the times that the malware calls each API and calculate each API’s frequency in the malware.
  • Compare the frequency with which the same API appears in a benign and malicious application.
Based on the proposed API Calls Frequency Difference method, we extract the top 40 system APIs with the enormous difference in the call frequency; the results are shown in Table 4. In counting the system API call frequency, this paper excludes the third-party library integrated by the application program to prevent the system API’s statistical results. The vector corresponding to the API features is recorded as F A = ( x 1 , x 2 , , x 40 ) , then the number of calls to the ith API in the application is counted and set x i to this value.

3.1.3. Key Function Call Graph (KFCG)

Some fundamental terms and definitions are used for the description of the key function call graph, which can be defined as:
  • User function: the functions defined by the developer, called user functions;
  • Key function: the user function called by two or more system functions, called key function;
  • Non-key function: the user function or functions called one-time by a system is called non-key function;
  • Key function call graph (KFCG): a function call graph composed of key functions is called a key function call graph.
An application contains many functions, but the primary way that an Android application interacts with the system is through the system functions. After research and analysis, we find that all system function call times are different, and non-key functions account for more than key functions. If all functions are processed, non-key functions will consume a tremendous amount of system resources. This paper then extracts the key functions and digitizes them through the sequence of API calls, which improves the application’s analysis performance and reflects the original function of the program.
The detailed steps for how we construct the key function call graph are as follows:
  • Traverse through the function body, find each called function in order, and store it in a key-value pair. The key is the globally unique identifier of the function, and the value is a list, 1 indicating that the function is the key function, and 0 indicating that the function is the non-key function.
  • Process all smali files using step 1 to get function call graphs (FCG).
  • Use an adjacency matrix to represent the function call graph, in which 1 means that there is a calling relationship between two functions while 0 means there is no calling relationship.
  • Remove the non-key functions from the FCG to get KFCG, and then obtain key function call table.
How do we transform FCG to KFCG? Function call graph (FCG) is used to represent the calling relationship between function blocks. Let K F C G = ( V , E ) , where V and E represent the vertices and edges of the graph KFCG, respectively. KFCG is a directed acyclic graph, and it should not contain self-loop and recursive functions. If a function FA calls the function FB, then the number of hops between these two functions is called the distance from FA to FB, written as D I S T A N C E ( F A , F B ) . For u , v V , D I S T A N C E ( u , v ) satisfies:
  • D I S T A N C E ( u , v ) is initialized to 0;
  • if there are multiple paths from u to v, choose the shortest route;
  • if u calls v directly then D I S T A N C E ( u , v ) = 1 ;
  • generally, D I S T A N C E ( u , v ) equals the number of non-key function between u and v plus 1.
For example, all functions of the application and the called relationships of each function are shown in Table 5 (uppercase letters indicate key functions, lowercase characters indicate non-key functions, and fancy letters represent system call functions). For the function A, it is a key function, and four functions (the non-key function a, the key function B, and the system call function S 1 and S 2 ) are called successively in its function body. According to Table 5, we can initialize the function call graph, as shown in Figure 9, and then remove the non-key functions one by one updating the call distance between functions. For non-key function a, since A calls a and a calls C, the hop value A to C should be updated to 2 after removing a; A calls B directly, the hop value of A to B is less than the one of A to a to B. Therefore, the hop value of A to B is not updated, as in Figure 10a. For non-key function b, since B calls b and b calls C, the hop value B to C should be updated to 2 after removing b. The resulting key function call graph (KFCG) is shown in Figure 10b. Then we can get key function call table, as shown in Table 6.

3.2. Malware Detection Approach

In the previous Section 4, we extracted different features from Android applications. In this subsection, we use those features to detect malware. For key function, we consider the details of the similarities between malware. Suppose a similar module cannot make sure whether an unknown sample is a malware. In that case, we adopt other features. Considering the permissions and API calls, XGBoost is used to classify, and for the given basic block features, the CNN classifier is used to detect malware. Simultaneously, the CNNXGB model is built to improve the classification accuracy.

3.2.1. Similar Module Detection

In contrast to [37,38], our method is based on the Android system function call sequence and can be effectively used to extract similar modules between malware. A similar module can be used to determine whether the two Android applications are identical. For instance, for the sample α to be detected, we first extract a known malicious sample β from the similar module feature library, then calculate their similarity. If the two values are identical, it can be judged that the sample α is a malicious program; otherwise, it is a non-malicious program.
When selecting a sample β , it will take too long to traverse the malicious sample database one by one. This paper uses an inverted index to choose a comparison subset from the malicious sample database to solve this problem. Then the samples in the subset are all the samples to be compared with sample α . Following is the generation method of the comparison subset. Set the k th application in the sample library as A P P k , gain the all function’s Hash value F 1 k , F 2 k , , F k N ( k ) included by A P P k , N ( k ) represents the number of function included by A P P k . There may be the same function among multiple applications. By reversing this mapping, we can get the mapping relationship between the function and the application.
We use the hash values of the sequences of API calls as the function’s flag. Suppose there is a function f in the application and the sequences of API calls of the function f are F 1 , F 2 , , F n . In that case, we connect these sequences with a colon (:), then get a string “ F 1 : F 2 : F 3 : : F n ”, next take the MD5 value of the string as the unique flag of the function f, finally get the similar module graph (SMG), as Equation (1), and the corresponding matrix is the similar module (SM). When we extract all of the SMs of the collected samples, we build a similar module feature library.
S M G = C 11 C 12 C 1 i C 1 m C 21 C 22 C 2 i C 2 m C i 1 C i 2 C i i C i m C m 1 C m 2 C m i C m m
where, C i j denotes the distance from F i to F j .
In order to compare two similar modules, it is necessary to unify their dimensions, which contains two steps. First, we extract the same function from the two similar modules to form a common similar module matrix. Then we can acquire the similarity value, as Equation (2), which lies between 0 and 1, and the larger the value is, the more similar the two.
S I M ( α , β ) = i , j f d ( C α i j , C β i j ) i , j f s ( C α i j , C β i j )
where
f d ( C α i j , C β i j ) = 0 w h e n C α i j = 0 o r C β i j = 0 1 w h e n C α i j = C β i j 0 m i n ( C α i j , C β i j ) m a x ( C α i j , C β i j ) o t h e r
and
f s ( C α i j , C β i j ) = 0 w h e n C α i j = 0 a n d C β i j = 0 1 o t h e r

3.2.2. Detection with CNNXGB

Due to the limited number of samples in a similar module feature database, some malicious samples are not similar to any modules in a similar module database. This section builds a deep learning model CNNXGB based on XGBoost and CNN by extracting the permission, frequency of API calls, and basic blocks of the Android application program.
We can acquire permission features, frequency of API features, and RGBA picture features transformed by basic blocks from the above processing. Then the paper proposes a new CNNXGB detection algorithm to improve the detection accuracy. The CNN algorithm can realize end-to-end learning, and the middle features can be obtained by automatic learning. The XGBoost algorithm is a combination of a series of classification regression trees; its advantages are uneasy about overfitting, fast training, and strong interpretability [44]. CNNXGB detection algorithm combines the goodness of CNN and XGBoost. Half of the model is a linear stack of CNN convolutional layer to process RGBA image features, and another part is the XGBoost model that deals with permission and API features. The flow chart of the CNNXGB detection model is shown in Figure 11.
In the multi-classification problem, CNN will output several probability values to the predicted target in the fully connected layer, indicating the probability that the target belongs to each category. In this study, the classification of Android malicious programs is a two-fold classification problem. CNN will output the probability values of normal and malicious programs, respectively, and the prediction results of XGBoost are similar to those of CNN. Suppose CNN and XGBoost respectively obtain the probability that the program to be detected is malicious as p 1 and p 2 , and their weights are w 1 and w 2 . In that case, the probability that the program is detected as malicious as follows:
P = w 1 p 1 + w 2 p 2
when P 0.5 , the program to be detected is malicious; otherwise, it is a normal program. In this paper, CNN only deals with one feature; however, XGBoost handles two features: permission and API. Thus, the weight of CNN detection result w 1 is set to 1 / 3 , and the weight of XGBoost detection result w 2 is set to 2 / 3 .

4. Experimental Results and Analysis

In this paper, two sets of experiments are conducted to evaluate our proposed malware detection approach’s performance. Firstly, the detection performance using extracted authorization-sensitive features separately. Secondly, we developed a hierarchical Android malware detection system by comparisons with other often-used classification methods.

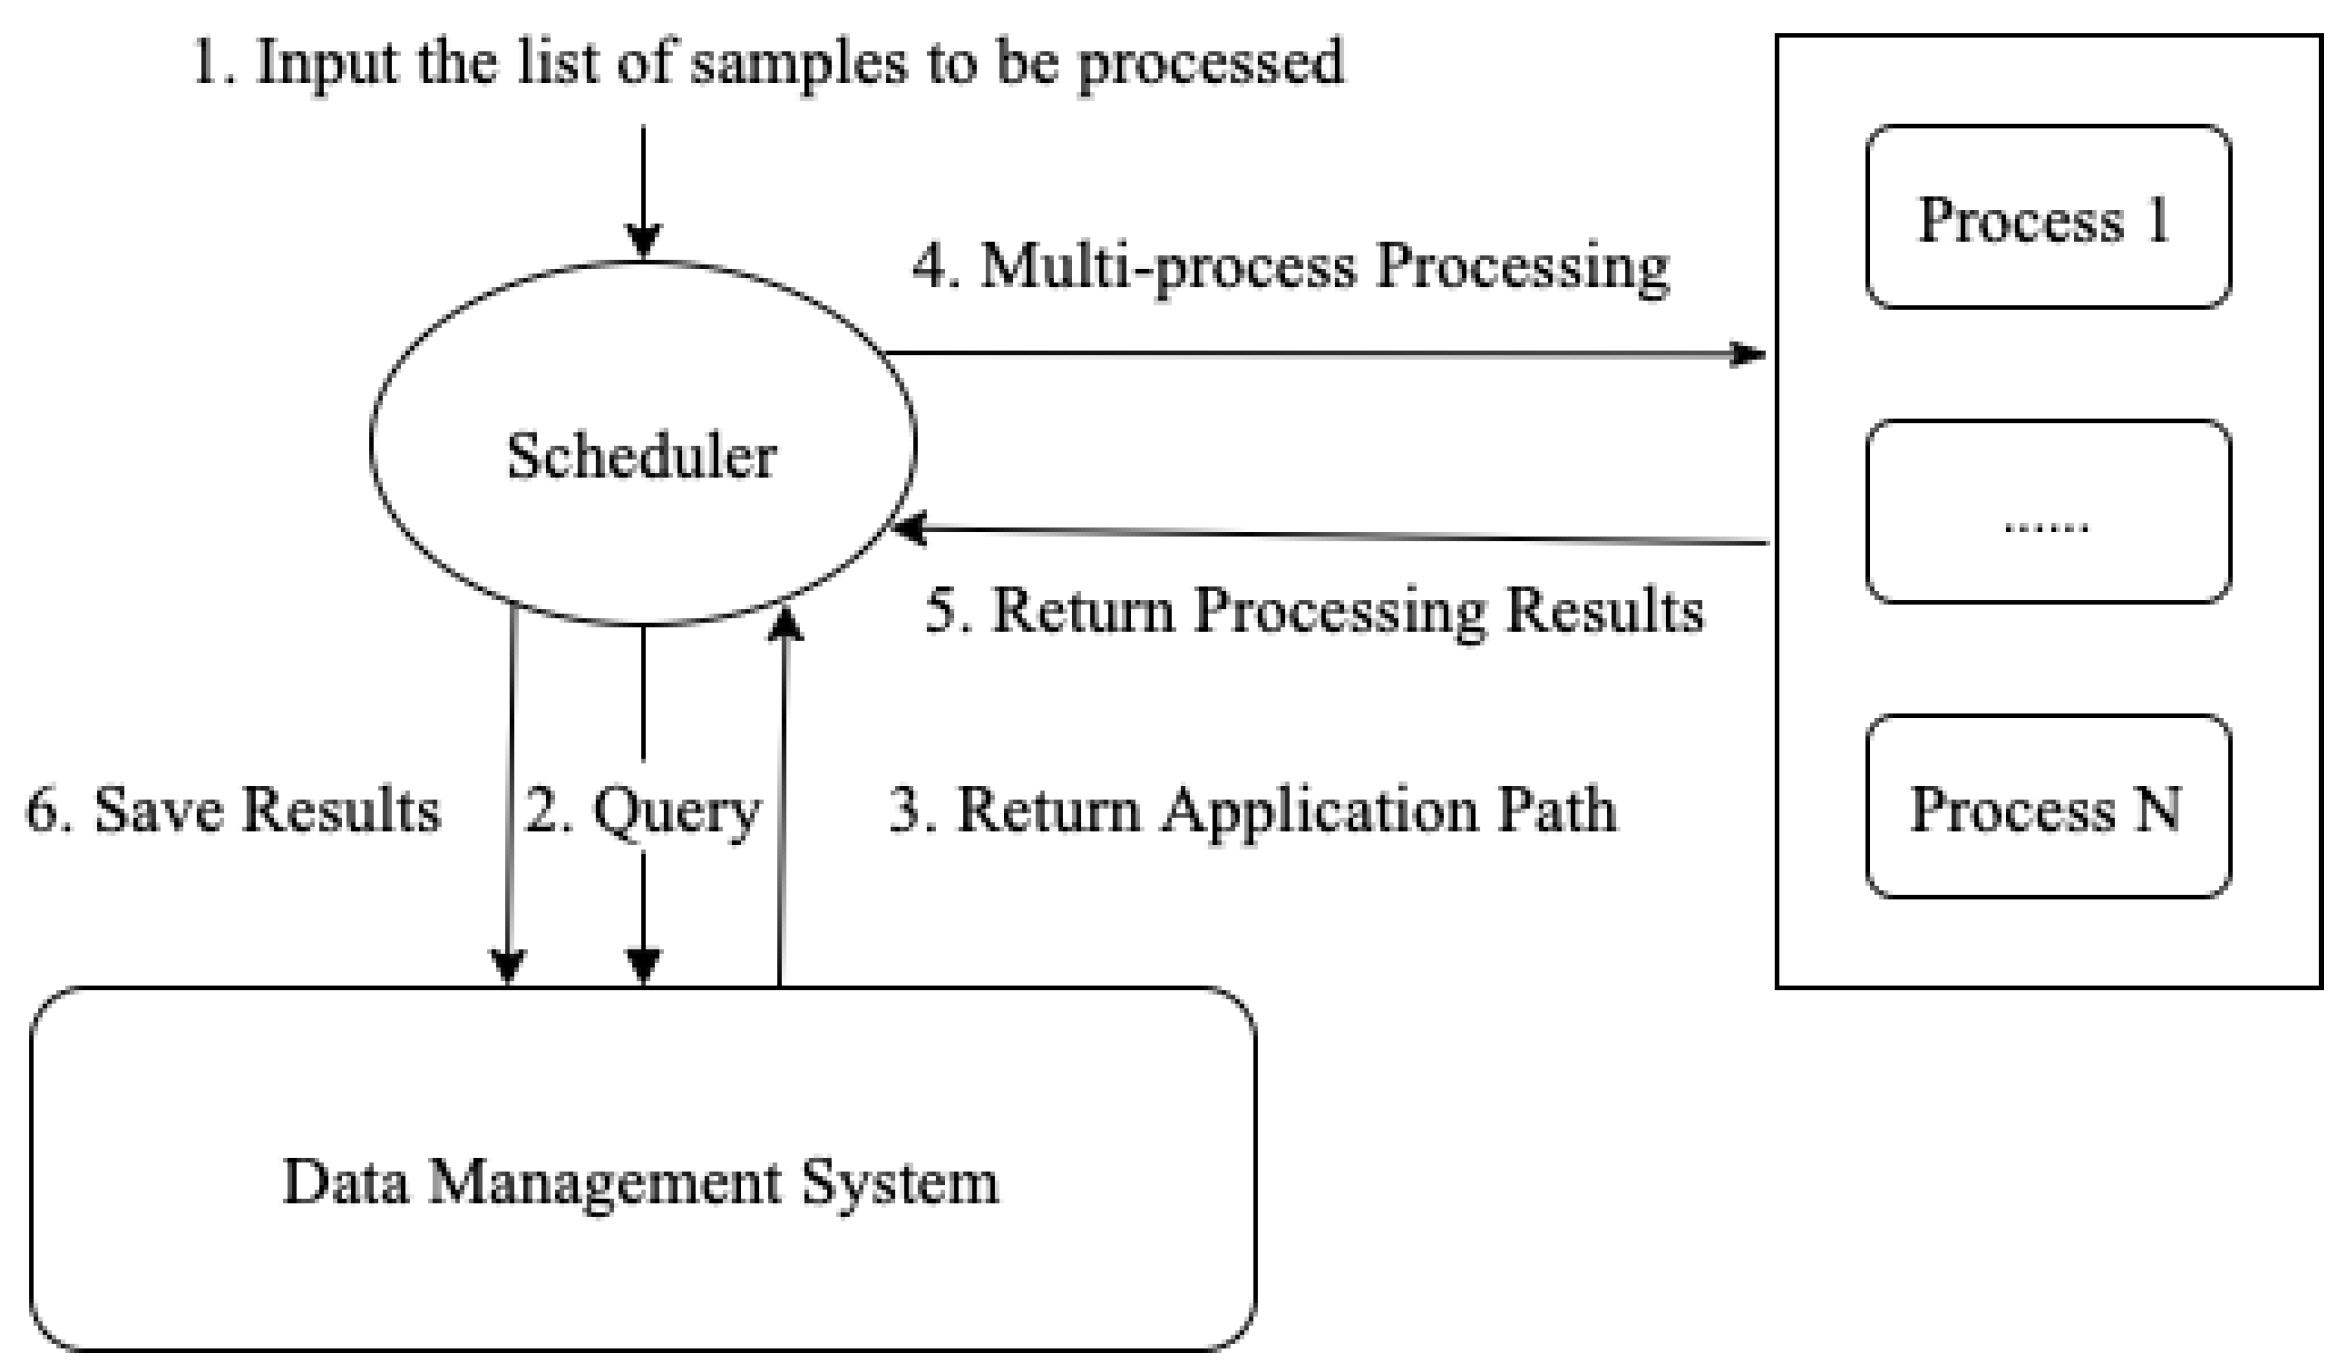
4.1. Data Collection and De-Compilation

First, we collected 67,577 Android samples between 2014 and 2020, as shown in Table 7, of which the number of the normal samples is 17,564, and the number of the malicious samples is 50,013. An initial database of similar modules for Android malware detection is created based on a sequence of API calls from these raw samples. Second, we download the experimental data, including 6116 malicious samples and 5211 normal samples, mainly from Github, Google Play, Fdroid, and VirusShare [45]. The SHA256 list of samples can be obtained from Archive [46].
Before extracting the features of the Android application, we need to decompile the application dataset. On the one hand, to get the similar module based on the sequence of API calls, we use Apktool to decompile to get a recognizable smali assembly code. On the other hand, it is necessary to decompile the Android application with Androguard [48] to obtain its Dalvik code. The preprocessing steps are shown in Figure 12.
  • Prepare the Hash value list of all samples;
  • input the Hash list into the scheduler;
  • the scheduler queries the sample storage path in the data management system according to the hash value of each application;
  • after the data management system returns the application path, the scheduler groups the applications and starts multiple processes for processing;
  • when the scheduler obtains the processing results of multiple processes, the results are stored in the Android feature library.
Each process with one program simultaneously; thus, multiple processes can efficiently and quickly handle large data quantities. In each processing, the study uses Anroguard to get the basic information of the application and uses LibScout to analyze the program’s third-party Java library [43,49]. As a result that the third-party library is not the program’s implementation code, to eliminate its interference, our method records the third-party package’s name. In the subsequent analysis, the third-party library code will be excluded based on the package name. The tools and extracted information used by each process to manage Android applications is illustrated in Table 8.

4.2. Experiment Setup

Different types of machine learning classifiers [11,50,51] such as support vector machine (SVM), decision trees(DT), random forest (RF), and deep learning classifiers [14,40,41,52] are used to produce models that can be used to detect mobile malware. SVM draws on a hyperplane to separate two classes with maximal margin, widely used in malware classification. DT learns decision rules from the given features to build a rule-based model. There are also some DT variants, i.e., C4.5, ID3, C5.0, and CART. The depth of the tree may bring an overfitting problem. RF is an integrated learning product, where many decision trees are integrated into a forest and combined used to predict the outcome. It will also overfit on some noisy classification or regression problems. XGBoost is a blended learning algorithm that combines weak classifiers to form a robust classifier [44]. The basic idea is to train a weak classifier from the training set using initial weights and update the weights based on its learning error rate. The weights of sample points with high learning error rates are given more attention in the subsequent weak classifiers. It is repeated to produce a robust classifier model consisting of several simple weak classifiers. XGBoost is not easily overfitted and can be fast trained. CNN is a feedforward neural network consisting of four layers: convolutional layer, pooling layer, fully connected layer, and output layer. When the input data undergo multiple convolutional and pooling layers, the obtained salient features are passed through the full connected layer for advanced inference. Finally, using mathematical statistics methods, output the corresponding results [53]. It has excellent performance for extensive image processing and has been applied to various fields in recent years, such as face recognition, medical diagnosis, voice recognition, malware detection, etc.
The configuration of the experiment running environment and the main packages adopted in this study are presented in Table 9. We use 30% of the dataset samples as a test dataset, 70% as a training dataset. To assess the accuracy of our algorithm, some metrics such as true positive (TP), false positive (FP), true negative (TN), and false negative (FN) are introduced. DT, RF, SVM [54,55,56] are chosen as classifiers to compare with our model.
For the CNN algorithm, the convolutional layer parameters sets are given in Table 10, and ReLU is utilized as the activation function.
For the XGBoost algorithm, the parameter sets are given in Table 11. The first dense of the fully connected layer is 512, and the activation function uses ReLU. The output dimension of the second dense of the fully connected layers is 2, the activation function uses softmax, and DropOut sets 0.5.

4.3. Features Analysis

In this subsection, two experiments are set to evaluate the detection performance based on the extracted authorization-sensitive features:
(1)
We evaluated the detection rates based on KFCG.
(2)
We compared the detection performance using the extracted features.

4.3.1. Detection Results Based on KFCG

Samples are categorized using the NANO antivirus engine, and if a category contains more than 450 malicious samples, it will be used to experiment. The threshold for similarity is set to 0.7. The detection results using the sequence of API calls are shown in Table 12. To verify the classification results, we select six commercial antivirus softwares, F-Secure, BitDefender, AhnLab-V3, TrendMicro, Kaspersky, and Avast, to analyze the classification results. If the antivirus engine from this family detects the more samples belonging to the family, the more influential the similar module extraction method is proposed. Therefore, the larger the ratio R (as Equation (6)) in Table 13, the better the detection rate of the similar module extraction method proposed, that is to say, the higher the classification accuracy of similar modules and the classification accuracy is over 91% on average.
R = t h e n u m b e r o f s i m i l a r s a m p l e s d e t e c t e d f r o m t h e f a m i l y t o t a l n u m b e r o f f a m i l y s a m p l e s × 100 %

4.3.2. Detection Performance Evaluation Using Extracted Features

We evaluate the performance of the selected permissions and the API calls by using XGBoost. We use CNN to assess the performance of extracted basic block features. The classification results are as shown in Table 14. We found that the hierarchical authorization-sensitive features (permissions, API calls, basic blocks) achieved better classification accuracy than the features used separately.

4.4. Classifiers Analysis

The paper chooses DT, RF, SVM [54,55,56] as classifiers to compare with CNNXGB. The results of the experiments are shown in Figure 13. From the figure, we can see that the recall rate of SVM is significantly higher than that of other methods. Still, the precision, accuracy, and AUC of SVM are substantially lower than those of different methods. DT has the best effect on precision, and the recall rate is the same as CNNXGB. Still, it is weaker than CNNXGB in accuracy and AUC, and RF is weaker than CNNXGB in all indexes. Therefore, through experimental analysis, we can prove that the CNNXGB model proposed in this paper is the best. The results show that the classification accuracy of the CNNXGB model increases to 98%.

5. Conclusions

In order to detect Android malware efficiently and effectively, we build a hierarchical Android malware detection system using authorization-sensitive features. We transform basic blocks that represent binary code into a multichannel picture, in which A channel is utilized to deal with mapping conflict. On behalf of the application’s local features, we extract 22 permissions and 40 API calls selected by API Calls Frequency Difference method. Key functions reflect the primary interaction relationship between the application and the Android system. According to the sequence of API calls, we order key functions to deal with the key function call graph (KFCG). We present a hierarchical Android malware detection framework based on the extracted features, which introduces similar module feature detection and a deep learning model. In the first layer, we propose to select a comparison subset from the similar module feature library using an inverted index, and it can avoid using too long time to traverse the library one by one. In the second layer, CNNXGB integrates XGBoost and CNN to improve the detection accuracy. Simultaneously, according to the detection results, we update the similar module feature library of Android malware to realize the database’s dynamic self-growth. Then we conduct an extensive evaluation of our dataset to compare the detection results, which demonstrate that our proposed approach is practical. The classification accuracy is over 91% on average through the similarity comparison of similar modules, and it has been increased to 98% by the CNNXGB model.
In the future, we plan to extend our work to the following aspects: (1) increase the diversity of Android sample features such as native layer code features to improve the model detection ability, (2) research the decompiling technology of the Android program to enhance the decompiling ability, (3) optimize the deep learning model integrated XGBoost and CNN to reduce the training time.

Author Contributions

Conceptualization, Q.J. and L.C.; methodology, H.C. and Z.L.; software, H.C. and Z.L.; validation, H.C. and Z.L.; formal analysis, H.C. and Z.L.; investigation, Q.J. and L.C.; resources, Q.J. and L.C.; data curation, H.C. and Z.L.; writing—original draft preparation, H.C. and A.R.; writing—review and editing, H.C. and A.R.; visualization, H.C. and Z.L.; supervision, Q.J. and L.C.; project administration, Q.J. and L.C.; funding acquisition, Q.J. and L.C. All authors have read and agreed to the published version of the manuscript.

Funding

The work is supported by the Key-Area Research and Development Program of Guangdong Province Grant No.2019B010137002, the China Postdoctoral Science Foundation under Grant No. 2020M672892, and the National Natural Science Foundation of China under Grant Nos. U1805263, 61672157.

Data Availability Statement

The data and codes used in this work are available at https://github.com/Joyce-hui/CNNXGB (accessed on 7 February 2021).

Conflicts of Interest

The authors declare no conflict of interest.

References

  1. China Internet Network Information Center. The 44th China Statistical Report on Internet Development; China Internet Network Information Center: Beijing, China, 2019.
  2. StateCounter. Mobile Operating System Market Share Worldwide; StateCounter: Dublin, Ireland, 2020. [Google Scholar]
  3. Anti Network-Virus Alliance of China. Mobile Phone Virus; Anti Network-Virus Alliance of China: Beijing, China, 2019. [Google Scholar]
  4. Shabtai, A.; Kanonov, U.; Elovici, Y.; Glezer, C.; Weiss, Y. “Andromaly”: A behavioral malware detection framework for android devices. J. Intell. Inf. Syst. 2012, 38, 161–190. [Google Scholar] [CrossRef]
  5. Yerima, S.Y.; Sezer, S.; Muttik, I. High accuracy android malware detection using ensemble learning. IET Inf. Secur. 2015, 9, 313–320. [Google Scholar] [CrossRef] [Green Version]
  6. Vinayakumar, R.; Soman, K.P.; Poornach, R.P.; Sachin, K.S. Detecting android malware using long short-term memory (LSTM). J. Intell. Fuzzy Syst. 2018, 34, 1277–1288. [Google Scholar] [CrossRef]
  7. Pascanu, R.; Stokes, J.W.; Sanossian, H.; Marinescu, M.; Thomas, A. Malware classification with recurrent networks. In Proceedings of the 2015 IEEE International Conference on Acoustics, Speech and Signal Processing (ICASSP), South Brisbane, QLD, Australia, 19–24 April 2015; IEEE: Piscataway, NJ, USA, 2015; pp. 1916–1920. [Google Scholar]
  8. David, O.E.; Netanyahu, N.S. Deepsign: Deep learning for automatic malware signature generation and classification. In Proceedings of the 2015 International Joint Conference on Neural Networks (IJCNN), Killarney, Ireland, 12–16 July 2015; IEEE: Piscataway, NJ, USA, 2015; pp. 1–8. [Google Scholar]
  9. Arp, D.; Spreitzenbarth, M.; Hübner, M.; Gascon, H.; Rieck, K. DREBIN: Effective and explainable detection of android malware in your pocket. In Proceedings of the Network and Distributed System Security Symposium (NDSS), San Diego, CA, USA, 23–26 February 2014; pp. 23–26. [Google Scholar]
  10. Chan, P.P.; Song, W.K. Static detection of android malware by using permissions and API calls. In Proceedings of the 2014 International Conference on Machine Learning and Cybernetics, Lanzhou, China, 13–16 July 2014; IEEE: Piscataway, NJ, USA, 2014; Volume 1, pp. 82–87. [Google Scholar]
  11. Huang, C.; Tsai, Y.T.; Hsu, C.H. Performance evaluation on permission-based detection for android malware. In Advances in Intelligent Systems and Applications; Springer: Berlin/Heidelberg, Germany, 2013; Volume 2, pp. 111–120. [Google Scholar]
  12. Sharma, A.; Dash, S.K. Mining API calls and permissions for android malware detection. In Proceedings of the International Conference on Cryptology and Network Security (CANS), Heraklion Crete, Greece, 22–24 October 2014; Springer: Cham, Switzerland, 2014; pp. 191–205. [Google Scholar]
  13. Chen, S.; Xue, M.; Tang, Z.; Xu, L.; Zhu, H. Stormdroid: A streaminglized machine learning-based system for detecting android malware. In Proceedings of the 11th ACM on Asia Conference on Computer and Communications Security, Xi’an, China, 30 May 30–3 June 2016; pp. 377–388. [Google Scholar]
  14. Karbab, E.B.; Debbabi, M.; Derhab, A.; Mouheb, D. MalDozer: Automatic framework for android malware detection using deep learning. Digit. Investig. 2018, 24, S48–S59. [Google Scholar] [CrossRef]
  15. Aafer, Y.; Du, W.; Yin, H. DroidAPIMiner: Mining API-level features for robust malware detection in android. In Proceedings of the International Conference on Security and Privacy in Communication Systems, Sydney, NSW, Australia, 25–28 September 2013; Springer: Cham, Switzerland, 2013; pp. 86–103. [Google Scholar]
  16. Garcia, J.; Hammad, M.; Malek, S. Lightweight, obfuscation-resilient detection and family identification of android malware. ACM Trans. Softw. Eng. Methodol. 2018, 26, 1–29. [Google Scholar] [CrossRef]
  17. Shin, J.; Spears, D.F. The Basic Building Blocks of Malware; Technical Report; University of Wyoming: Laramie, Wyoming, 2006. [Google Scholar]
  18. Ho, T.K. The random subspace method for constructing decision forests. IEEE Trans. Pattern Anal. Mach. Intell. 1998, 20, 832–844. [Google Scholar]
  19. Dini, G.; Martinelli, F.; Saracino, A.; Sgandurra, D. Madam: A multi-level anomaly detector for android malware. In Proceedings of the International Conference on Mathematical Methods, Models and Architectures for Computer Network Security; Springer: Berlin/Heidelberg, Germany, 2012; pp. 240–253. [Google Scholar]
  20. Tobiyama, S.; Yamaguchi, Y.; Shimada, H.; Ikuse, T.; Yagi, T. Malware detection with deep neural network using process behavior. In Proceedings of the 2016 IEEE 40th Annual Computer Software and Applications Conference (COMPSAC), Atlanta, GA, USA, 10–14 June 2016; IEEE: Piscataway, NJ, USA, 2016; pp. 577–582. [Google Scholar]
  21. Hou, S.; Saas, A.; Chen, L.; Ye, Y. Deep4maldroid: A deep learning framework for android malware detection based on linux kernel system call graphs. In Proceedings of the 2016 IEEE/WIC/ACM International Conference on Web Intelligence Workshops (WIW), Omaha, NE, USA, 13–16 October 2016; IEEE: Piscataway, NJ, USA, 2016; pp. 104–111. [Google Scholar]
  22. Idika, N.; Mathur, A.P. A survey of malware detection techniques. Purdue Univ. 2007, 48, 2007-2. [Google Scholar]
  23. Louk, M.; Lim, H.; Lee, H. An analysis of security system for intrusion in smartphone environment. Sci. World J. 2014, 2014, 983901. [Google Scholar] [CrossRef] [PubMed] [Green Version]
  24. Alosefer, Y. Analysing Web-Based Malware Behaviour through Client Honeypots. Ph.D. Thesis, Cardiff University, Cardiff, UK, 2012. [Google Scholar]
  25. Feng, Y.; An, S.; Dillig, I.; Aiken, A. Apposcopy: Semantics-based detection of android malware through static analysis. In Proceedings of the 22nd ACM SIGSOFT International Symposium on Foundations of Software Engineering, Hong Kong, China, 16–21 November 2014; pp. 576–587. [Google Scholar]
  26. Yang, C.; Xu, Z.; Gu, G.; Yegneswaran, V.; Porras, P. Droidminer: Automated mining and characterization of fine-grained malicious behaviors in android applications. In Proceedings of the European Symposium on Research in Computer Security, Wroclaw, Poland, 7–11 September 2014; Springer: Cham, Switzerland, 2014; pp. 163–182. [Google Scholar]
  27. Huo, Y. Research on Malware Based on Function Similarity. Master’s Thesis, Shandong University, Jinan, China, 2018. [Google Scholar]
  28. Xiao, Y. Research on Similarity Matching Technology of Binary Code Function. Master’s Thesis, Shandong University, Jinan, China, 2016. [Google Scholar]
  29. Yang, C. Feature Extraction and Detection of Malware Based on Similarity in Android Platform. Master’s Thesis, Hangzhou Normal University, Hangzhou, China, 2016. [Google Scholar]
  30. Wu, L.; Xu, M.; Xu, J.; Zheng, N. A novel malware variants detection method based on function-call graph. In Proceedings of the IEEE Conference Anthology; IEEE: Piscataway, NJ, USA, 2011; pp. 1–5. [Google Scholar]
  31. Tong, X. Android Anomaly Detection Based on Similarity Clustering. Master’s Thesis, Hunan University, Changsha, China, 2016. [Google Scholar]
  32. Cai, Z.; Jiang, Q. Android malware detection framework using protected API methods with random forest on Spark. In Proceedings of the Artificial Intelligence Science and Technology-Proceedings of the 2016 International Conference (Aist2016), Shanghai, China, 15–17 July 2016; World Scientific: Singapore, 2017; p. 141. [Google Scholar]
  33. Zhang, K.; Jiang, Q.; Zhang, W.; Liao, X. An android malware detection method using Dalvik instructions. In Proceedings of the Informatics, Networking and Intelligent Computing: Proceedings of the 2014 International Conference on Informatics, Networking and Intelligent Computing (INIC 2014), Shenzhen, China, 16–17 November 2014; p. 89. [Google Scholar]
  34. Li, W.; Wang, Z.; Cai, J.; Cheng, S. An android malware detection approach using weight-adjusted deep learning. In Proceedings of the 2018 International Conference on Computing, Networking and Communications (ICNC), Maui, HI, USA, 5–8 March 2018; pp. 437–441. [Google Scholar]
  35. Luo, S.; Tian, S.; Yu, L.; Yu, J.; Sun, H. Android malicious code classification using deep belief network. KSII Trans. Internet Inf. Syst. 2018, 12, 454–475. [Google Scholar]
  36. Li, J.; Sun, L.; Yan, Q.; Li, Z.; Srisa-An, W.; Ye, H. Significant permission identification for machine-learning-based android malware detection. IEEE Trans. Ind. Inform. 2018, 14, 3216–3225. [Google Scholar] [CrossRef]
  37. Li, Z.; Qiao, Y.; Hasan, T.; Jiang, Q. A similar module extraction approach for android malware. In Proceedings of the 2018 International Conference on Modeling, Simulation and Optimization (MSO 2018), Shenzhen, China, 21–22 January 2018; DEStech Transactions on Computer Science and Engineering: Lancaster, PA, USA, 2018. [Google Scholar]
  38. Ruttenberg, B.; Miles, C.; Kellogg, L.; Notani, V.; Howard, M.; LeDoux, C.; Lakhotia, A.; Pfeffer, A. Identifying shared software components to support malware forensics. In Proceedings of the International Conference on Detection of Intrusions and Malware, and Vulnerability Assessment, Egham, UK, 10–11 July 2014; Springer: Cham, Switzerland, 2014; pp. 21–40. [Google Scholar]
  39. Qiao, Y.; Jiang, Q.; Jiang, Z.; Gu, L. A multi-channel visualization method for malware classification based on deep learning. In Proceedings of the 18th IEEE International Conference On Trust, Security and Privacy in Computing and Communications/13th IEEE International Conference on Big Data Science and Engineering (TrustCom/BigDataSE), Rotorua, New Zealand, 5–8 August 2019; IEEE: Piscataway, NJ, USA, 2019; pp. 757–762. [Google Scholar]
  40. Nataraj, L.; Karthikeyan, S.; Jacob, G.; Manjunath, B.S. Malware images: Visualization and automatic classification. In Proceedings of the 8th International Symposium on Visualization for Cyber Security, Pittsburgh, PA, USA, 20 July 2011; pp. 1–7. [Google Scholar]
  41. Xue, D.; Li, J.; Wu, W.; Tian, Q.; Wang, J. Homology analysis of malware based on ensemble learning and multifeatures. PLoS ONE 2019, 14, e0211373. [Google Scholar] [CrossRef] [PubMed]
  42. Yan, J.; Qi, Y.; Rao, Q. LSTM-based hierarchical denoising network for android malware detection. Secur. Commun. Netw. 2018, 2018, 1–18. [Google Scholar] [CrossRef]
  43. Derr, E.; Bugiel, S.; Fahl, S.; Acar, Y.; Backes, M. Keep me updated: An empirical study of third-party library updatability on android. In Proceedings of the 2017 ACM SIGSAC Conference on Computer and Communications Security, Dallas, TX, USA, 30 October–3 November 2017; pp. 2187–2200. [Google Scholar]
  44. Chen, T.; Guestrin, C. Xgboost: A scalable tree boosting system. In Proceedings of the 22nd ACM Sigkdd International Conference on Knowledge Discovery and Data Mining, San Francisco, CA, USA, 13–17 August 2016; pp. 785–794. [Google Scholar]
  45. VirusShare. Virusshare.com-Because Sharing Is Caring. 2020. Available online: https://virusshare.com/ (accessed on 7 February 2021).
  46. Archive. Android Malware Dataset. 2019. Available online: https://archive.org/details/md5_20200329 (accessed on 7 February 2021).
  47. Zhang, W.; Ren, H.; Jiang, Q.; Zhang, K. Exploring feature extraction and ELM in malware detection for android devices. In Proceedings of the International Symposium on Neural Networks, Jeju Island, Korea, 15–18 October 2015; pp. 489–498. [Google Scholar]
  48. Androguard. Androguard Team. 2020. Available online: https://github.com/androguard/androguard (accessed on 7 February 2021).
  49. Backes, M.; Bugiel, S.; Derr, E. Reliable third-party library detection in android and its security applications. In Proceedings of the 2016 ACM SIGSAC Conference on Computer and Communications Security, Vienna, Austria, 24–28 October 2016; pp. 356–367. [Google Scholar]
  50. Ikram, M.; Beaume, P.; Kaafar, M.A. Dadidroid: An obfuscation resilient tool for detecting android malware via weighted directed call graph modelling. arXiv 2019, arXiv:1905.09136. [Google Scholar]
  51. Onwuzurike, L.; Mariconti, E.; Andriotis, P.; Cristofaro, E.D.; Ross, G.; Stringhini, G. Mamadroid: Detecting android malware by building markov chains of behavioral models (extended version). ACM Trans. Inf. Syst. Secur. 2019, 22, 1–34. [Google Scholar] [CrossRef] [Green Version]
  52. McLaughlin, N.; Martinez del Rincon, J.; Kang, B.; Yerima, S.; Miller, P.; Sezer, S.; Safaei, Y.; Trickel, E.; Zhao, Z.; Doupé, A.; et al. Deep android malware detection. In Proceedings of the Seventh ACM on Conference on Data and Application Security and Privacy, Scottsdale, AZ, USA, 22–24 March 2017; pp. 301–308. [Google Scholar]
  53. Lecun, Y.; Bottou, L.; Bengio, Y.; Haffner, P. Gradient-based learning applied to document recognition. Proc. IEEE 1998, 86, 2278–2324. [Google Scholar] [CrossRef] [Green Version]
  54. Safavian, S.R.; Landgrebe, D. A survey of decision tree classifier methodology. IEEE Trans. Syst. Man Cybern. 1991, 21, 660–674. [Google Scholar] [CrossRef] [Green Version]
  55. Liaw, A.; Wiener, M. Classification and regression by randomforest. R News 2002, 2, 18–22. [Google Scholar]
  56. Suykens, J.A.K.; Vandewalle, J. Least squares support vector machine classifiers. Neural Process. Lett. 1999, 9, 293–300. [Google Scholar] [CrossRef]
Figure 1. System Architecture of the Android malware detection using hierarchical authorization-sensitive features.
Electronics 10 00432 g001
Figure 2. Basic blocks and the relationship among them.
Electronics 10 00432 g002
Figure 3. Pixel points after first mapping and 1500 mappings of the basic block. (a) Pixel point after the basic block’s 1st mapping; (b) Pixel point after the basic block’s 1500th mapping.
Electronics 10 00432 g003
Figure 4. A pixel point with a R a d i u s = 1 .
Electronics 10 00432 g004
Figure 5. Examples of image features for mobile malicious sample.
Electronics 10 00432 g005
Figure 6. Examples of image features for mobile normal sample.
Electronics 10 00432 g006
Figure 7. Basic block and system function called in the smali file.
Electronics 10 00432 g007
Figure 8. The number of permissions between Android 4.0 and 10.0.
Electronics 10 00432 g008
Figure 9. Function call graph of application.
Electronics 10 00432 g009
Figure 10. Key function call graph, (a) remove non-key function a; (b) remove non-key function b.
Electronics 10 00432 g010
Figure 11. Convolutional Neural Network and eXtreme Gradient Boosting (CNNXGB) classification model.
Electronics 10 00432 g011
Figure 12. Multi-process data pre-processing process based on scheduler.
Electronics 10 00432 g012
Figure 13. Detection result comparison of CNNXGB and other classifiers.
Electronics 10 00432 g013
Table 1. Map table of the 44-bit binary sequence.
No.Index RangeLengthNameMeaning
134–4310xCoordinate x
224–3310yCoordinate y
316–238RR Channel
48–158GG Channel
50–78BB Channel
Table 2. The mapping table between conflict frequency and channel A.
No.The Conflict FrequencyThe Value of Channel A
1<100
2[10, 20)1
3[20, 30)2
4[30, 40)3
254[2530, 2540)253
255≥2540254
Table 3. The 22 selected permissions and their corresponding behavior.
No.Permission NameMeaning
1ACCESS_WIFI_STATEAccess to WIFI Status
2READ_LOGSRead Log
3CAMERAUsing Mobile Camera
4READ_PHONE_STATERead Phone Status
5CHANGE_NETWORK_STATESwitch Network Status
6READ_SMSRead Messages
7CHANGE_WIFI_STATESwitch WIFI Status
8RECEIVE_BOOT_COMPLETEDDetecting Power-up Completion Events
9DISABLE_KEYGUARDAllow Keypad Lock to be Disabled
10RESTART_PACKAGESAllow Other Applications to be Closed
11GET_TASKSGet the Current Task List
12SEND_SMSSend a Message
13INSTALL_PACKAGESInstall the Application
14SET_WALLPAPERSet Wallpaper
15READ_CALL_LOGRead Phone Logs
16SYSTEM_ALERT_WINDOWSend System Warning Window
17READ_CONTACTSRead Contacts
18WRITE_APN_SETTINGSModify APN Settings
19READ_EXTERNAL_STORAGERead Storage
20WRITE_CONTACTSModify Contact
21READ_HISTORY_BOOKMARKSRead Browser History and Bookmarks
22WRITE_SETTINGSModify System Settings
Table 4. Application Programming Interface (API) call frequency difference table for Android normal and malicious samples.
API NameDifference RatioAPI NameDifference Ratio
System.currentTimeMillis91.10%Resources.getSystem5.00%
android.os.Parcel.obtain75.30%currentAnimationTimeMillis4.90%
java.util.Collections.emptyList63.70%java.lang.Thread.interrupted4.40%
Looper.getMainLooper54.20%android.os.Trace.endSection4.30%
java.lang.Thread.currentThread39.40%java.util.TimeZone.getDefault4.30%
getContextTypeLoader33.30%java.nio.ByteOrder.nativeOrder4.10%
SystemClock.elapsedRealtime28.80%Charset.defaultCharset4.10%
java.util.Locale.getDefault20.10%FocusFinder.getInstance3.40%
android.os.Looper.myLooper19.40%newSingleThreadExecutor3.20%
java.lang.System.nanoTime17.00%android.os.Binder.getCallingUid2.90%
SystemClock.uptimeMillis15.70%android.os.Process.myUid2.80%
java.util.Collections.emptyMap15.30%getLongPressTimeout2.80%
java.util.Calendar.getInstance11.90%android.os.Message.obtain2.40%
java.util.UUID.randomUUID10.90%android.os.Process.myTid2.00%
java.util.Collections.emptySet8.00%java.lang.Math.random1.90%
android.os.Process.myPid7.10%getDefaultUncaughtExceptionHandler1.90%
VelocityTracker.obtain6.70%LinkMovementMethod.getInstance1.80%
getExternalStorageState6.10%CookieManager.getInstance1.80%
java.lang.Runtime.getRuntime6.00%SmsManager.getDefault1.70%
getExternalStorageDirectory5.60%ViewConfiguration.getTapTimeout1.70%
Table 5. The list of the functions in application and the called relationship by each function.
Function NameCalled Function
AA, B, S 1 , S 2
aB, C
BB, S 3
bC
C S 4 , S 5
Table 6. Key function call table.
ABC
A012
B002
C000
Table 7. Collected Android program samples.
No.SamplesTypeNoteCollected Time
111,364Benign[47]2014–2017
210,461Malware[47]2014–2017
316,619Malware[47]2017–2018
4988Benign[32]2017–2018
55,212BenignNew2018–2020
622,933MalwareNew2018–2020
Table 8. The extracted information of Android applications.
No.Tool’s NameExtracted Information
1AndroguardActivities, Receivers, the name of Native, Services,
Permissions, Providers, Method List
2LibScoutThe name of third-party library, Versions, the list
of Package name
3The PaperMultichannel picture
Table 9. Information on the experimental environment.
No.NameVersion
1Operating SystemUbuntu 18.04.4 LTS x64
2System InformationIntel(R) Xeon(R) Gold 6240 CPU @ 2.60 GHz
3TensorFlow2.1.0
4Python3.7.5 x64
5Keras2.3.1
6SklearnSklearn 0.22.2.post1
7XGBoostXgboost 1.0.2
Table 10. Details of the parameters used in CNN.
LayersFilter SizeConvolution Kernel SizePooling SizeDropOut
First layer323 × 32 × 20.25
Second layer643 × 32 × 20.25
Third layer1283 × 32 × 20.25
Table 11. Parameters for XGBoost.
No.Parameters Values
1Model Type Gbtree
2Objective Function Binary:logistic
3Node Splitting Threshold 0.2
4Maximum Depth of Tree 6
5Minimum Number of Samples on Leaves 2
6L1 Regular Term 0
7L2 Regular Term 0
8Random Sampling Rate 0.7
9Ratio of the Creation Tree from all Columns 0.9
10Learning Rate 0.01
Table 12. Detection rates of the similar module (SM).
No.FamilySamplesDetection ResultsDetection Rates
1Trojan.Android.FakeInst2858235482.37%
2Trojan.Android.Agent2502173369.26%
3Trojan.Android.Domob1102108198.09%
4Trojan.Android.Opfake1077100493.22%
5Trojan.Android.Dowgin1118109497.85%
6Trojan.Android.WqMobile92592399.78%
7Riskware.Android.MobWin53353199.62%
8Trojan.Android.Airpush47143391.93%
Table 13. Proportion of similar samples extracted that belong to the same family based on similar module detection.
FamilyAnti-Virus Software
F-SecureBitDefenderAhnLab-V3TrendMicroKasperskyAvast
Trojan.Android.FakeInst100%100%100%99.8%100%100%
Trojan.Android.Agent100%100%100%100%100%100%
Trojan.Android.Domob98.7%98.9%99.1%84.9%92.3%*
Trojan.Android.Opfake100%100%100%*100%100%
Trojan.Android.Dowgin99.8%99.5%99.3%*99.2%95.5%
Trojan.Android.WqMobile99.6%99.6%99.6%86.0%98.7%96.2%
Riskware.Android.MobWin98.1%97.7%97.9%93.1%92.3%*
Trojan.Android.Airpush96%96.2%89.2%*94.4%*
* indicates the number of detected malware are less than 20 which are not taken into consideration.
Table 14. Detection performance comparisons between hierarchical features and isolated features.
FeaturesPrecisionRecallACCAUCF1
Permissions0.95680.93870.94440.94480.9477
API Calls0.96400.92070.93900.94040.9419
Basic blocks0.87420.97820.91230.90660.9233
Hierarchical Features (CNNXGB)0.97670.97520.97410.97400.9759
Publisher’s Note: MDPI stays neutral with regard to jurisdictional claims in published maps and institutional affiliations.

