1. Introduction
Cardiovascular magnetic resonance (CMR) represents a powerful tool in the noninvasive assessment of cardiac anatomy, function, and metabolism [
1]. CMR applications cover a broad spectrum of clinical and research areas, such as global and regional cardiac function, myocardial perfusion, myocardial viability, tissue characterization, and proximal coronary anatomy.
Magnetic resonance spectroscopy (MRS) represents an accurate, noninvasive, non-ionizing tool for in vivo evaluation of cardiac metabolism, with applications to various nuclei (
1H,
31P,
13C) [
2,
3].
In particular,
13C spectroscopy can be used for an investigation of the intermediary metabolism of biomolecules in vivo [
4].
13C nuclei generate a natural signal, which is very low and difficult to detect with conventional magnetic resonance (MR) scanners due to the scarce natural abundance and the low level of nuclear polarization at thermal equilibrium. The low
13C signal is even more critical if the study involves a moving organ such as the heart. Recently, the development of hyperpolarization techniques for enhancing
13C polarization has led to a significant nuclear magnetization increase. In particular, the hyperpolarization technology known as dissolution dynamic nuclear polarization (dDNP) enhances the polarization of
13C by a factor of 100,000 [
5].
However, several technological problems still limit the application of these techniques and require innovative solutions, especially when a low molar concentration of metabolites reduces the in vivo sensitivity.
Despite the use of hyperpolarized
13C tracers, the design and development of both dedicated radio frequency (RF) coils and acquisition settings need to be specialized for the region of interest, and potentially for the animal of interest, to provide the optimal signal-to-noise ratio (SNR). In particular, RF coils have to guarantee a large field of view (FOV) with high magnetic field homogeneity in transmission (TX) and to achieve high SNR in reception (RX) [
6]. Moreover,
13C experiments require that the MR system operates at two different frequencies (multinuclear system) to provide 1H imaging and
13C acquisition with the same experimental setup. Multinuclear acquisitions can be performed by using two separate RF coils or by using a single dual-tuned coil operating at two different frequencies. The choice of the most suitable coil for a given application is a necessary constraint. Recently, a quality assurance imaging protocol for
13C coils based on MR spectroscopic imaging was described in the literature [
7], in which different coil setups were tested and compared.
After a brief introduction to hyperpolarization techniques and hyperpolarized 13C MR applications, then, we review the RF coil principles, the coil performance parameters, and their estimation methods, starting from simulations and workbench tests to MR experiments. In the second part of this paper, we summarize the design of a coil and the results obtained in phantom tests and in vivo studies with a clinical 3T MRI scanner located in our cardiovascular lab.
Sin this paper, we have summarized both the theory and our experience with 13C coil design and evaluation, and therefore, the information should be of interest to graduate students and researchers in the field of MR coil design and development, especially for 13C studies.
2. Hyperpolarized 13C Magnetic Resonance
Hyperpolarization increases the measured MR signal strength by many orders of magnitude, thus, overcoming the intrinsic MR sensitivity limitations [
8].
Hyperpolarized 13C has been investigated for imaging the metabolism in various cancers and cardiac diseases. The most common hyperpolarized 13C-labeled agents include small molecules that play a central role in the major metabolic cycles in normal and diseased functions. In particular, [1-13C]pyruvate is rapidly transported to the intracellular space via the monocarboxylate transporters, where it is used as a probe to track the intracellular metabolism. [1-13C]pyruvate has been applied to investigate metabolic disorders, tumor response to therapy, cancer detection, cerebral dynamics and metabolism, pH, and more.
In addition to pyruvate, other hyperpolarized
13C substrates have been investigated from [1,4-
13C
2]fumarate to [1,4-
13C
2]malate. Moreover,
13C-bicarbonate and
13C-carbon dioxide have been investigated to measure extracellular pH. Other
13C-labeled substrates applied to cardiac functional or metabolic imaging include [U-
13C]α-ketobutyrate, [1-
13C]lactic acid, [1-
13C]acetate,
13C-urea, and [1-
13C]butyrate [
9].
The most common 13C-labeled agents include small molecules that play a central role in the major metabolic cycles in normal and diseased functions. For a given metabolic pathway, the choice of metabolic substrate and the specific 13C label site dictate the T1 time and the metabolic tracer’s chemical shift. In turn, the T1 time influences the total acquisition time and SNR for imaging and spectroscopy. The chemical shift may further constrain acquisition parameters (e.g., echo time or RF excitation bandwidth) depending on the spectral bandwidth required to discriminate between different metabolic species.
Among the hyperpolarization techniques, currently, dDNP is the most promising from a clinical perspective [
5,
10]. In brief, dDNP is performed at high magnetic field (3.35 to 7 T) and extremely low temperature (≈1 K), where the high polarization of electron spins (unpaired electrons of radical molecules added to the sample at mM concentration) is transferred to nuclear spins by microwave irradiation. Rapid dissolution of the sample is subsequently performed to produce hyperpolarized solutions that can be injected for in vivo studies [
11]. The
13C-pyruvate is the gold-standard molecule for DNP clinical and preclinical applications due to its optimal chemo-physical properties, long T1 relaxation time, high
13C concentration, as well as its key role in cell metabolism. To investigate tissue metabolism, an isotopically labeled compound (usually a
13C-enriched molecule such as
13C-pyruvate) is hyperpolarized and readily injected in vivo, where it participates in enzyme-mediated metabolic reactions. Using MRS, the injected compound and its metabolic products can be selectively detected in a noninvasive manner and in real time [
12,
13].
The hyperpolarized signal rapidly decays once the hyperpolarization process is concluded due to T1 relaxation. For the most used 13C-labeled compounds, T1 is of the order of a few tens of seconds, and the MR signal decay occurs in a few minutes. Because of this rapid and irreversible decay, fast signal detection with high SNR, as well as efficient use of the magnetization, are needed for in vivo hyperpolarization studies.
3. RF Coil Theory and Design
The study of metabolism with hyperpolarized tracers requires a dedicated technical setup. For example, the experiments would benefit from the improvement of gradient performance and the use of ultra-high field (UHF) scanners (7T or above) since the SNR is linearly proportional to field strength [
14]. Nevertheless, RF dedicated coils are an essential component in these experiments to fully exploit the MR signal enhancement.
3.1. RF Coil as RLC Circuit
RF coils are designed so that the flowing current is maximal at the Larmor frequency (
f0 = γ/2
π B
0, where B
0 is the static field and
γ is the gyromagnetic ratio with 42.58 MHz/T and 10.71 MHz/T values for 1H and
13C nuclei, respectively) which corresponds to the coil resonant frequency. The bandwidth of the coil resonance has to be large enough to cover the various chemical resonances, i.e., about 30 ppm for hyperpolarized [1-
13C]pyruvate (to detect the main metabolites [1-
13C]lactate, [1-
13C]alanine, and [1-
13C]bicarbonate) [
8,
13].
The coil can be schematized with an equivalent RLC circuit (
Figure 1), where
L represents the system inductance, which takes into account the energy stored in the magnetic field, and
C is the system capacitance mainly resulting from the discrete capacitors contribution. The coil resonant frequency corresponds to the frequency for which the current assumes the maximum value:
The term
R is the sum of all the resistances that can be associated with loss mechanisms within the conductors and within the sample [
6]. In particular,
Rcoil, which depends on the conductor geometry, takes into account the conductor losses; Rsample represents the sample losses caused by RF currents, induced by electric fields in the sample and fluctuating magnetic field and, mainly generated by the coil capacitors; and Rextra includes radiative and tuning capacitors losses, which can be neglected in many applications.
3.2. Coil Inductance Calculation
The inductance of conductor portions can be calculated by using the following expression [
15]:
where
J represents the current density in the conductor,
μ0 is the permeability of free space,
I is the total current in the conductor,
V is the conductor volume, and
R = |
r −
r′|, see
Figure 1.
Conductors used for building RF coils can be divided into the following two groups, depending on their cross-sectional shape: wires (cylindrical rod shapes, defined by their radius) and strips (rectangular shapes, characterized by width and thickness). A simple relationship between strip and wire conductors’ sizes is used to evaluate the equivalent width (w) of a wire of radius a, while maintaining the same inductance value as w = 4.482 a [
15].
3.3. Coil Performance Parameters Definition
A quantitative measure of circuit quality is provided by the definition of the coil quality factor (
) [
15] as follows:
Which can be expressed in terms of circuit parameters as:
Coil performance evaluation can also be described with the ratio
r between the quality factor of the empty resonator (
Qunloaded) and the resonator in the presence of the sample (
Qloaded):
The maximal SNR can be achieved when
r is maximized [
16].
Another parameter describing the coil performance both in transmission and in reception mode is efficiency, defined as the ratio between the intensity of the magnetic field B
1 at a given point in space and the corresponding power
P [
6]:
3.4. Signal-to-Noise Ratio (SNR) Estimation
The SNR of the acquired MR signals strongly affects the quality of the reconstructed data; therefore, the RF coils have to be designed to provide the higher
SNR. The theoretical
SNR can be calculated as the ratio between the induced radio frequency signal and the root mean square (RMS) of the thermal noise voltage measured at the coil terminals [
17]:
where
f0 is the Larmor frequency;
M is the magnetization;
V is the voxel volume;
BP is the receiver coil magnetic field per unit current at the observation point
P;
k is the Boltzmann constant;
T is the absolute resistance temperature; Δ
f is the receiver bandwidth; and
Rtot is the total noise resistance, calculated as described in Equation (2).
Therefore, for the SNR evaluation, it is necessary to calculate the magnetic field BP and the different losses contributions.
3.4.1. Magnetic Field: Magnetostatic Method
The magnetostatic theory is based on the nearly static field assumption, which holds only when the coil dimensions are much lower than the wavelength. The static magnetic field produced by a steady electric current,
I, flowing in an arbitrary closed contour,
C, can be calculated by using Biot–Savart law [
15] as:
where
μ0 = 4
π × 10
−7 (H/m) is the free space permeability,
dl is the infinitesimal vector tangential to
C, and
R is the distance between the conductor path and the observation point.
The Biot–Savart equation can be used for the coils three-dimensional B1 field distributions evaluation.
The magnetic field calculation generated by the currents along the coil conductors can be performed by subdividing the coil path into segments to study their total magnetic field contribution separately. The conductor sizes can be neglected with respect to the wavelength, and the magnetic field generated by the currents can be evaluated considering conductors as very thin wires.
3.4.2. Magnetic Field: Finite-Difference Time-Domain (FDTD) Method
Some coil characteristics, such as field homogeneity, can be estimated using electromagnetic theory such as Biot–Savart law, as long as the nearly static field assumption holds, but with the increase in Larmor frequency in current scanners, this condition is not always satisfied. Moreover, when the coil is loaded with a sample, the SNR distribution is affected by its electromagnetic properties, and only numerical methods simulate the coil behavior in loaded condition to design coils with a complex shape. In general, numerical methods estimate the magnetic field of the RF coil when loaded with a model of the exposed body, by providing a numerical solution of Maxwell’s equations with specific boundary conditions. Such methods can be classified according to whether the computation is made in the time or frequency domain, and if the method is based on differential or integral equations. For our research [
18], we employed the finite-difference time-domain (FDTD) method [
19], which incorporated complex structures into the computational space, such as part of the human body for studying the electromagnetic interaction between the coil and the biological phantom. Many studies have confirmed that FDTD is a useful tool for evaluating and optimizing the RF coil design. For example, Amjad [
20] performed the power deposition calculation inside a phantom for an RF-induced temperature rise, while Chen [
21] evaluated the specific absorption rate (SAR) and B
1 field pattern inside a human head for a shielded birdcage coil. Wang [
22] described SAR and temperature calculation in a volume coil loaded with a human head at different frequencies. In [
23], the FDTD method was used for comparing B
1 homogeneity between a 16-leg high-pass birdcage coil and an eight-channel phased-array coil loaded with water phantom and head model, both designed for 3T MRI, by exploiting the FDTD possibility to estimate the B
1 value for each point inside the sample. The simulation results evidenced that the standing wave effect heavily affected birdcage coil field homogeneity, while the phased-array coil showed better performance. The ability of FDTD for estimating RF coils inductance was described in [
24] with an example of a square loop constituted by a different diameter wire conductor, whose FDTD calculation was compared with an analytical value, providing a difference within 3%, while the addition of discrete capacitors permitted the coil to resonate at the desired frequency. The FDTD can even be used for predicting electromagnetic interference between wireless devices, as described in [
25], where an FDTD-based commercial tool was employed for accurately calculating the interference voltage induced at the connector of an implantable cardiac pacemaker placed inside a human torso phantom, due to the electromagnetic fields generated around wireless power transmission (WPT) antennas.
3.4.3. Coil Losses
The coil resistance can be estimated by accounting for the conducting pathway geometry and by using the following classic formula:
where
ρ is the conductor resistivity, and
L and
S are the total conductor length and cross-sectional area, respectively [
26].
S is limited by the value of the penetration depth
δ [
27] as follows:
where
ρ is the conductor resistivity (
ρ = 1.68∙× 10
−8 Ω∙m for copper) and
f is the coil tuning frequency.
While a wire conductor is characterized by a uniform current distribution inside its cross-sectional area defined by penetration depth (classical skin effect), for a strip conductor, the current density has the tendency of concentrating at conductor edges (lateral skin effect) [
28] and increases the conductor resistance, becoming the dominant mechanism at high frequencies [
29].
3.4.4. Sample-Induced Losses
Sample-induced resistance calculation was performed by using commercial tools based on the FDTD method and by developing an algorithm based on the theory of the resonant circuit [
30].
After perturbing the resonant circuit with a Gaussian pulse and observing the voltage oscillation damping, the system
Q factor can be calculated as described in Equation (4) and by taking into account that the energy stored by a capacitor is proportional to the square of the voltage across its layers as:
where
Vi and
Vi+1 are the voltage values at
ith and (
i + 1)th cycles, respectively.
By performing a system simulation with the coil conductor consisting of a perfect electric conductor (PEC), the coil resistance vanishes completely, and Equation (5) can be used to estimate the series resistance value taking into account the energy dissipated in the system as follows:
where
f0 represents the coil resonant frequency, and
L represents the coil inductance value.
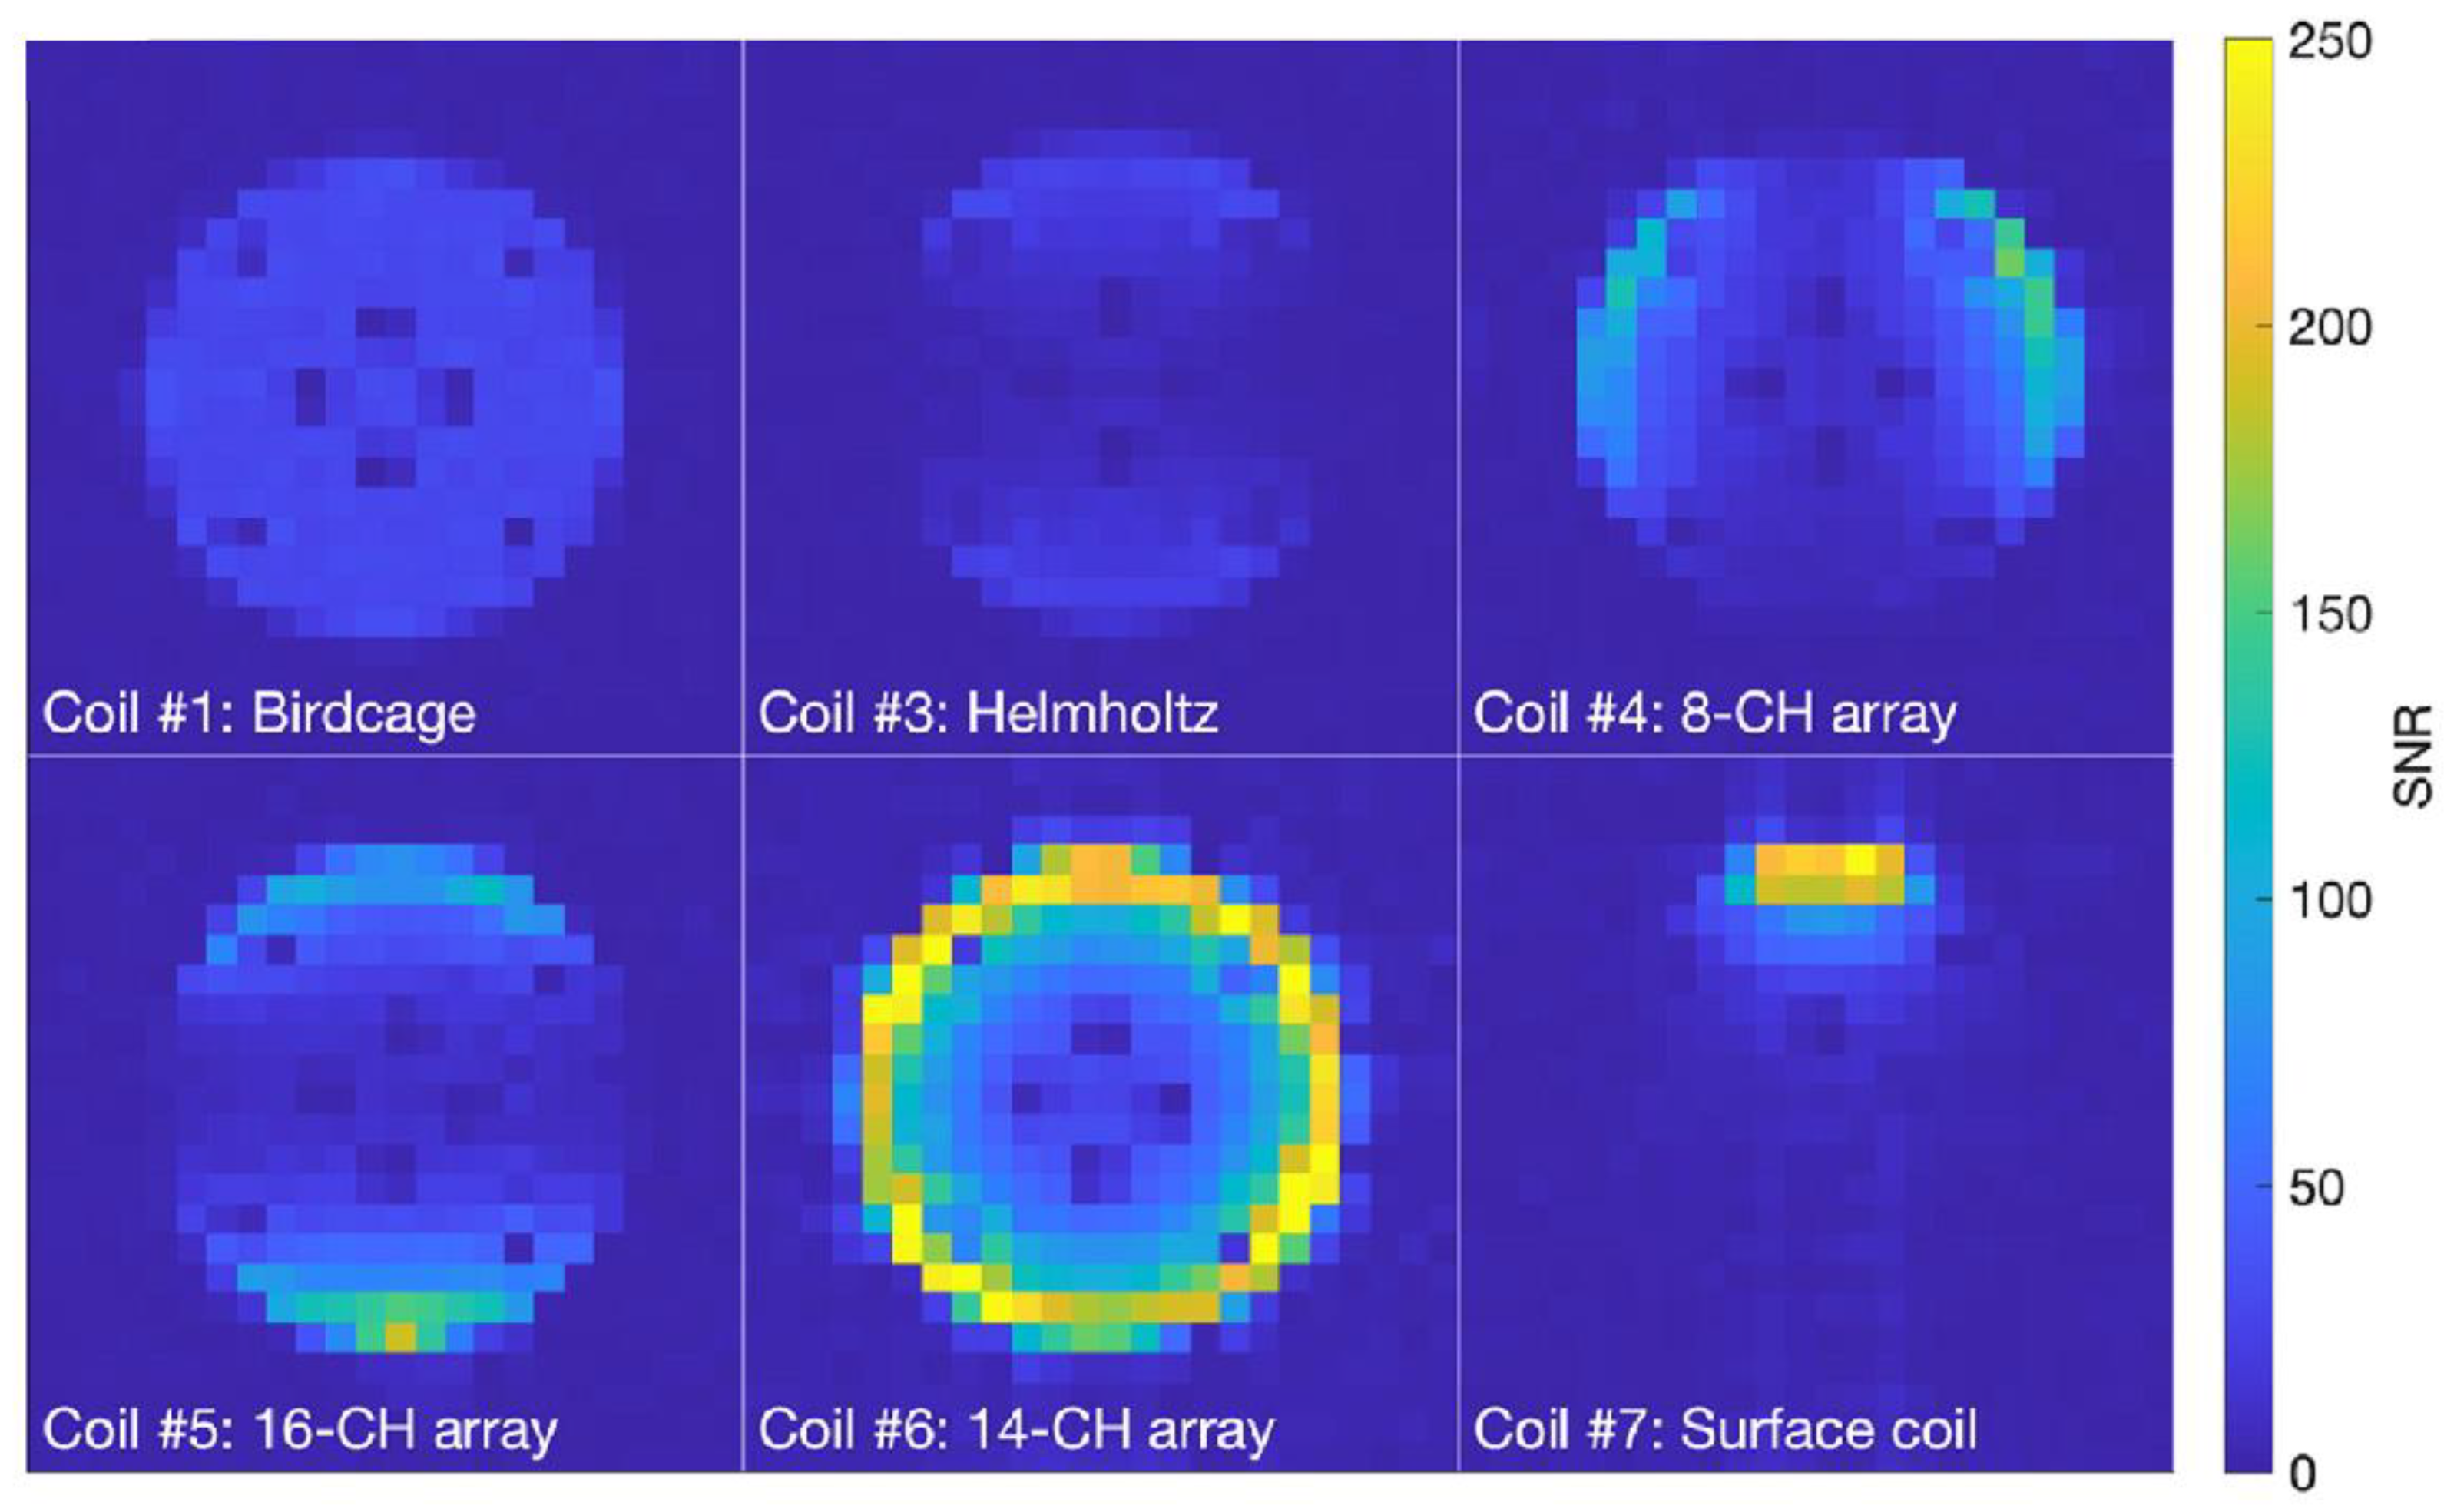
3.5. Coil Classification: Surface, Volume, and Phased-Array Coils
The coils used in MR can be categorized into volume and surface coils, according to their geometries [
31]. Volume coils are often used for both transmission and reception, since they can generate a homogeneous magnetic field in a large region surrounding the sample. The most common configuration for a volume coil is the birdcage, constituted by
n legs connected at each end to two circular loops (end rings) [
32], which can generate a highly homogeneous field with a high SNR. The surface coil configurations include loop coils of various shapes, which are much smaller than the volume coils and provide higher SNR in the coil proximity. In general, they are mainly used as receiver coils due to the relatively low field homogeneity, even if transmit coil or transceiver surface coil applications have been reported. Phased-array coils [
33] provide a large region of sensitivity, similar to that achieved with volume coils, and a high SNR, usually associated with surface coils. All elements of the array are separately connected to receiver channels whose outputs are optimally combined with a phase correction, which is dependent on the point in space from which the signal originates.
Figure 2 shows an example of SNR images obtained with different geometrical coils for the same cylindrical phantom [
7]. Volume (birdcage and Helmholtz), phased array (8, 14, and 16 channels), and surface coils provide very different SNR distributions.
3.6. Coil Performance Parameters Workbench Estimation
3.6.1. Q and r Factor Measurements
Workbench measurements of the coil
Q factor are performed by using the following:
where
f0 represents the coil resonant frequency and B is the −3 dB coil bandwidth. The same equation can be used for both loaded and unloaded coil quality factor measurements and, successively, for
r ratio estimation, according to Equation (6).
The quality factor measurements can be easily performed using a homemade dual-loop probe, consisting of a pair of pick-up loops and a network analyzer. The two circular loops of the probe are partially overlapped (distance between loop centers equal 0.75 times their diameter) to minimize the mutual coupling between the elements [
33]; one loop is employed as a transmitter and the other one as a receiver. In this way, the TX loop is weakly coupled to the coil under test, which, in turn, is weakly coupled to the RX loop, with the result that the power transmitted to the RX loop is proportional to the amplitude of the oscillation in the coil under test, and therefore represents its frequency response [
34].
3.6.2. Efficiency Measurement
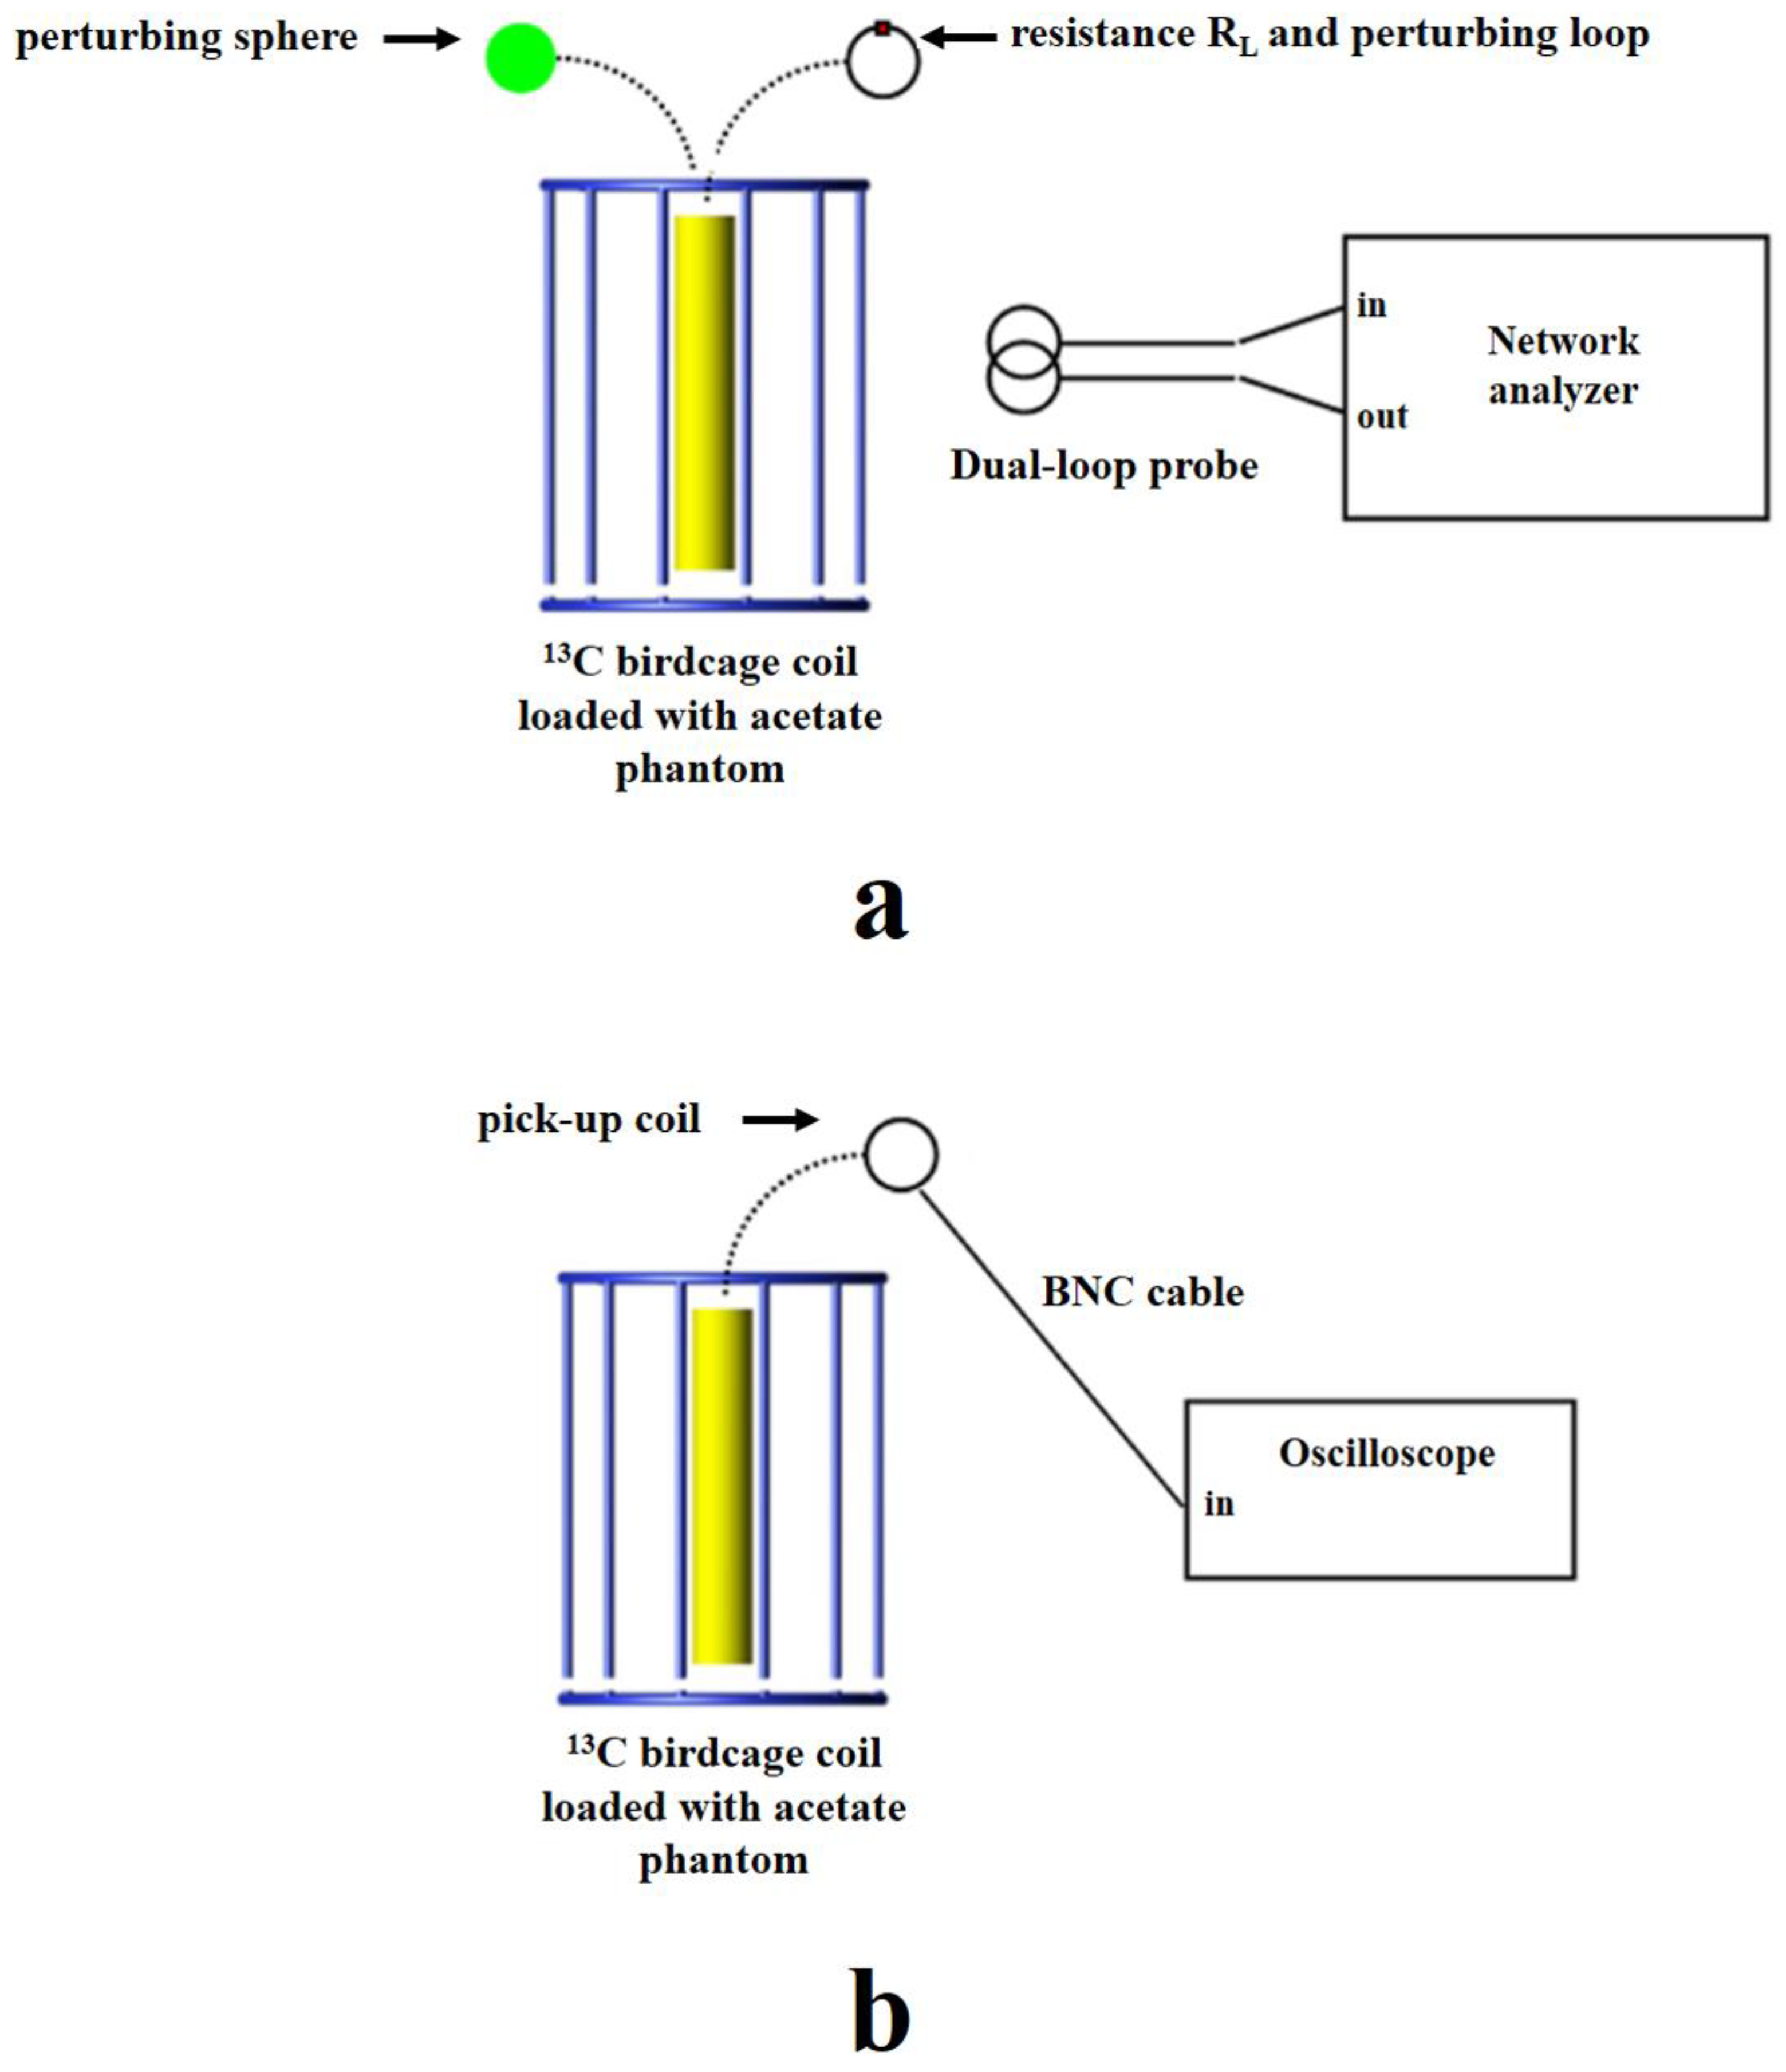
Different magnetic field mapping methods, divided into electromagnetic bench tests and MRI techniques, can be used to estimate the coil efficiency at a fixed point, according to Equation (7). We tested the following four different methods: three methods for efficiency measurements using “probe techniques” (perturbing loop, perturbing sphere, and pick-up coil), and one NMR technique-based method.
3.6.3. Perturbing Loop Method
The perturbing loop method is based on adding a load consisting of an inductive loop of copper wire in series with a known resistance,
RL, placed inside the coil tuned at frequency,
f (
Figure 3a) [
35].
The coil efficiency can be calculated as:
where
Qload and
Qloop are, respectively, the quality factor of the coil when loaded only with a sample and when loaded with both loads, and
S is the loop area.
3.6.4. Perturbing Sphere Method
The perturbing sphere method involves inserting a metallic sphere inside the coil and successively measuring the frequency shift,
f1, caused by the sphere perturbation (
Figure 3a) [
36].
Then, the efficiency of the coil tuned at frequency
f0 can be estimated as:
where B
w is the −3 dB coil bandwidth and
rs is the sphere radius.
3.6.5. Pick-Up Coil Method
The pick-up coil method measures the magnetic field by detecting the current induced in a pick-up coil placed in an oscillating magnetic field of frequency,
f (
Figure 3b) [
17]. If the pick-up loop of radius
r is placed perpendicular to the direction of B
1 and
Vmax is the maximum voltage produced in the coil and measured with an oscilloscope, the following equation can be used to estimate the B
1 value as:
3.6.6. Nutation Experiment
The nutation method, which is the standard way of calibrating the B
1 field in MR experiments [
38], consists of acquiring different spectrums with a linearly increasing pulse width.
The RF pulses change the magnetization orientation with respect to the static field direction, according to the rotational flip angle [
39] as follows:
where
γ is the gyromagnetic ratio (10.71 MHz/T for
13C nucleus) and
τ is the width in seconds of the RF hard pulse of amplitude B
1. By using Equation (17), the B
1 field of the coil can be estimated with the knowledge of the power that reaches the coil.
3.6.7. The Methods Tested on a 13C Coil
All described methods for coil efficiency estimation were verified with experimental measurements performed on a
13C quadrature birdcage coil (4 cm radius, 12 cm length) tuned at 32.13 MHz and employed for
13C metabolic studies on rats [
40] and with a load consisting of a cylindrical phantom with dimensions 2.5 cm× 10 cm (diameter × length) containing 10 g [1-
13C]acetate, 58 mL H
2O, and 0.5 mmol Dotarem. Workbench tests were performed by using a homemade dual-loop probe and a network analyzer HP3577 (Hewlett Packard, Palo Alto, CA, USA).
For the perturbing loop method, five measurements were performed by using different RL resistance values (in the range of 39–470 Ω), for maximizing the measurement accuracy, and by using a 3 cm diameter loop placed in the coil volume. Measurements with the perturbing sphere method were performed by using a 6 mm radius lead sphere, and the efficiency value was calculated as the average of five measurements, while, for the pick-up coil method, the test was performed with a 2.5 cm radius pick-up loop connected to an oscilloscope (Tektronix THS720A, Tektronix, Beaverton, OR, USA).
Table 1 shows the coil efficiency values measured using the four methods, where the results obtained with workbench tests are reported as mean value ± standard deviation [
37].
The differences between the measured values were below 5.2% as the maximum value, resulting in good agreement between the tested methods.
4. Software and Hardware for 13C Hyperpolarized Cardiovascular Magnetic Resonance (CMR) Experiments
Despite the increase in sensitivity, working with UHF scanners limits the clinical potential of hyperpolarized tracers; moreover, few groups have easy access to such facilities. Therefore, a convenient solution could be to enable the use of hyperpolarized tracers for clinical strength systems (1.5–3 T), with improved gradient performance and a powerful RF broadband amplifier. Therefore, acquisition protocols could be used that would be optimized for the clinic and dealing with tissue contrast and relaxation times typical of human studies, thus, fostering translation of the results.
Over the last years, several chemical shift imaging (CSI) and MRS strategies have been developed and optimized to perform acquisition of the hyperpolarized spectroscopic signal with high temporal and spatial resolution, also taking into account that RF pulses contribute to depleting the hyperpolarization [
8,
9].
Single or multi-slice free induction decay (FID)-CSI with low flip-angle excitation is among the first acquisition protocols proposed for in vivo experiments. It is a robust and easy way to implement the method for the acquisition of broad spectral bandwidth; however, it provides an inefficient encoding scheme [
41,
42]. Variable flip-angle schemes can be used to further improve the SNR and metabolite signal detection [
43]. FID-CSI approaches are suitable for tracking the real-time metabolic conversion of the injected hyperpolarized substrate, from which semi-quantitative kinetic parameters (e.g., kinetic constants of metabolic conversion) can be extracted [
44,
45]. Mapping the in vivo distribution of the hyperpolarized species is usually performed using single-shot acquisitions that improve temporal and spatial resolution while preserving the hyperpolarization. Spiral trajectories [
46], often associated with multi-echo chemical shift species separation methods, such as in IDEAL spiral CSI [
47], or spectral-spatial excitation [
48], provide efficient k-space coverage for rapid detection of the hyperpolarized spectroscopic signal over the anatomic volume of interest [
49]. Acceleration protocols, such as Echo-Planar Spectroscopic Imaging (EPSI) [
50,
51], compressed sensing [
52,
53] or parallel imaging [
54,
55], have been proposed to fasten the detection of the hyperpolarized signal.
As an alternative, methods based on the achievement of a pseudo steady-state magnetization, such as in balanced steady-state free precession (bSSFP) [
56,
57], have also been implemented, providing good spectral selectivity and reduced scan time.
A comprehensive overview of acquisition sequences is beyond the scope of this paper, while a more detailed analysis can be found, for instance, in the recent paper by Topping et al. [
58].
4.1. Dedicated Coil Development for Clinical Scanners
In general, safety and compatibility criteria must be satisfied in the design of all new devices used inside an MR scanner.
The dedicated RF coils have to be designed to be compatible with commercial scanners because they have to be connected to the scanner, and generally, the interconnection is achieved via 50 Ω coaxial cables, whose shield design and dielectric material quality permit the transport of the RF energy as low-loss lines.
Cables that are not well terminated in their characteristic impedance may be subjected to common mode currents and standing waves, which could create heating to the patient/sample and irradiated energy in the surroundings. Moreover, different MR scanners could use various and proprietary connectors, so that a strong collaboration between researchers and scanner manufacturers is always required.
Coils have to be matched to 50 Ω for optimizing the energy transfer through all parts of the spectrometer, since the system impedance is a pure 50 Ω resistance, and different impedance matching circuits can be specifically designed for MR applications, generally consisting of inductors and/or capacitors [
59].
Generally, coil prototypes designed to be used in transmit/receive mode with clinical scanners employ a T/R switch inserted between the coil and the scanner, normally provided by a scanner manufacturer, which monitors the specific absorption rate (SAR) to avoid harming the sample.
Finally, capacitors and diodes, usually employed as switching devices included in the coil design, are obtained commercially, and many manufacturers provide them in a nonmagnetic version, specially designed for MR applications. Although, in some cases, the inductors can be home built, very small dimension nonmagnetic inductors are commercially available.
4.2. 13C Coils in Our Lab: Design, Simulation, and Test
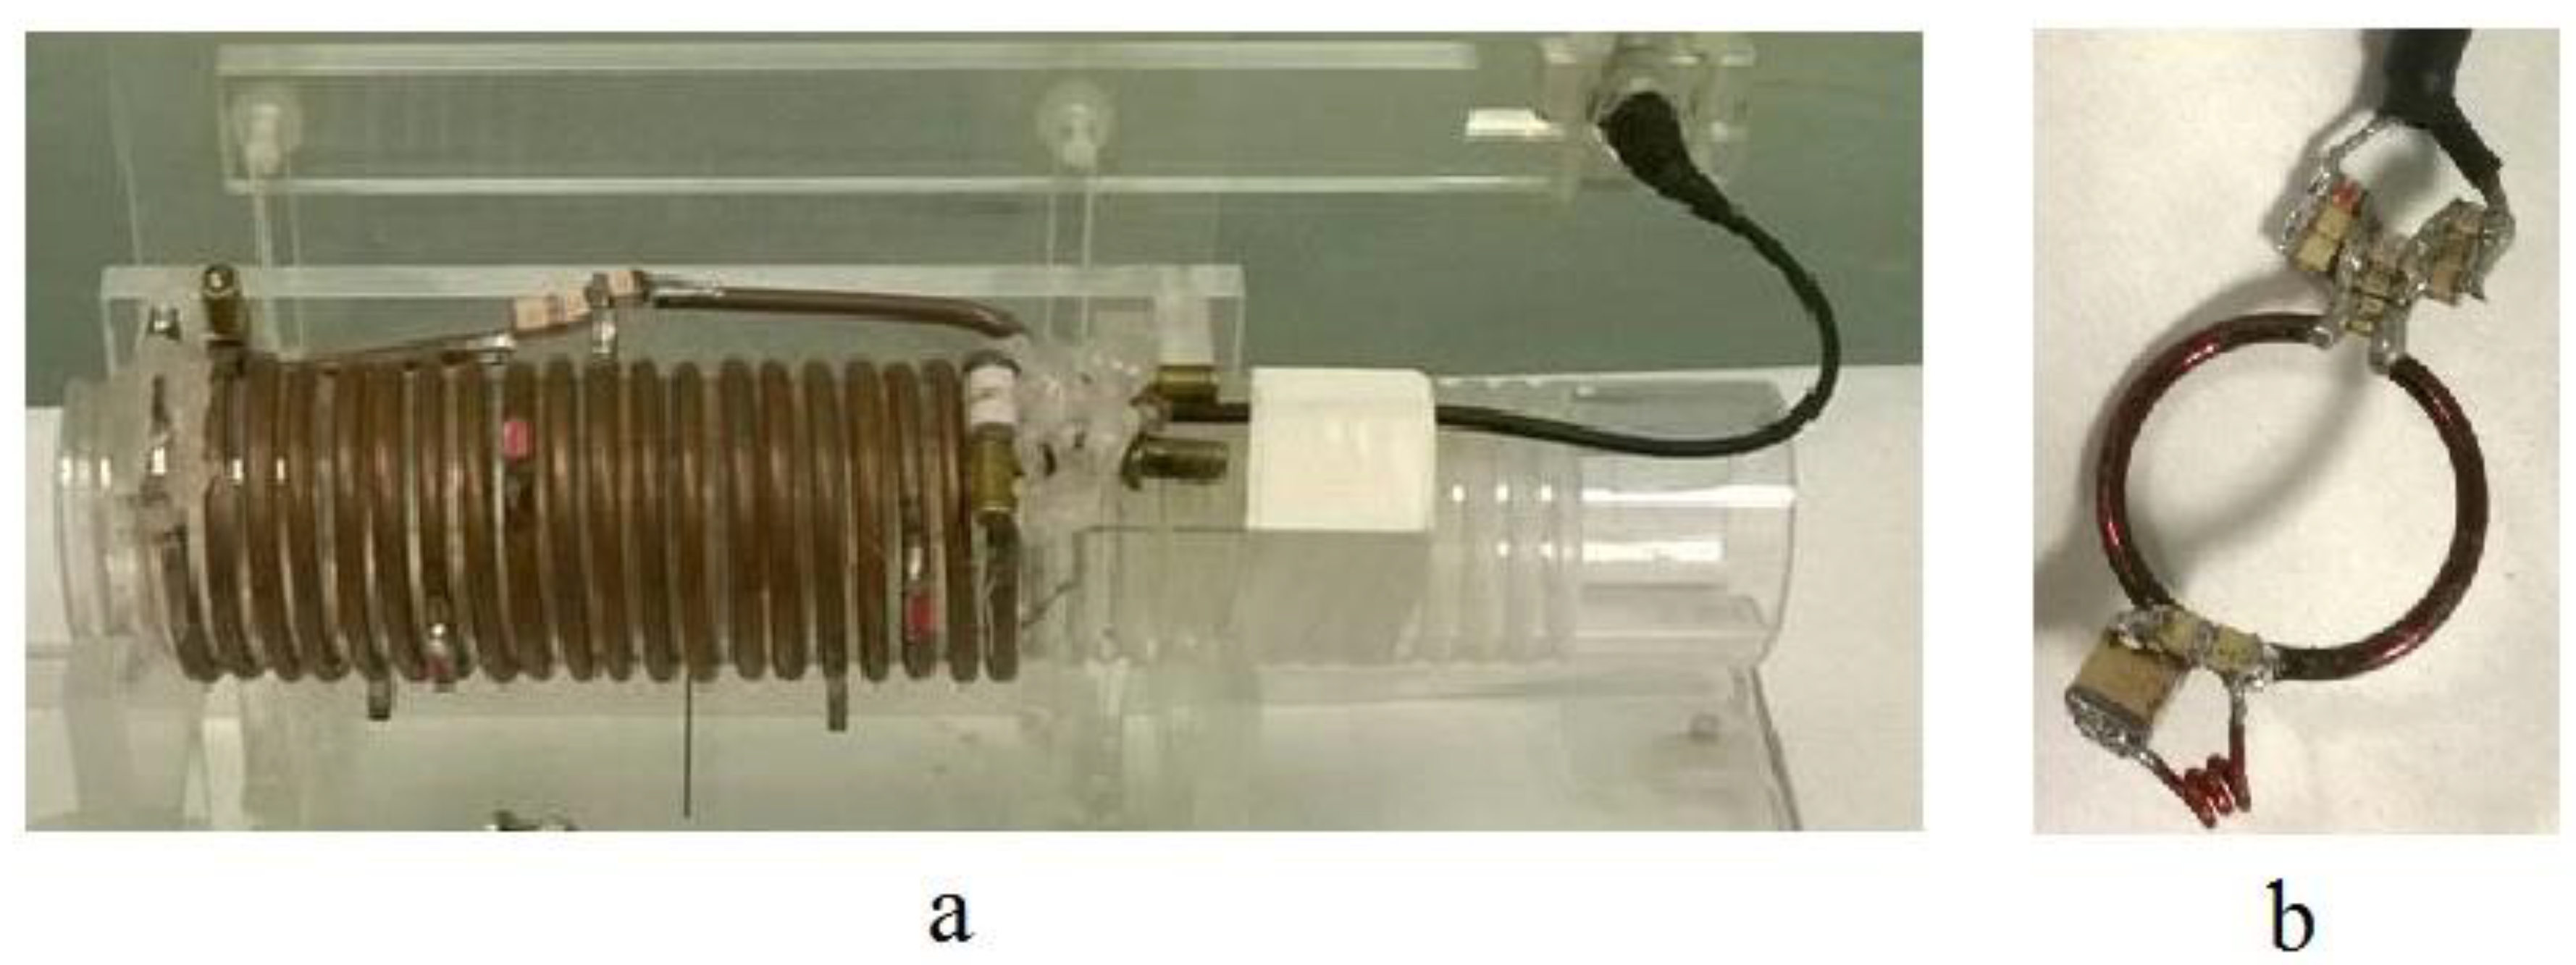
4.2.1. TX/RX Surface Circular Coil
A 25 cm diameter circular coil, built using a 1 cm width strip copper conductor, was designed for investigating the pig heart [
60], which extends from 2 to 12 cm in depth with respect to the coil plane, according to the theory which suggests matching the coil radius with the desired imaging depth [
6]. The Biot–Savart equation, Equation (9), was employed for the three-dimensional B
1 field distribution evaluation, while coil inductance (
L = 0.673 µH) was calculated by adapting Equation (3) to the coil geometry.
Coil losses (
Rcoil = 57 mΩ) and sample-induced resistance (
Rsample = 1.58 Ω) were calculated by using Equations (10) and (13), respectively, and by using a load consisting of a pair of cubic samples with dielectric properties defined following the American Society for Testing and Material criteria for MR phantom development (
εr = 78,
σ = 0.39 S/m) [
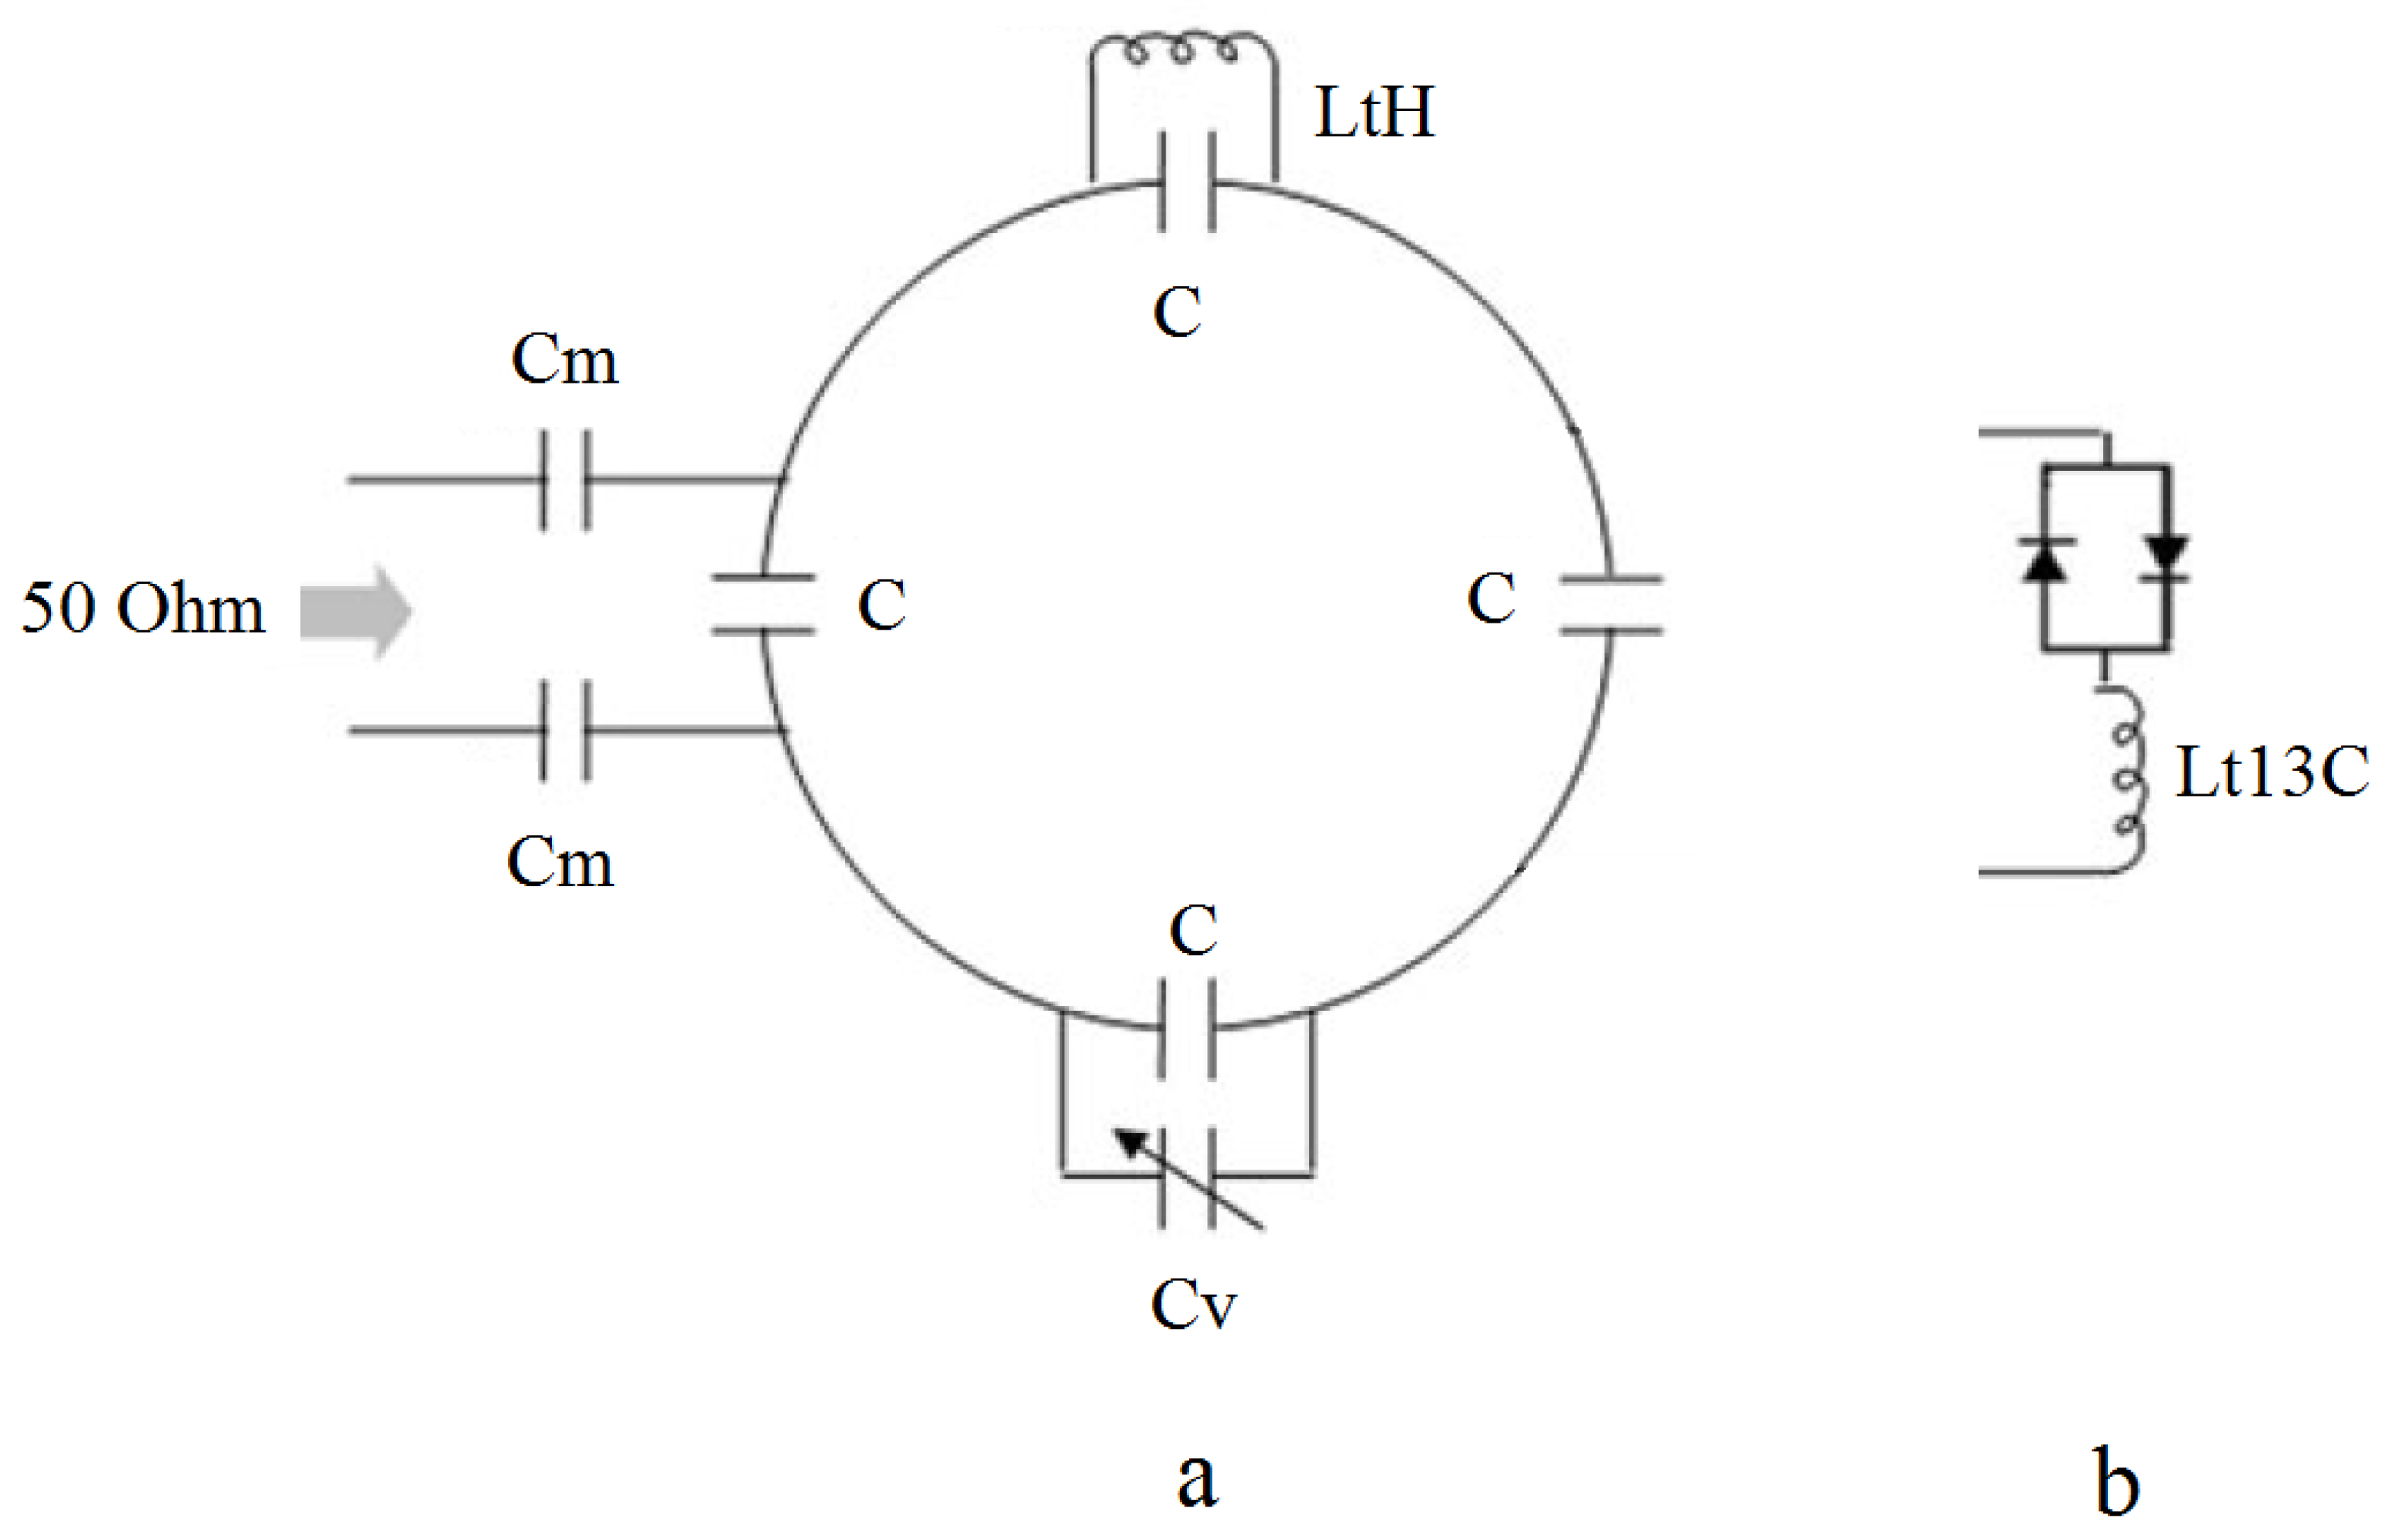
61], which was employed for all the simulations described in this paper. After the simulation, a prototype of the circular coil was designed and built, according to the scheme of
Figure 4a.
C represents the high-quality capacitors (ATC 100C—American Technical Ceramics, Huntington Station, NY, USA) employed for the coil tuning at f0 = 32.13 MHz, while Cv is a variable capacitor (AP40HV Voltronics, Voltronics, Salisbury, MD, USA) useful for the coil fine-tuning within the MR system.
Cm represents a capacitive circuit for matching the coil impedance to 50 Ω resistance in order to employ coaxial cable optimally without added losses, which can be calculated as [
27]:
where
Q is the coil quality factor. In particular,
Cm are the matching capacitors whose negative reactance cancels the positive reactance of the coil inductance and with the
C tuning capacitor transform the coil resistance to a pure 50 Ω at the Larmor frequency of 32.13 MHz.
Since the circular coil was designed as TX/RX coil at 13C frequency and the whole-body coil was employed for 1H imaging (anatomical localization), a decoupling circuit was added to the circuit coil to eliminate the interactions between the 13C and the 1H coil. This resonant blocking circuit LtH-C is tuned at 1H frequency (128 MHz): any voltage induced by the 1H coil in the 13C coil is blocked by the resonant circuit LtH-C, while when the 1H coil is switched off, the 13C coil is tuned correctly.
For coil testing to evaluate the SNR for hyperpolarized substances, we acquired a chemical shift imaging (CSI) of a hyperpolarized [1-13C]pyruvate phantom with a 3T GE Excite HDx (GE Healthcare, Waukesha, WI) scanner, which was employed in all the experiments described in this paper, and using an elliptic FIDCSI sequence with the following parameters: FOV 120 mm, 16 × 16 matrix with reduced k-space sampling (208 phase encoding steps), 256 points, slice thickness 2 cm, FA 30°, TR 80 ms, and bandwidth 5000 Hz.
Figure 5b shows the comparison between the theoretical SNR profile, calculated with Equation (8), and the experimental SNR profile extracted from the map acquired with CSI of a hyperpolarized [1-
13C]pyruvate phantom (
Figure 5a), underlying the good agreement between theoretical and measured SNR provided by the coil.
The SNR on CSI data, for developing the profile shown in
Figure 5b, was evaluated as SNR = Sp/σn, where Sp is the real part of the spectrum maximum peak and σn is the standard deviation of the last points of the spectrum where only noise is present.
The SNR profile in
Figure 5b is obtained from the CSI voxels outlined with a dotted line in
Figure 5a; the maximum value of SNR is obtained at 2 cm in depth from the coil, according to the coil design.
4.2.2. TX/RX Volume Birdcage Coil
The circular surface coil, described in the previous paragraph, was compared with a volume coil constituted by a
13C birdcage coil (Rapid Biomedical, Wurzburg, Germany) in low-pass version (radius of 18.2 cm, length of 36 cm,
n = 12 legs) used for pig experiments [
18].
The birdcage losses, consisting of 1 cm width strip conductors for the end-ring conductors and 0.5 cm radius wire for the leg conductors, were calculated with Equation (10), giving a value of 0.36 Ω. In parallel, the sample-induced resistance for the coil loaded with the same phantom, described in
Section 4.2.1, can be calculated using Equation (13), resulting in a value of 1.05 Ω. The birdcage inductance (0.423 µH) was estimated by considering the ‘‘global’’ inductance of the coil [
62] by schematizing the conductors with a transmission line [
63]. The magnetic field distribution was computed with the FDTD method, which permitted numerical evaluation of the B
1 value for each point inside the sample.
Figure 6 depicts the profile plot of the magnetic field pattern dependence on the depth profile for the circular and birdcage coil. The high magnetic field homogeneity of the birdcage coil is evident from
Figure 6, while the circular coil B
1 field falls off rapidly.
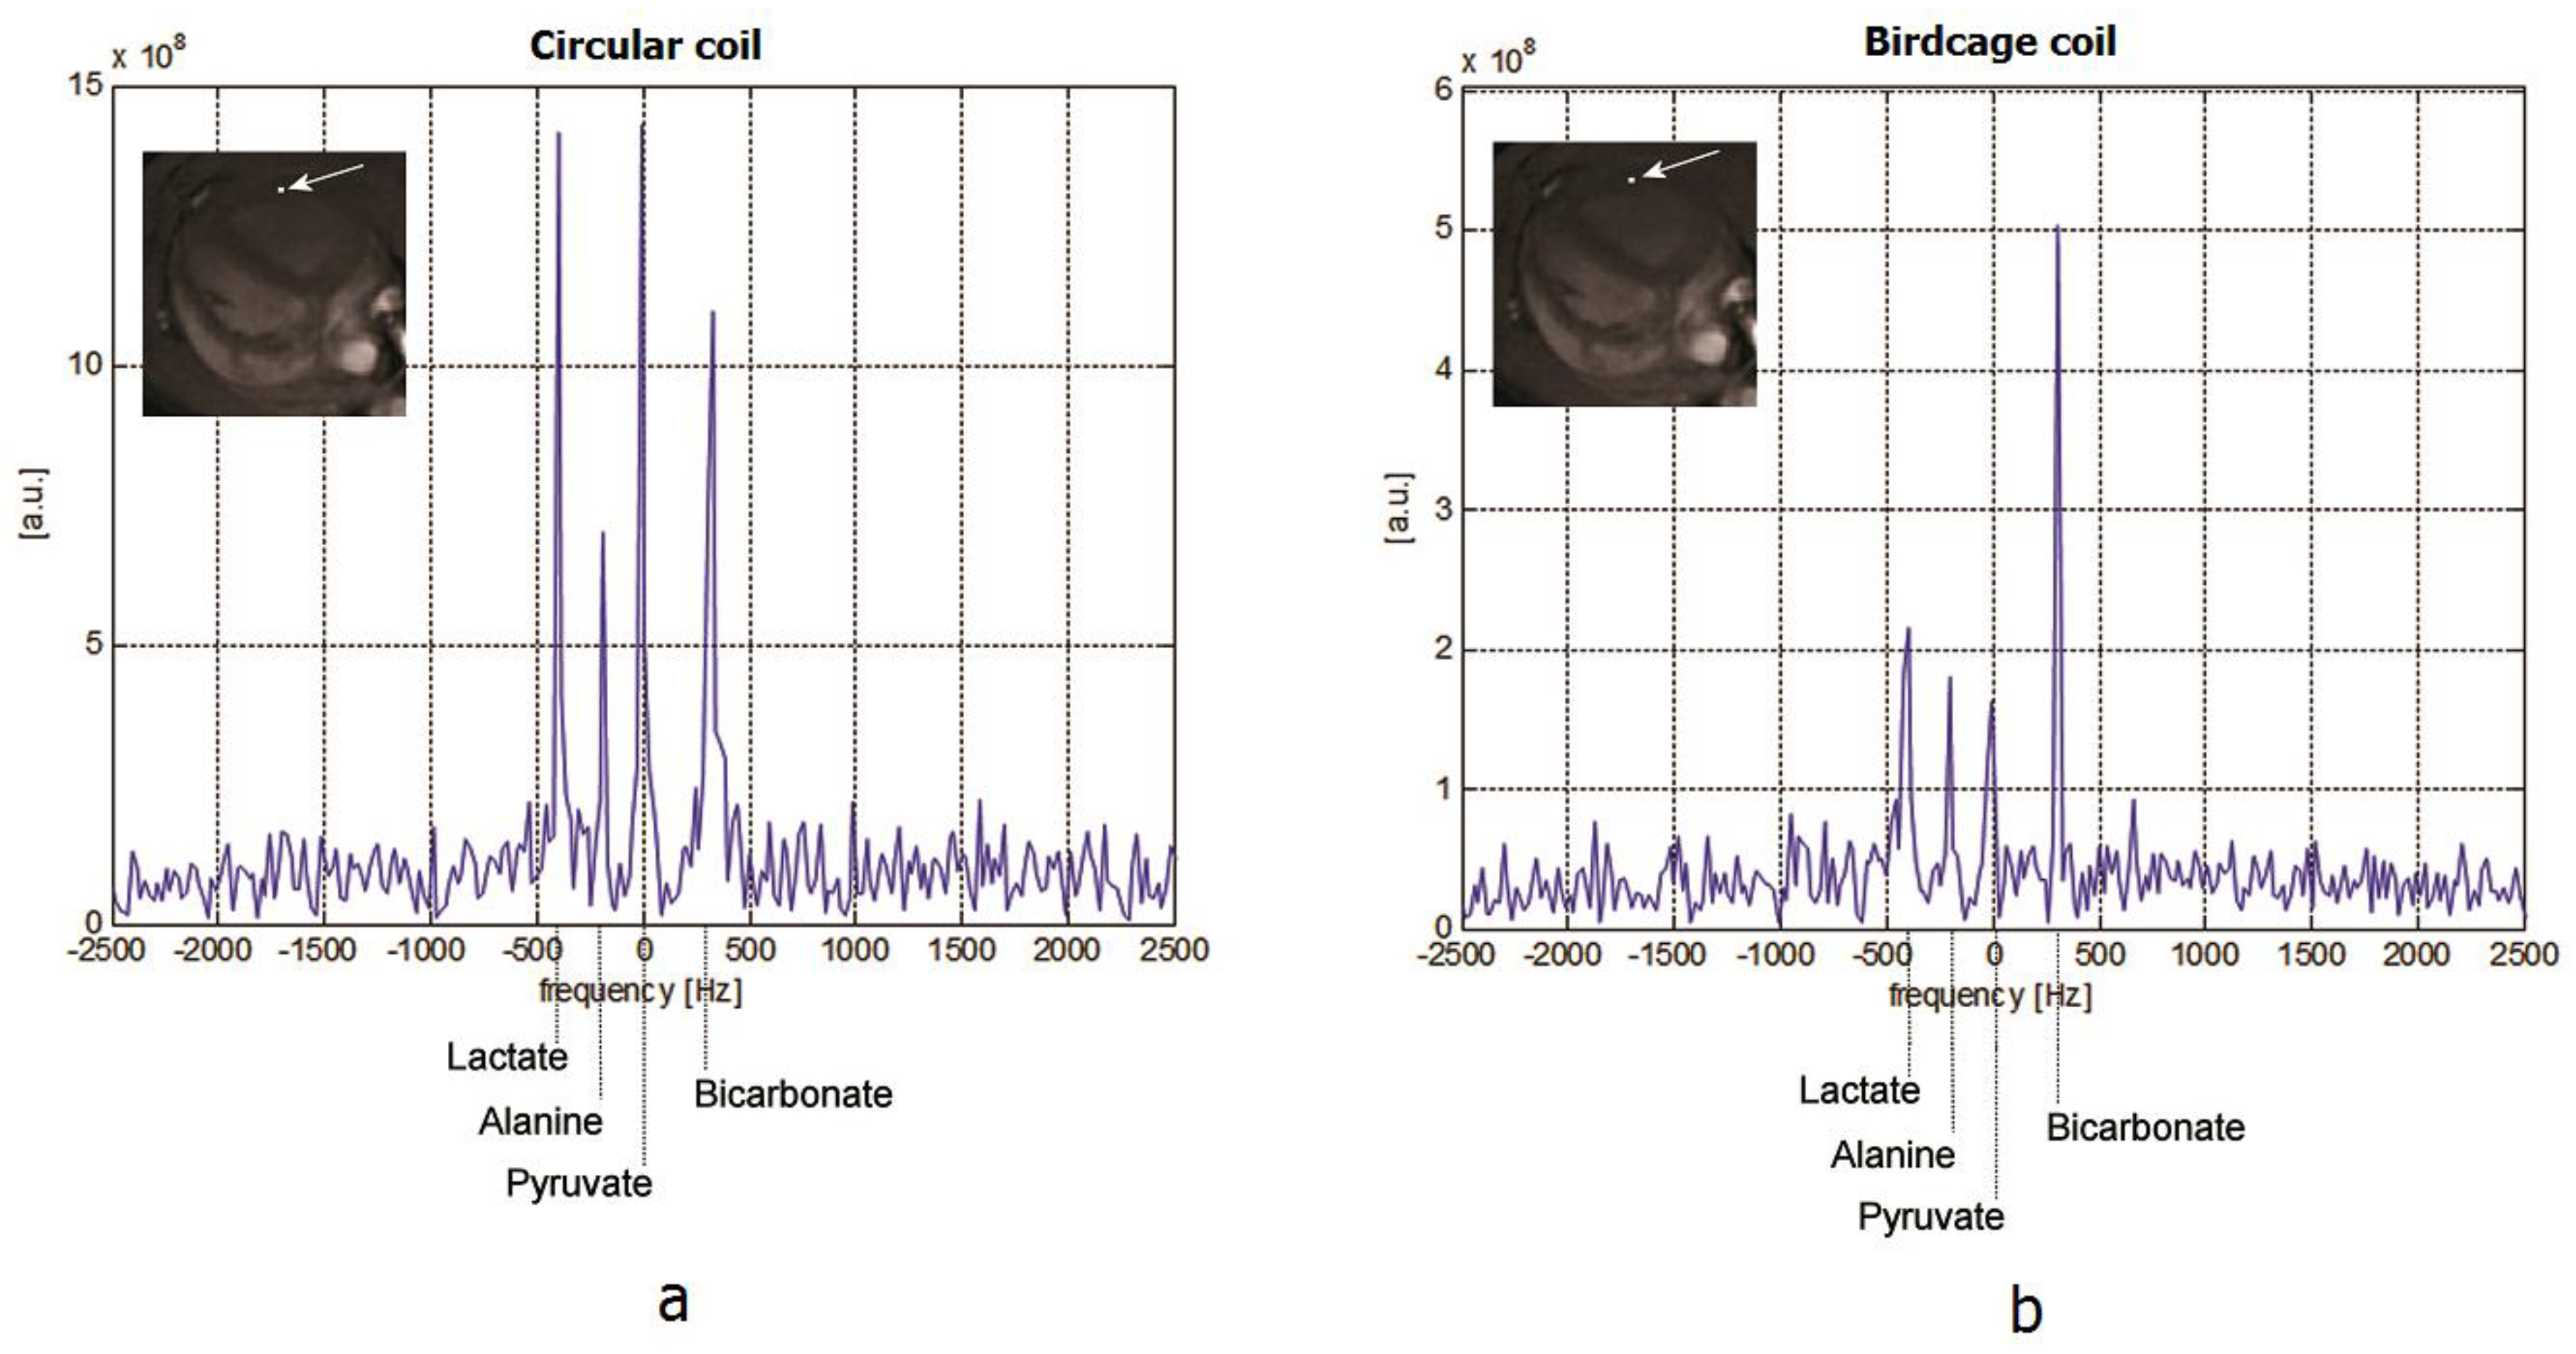
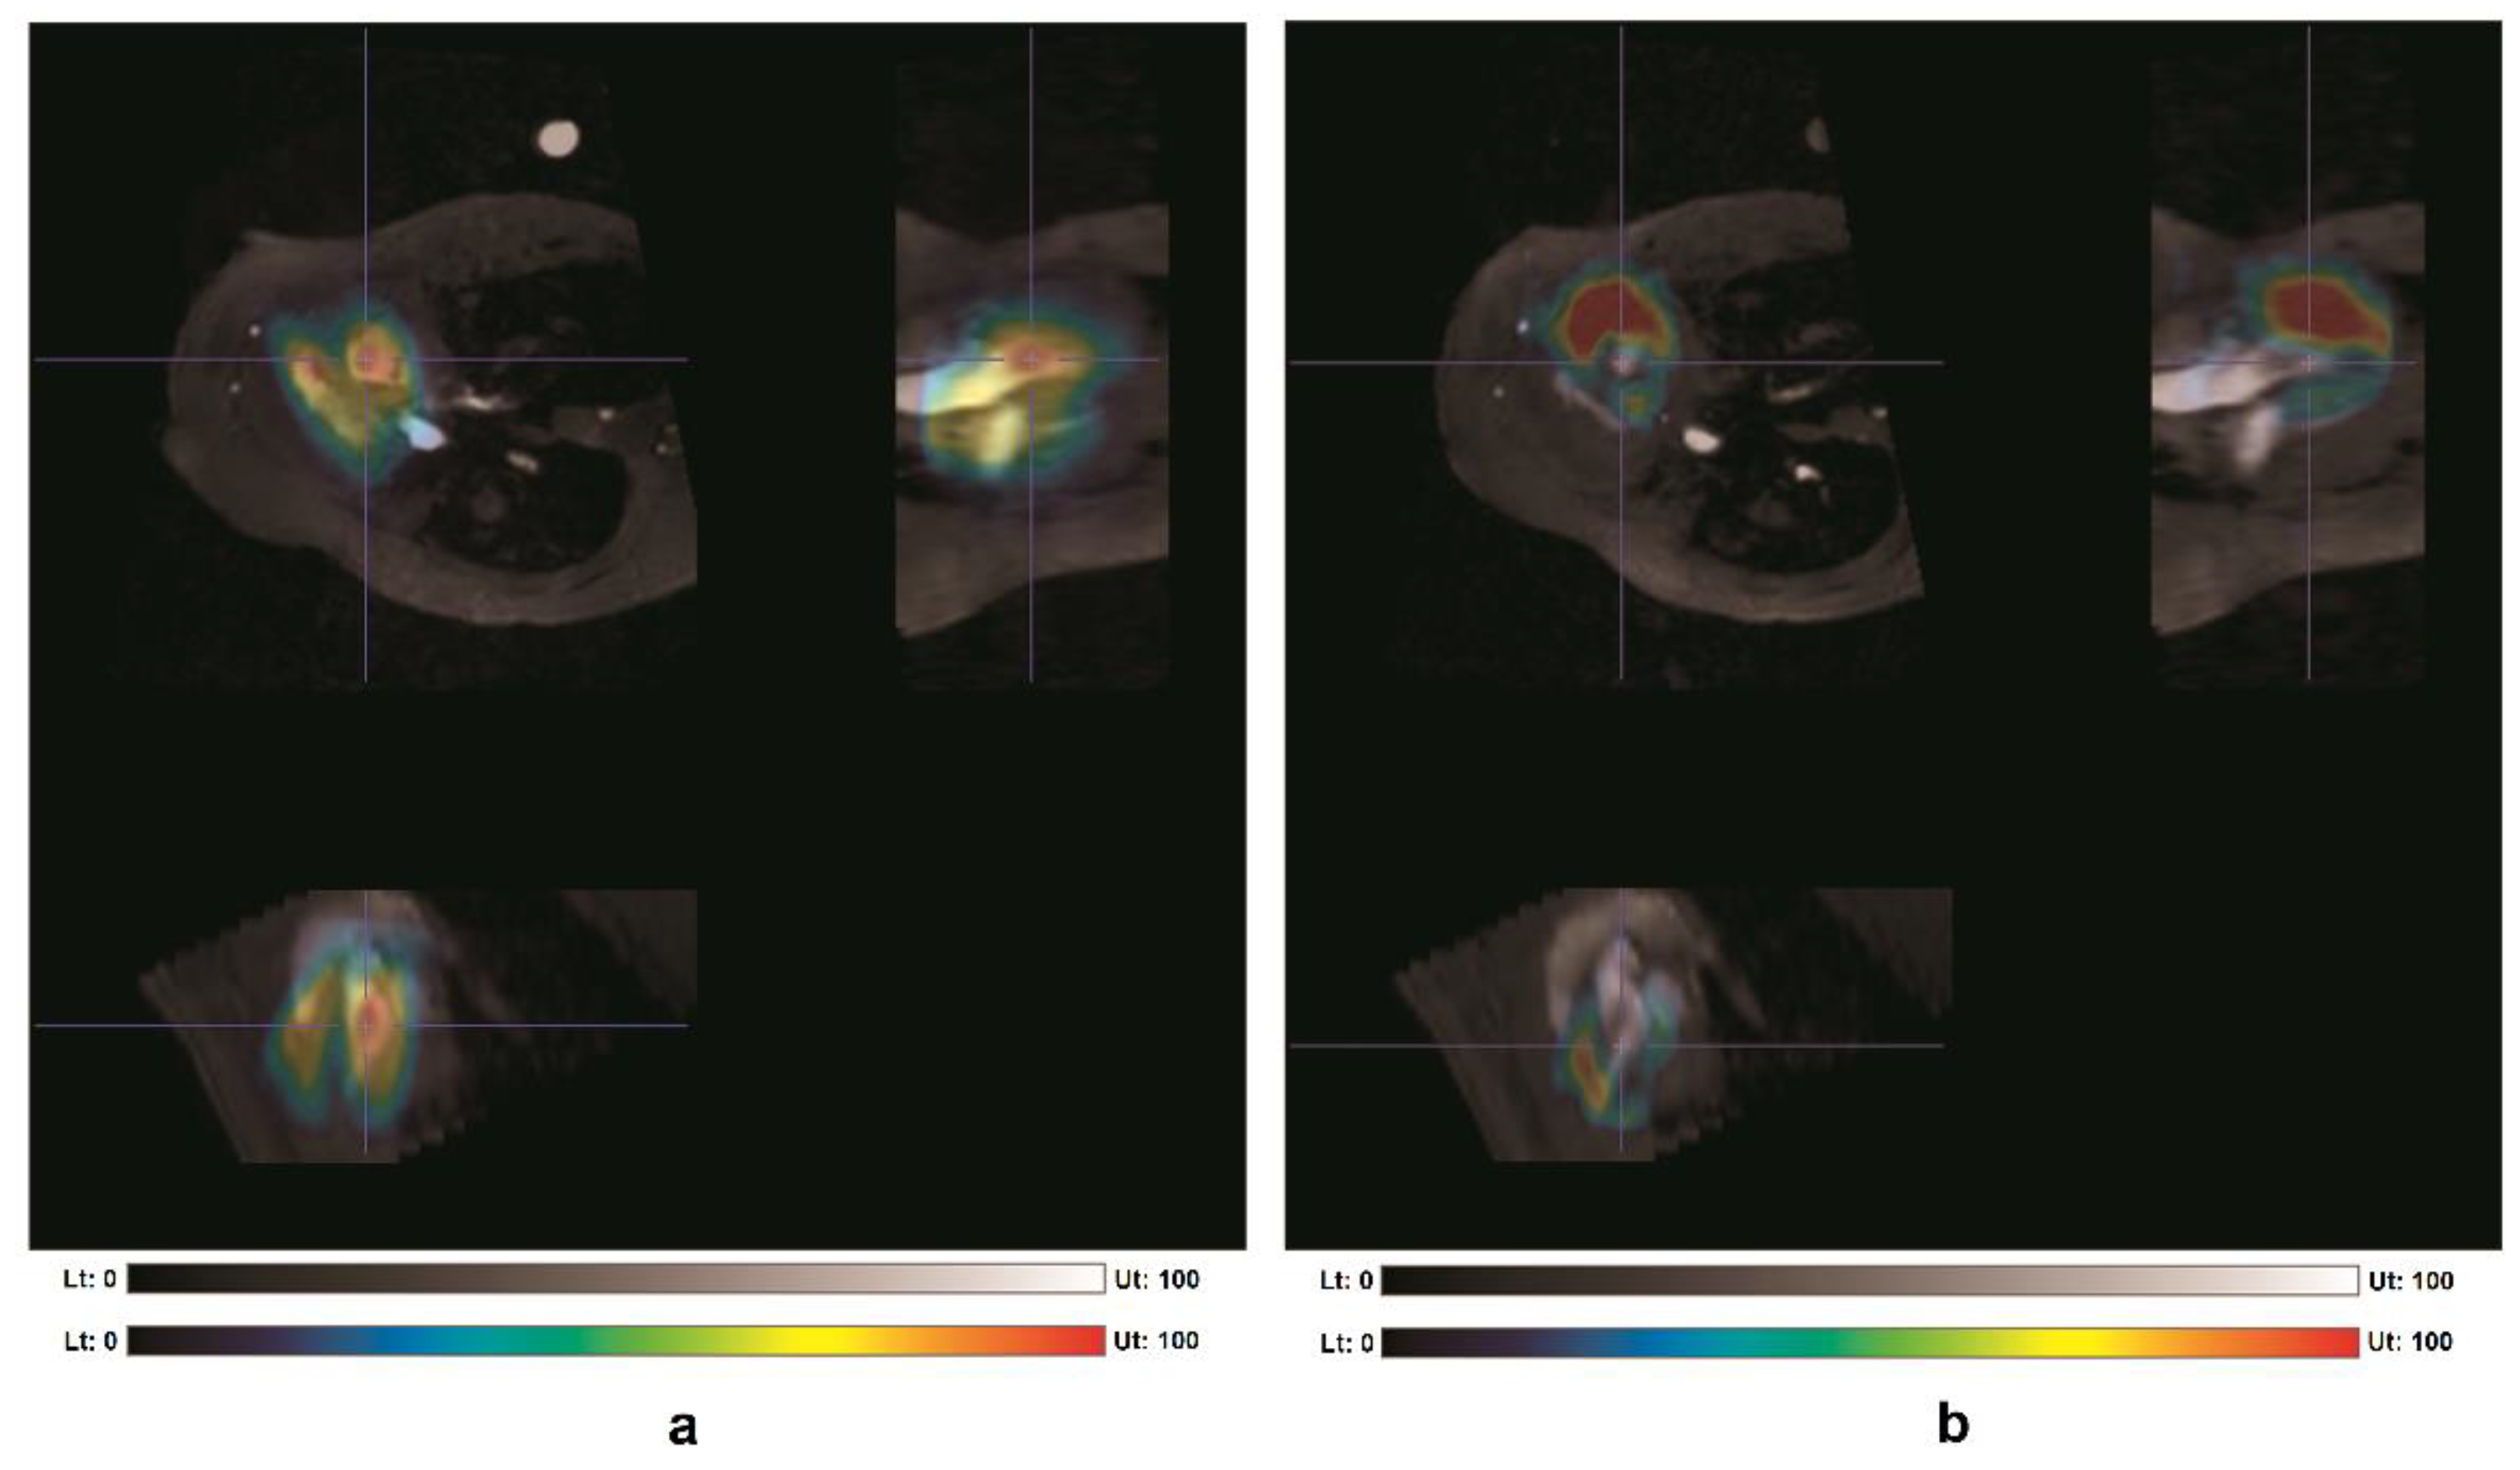
The two coils were successively compared with an in vivo experiment on a pig model, by using the previously described sequence parameters but with TR = 3 s. Two administrations of hyperpolarized [1-
13C]pyruvate were made on the pig: one to acquire data with the circular coil and the other to acquire data with the birdcage coil; about an hour had passed between the two administrations. The single spectrum acquired with circular (
Figure 7a) and birdcage (
Figure 7b) coils on the pig heart revealed a significant increase in the signals obtained using the circular coil because the selected region is close to the coil plane.
4.2.3. TX Volume Birdcage Coil/RX Surface Circular Coil
After the design and test of the circular and birdcage coils, both employed as TX/RX coils, we studied a “hybrid” configuration for exploiting the advantages of each coil design. This setup comprised, therefore, the use of two different coils: a transmit coil, constituted by a homogeneous volume resonator for achieving an efficient excitation in a large volume, and a receive coil, characterized by a high local sensitivity [
64].
Since this novel surface coil had to be employed as RX-only coil, we added a passive decoupling circuit to the loop as depicted in
Figure 4b, constituted by the series of L
t13C inductance and back-to-back diodes which were fixed in parallel to C capacitance: during the TX phase, a current in the diodes is induced by the voltage across the circuit, and the parallel resonant circuit acts as a high impedance, while the surface coil is tuned correctly when the TX coil is switched off. The volume birdcage coil was also modified for being used as a TX-only coil, by adding an active decoupling circuit using PIN diodes biased by an external circuit synchronized with the pulse sequence.
The hybrid coil was tested in vivo to obtain metabolic information on a pig heart by using an IDEAL spiral CSI (axial plane, FOV = 30 cm, slab thickness = 10 cm, 11 constant echo time shift of TE = 0.9 ms, FA = 7°, 14 phase encoding steps along the z-direction), based on single-shot spiral image encoding and echo time.
The hybrid coil resulted in a good representation of the pyruvate signal in both ventricular cavities (
Figure 8), although a slight signal increase was visible in the left ventricle cavity and in the superior part of the right ventricle, close to the circular coil, placed in the superior part of the pig. The bicarbonate map was also clearly visible in the whole left ventricle (LV) wall closest to the circular coil.
4.2.4. Quadrature Surface Coil in TX/RX and RX Only
The design of a novel surface coil configuration arose from the necessity to improve the SNR provided by the circular coil. We combined two coils into a quadrature surface coil, which was able to produce orthogonal B
1 fields in a restricted region and to provide an SNR improvement by a factor of up to √2. The first coil was the same circular coil previously described, while the second was an anti-symmetric two-loop coil (butterfly), in which the currents flowing in its conductors generate a B
1 field that, in the central region of the coil, is a transverse RF field [
65].
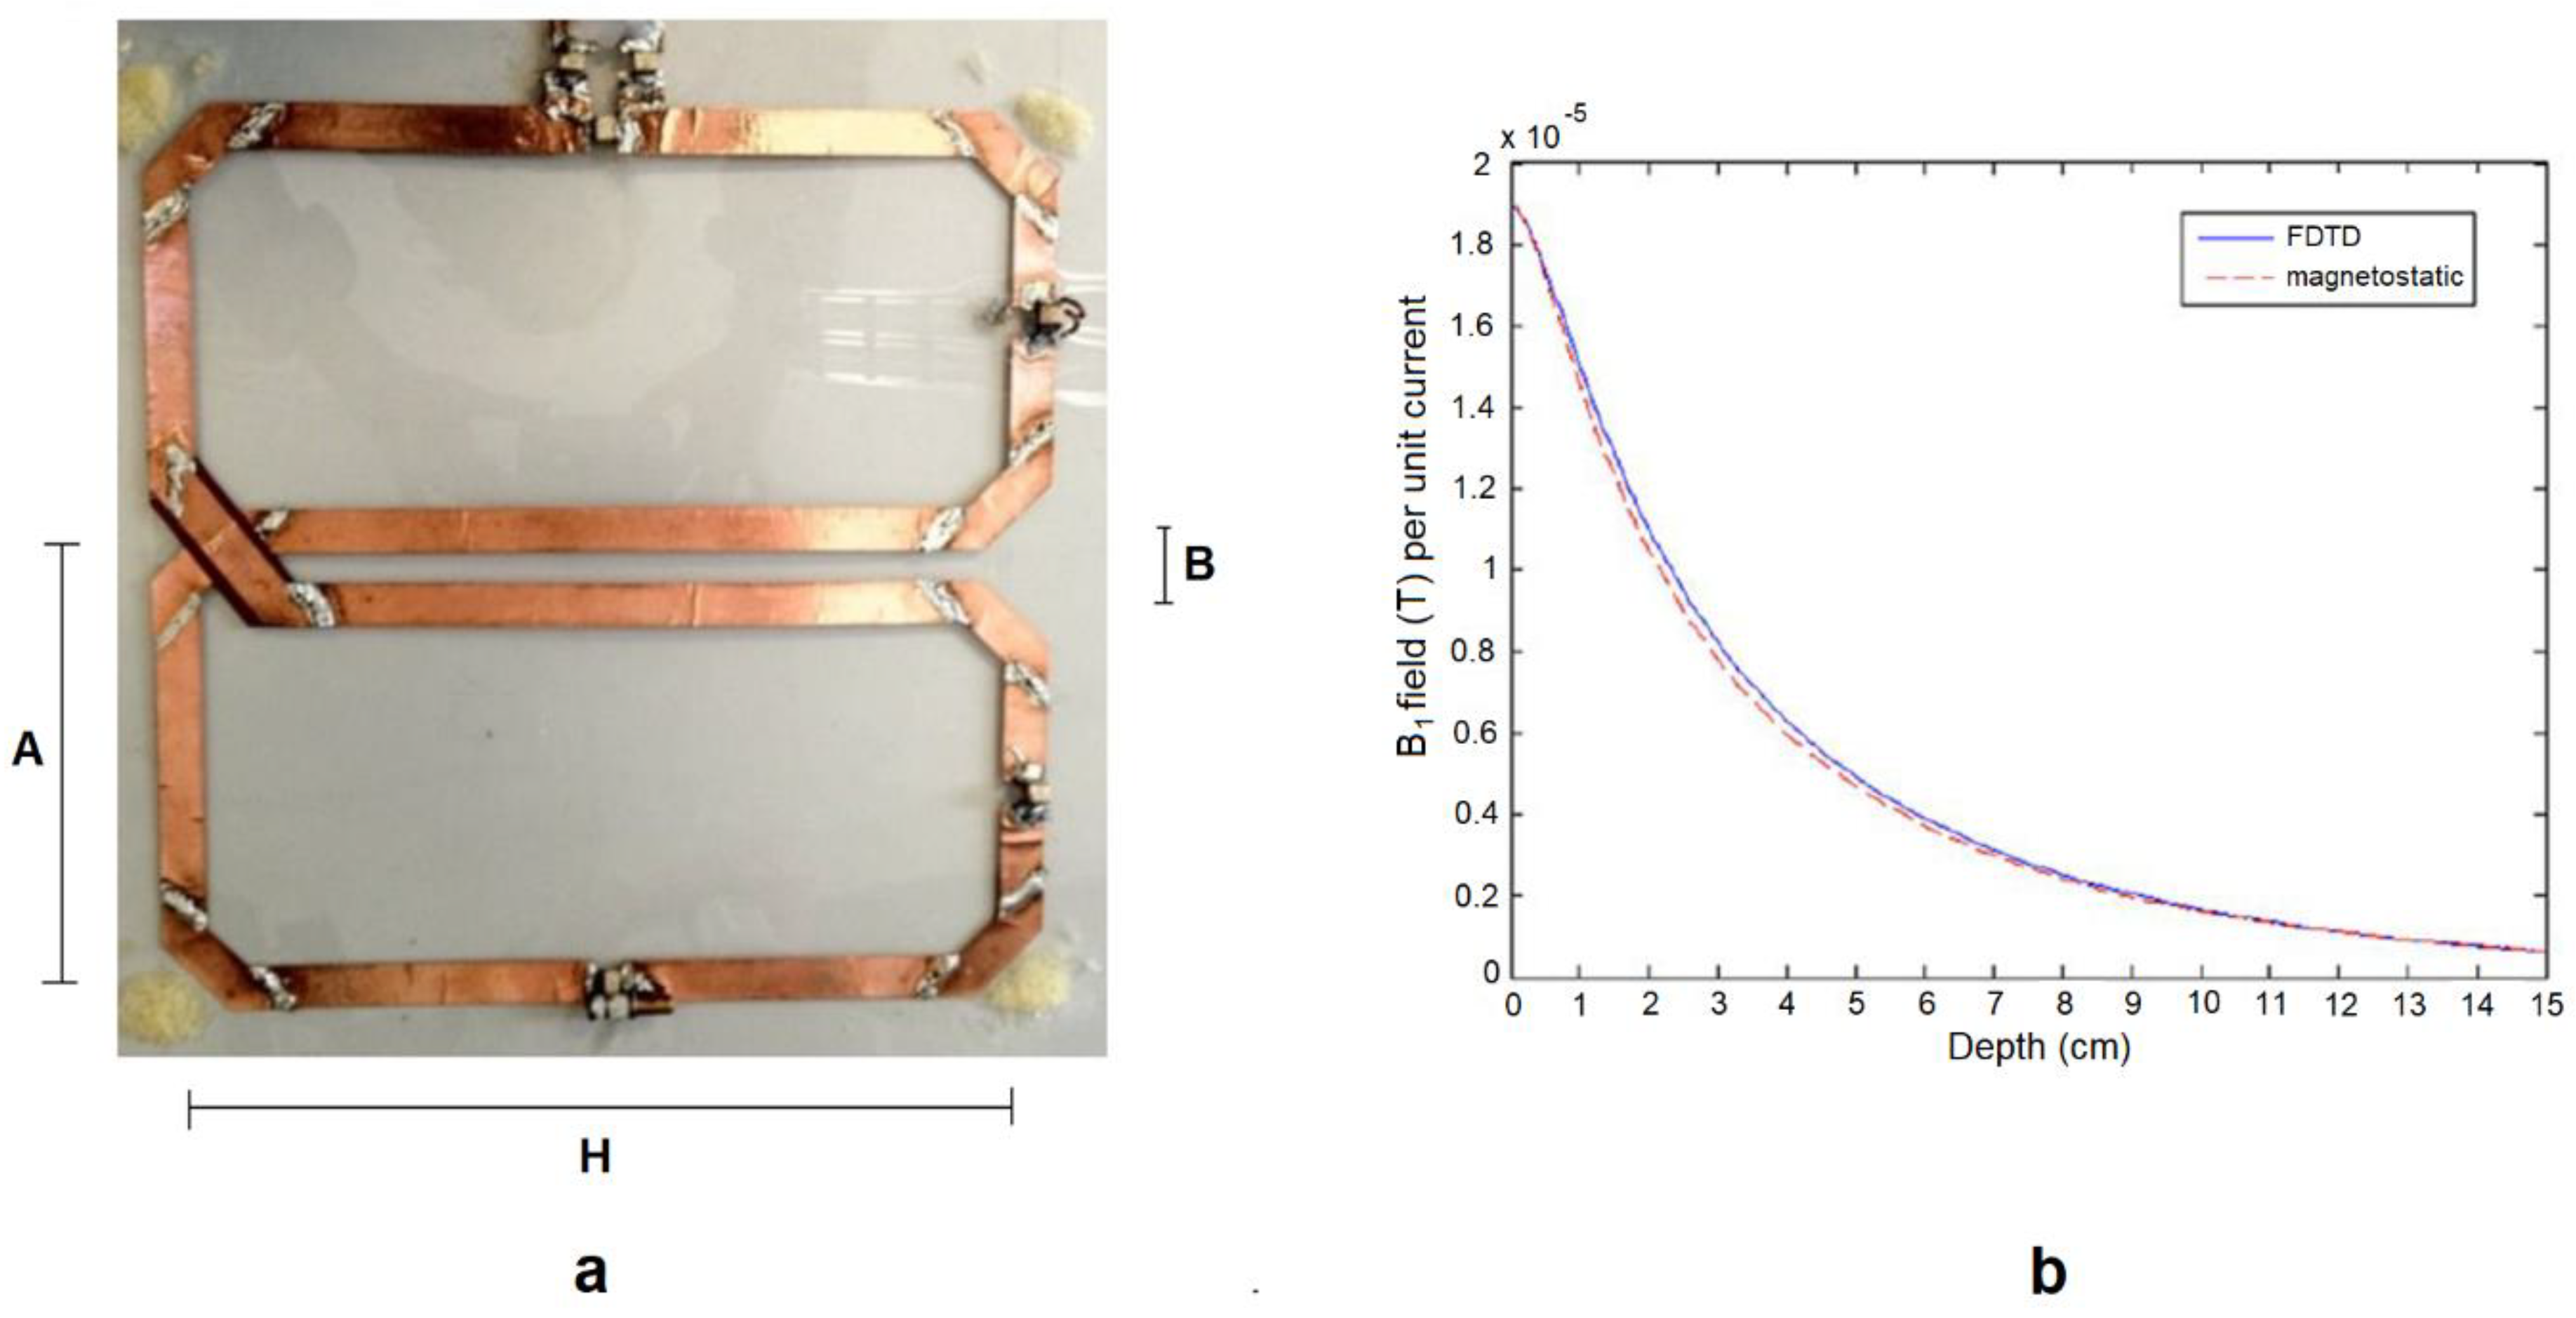
The butterfly coil sizes were selected to provide overlapping with the circular coil and to guarantee good symmetry between the two coils (see
Figure 9a, where A = 11.5 cm, B = 2 cm, and H = 25 cm). Successively, the mutual coupling between the butterfly and the circular coil was minimized by adjusting the overlapping region of the two coils.
The FDTD method was used for evaluating the B
1 value of each point inside the sample and for calculating sample-induced resistances according to the algorithm described in
Section 3.4.4.
The xFDTD (Remcom, State College, PA, USA) software was used to perform the numerical simulations. A 1 V amplitude Gaussian pulse with a suitable frequency spectrum around the coil resonant frequency was used to excite the coils and the PEC type was assigned as coil material. For truncating outward waves and simulating computational domain infinite radiation boundary conditions, a perfect matched layer (PML) was used. Moreover, the simulations were performed with the coils loaded with the previously described phantom (
Section 4.2.1) and by using a nonuniform mesh, with the mesh distribution design on a region-by-region basis.
The butterfly coil inductance was calculated using Equation (3) and was 1.059 μH, while the coil resistance and the sample-induced resistance, respectively, were calculated using Equations (10) and (13), and provided values of 0.25 Ω and 1.77 Ω.
For comparison purpose, the magnetic field patterns along with the depth profile for the butterfly coil was estimated by magnetostatic analysis and the FDTD tool, and the simulations provided very similar values (
Figure 9b), demonstrating that the magnetostatic assumption is valid at the
13C frequency, since the radiation wavelength is 9.4 m at 32.13 MHz in free space, which is much greater than the coil dimensions.
The quadrature surface coil, consisting of a combination of the butterfly and the circular coil, was previously designed and tested as TX/RX configuration. The obtained SNR was higher as compared with the SNRs provided by the single coils in a wide range of the penetration depth into the phantom (
Figure 10), while the MR acquisition of metabolic maps with hyperpolarized [1–
13C]pyruvate injected in a pig showed that the configuration was able to effectively image the hyperpolarized [1–
13C]pyruvate distribution, Successively, the same quadrature surface coil was used in RX mode in combination with a birdcage coil as a transmitter [
66]. For this purpose, a passive decoupling circuit was added to both surface coils, as described in a previous paragraph. The SNR profile of this TX birdcage/RX quadrature coil configuration underlined its advantage in a wide range of coil-to-voxel distances (
Figure 10).
4.2.5. Theoretical Comparison between 13C Coil SNR Plots
A successive work [
67], comparing
13C coils with different geometries (circular, butterfly, birdcage, and quadrature surface coils) employed in single element TX/RX mode and in combination with different setups (transmit-only birdcage coil and receive-only surface coil, again called “hybrid” configurations), was performed with the SNR model previously described.
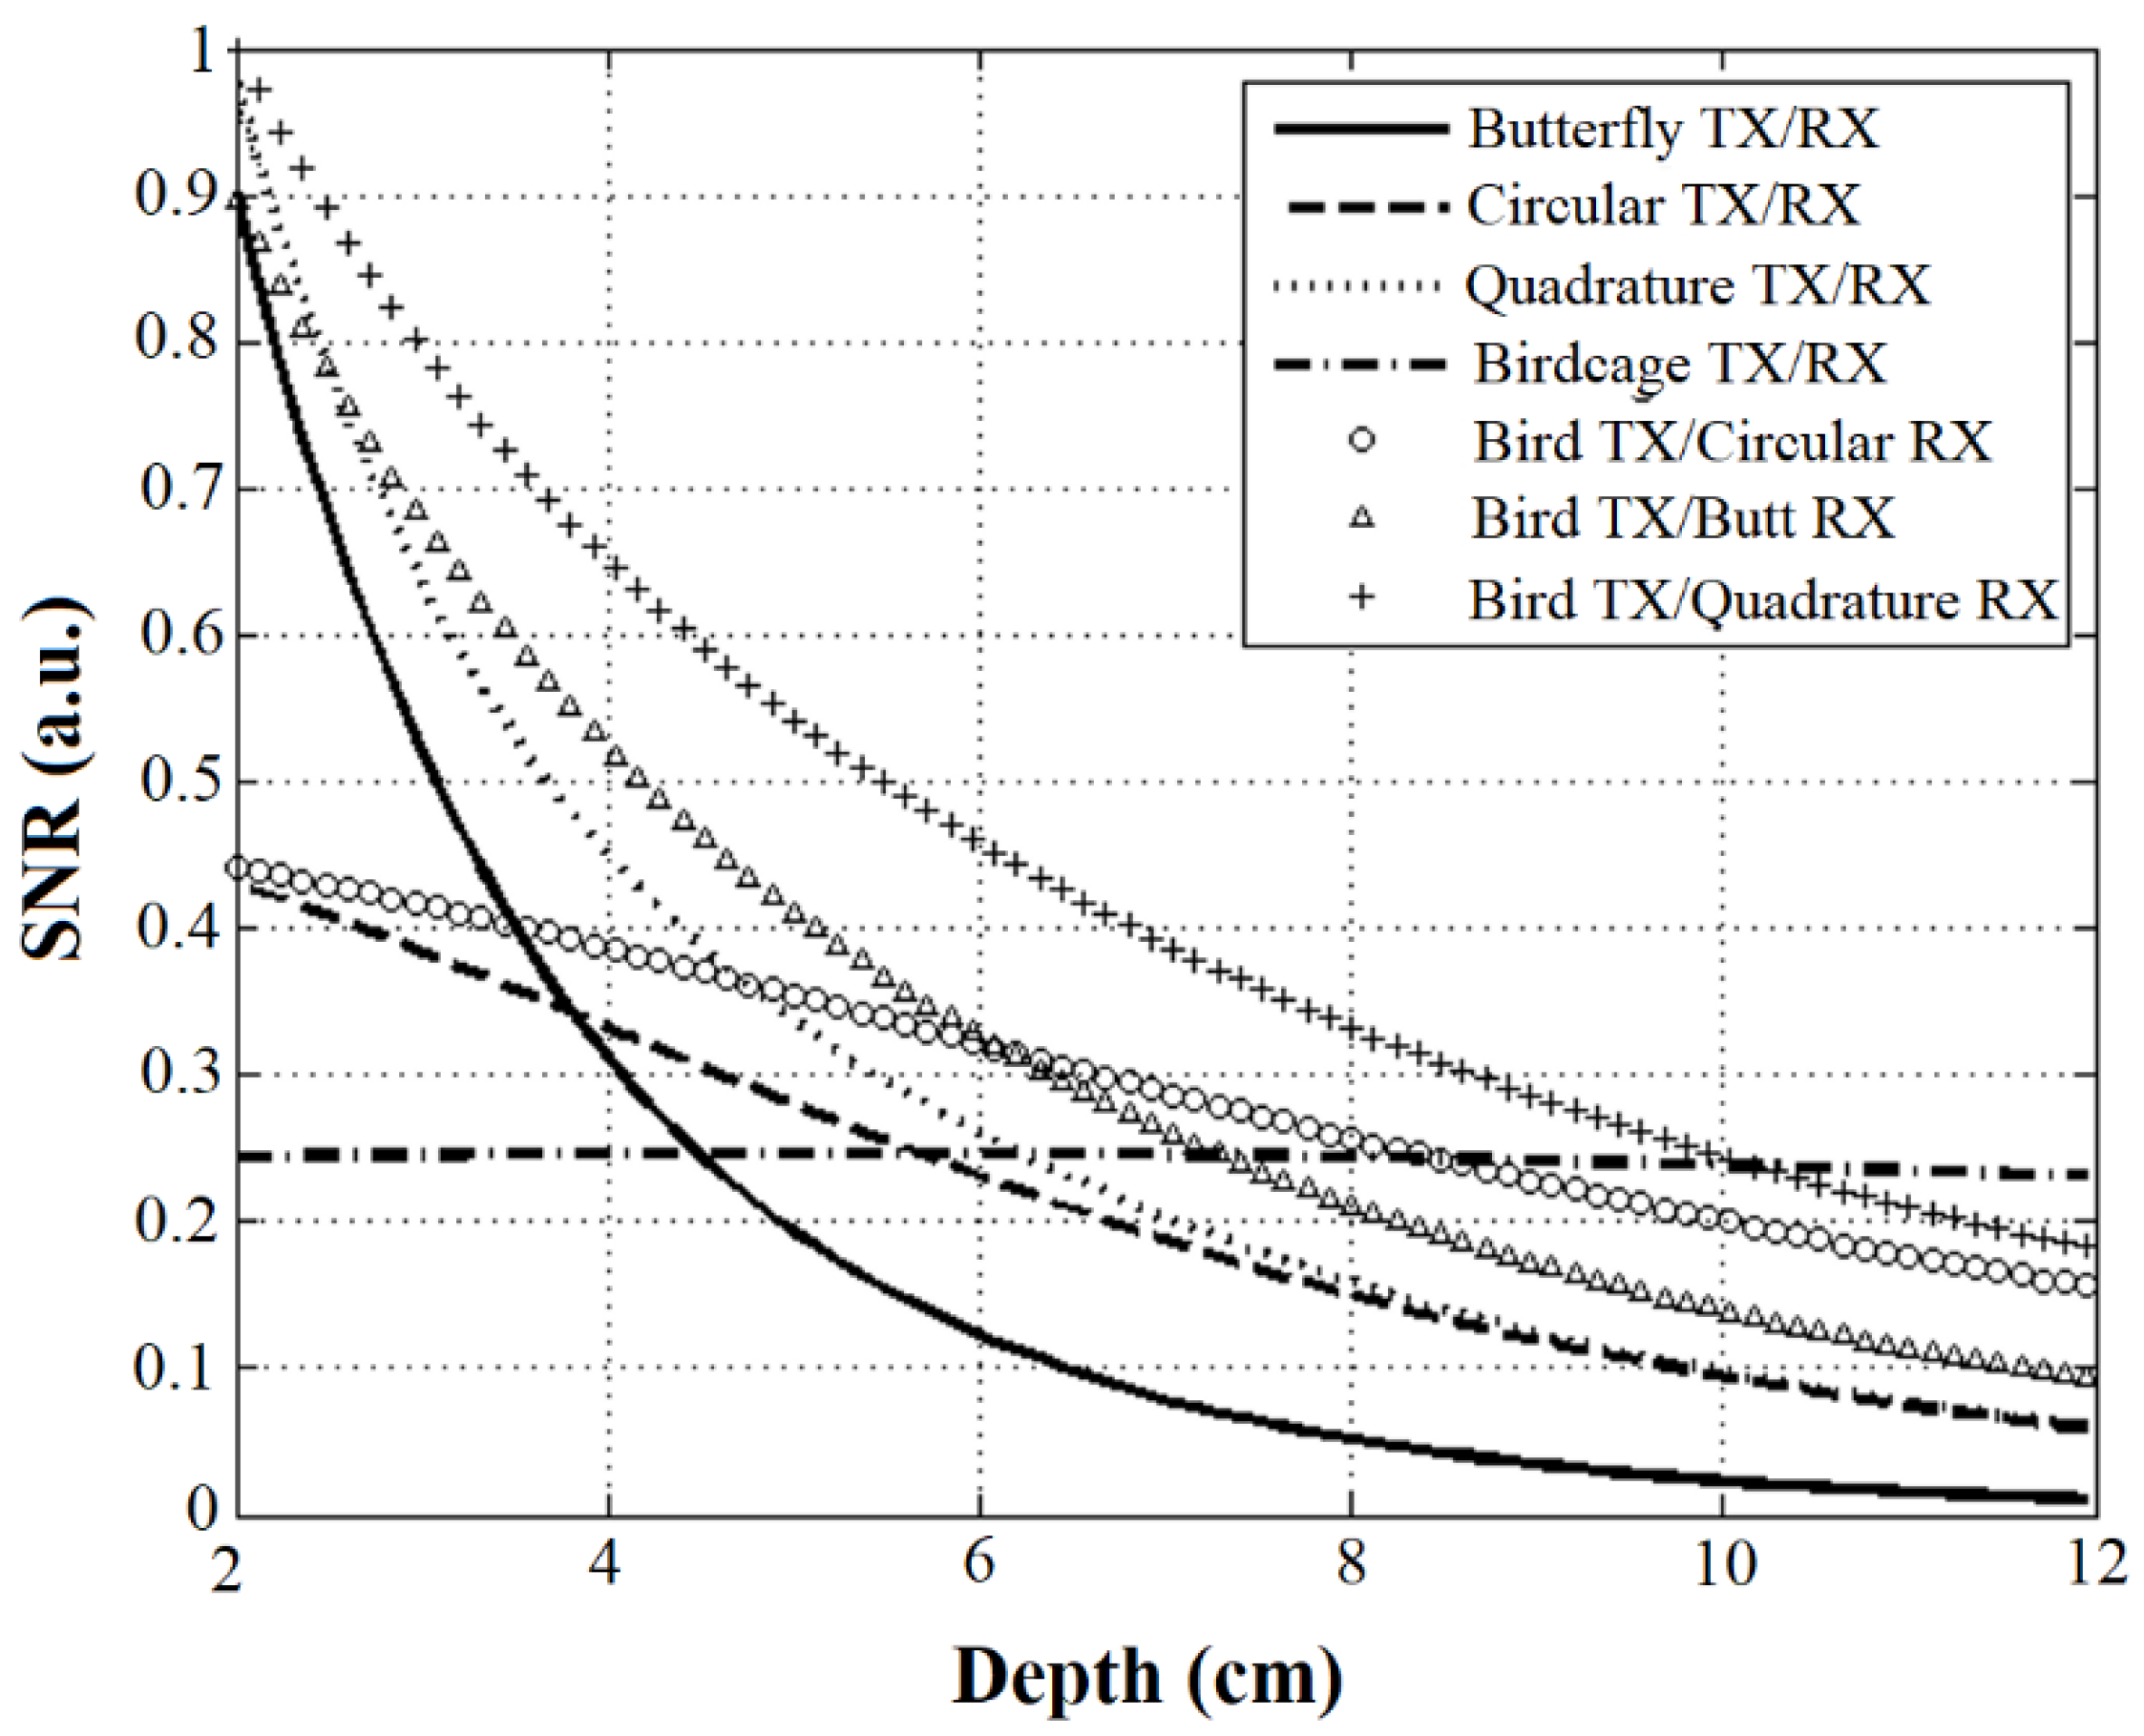
The theoretical SNR trends of dependence on the depth profile along the sample region (from 2 to 12 cm) are shown in
Figure 10 for all coil configurations.
The TX/RX circular coil is characterized by its inhomogeneous B1 field distribution, which decreases strongly with the distance from the coil plane, while the TX/RX butterfly coil shows a more rapid decay as the observation point moves away from the coil plane, although the SNR values in the first 2 cm of the phantom extension are higher than the circular coil ones.
It is well known that the birdcage produces a highly uniform magnetic field, and the SNR trend of the TX/RX birdcage coil is almost constant with respect to the depth profile.
The TX/RX quadrature configuration provides higher SNR with respect to the single TX/RX circular and TX/RX butterfly coil configurations in a wide range of penetration depths of the phantom length. Regarding the hybrid configurations, their theoretical SNR profiles underlined their advantage over the TX/RX single coils in the entire penetration depth of the phantom. Finally, the TX birdcage/RX quadrature coil configuration outperforms the TX/RX birdcage in a wide range of coil-to-voxel distances (80% of the phantom extension).
4.2.6. 16-Channel Array Coil
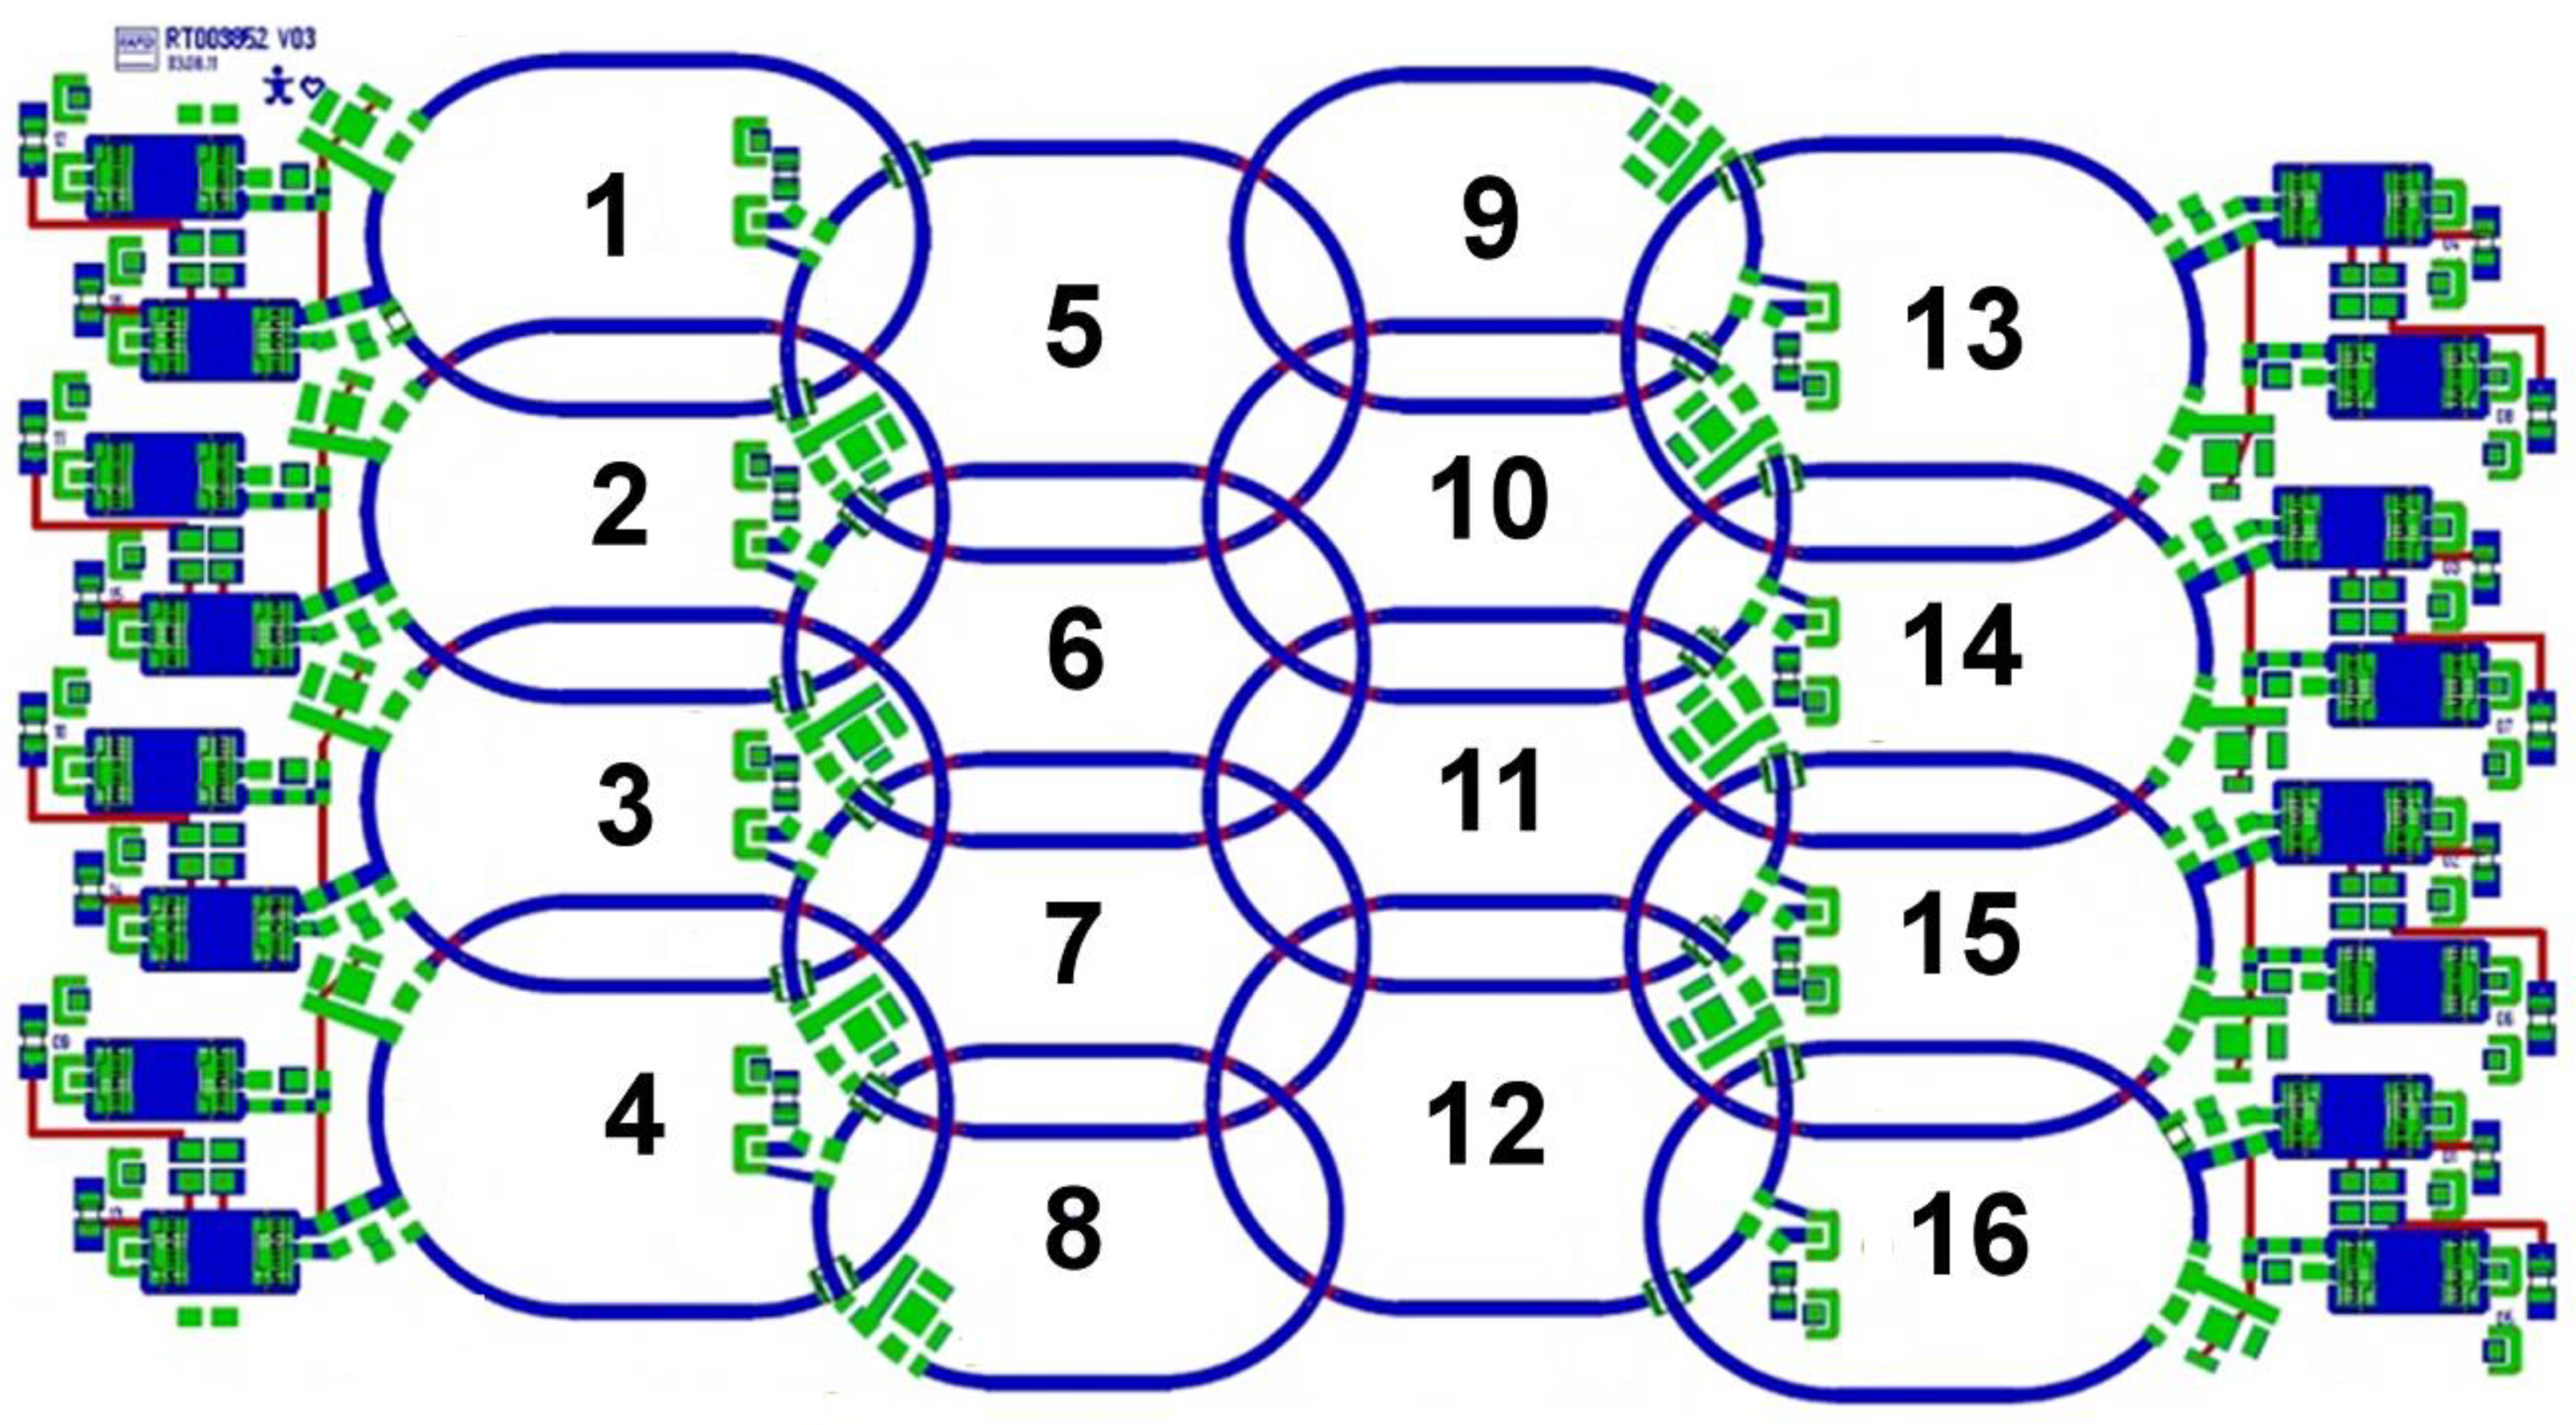
A 16-channel receive surface array coil was designed for
13C hyperpolarized studies of the pig heart with the same clinical scanner [
68]. Each elliptic element in the coil was 5 × 8 cm
2 with a conductor width of 2 mm (
Figure 11).
Symmetric coupling schemes, including cable traps were used to fix tuning and matching, while active decoupling was performed by PIN diodes within
13C traps and passive 1H traps were used for decoupling the resonator and wiring from the 1H body coil. Preamplifier decoupling was achieved by transforming the high S11 of the preamplifier input to a high impedance in the coil circuit by phase shifters. Animal studies on six healthy male mini pigs were performed to test the coil. The metabolic maps of pyruvate, lactate, and bicarbonate (
Figure 12) were obtained with three-dimensional (3D) imaging sequence on the heart, performed with a stack of axial plane single-shot spiral trajectories, FOV = 30 cm, a nominal resolution of 8 mm, and a duration of 42 ms using the maximal gradient strength of 40 mT/m and maximal slew rate of 150 T/m of the system.
With respect to the previously described coil configurations, a significant improvement of SNR in the heart wall near the coil surface was obtained using the 16-channel coil. The SNR was also acceptable in the remote heart wall, allowing assessment of cardiac metabolism in the whole heart.
4.2.7. 1H solenoid/13C Circular Coil for Small Animal Studies
Acquisition in a mouse model was performed after the design and simulation of a dual-tuned RF coil configuration operating at two frequencies of interest (1H of 127.75 MHz and
13C of 32.13 MHz), constituted by a 1H whole body solenoid coil for imaging and a
13C circular loop surface coil for performing
13C acquisitions, with both coils employed in TX/RX with a 3T scanner [
69].
The 1H volume coil (
Figure 13a) is a solenoid (12 cm length, 4.4 cm diameter, 20 turns), characterized by the possibility of achieving high magnetic field homogeneity in both transversal and longitudinal sections.
The spacing between turns was chosen to achieve the best compromise between magnetic field homogeneity and minimization of losses due to proximity effect [
70], resulting in an optimum spacing of sp = 3 a [
71], where a is the wire radius = 2 mm.
The
13C surface coil (
Figure 13b) is a 2.5 cm diameter circular loop built with a 2 mm diameter wire conductor and decoupled by the 1H solenoid using a resonant blocking circuit tuned at proton frequency and consisting of an LCC trap [
72].
For both coils, the magnetic field distribution was calculated with the Biot–Savart equation and inductance by adapting Equation (3) to the coil geometries, resulting in values of 5.256 μH for the solenoid and 40.97 nH for the circular coil.
Coil workbench tests consisted of
Q and
r measurements, according to Equations (14) and (6), respectively, and the results are shown in
Table 2. The
r values underlined that for the solenoid, the losses are mainly caused by the sample load. In contrast, as expected for surface coils, the circular coil contribution to the signal loss is determinant.
With this coil configuration it was possible to obtain both anatomical and metabolic information within the same study session. For the in vivo experiment, a healthy mouse was placed at the center of the 1H solenoid, and the 13C circular coil was positioned adjacent to the back of the mouse, in relation to the heart. Anatomical proton images were acquired with a fast spin-echo (FSE) sequence (FOV = 8 × 8 cm2, 512 × 512 matrix, FA = 90°, TE/TR = 2800/67.488 ms).
The 13C spectroscopic signal was detected by using IDEAL spiral CSI (FOV = 8 × 8 cm2, TR = 1000 ms, echo times = 7, echo spacing = 1.12 ms, scans = 32, and flip-angle = 10°), from a 10 mm axial slice selected to include the heart, liver, and kidney in the field of view.
The metabolic maps of the spatial distribution of hyperpolarized [1-
13C]pyruvate obtained in vivo and overlapped on reference anatomical images are shown in
Figure 14.
5. Discussion
In recent years, a new methodology based on MRS using hyperpolarized
13C has been demonstrated to be useful for studying cardiac metabolism in animal models. Although small animal models, for example, rodents, could help to understand human cardiac pathophysiology, rodent and human hearts differ in many important aspects, such as anatomy, heart rate, oxygen consumption, and contractility. Hence, the use of large animal models, such as the pig, could be preferable as pigs and humans have similar cardiac size, physiology, and coronary anatomy. Large animal models could be imaged on UHF MR scanners, with an expected increase in the SNR. Unfortunately, the use of UHF scanners requires several problems to be addressed, such as magnetic field inhomogeneity, off-resonance artifacts, dielectric effects, RF nonuniformities, and synchronization of data acquisition with the cardiac cycle using a conventional ECG [
73]. Moreover, the use of large-bore UHF scanners is limited to a few centers due to high installation and maintenance costs. Hence, experiments on large animal models are usually performed on high field MR clinical systems (1.5–3.0 Tesla). The development of dedicated RF coils represents a key issue for a successful experimental setting in MR clinical systems. In fact, the development of
13C-specific RF coils is challenging due to the lower resonance frequency of the
13C nuclei and the integration with existing 1H coils. Small differences in coil losses could even have an impact on SNR, as the coil operates at a frequency where electronic noise cannot be neglected. The tradeoff between achieved SNR and signal homogeneity is the key issue in RF coil design. In most hyperpolarized
13C heart studies, the anatomical region of interest corresponds to the left ventricle wall, as most of the heart pathologies are related to regional dysfunctions of the LV myocardium. For instance, coronary stenosis or occlusion leads to a perfusion defect in some LV wall segments, depending on the affected coronary vessel [
74].
Hence, cardiac imaging techniques should provide a uniform sensitivity in the whole LV wall. In addition, the sensitivity of
13C imaging should be high enough to detect the signal related to derivate metabolites, which in certain cases could be low due to the reduced flux of conversion [
75]. The design of the RF coil configuration to be used in cardiac
13C experiments should take into account both of these aspects.
As shown in
Figure 6, birdcage coils assure a uniform SNR value among the FOV, while surface coils provide a higher SNR value near the coil with a rapid decrease in the distance. MRS experiments on pig heart confirmed the signal gain obtained by surface coils (
Figure 7). Hybrid coils, composed of a birdcage transmit coil, are able to achieve an efficient excitation in a large volume, and a planar receive coil, characterized by high local sensitivity, could represent an effective compromise between signal homogeneity and high SNR (
Figure 8). The SNR value could be further enhanced by appropriate surface coil design (
Figure 10). The use of phased array coils (
Figure 11) built by combining several elements further increases the SNR value attempting to preserve signal homogeneity (
Figure 12). The flexible design of the coil allowed detection of the signal in the whole myocardium. However, the signal intensity was significantly different among LV segments, and therefore measuring segmental signal variations could be challenging as variations induced by coil geometry may mask “true” variations induced by physiological changes.
Finally, an appropriate coil design (
Figure 13) could enable performing experiments on small animals on high field MR clinical scanner (
Figure 14). Although a clinical scanner cannot match the performance of a small animal MRI scanner, small animal imaging could be useful during the setup of the experimental protocols limiting the use of large animal models.
6. Conclusions
Cardiac function noninvasive assessments can be achieved by tissue metabolic state studies with MRS. In particular, hyperpolarized 13C-labeled pyruvate has been utilized to monitor the metabolism of biomolecules for normal and dysfunctional myocardium. However, the weak nuclear polarization and the low natural abundance can reduce the MR experiment sensitivity, producing low signal in MRS, and although hyperpolarization methods have been proposed for enhancing the polarization of nuclear spins such as 13C, the design and development of dedicated RF coils is a fundamental task. Such transmit and receive coils, operating at the 13C frequency (32.13 MHz at 3T), have to provide the desired FOV and an optimal SNR.
The correct design and realization of RF coils represent a key issue in the effective setting of 13C experiments on a high-field clinical scanner. Depending on the physiological question to be answered, the coil used should implement the correct tradeoff between SNR gain and signal uniformity over the area of interest.
Starting from the RF coil theoretical principles, in this paper, we described coil performance parameters and their estimation methods in the coil development for various phases (simulations, workbench tests, and MR experiments).
Thereafter, we summarized the experience of our cardiovascular laboratory in the simulation, design, and testing of different coil arrangements (circular, butterfly, birdcage, and receive arrays) for hyperpolarized 13C studies of pig and mouse heart with a clinical 3T scanner.
In particular, such different 13C coil configurations were initially simulated for developing an SNR model geometrical distribution by computing the coil resistance, the sample-induced resistance, and the magnetic field pattern for each coil. While coil resistance was calculated from Ohm’s law, sample induced resistances were estimated using a FDTD algorithm and magnetic field with magnetostatic theory and FDTD.
The main objective of the paper was to present a significant example of the work carried out at an electromagnetic laboratory in the field of RF coil design, building, and testing.
Table 3 reports the technical details of materials, equipment, and tools employed in our laboratory focused on cardiovascular research. This aspect may represent a limitation, as a single MR 3T scanner was used and other anatomical districts were not investigated. However, the RF coils, presented in this paper, effectively cover the range of the main coil types employed in the cardiac
13C research field.


 ,
, 


