Article

Vocal Melody Extraction via HRNet-Based Singing Voice Separation and Encoder-Decoder-Based F0 Estimation

1
School of Computer Science and Technology, Fudan University, Shanghai 201203, China
2
Ping An Technology (Shenzhen) Co., Ltd., Shenzhen 201021, China
3
Shanghai Key Laboratory of Intelligent Information Processing, Fudan University, Shanghai 200433, China
*
Author to whom correspondence should be addressed.
Electronics 2021, 10(3), 298; https://doi.org/10.3390/electronics10030298
Submission received: 15 December 2020 / Revised: 20 January 2021 / Accepted: 21 January 2021 / Published: 26 January 2021
(This article belongs to the Special Issue Machine Learning Applied to Music/Audio Signal Processing)

Abstract

:
Vocal melody extraction is an important and challenging task in music information retrieval. One main difficulty is that, most of the time, various instruments and singing voices are mixed according to harmonic structure, making it hard to identify the fundamental frequency (F0) of a singing voice. Therefore, reducing the interference of accompaniment is beneficial to pitch estimation of the singing voice. In this paper, we first adopted a high-resolution network (HRNet) to separate vocals from polyphonic music, then designed an encoder-decoder network to estimate the vocal F0 values. Experiment results demonstrate that the effectiveness of the HRNet-based singing voice separation method in reducing the interference of accompaniment on the extraction of vocal melody, and the proposed vocal melody extraction (VME) system outperforms other state-of-the-art algorithms in most cases.

1. Introduction

Melody extraction is a process of automatically estimating the F0 values that represent the pitch of the leading voice or instrument in a polyphonic music piece. This is an important task in music information retrieval (MIR), with many potential applications such as query by humming, cover song identification, and music transcription [1]. However, this task is very challenging because of two main factors: first, it is common in polyphonic music that multiple instruments and singing voices are played together and thoroughly mixed up according to the harmonic structure, making it very difficult to separate and recognize F0 values for an individual instrument. Second, even though F0 values can be correctly identified, to determine whether they belong to the leading melody still needs arduous efforts.
Existing melody extraction algorithms can be roughly divided into three frameworks, i.e., pitch-salience based [2], source separation based [3,4] and data-driven based methods [5,6,7]. Source separation based methods have more potential to overcome the above difficulties and substantially foster the advances of melody extraction.
Source separation based vocal melody extraction (VME) methods benefit from the quality of the separated vocal signal [8]. As is known, the task of singing voice separation (SVS) is still a challenging task in MIR. Improving its performance will be beneficial for VME. In recent years, following the idea of regarding the spectrogram of an audio signal as an image, some end-to-end deep neural networks originally designed for computer vision have been successfully introduced into singing voice separation. Two examples are the UNet architecture [9] designed for medical imaging and the stacked hourglass network (SHNet) [10] developed for human pose estimation. Both of them achieved promising results on the SVS task [11,12].
In fact, position information is important for the SVS, since the time-frequency position of each pixel in the output spectrogram corresponds to its position in the input spectrogram. Powerful high-resolution representation are helpful for such position-sensitive tasks, including human pose estimation task and semantic segmentation task in computer vision [13]. A high-resolution network (HRNet) was designed for human pose estimation in natural images in [14]. It maintains high-resolution representation throughout the whole process, while previous methods all recovered high resolution from low or medium resolution, such as UNet and SHNet. The output of the HRNet is spatially more precise. Therefore, this motivated us to adopt the HRNet for the SVS, taking a spectrogram of a mixture signal as the input and outputting a soft mask of the vocal signal.
After obtaining the separated vocal signal, we built an encoder-decoder network comprising of encoder-decoder layers and a fully connected (FC) layer to learn the mapping between the vocal spectrogram and its corresponding F0 values. Recently, encoder-decoder architecture has demonstrated its powerful performance for VME. Lu et al. [15] adopted an encoder-decoder network with dilated convolutions and Hsieh et al. [6] constructed an encoder-decoder network with pooling indices. Simulating the process of semantic segmentation, they took the combined frequency and periodicity representation as inputs and outputted a two-dimensional salience image where frequency bins with maximum values per frame were selected. Unlike them, we designed the encoder-decoder layers to learn the essential features that characterize vocal F0 values from the input spectrograms. Then the FC layer taking the learned features as input to classify each frame to the category it belongs to.
In summary, the contributions of this paper are as follows: first, we adopted an HRNet for the SVS to reduce the interference of accompaniment. Second, we designed an encoder-decoder network taking the separated vocals to estimate vocal F0 values. Finally, by comparing the evaluation results on three public test datasets, we show that the proposed two-stage vocal melody extraction system outperforms four state-of-the-art systems in most cases.

2. Related Work

2.1. High-Resolution Representation Learning

In image vision tasks, there are two kinds of representation. One is low-resolution representation mainly for image classification, the other is high-resolution representation for position-sensitive tasks, such as semantic segmentation and object detection, etc. [16].
As for the high-resolution representation, there are two strategies: high-resolution recovering and high-resolution maintaining [16]. The former generally reduces the resolution of representation firstly and then gradually recovers the resolution of representation. The latter connects the multi-resolution branches in parallel and fuses the multi-resolution representation, which can maintain high-resolution representation throughout the whole process. The architectures of U-Net and SH-Net, which both capture high-resolution representation via the first strategy, have been introduced for the SVS task and achieved impressive performance [11,12]. Figure 1 gives two examples illustrating two representation respectively.

2.2. Singing Voice Separation

With the development of deep learning, several deep neural networks have been used for the SVS task. Compared with conventional matrix factorization based methods [17], these deep learning methods have significantly improved the performance in terms of both objective evaluation metrics and subjective auditory tests. Chandna et al. [18] proposed an encoder-decoder framework for audio source separation. Next, the deep neural networks designed for computer vision, e.g., U-Net and SH-Net, were introduced to the SVS task and achieved impressive performance [11,12]. The U-Net architecture added skip connections between the convolutional layers with the same resolution in the encoder layers and decoder layers, which was able to improve the precision of the location of feature maps in the decoder layers. The SH-Net stacked multiple hourglass modules and consolidated information across all scales of the input, which was able to capture the various spatial relationships associated with the target. Next, the Stoller et al. [19] proposed the Wave-U-Net model which took the original waveform as the input and separated it into isolated source waveforms simultaneously. Besides, a recurrent neural network architecture with bidirectional long short-term memory (biLSTM) layers has also been established, which can take into account the context information [20]. Most recently, SPLEETER [21] as a SVS tool was released, which used a large-scale dataset to train the U-Net architecture proposed in [11] and achieved state-of-the-art performance.

2.3. Source Separation-Based Vocal Melody Extraction

Durrieu et al. [3] represented the leading vocals by using a specific source/filter model, and the accompaniment by using the sum of an arbitrary number of sources with distinct spectral shapes. Then a maximum likelihood framework was adopted to estimate the model parameters and obtain the F0 sequence. Tachibana et al. [4] enhanced the melodic components by successively using Harmonic/Percussive Sound Separation (HPSS) twice. The basic idea of HPSS is that melodic components exhibit temporal variability/stability compared with sustained chord notes/percussive components. Fan et al. [8] first used a deep neural network (DNN) to separate the vocal components and accompaniment components, then applied an adaptive dynamic programming method to extract the vocal values.
Most recently, Nakano et al. [22] and Jansson et al. [23] almost at the same time proposed to train the SVS task and the VME task jointly. Both methods obtained promising results. In [22], a joint U-Net model stacking SVS and VME was proposed. However, limited by the size of datasets containing both pure vocal tracks and their corresponding F0 annotations, the authors used a large internal dataset where reference F0 values were annotated by the VME method Deep Salience [5]. According to the performance of Deep Salience reported in [22], the F0 values estimated by Deep Salience still contain errors, which limits the performance of this method to a certain extent. In [23], the authors designed a differentiable layer that converts an F0 saliency spectrogram into harmonic masks indicating the locations of harmonic partials of a singing voice. However, this system is not robust to the backing vocals, since in the SVS task the backing vocals belong to vocals but in the VME task, the pitches of backing vocals do not belong to the vocal melody.
To avoid the limitations above, we propose a two-stage vocal melody extraction method. The first stage used an HRNet for the SVS and the second stage built an encoder-decoder network for VME. In this way, each task can be trained using their datasets with precise annotations, and the training process is not affected by backing vocals.

3. Method

3.1. The Architecture of the Used HRNet

The architecture of the used HRNet is illustrated in 
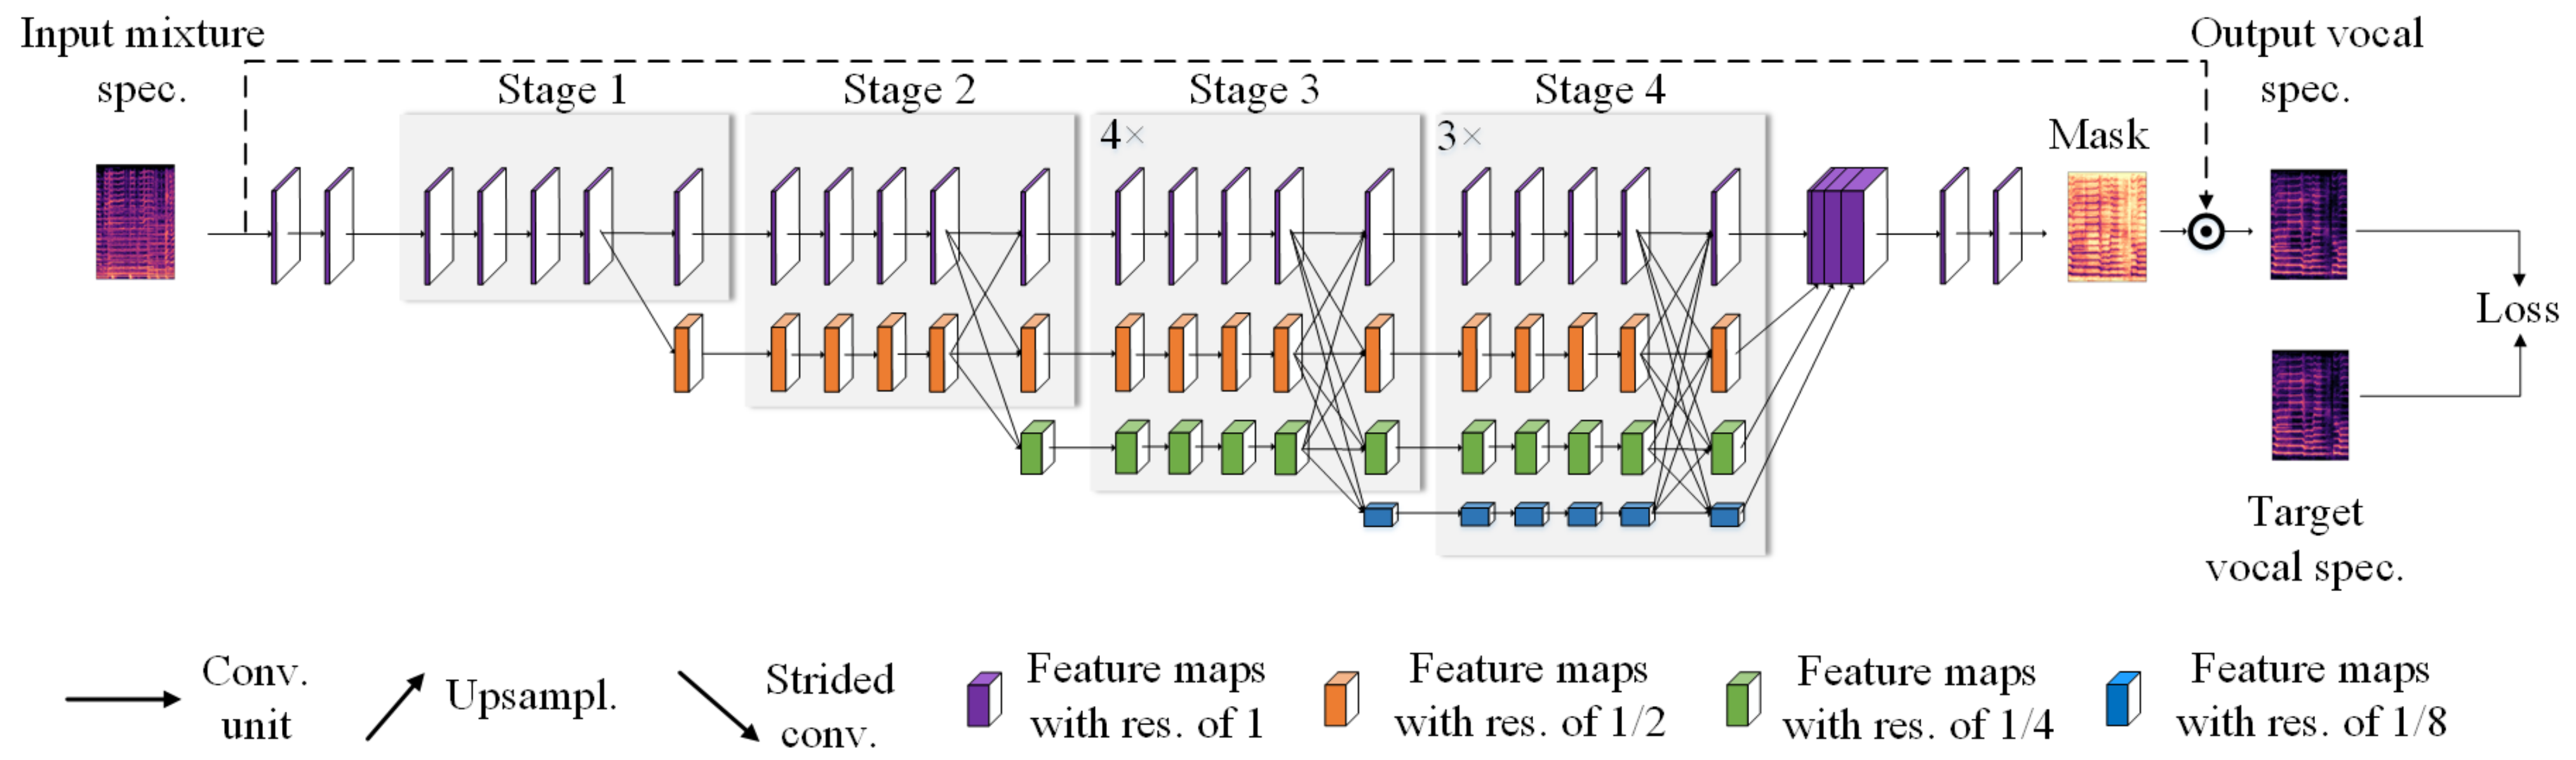
Figure 2. It takes a magnitude spectrogram as the input and feeds the input into two 3 × 3 convolutional layers with a stride of 1. Unlike [14], we do not decrease the resolution here, for we want to preserve the high resolution of the input throughout the whole process.
Subsequently, four stages constitute the main body. In the first stage, there are 4 residual units, each of which, the same as the ResNet-50 [24], is established by a bottleneck with a width (the number of channels) of 16. A 3 × 3 convolutional layer with a stride of 1 follows to transfer high-resolution representation into the second stage. The second, third, and fourth stages contain 1, 4, and 3 modules described below, respectively. 
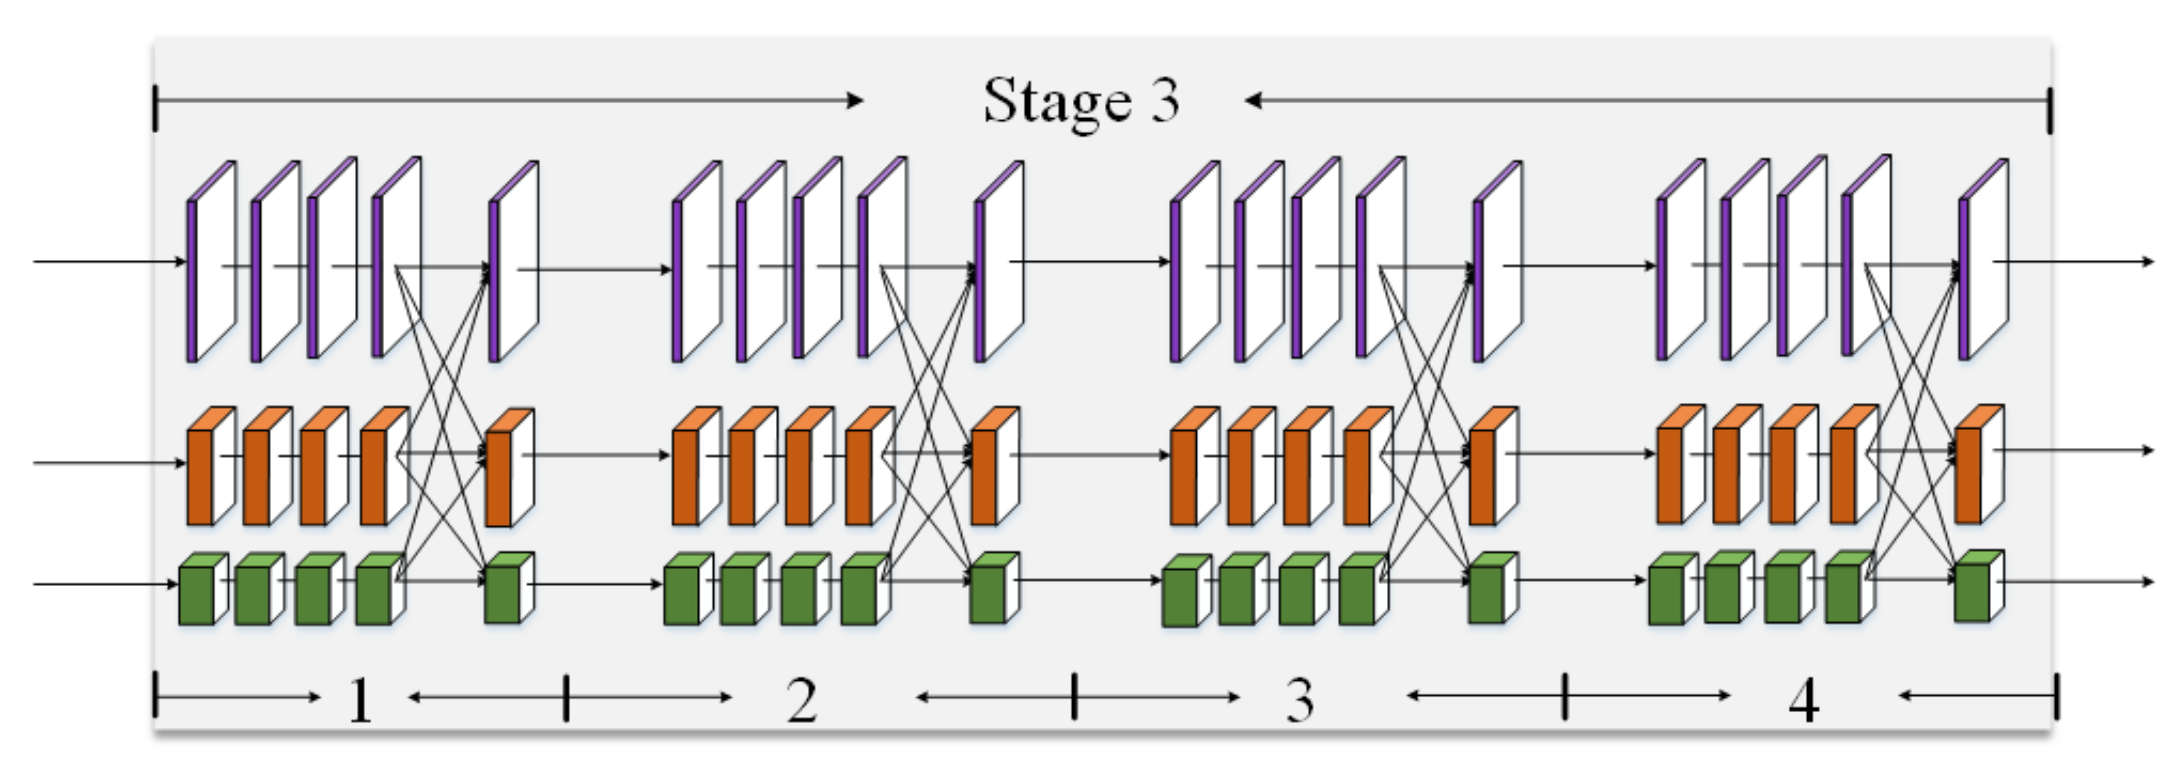
Figure 3 provides the third stage where 4 modules are stacked in series.
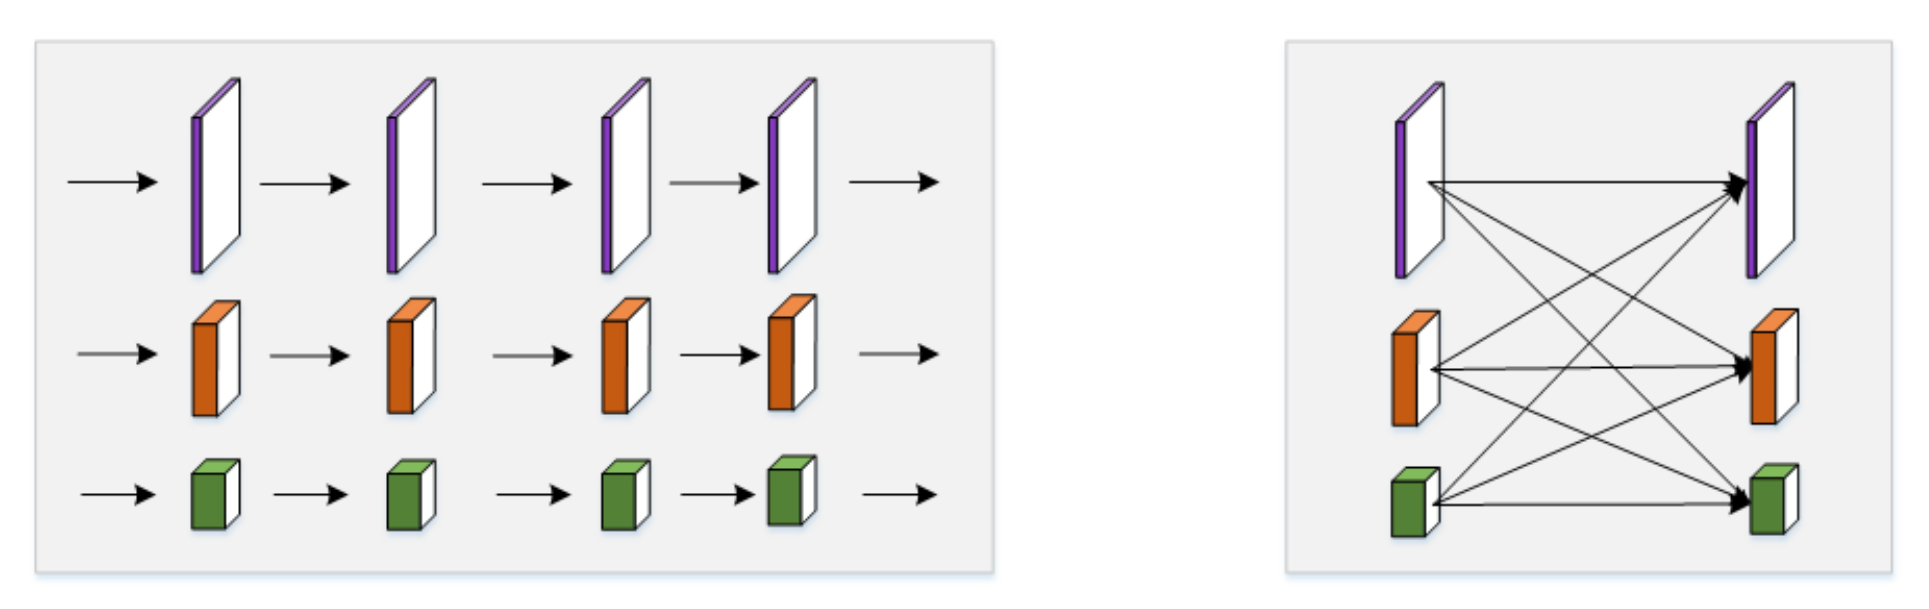
In each module, there are two parts: parallel multi-resolution convolutions (as shown in Figure 4-left) and multi-resolution fusion (as shown in 
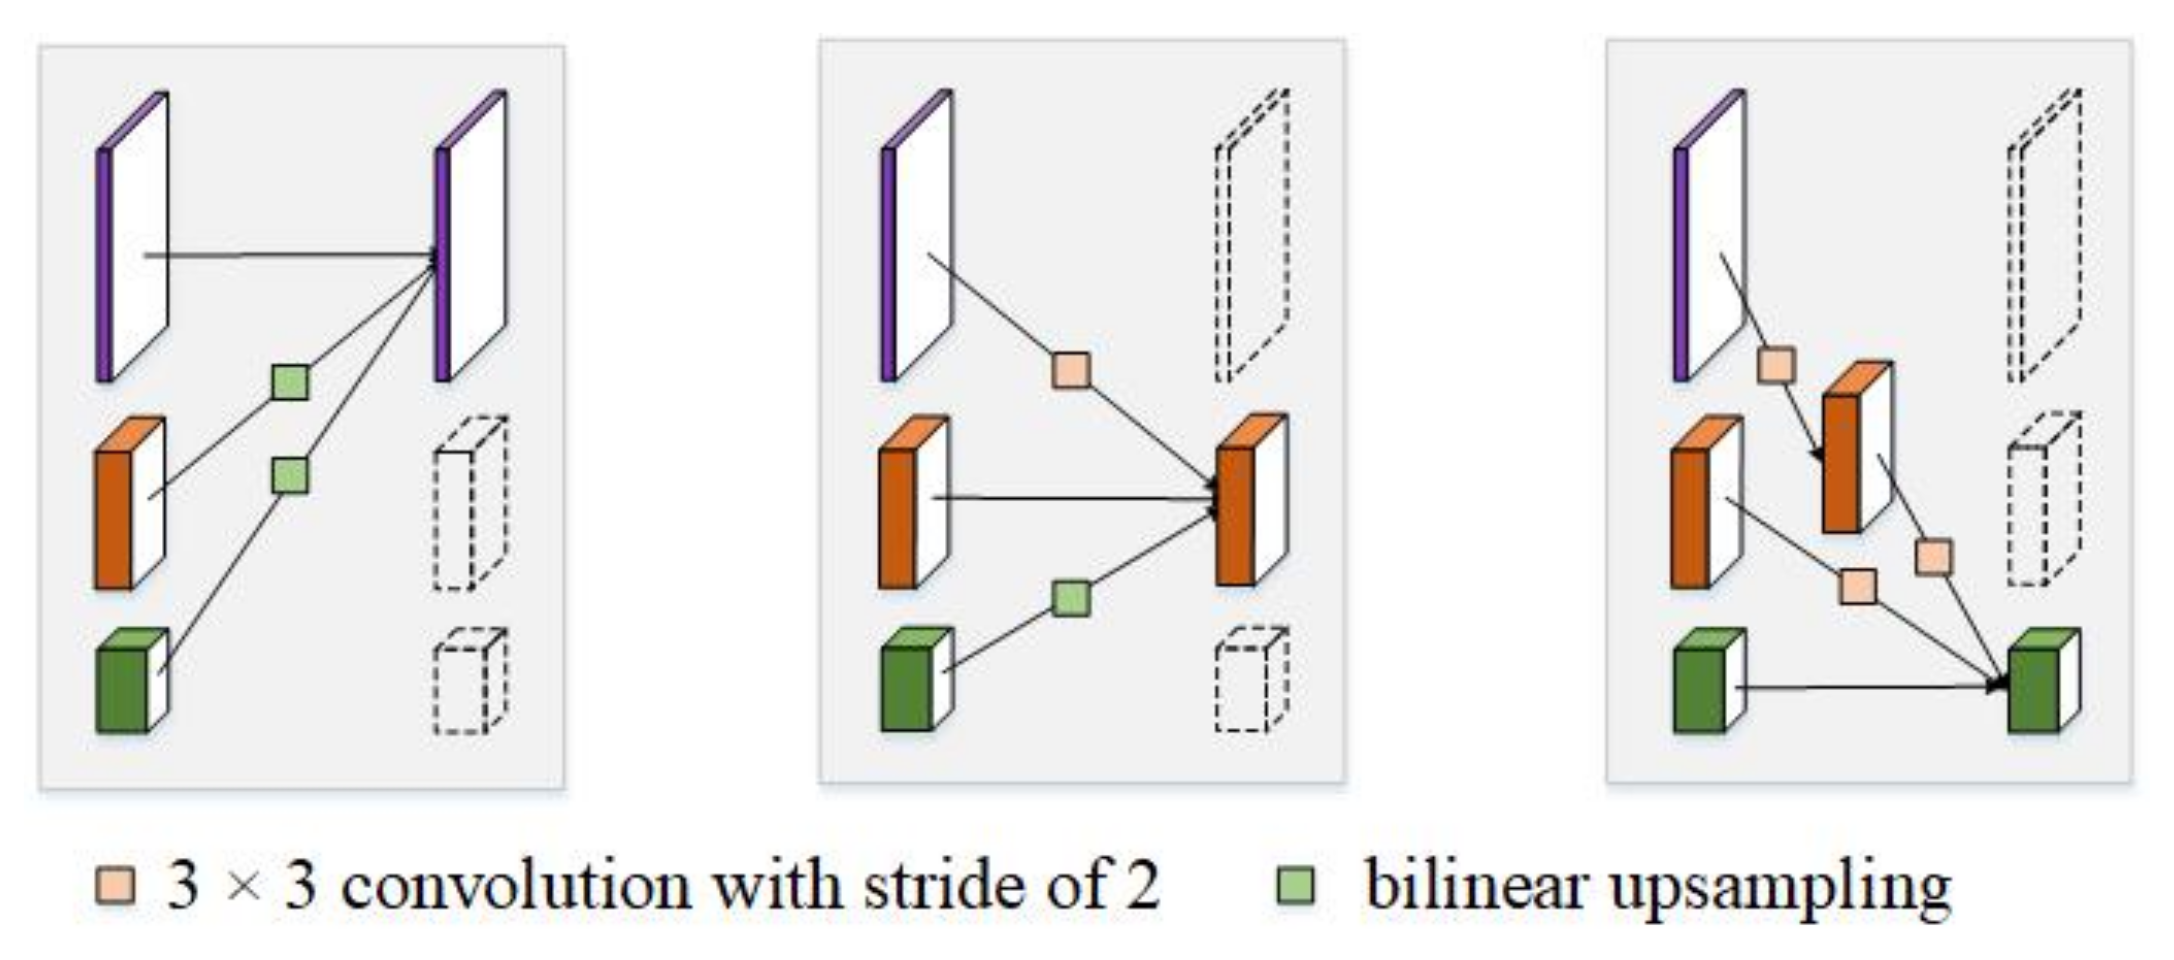
Figure 4-right). In the first part, the branches with different resolutions are connected in parallel. In each branch, there are 4 basic blocks. Each basic block comprises of two 3 × 3 convolutional layers, a batch normalization (BN) layer, and rectified linear units (ReLU). In the second part of each module, the branches with different resolutions are fused to exchange information. Specifically, the low-to-high process which increases the resolution is done by simply using bilinear upsampling, and the high-to-low process which decreases the resolution is done by using several strided convolutions (3 × 3 convolutional layers with a stride of 2). The number of strided convolutions required is determined by the resolution of the input feature maps and that of the target feature maps. If the resolution decreases from a to b (a > b|a, b∈ [1, 1/2, 1/4, 1/8]), N ( N = l o g 2 ( a / b ) ) strided convolutions are required. Finally, the target feature maps of each branch are calculated by summation of the results of the up/downsampling process. 
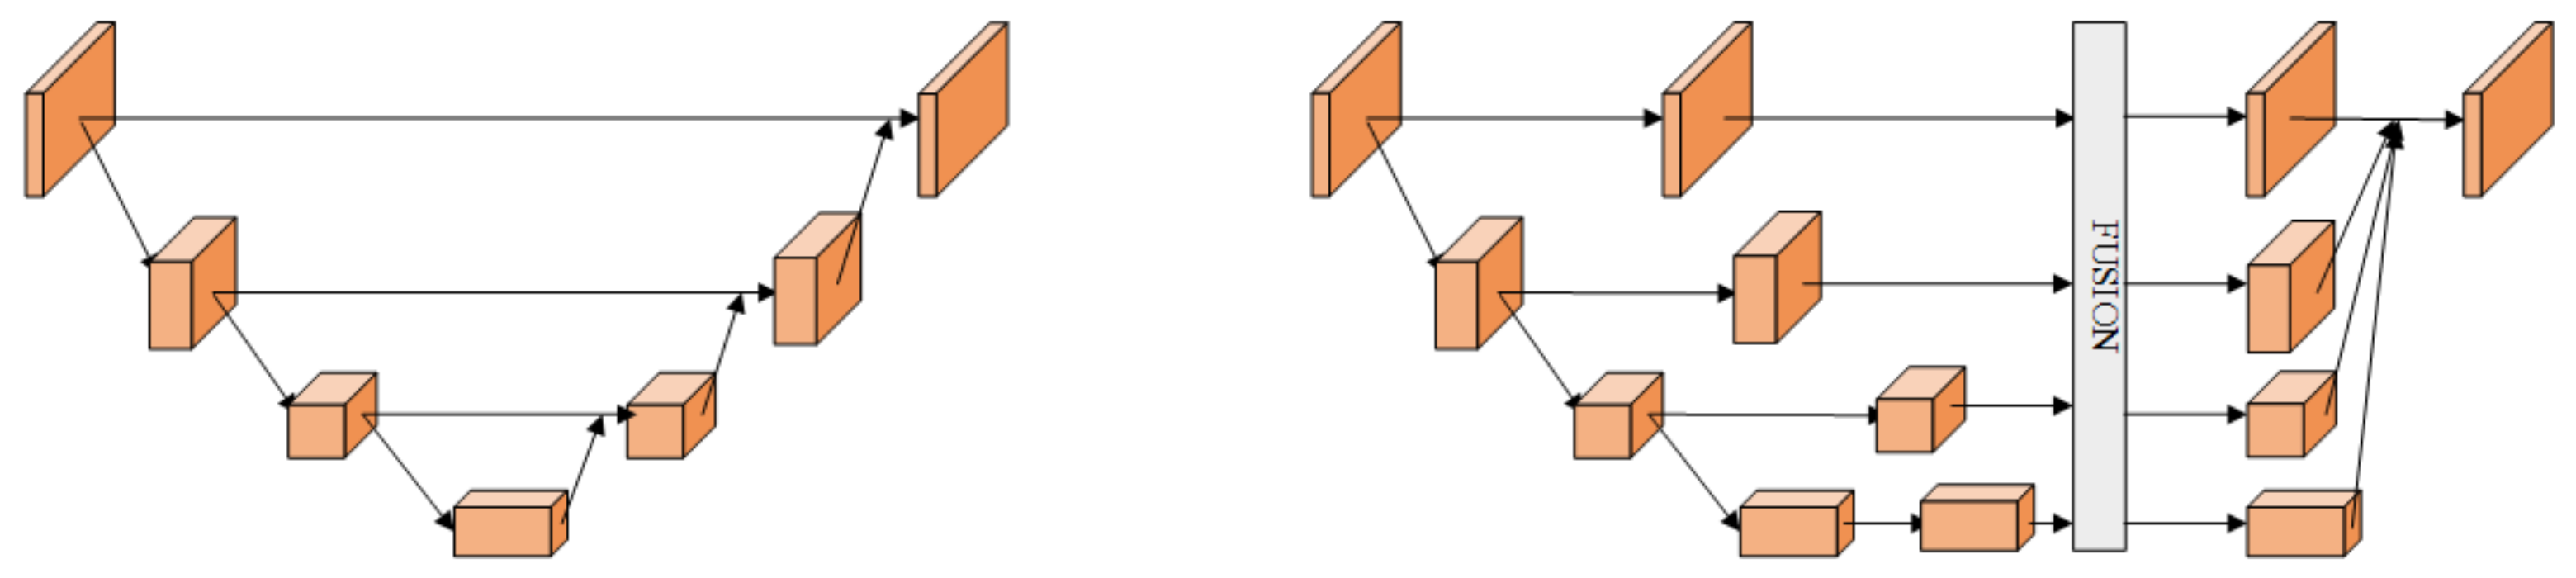
Figure 5 illustrates the details of low-to-high process and high-to-low process in multi-resolution fusion.
Moreover, at the end of each stage, except the fourth stage, a 3 × 3 convolutional layer with a stride of 2 is used to decrease the resolution to start a new branch. On the whole, from top to bottom, the resolution of four branches is decreased by half (1, 1/2, 1/4, and 1/8) each time and the number of channels is accordingly doubled (16, 32, 64, and 128).
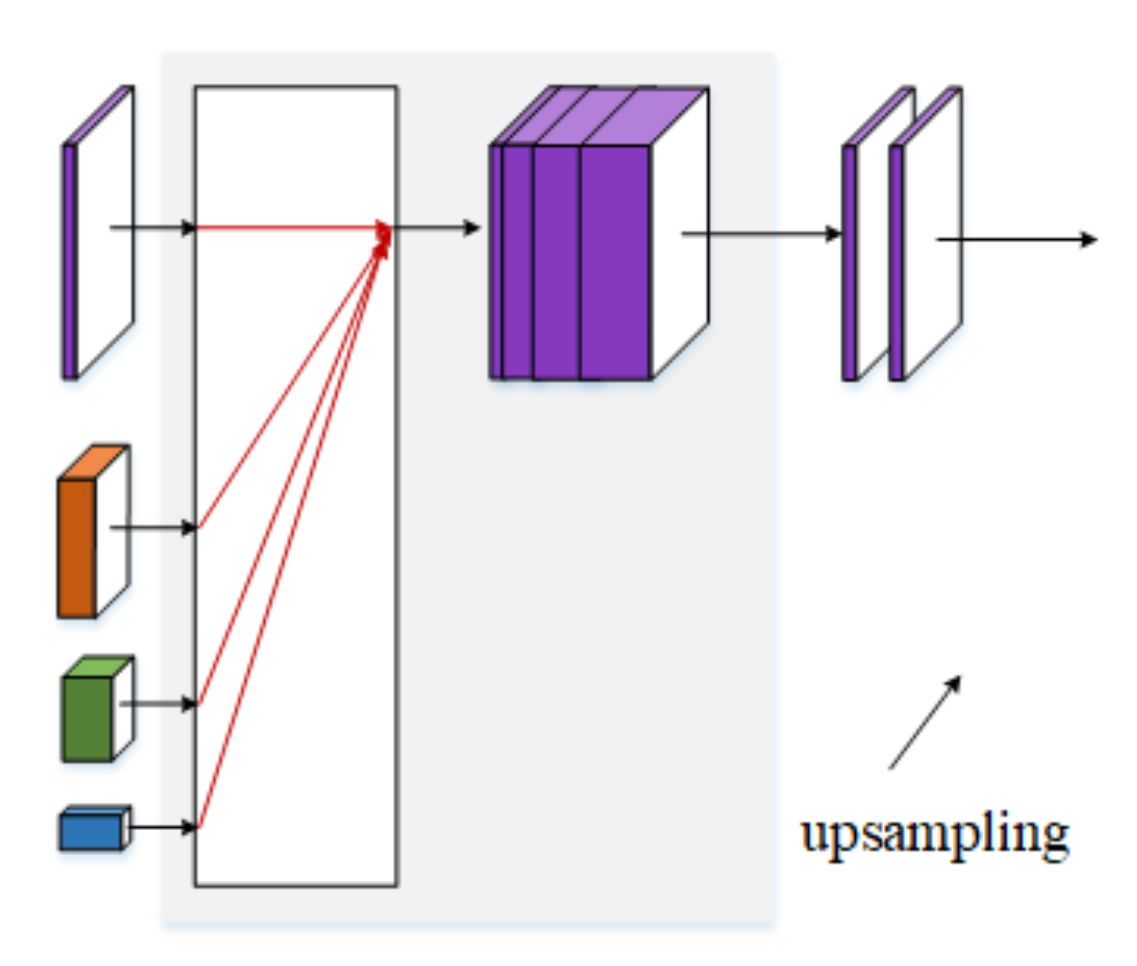
After four stages, four feature maps with a resolution of 1, 1/2, 1/4, and 1/8 are generated, respectively. To obtain the soft mask for the target signal, the feature maps with the resolution of 1/2, 1/4, and 1/8 are rescaled to the feature maps with a resolution of 1 by using bilinear upsampling without changing the number of their channels, as shown in Figure 6. Finally, we concatenate these four high-resolution feature maps and use two 1 × 1 convolutional layers with a stride of 1 to produce the target mask.

3.2. Training Details of SVS

The input of the HRNet were magnitude spectrograms calculated from mixture audio by Short-Time Fourier Transform (STFT) with a window size of 1024 and a hop size of 512. The mixture audio was downsampled into 16 kHz to speed up processing. For training the network with mini-batches, the input spectrograms were divided into fixed-length segments of 64 frames, nearly 2 s long.
The HRNet was supervised by the magnitude spectrograms of vocals corresponding to the input mixture audio. It outputted the soft masks for the vocals. Then we multiplied the output soft masks with the input mixture spectrograms to obtain the estimated vocal spectrograms.
Following [11], the loss function was calculated by the L 1 norm of the difference between the estimated vocal spectrogram and the target vocal spectrogram, defined as
L X , Y = f X X Y 1 ,
where X indicates the input mixture spectrogram, f ( X ) represents the output mask from the HRNet taking the X as the input, Y means the target vocal spectrogram, and ⊙ is element-wise multiplication of two matrices. The L 1 norm of a matrix is calculated by the sum of the absolute values of all elements.
The ADAM optimizer was used to minimize the loss function. The learning rate was set to 0.0001 and batch size 5. During inference, given a mixture audio signal, we first used the trained HRNet to obtain the estimated vocal spectrograms and then combined them with the phase of the corresponding input mixture to reconstruct the vocal signals.

3.3. Encoder-Decoder Network

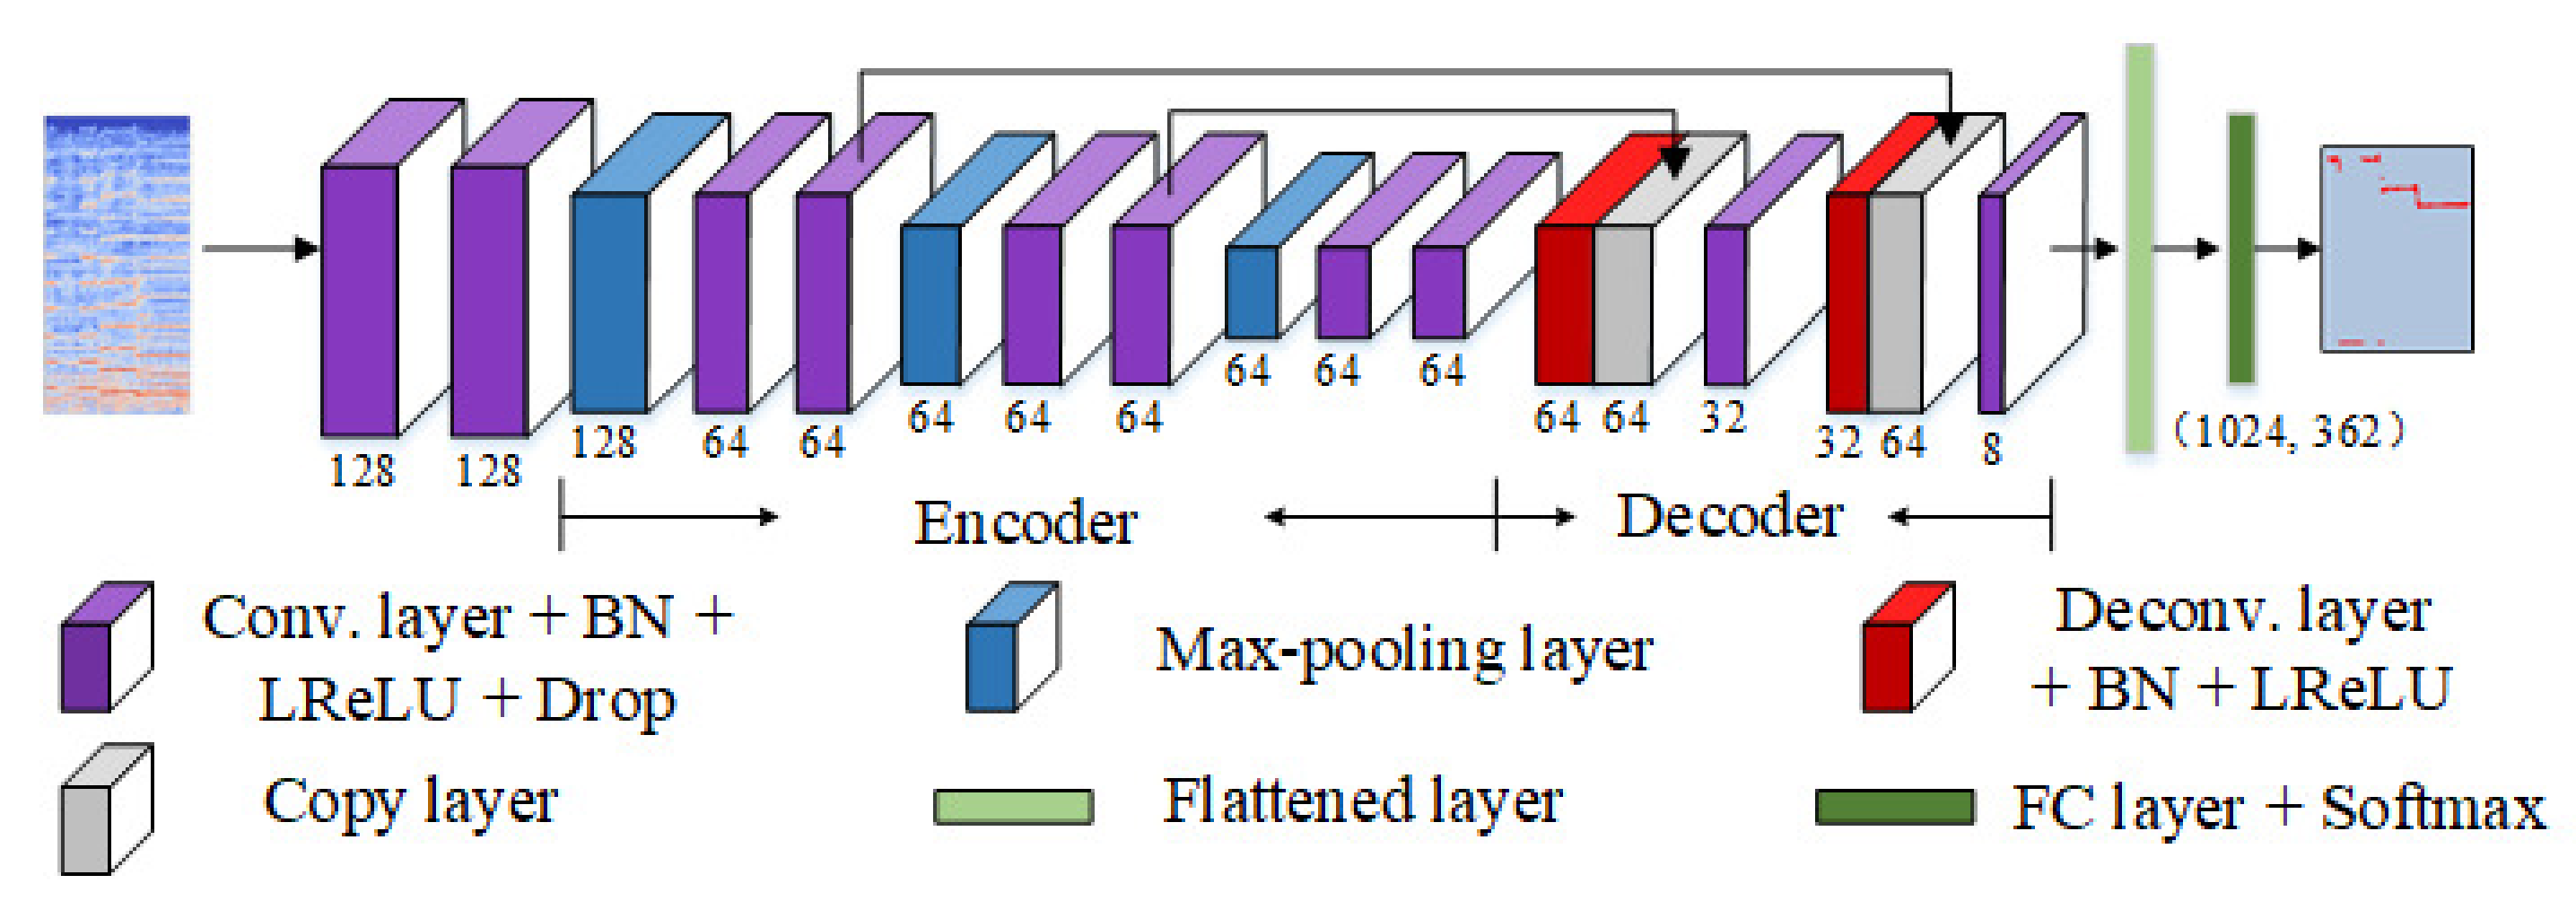
In this section, an encoder-decoder network is designed to estimate F0 values. As shown in Figure 7, it takes a magnitude spectrogram as the input and begins with two 3 × 3 convolutional layers with a stride of 1 and a width of 128.
Three encoder blocks are then built. Each one contains a max-pooling layer with a stride of 4, a 7 × 7 convolutional layer with a stride of 1 and a width of 64, and a 5 × 5 convolutional layer with a stride of 1 and a width of 64 in order. The max-pooling layer in each block is only conducted on the frequency axis, hence all feature maps preserve the input size on the time axis. Also, each convolutional layer is followed by a BN layer, leaky ReLU with leakiness 0.01, and a dropout layer with 50%.
Next, two decoder blocks are constructed. Each one consists of a 7 × 7 deconvolutional layer with a stride of 4 without changing channel number, and a 5 × 5 convolutional layer with a stride of 1. We also add skip connections at the convolutional layers with the same resolution in the encoder and decoder to strengthen the representation of decoder blocks. Each convolutional/deconvolutional layer is followed by a BN layer and leaky ReLU with leakiness 0.01.
The feature maps outputted from the last decoder block are then flattened on the frequency axis. At this point, each frame is represented by a 1024-dimensional feature vector. Finally, these feature vectors are fed into the FC layer with a softmax function to estimate F0 values frame by frame.

3.4. Training Details of VME

The input of the encoder-decoder network was the magnitude spectrogram of an audio signal calculated by STFT with a window size of 1024 and a hop size of 80. The sampling rate was set to 8 kHz and the input spectrograms were divided into fixed-length segments of 20 frames, nearly 0.2 s long. Following [7], the pitch frequency range we considered in this paper was from 73.41 Hz (MIDI Number 38) to 987.77 Hz (MIDI Number 83) with a resolution of 1/8 semitone, hence the total pitch class number was 362, including an unvoiced class.
The ADAM optimizer was used to minimize the loss function calculated from cross entropy. The initial learning rate was set to 0.0015 and batch size 16. After each epoch of training, the learning rate was reset to 98% of its previous one.
During inference, given an audio signal, the trained encoder-decoder network outputted the posterior distribution of each class against a total of 362 classes frame by frame. The frequency bin with the maximum value per frame was selected and directly converted into frequency as follows:
f = 2 ( b i n 1 ) / 96 * 73.41 b i n [ 1 , 361 ] 0 b i n = 0
where bin means the selected frequency bin with maximal activation of each frame.

4. Experiments

In this section, we first describe the used datasets and evaluation metrics, then analyze the experiment results.

4.1. Datasets

The following datasets were used for our experiments,
(1) MUSDB18 [25]: 150 full-length music tracks (about 10 h) of different genres, along with their isolated drums, bass, vocals, and other stems. It is composed of a training subset (100 songs) and a test subset (50 songs). To train the HRNet for the SVS, we constructed a dataset of 400 songs (around 29 h) by randomly mixing the vocals and accompaniment in the MUSDB18 training subset.
(2) iKala [26]: 252 Chinese clips of 30 s performed by six professional singers. Among them, 225 songs were used to train the encoder-decoder network for VME and 27 songs were used for validation.
(3) RWC Popular Music [27]: 80 Japanese popular songs and 20 American popular songs with vocal F0 annotations. Among them, 85 songs were used to train the encoder-decoder network for VME and 15 songs were used for validation.
(4) MedleyDB [28]: 122 songs of a variety of musical genres with F0 annotations. In our experiments, 59 songs dominated by vocals were used for VME. We divided them into two parts, 49 songs for training and 10 songs for validation.
(5) ADC2004 (https://labrosa.ee.columbia.edu/projects/melody/): 20 clips of 20 s that contain pop, jazz, and opera songs. The 12 songs dominated by vocals were used for evaluation.
(6) MIREX05 (https://labrosa.ee.columbia.edu/projects/melody/): 13 excerpts of around 30 s with F0 annotations. The 9 songs dominated by vocals were used for evaluation.
(7) MIR1k [29]: 1000 Chinese songs clips of about 10 s with vocal F0 annotations. All of the clips were used for evaluation.

4.2. Evaluation Metrics

By convention, five metrics were calculated by using the mir_eval toolbox [30], i.e., voicing recall rate (VR), voicing false alarm rate (VFA), raw pitch accuracy (RPA), raw chroma accuracy (RCA), and overall accuracy (OA). These metrics are calculated as below:
VR = v o i c e d f r a m e s w h e r e v o i c i n g a r e e s t i m a t e d c o r r e c t l y v o i c e d f r a m e s ,
VFA = u n v o i c e d f r a m e s w h e r e u n v o i c i n g a r e e s t i m a t e d m i s t a k e n l y u n v o i c e d f r a m e s ,
RPA = v o i c e d f r a m e s w h e r e p i t c h e s a r e e s t i m a t e d c o r r e c t l y v o i c e d f r a m e s ,
RCA = v o i c e d f r a m e s w h e r e c h r o m a s a r e e s t i m a t e d c o r r e c t l y v o i c e d f r a m e s ,
OA = f r a m e s w h e r e p i t c h e s a n d v o i c i n g a r e e s t i m a t e d c o r r e c t l y t o t a l f r a m e s
The OA is generally thought to be more important [6]. In the experiments, we considered an estimated pitch value to be correct when it falls within 50 cents around the ground truth.

4.3. The Effect of the HRNet-Based SVS on the VME Task

The first experiment we conducted was to assess the effectiveness of the HRNet-based SVS on VME. For comparison, three state-of-the-art SVS methods, i.e., SHNet [12], UNet [11], and WaveUnet [19] were also evaluated. We used the online source codes and the trained models of WaveUNet and SHNet. As for UNet, since there is no publicly available source code online, we reimplemented their architecture and trained it on the training dataset we used.
The above SVS methods were followed by our proposed encoder-decoder network, forming four melody extraction systems respectively named as HR-ED, SH-ED, U-ED, and WaveU-ED. Comparison results are listed in Table 1, Table 2 and Table 3. Each value in the tables is represented in the form of a ± b , where a is the mean of the metric over each test dataset, and b is the standard deviation. As can be seen, the method HR-ED outperformed other methods on most metrics for each test dataset. It indicates that HRNet-based SVS can more effectively reduce the interference of accompaniment for the extraction of the vocal melody.
Specifically, compared with the best results of existing methods on ADC2004 (see Table 1), our method achieved a gain of 0.4% at VR, −1.8% at VFA, 0.7% at RPA, and 0.1% at RCA, and 2.0% at OA, respectively. Except the VFA, where the HR-ED was inferior to the SH-ED, the HR-ED performed best. Comparisons on the MIREX05 (see Table 2) show that the HR-ED achieved a gain of 0.6% at VR, −0.5% at VFA, 0.7% at RPA, 0.6% at RCA, and 1.2% at OA. It also performed best with only one exception that for the VFA, it was slightly inferior to SH-ED (4.9% vs. 4.4%). On the MIR1k dataset, our method achieved a gain of 5.3% at VR, −2.1% at VFA, 7.4% at RPA, 5.8% at RCA, and 8.4% at OA, respectively, as shown in Table 3 (Please note that the SHNet was not included in this evaluation, for it used the MIR1k as the training dataset.). It is obvious that the HR-ED significantly outperformed other methods in most cases, except the metric VFA. The reason why the VFA is lower may be that the vocals separated by the HRNet still retained relatively more instrument sounds. But the HRNet achieved the highest OA on each dataset, demonstrating that among these SVS methods, it achieved the highest vocal quality for the VME task.
Furthermore, we counted the distribution of each metric over each track in each test dataset, as shown in Figure 8. It is observed that the median VR, RPA, RCA, and OA values of HR-ED are also higher than those of other SVS methods for each dataset. These results further verified the better performance of the HRNet on reducing the interference of accompaniment.

4.4. Comparison with the State-of-the-Art

The second experiment was to evaluate the performance of the proposed VME system. Two strategies of our method were evaluated: (1) EDNet, which directly took the original mixture audio as the input to predict F0 values; (2) HR-ED, which took the vocals separated by HRNet as the input to predict F0 values. For comparison, we also evaluated four other state-of-the-art melody extraction methods, i.e., DSM [5], SEG [15], SED [6], and JDC [7].
Table 4, Table 5 and Table 6 list the comparison results on three public datasets, respectively. As we can see from these tables, HR-ED achieved higher VFA, RCA, RPA, and OA than EDNet on each dataset. For EDNet, compared with the existing methods, it obtained the highest RPA values (86.9% on ADC2004, 83.5% on MIREX05, and 75.4% on MIR1k) and RCA values (87.0% on ADC2004, 84.0% on MIREX05, and 79.8% on MIR1k). These results demonstrate the EDNet is powerful in predicting F0 values from a frame containing melody. We can also observe that it was defeated at VFA by other state-of-the-art systems on each dataset (26.2% on ADC2004, 19.8% on MIREX05, and 29.8% on MIR1k). These results demonstrate the performance of the EDNet in discriminating vocal and non-vocal segments is relatively poor.
As expected, by combining the EDNet-based VME method with the HRNet-based SVS method, the HR-ED decreased the VFA from 26.2% to 9.4% on the ADC2004 dataset, from 19.8% to 4.9% on the MIREX05 dataset, and from 29.8% to 7.2% on the MIR1k dataset. Meanwhile, its RPA, RCA, and OA values on each dataset were also significantly improved and outperformed the state-of-the-art algorithms.
Also, we counted the distribution of each metric over each track in each test dataset, as shown in Figure 9. It can be seen that the median RPA, RCA, OA on each dataset are higher than the other four state-of-the-art systems, which verified again the positive effects of the HRNet-based SVS method on reducing interference of accompaniment and the powerful performance of the proposed two-stage method for the extraction of vocal melody.

4.5. Case Study of the Proposed VME System

To get a more intuitive impression, two cases using the proposed two-stage VME method are provided in Figure 10 (a good example, “pop4.wav” from ADC2004 dataset) and Figure 11 (a bad example, “amy_1_05.wav” from MIR1k dataset). In each figure, (a) shows the magnitude spectrogram of the mixture audio and (b) shows that of the separated vocals. The F0 values (in blue) estimated from (a) and (b), along with their corresponding ground truth (in red), are shown in (c) and (d). Meanwhile, we further provide their evaluation results in Table 7.
We can observe in Figure 10 that the accompaniment was significantly removed from the mixture and the harmonics of vocals were remained clear. According to Figure 10c,d, its benefits are obvious. Many false-negative melodic frames (in a frame there was no vocal melody but an F0 value was still estimated mistakenly) in Figure 10c, e.g., around 7.6 s∼8.3 s, were estimated correctly in Figure 10d. Many other error F0 values caused by interference by the accompaniment were also corrected. Thus, the OA achieved by taking the separated vocals as inputs increased by 7.4%, as shown in Table 7.
We acknowledge that there are several shortcomings in the proposed VME system. Figure 11 gives an example. According to the ground truth in Figure 11c, it is obvious that there is a human voice in the segment from 3 s to 3.4 s and its corresponding F0 sequence was estimated correctly from the spectrogram of mixture audio. However, the F0 sequence estimated from the separated vocals were missing, as shown in Figure 11d. By analyzing spectrograms and listening the audio, we observe that the reason is that this segment was mistakenly removed during the stage of singing voice separation. One possible solution is that after the stage of SVS, we add the separated vocals to their original mixture audio, enhancing the vocals instead of removing the accompaniment, and then estimate F0 values from the vocal-enhanced audio.

5. Conclusions

In this paper, we proposed a two-stage vocal melody extraction method, which first adopted an HRNet to separate vocals from mixture audio, then utilized an encoder-decoder network taking the separated vocals as inputs to predict the vocal F0 values. Experiment results showed that the HRNet-based singing voice separation method performed better than three other methods on separating vocals, resulting in the proposed two-stage vocal melody extraction system to be superior to other vocal melody extraction algorithms in most cases.
In the future, we are going to investigate the solution of vocal enhancement to further improve the performance of our system. Moreover, we will continue to investigate the complementary relationship between the SVS task and VME task. Considering the small size of the public datasets containing both pure vocal tracks and their corresponding F0 annotations, unsupervised training that relies on the mutual support of these two tasks will be attempted.

Author Contributions

Conceptualization: Y.G.; methodology: Y.G.; writing–original draft preparation: Y.G.; writing–review and editing: Y.G., W.L., and X.Z.; project administration: W.L.; funding acquisition: W.L.; All authors have read and agreed to the published version of the manuscript.

Funding

This research was funded by the National Key R&D Program of China (2019YFC1711800) and NSFC (61671156).

Conflicts of Interest

The authors declare no conflict of interest.

References

  1. Salamon, J.; Gómez, E.; Ellis, D.P.; Richard, G. Melody extraction from polyphonic music signals: Approaches, applications, and challenges. IEEE Signal Process. Mag. 2014, 31, 118–134. [Google Scholar] [CrossRef] [Green Version]
  2. Salamon, J.; Gómez, E. Melody Extraction from Polyphonic Music Signals Using Pitch Contour Characteristics. IEEE Trans. Audio Speech Lang. Process. 2012, 20, 1759–1770. [Google Scholar] [CrossRef] [Green Version]
  3. Durrieu, J.L.; Richard, G.; David, B.; Févotte, C. Source/filter Model for Unsupervised Main Melody Extraction from Polyphonic Audio Signals. IEEE Trans. Audio Speech Lang. Process. 2010, 18, 564–575. [Google Scholar] [CrossRef] [Green Version]
  4. Tachibana, H.; Ono, T.; Ono, N.; Sagayama, S. Melody Line Estimation in Homophonic Music Audio Signals Based on Temporal-variability of Melodic Source. In Proceedings of the IEEE International Conference on Acoustics, Speech and Signal Processing, Dallas, TX, USA, 14–19 March 2010; pp. 425–428. [Google Scholar]
  5. Bittner, R.M.; McFee, B.; Salamon, J.; Li, P.; Bello, J.P. Deep Salience Representations for F0 Estimation in Polyphonic Music. In Proceedings of the International Society for Musical Information Retrieval Conference, Suzhou, China, 23–27 October 2017; pp. 23–27. [Google Scholar]
  6. Hsieh, T.H.; Su, L.; Yang, Y.H. A Streamlined Encoder/Decoder Architecture for Melody Extraction. In Proceedings of the IEEE International Conference on Acoustics, Speech and Signal Processing, Brighton, UK, 12–17 May 2019; pp. 156–160. [Google Scholar]
  7. Kum, S.; Nam, J. Joint Detection and Classification of Singing Voice Melody Using Convolutional Recurrent Neural Networks. Appl. Sci. 2019, 9, 1324. [Google Scholar] [CrossRef] [Green Version]
  8. Fan, Z.; Jang, J.R.; Lu, C. Singing voice separation and pitch extraction from monaural polyphonic audio music via DNN and adaptive pitch tracking. In Proceedings of the IEEE 2nd International Conference on Multimedia Big Data, Taipei, Taiwan, 20–22 April 2016; pp. 178–185. [Google Scholar]
  9. Ronneberger, O.; Fischer, P.; Brox, T. U-Net: Convolutional networks for biomedical image segmentation. In Proceedings of the International Conference on Medical Image Computing and Computer-Assisted Intervention, Munich, Germany, 5–9 October 2015; pp. 234–241. [Google Scholar]
  10. Newell, A.; Yang, K.; Deng, J. Stacked hourglass networks for human pose estimation. In Proceedings of the European Conference on Computer Vision (ECCV), Amsterdam, The Netherlands, 11–14 October 2016; pp. 483–499. [Google Scholar]
  11. Jansson, A.; Humphrey, E.; Montecchio, N.; Bittner, R.; Kumar, A.; Weyde, T. Singing voice separation with deep U-Net convolutional networks. In Proceedings of the International Society for Musical Information Retrieval Conference, Suzhou, China, 23–27 October 2017; pp. 745–751. [Google Scholar]
  12. Park, S.; Kim, T.; Lee, K.; Kwak, N. Music source separation using stacked hourglass networks. In Proceedings of the International Society for Musical Information Retrieval Conference, Paris, France, 23–27 September 2018; pp. 289–296. [Google Scholar]
  13. Wang, J.; Sun, K.; Cheng, T.; Jiang, B.; Deng, C.; Zhao, Y.; Liu, D.; Mu, Y.; Tan, M.; Wang, X.; et al. Deep high-resolution representation learning for visual recognition. IEEE Trans. Pattern Anal. Mach. Intell. 2020. [Google Scholar] [CrossRef] [Green Version]
  14. Sun, K.; Xiao, B.; Liu, D.; Wang, J. Deep high-resolution representation learning for human pose estimation. In Proceedings of the IEEE Conference on Computer Vision and Pattern Recognition, Long Beach, CA, USA, 15–20 June 2019; pp. 5693–5703. [Google Scholar]
  15. Lu, W.T.; Su, L. Vocal Melody Extraction with Semantic Segmentation and Audio-symbolic Domain Transfer Learning. In Proceedings of the International Society for Musical Information Retrieval Conference, Paris, France, 23–27 September 2018; pp. 521–528. [Google Scholar]
  16. Sun, K.; Zhao, Y.; Jiang, B.; Cheng, T.; Xiao, B.; Liu, D.; Mu, Y.; Wang, X.; Liu, W.; Wang, J. High-Resolution Representations for Labeling Pixels and Regions. arXiv 2019, arXiv:1904.04514. [Google Scholar]
  17. Dogac, B.; Slim, E.; Geoffroy, P. Main Melody Extraction With Source-Filter NMF And CRNN. In Proceedings of the International Society for Musical Information Retrieval Conference, Paris, France, 23–27 September 2018; pp. 82–89. [Google Scholar]
  18. Chandna, P.; Miron, M.; Janer, J.; Gómez, E. Monoaural audio source separation using deep convolutional neural networks. In Proceedings of the International Conference on Latent Variable Analysis and Signal Separation, Grenoble, France, 21–23 February 2017; pp. 258–266. [Google Scholar]
  19. Stoller, D.; Ewert, S.; Dixon, S. Wave-u-net: A multi-scale neural network for end-to-end audio source separation. In Proceedings of the International Society for Musical Information Retrieval Conference, Paris, France, 23–27 September 2018; pp. 334–340. [Google Scholar]
  20. Uhlich, S.; Porcu, M.; Giron, F.; Enenkl, M.; Kemp, T.; Takahashi, N.; Mitsufuji, Y. Improving music source separation based on deep neural networks through data augmentation and network blending. In Proceedings of the 2017 IEEE International Conference on Acoustics, Speech and Signal Processing (ICASSP), New Orleans, LA, USA, 5–9 March 2017; pp. 261–265. [Google Scholar]
  21. Hennequin, R.; Khlif, A.; Voituret, F.; Moussallam, M. Spleeter: A fast and efficient music source separation tool with pre-trained models. J. Open Source Softw. 2020, 5, 2154. [Google Scholar] [CrossRef]
  22. Jansson, A.; Bittner, R.; Ewert, S.; Weyde, T. Joint singing voice separation and f0 estimation with deep u-net architectures. In Proceedings of the 27th European Signal Processing Conference (EUSIPCO), A Corun, Spain, 2–6 September 2019; pp. 1–5. [Google Scholar]
  23. Nakano, T.; Yoshii, K.; Wu, Y.; Nishikimi, R.; Lin, K.; Goto, M. Joint Singing Pitch Estimation and Voice Separation Based on a Neural Harmonic Structure Renderer. In Proceedings of the IEEE Workshop on Applications of Signal Processing to Audio and Acoustics (WASPAA), New York, NY, USA, 20–23 October 2019; pp. 160–164. [Google Scholar]
  24. He, K.; Zhang, X.; Ren, S.; Sun, J. Deep residual learning for image recognition. In Proceedings of the IEEE Conference on Computer Vision and Pattern Recognition, Las Vegas, CA, USA, 27–30 June 2016; pp. 770–778. [Google Scholar]
  25. Rafii, Z.; Liutkus, A.; Stöter, F.R.; Mimilakis, S.I.; Bittner, R. MUSDB18—A Corpus for Music Separation. December 2017. Available online: https://doi.org/10.5281/zenodo.1117372 (accessed on 15 December 2020).
  26. Chan, T.S.; Yeh, T.C.; Fan, Z.C.; Chen, H.W.; Su, L.; Yang, Y.H.; Jang, R. Vocal Activity Informed Singing Voice Separation with the iKala Dataset. In Proceedings of the IEEE International Conference on Acoustics, Speech and Signal Processing, Queensland, Australia, 19–24 April 2015; pp. 718–722. [Google Scholar]
  27. Goto, M.; Hashiguchi, H.; Nishimura, T.; Oka, R. RWC Music Database: Popular, Classical and Jazz Music Databases. In Proceedings of the International Society for Musical Information Retrieval Conference, Paris, France, 13–17 October 2002; pp. 287–288. [Google Scholar]
  28. Bittner, R.; Salamon, J.; Tierney, M.; Mauch, M.; Cannam, C.; Bello, J. MedleyDB: A Multitrack Dataset for Annotation-Intensive MIR Research. In Proceedings of the International Society for Musical Information Retrieval Conference, Taipei, Taiwan, 27–31 October 2014; pp. 155–160. [Google Scholar]
  29. Hsu, C.L.; Jang, J.S.R. On the improvement of singing voice separation for monaural recordings using the MIR-1K dataset. IEEE Trans. Audio Speech Lang. Process. 2009, 18, 310–319. [Google Scholar]
  30. Raffel, C.; McFee, B.; Humphrey, E.J.; Salamon, J.; Nieto, O.; Liang, D.; Ellis, D.P.W. mir_eval: A Transparent Implementation of Common MIR Metrics. In Proceedings of the International Society for Musical Information Retrieval Conference, Taipei, Taiwan, 27–31 October 2014. [Google Scholar]
Figure 1. An example of high-resolution representation recovering (left) and an example of high-resolution representation maintaining (right).
Electronics 10 00298 g001
Figure 2. The architecture of the used high-resolution network (HRNet) for singing voice separation.
Electronics 10 00298 g002
Figure 3. The third stage of the used HRNet connecting 4 modules in series.
Electronics 10 00298 g003
Figure 4. One module in the third stage: the left represents the parallel multi-resolution convolutions and the right displays the multi-resolution fusion.
Electronics 10 00298 g004
Figure 5. An example illustrating the low-to-high process and the high-to-low process for multi-resolution fusions. Resolution increase from 1/2 to 1 and that from 1/4 to 1 both simply use bilinear upsampling. Resolution decrease from 1 to 1/2 needs one strided convolution and that from 1 to 1/4 needs two consecutive strided convolutions.
Electronics 10 00298 g005
Figure 6. The output representation.
Electronics 10 00298 g006
Figure 7. The architecture of the proposed encoder-decoder network for vocal melody extraction.
Electronics 10 00298 g007
Figure 8. Statistical comparison of different singing voice separation methods for VME on three public datasets.
Electronics 10 00298 g008
Figure 9. Statistical comparison of vocal melody extraction methods on three public datasets.
Electronics 10 00298 g009
Figure 10. Good example: “pop4.wav” from ADC2004 dataset.
Electronics 10 00298 g010
Figure 11. Bad example: “amy_1_05.wav” from MIR1k dataset.
Electronics 10 00298 g011
Table 1. Comparison of different singing voice separation methods for vocal melody extraction (VME) on ADC2004 dataset.
AlgorithmsVRVFARPARCAOA
WaveU-ED88.8 ± 9.416.4 ± 17.086.2 ± 9.388.0 ± 8.985.0 ± 9.0
SH-ED77.6 ± 16.77.2 ± 10.173.8 ± 16.176.9 ± 13.975.4 ± 15.7
U-ED87.1 ± 10.29.3 ± 9.983.6 ± 10.685.2 ± 9.484.4 ± 8.9
HR-ED89.2 ± 10.69.4 ± 11.086.9 ± 10.588.1 ± 9.487.0 ± 8.5
Table 2. Comparison of different singing voice separation methods for VME on MIREX05 dataset.
AlgorithmsVRVFARPARCAOA
WaveU-ED92.2 ± 6.36.8 ± 3.386.1 ± 8.186.6 ± 7.688.8 ± 5.1
SH-ED88.3 ± 8.04.4 ± 2.483.3 ± 9.384.2 ± 8.687.7 ± 5.7
U-ED89.0 ± 8.15.6 ± 2.882.8 ± 9.283.7 ± 8.787.2 ± 5.5
HR-ED92.8 ± 4.84.9 ± 5.186.8 ± 6.587.2 ± 6.290.0 ± 5.1
Table 3. Comparison of different singing voice separation methods for VME on MIR1k dataset.
AlgorithmsVRVFARPARCAOA
WaveU-ED75.7 ± 15.25.1 ± 8.067.9 ± 18.672.2 ± 15.676.0 ± 13.8
U-ED82.2 ± 8.611.2 ± 9.873.7 ± 11.477.4 ± 9.278.2 ± 9.0
HR-ED87.5 ± 8.67.2 ± 9.881.1 ± 11.483.2 ± 9.284.6 ± 9.0
Table 4. Comparison of vocal melody extraction systems on ADC2004 datasets.
AlgorithmsVRVFARPARCAOA
DSM83.0 ± 13.536.9 ± 27.274.7 ± 15.678.1 ± 14.172.0 ± 14.3
SEG73.9 ± 8.82.4 ± 2.867.0 ± 11.069.3 ± 10.670.9 ± 11.5
SED91.1 ± 8.819.2 ± 17.084.6 ± 9.586.2 ± 9.083.7 ± 8.0
JDC88.8 ± 7.311.3 ± 11.783.2 ± 10.485.2 ± 8.583.0 ± 9.1
EDNet89.4 ± 9.426.2 ± 20.485.3 ± 10.087.0 ± 9.182.6 ± 9.4
HR-ED89.2 ± 10.69.4 ± 11.086.9 ± 10.588.1 ± 9.487.0 ± 8.5
Table 5. Comparison of vocal melody extraction systems on MIREX05 datasets.
AlgorithmsVRVFARPARCAOA
DSM79.1 ± 11.624.5 ± 11.571.9 ± 11.473.5 ± 10.773.6 ± 5.8
SEG87.3 ± 4.97.9 ± 4.780.8 ± 6.282.5 ± 6.584.9 ± 5.4
SED84.8 ± 7.113.2 ± 10.275.4 ± 9.776.6 ± 9.279.5 ± 8.1
JDC88.2 ± 6.94.2 ± 2.282.6 ± 8.583.2 ± 8.287.6 ± 5.0
EDNet90.2 ± 4.9819.8 ± 9.183.5 ± 6.784.0 ± 6.482.3 ± 5.6
HR-ED92.8 ± 4.84.9 ± 5.186.8 ± 6.587.2 ± 6.290.0 ± 5.1
Table 6. Comparison of vocal melody extraction systems on MIR1k datasets.
AlgorithmsVRVFARPARCAOA
DSM70.0 ± 15.541.4 ± 20.253.8 ± 20.359.2 ± 18.055.2 ± 16.9
JDC81.8 ± 12.614.3 ± 15.072.9 ± 15.175.5 ± 13.277.0 ± 12.0
EDNet87.3 ± 8.029.8 ± 18.675.4 ± 14.379.8 ± 10.473.5 ± 12.4
HR-ED87.5 ± 8.67.2 ± 9.881.1 ± 11.483.2 ± 9.284.6 ± 9.0
Table 7. Evaluation results of two cases.
AlgorithmsVRVFARPARCAOA
pop4.wavfrom mixture91.219.485.686.884.5
 from vocal96.414.193.593.991.9
amy_1_05.wavfrom mixture87.428.678.484.976.5
 from vocal74.50.0072.573.479.8
Publisher’s Note: MDPI stays neutral with regard to jurisdictional claims in published maps and institutional affiliations.

