Article

Tilted Beam Fabry–Perot Antenna with Enhanced Gain and Broadband Low Backscattering

by
Hassan Umair
1,
Tarik Bin Abdul Latef
1,*,
Yoshihide Yamada
2,
Wan Nor Liza Binti Wan Mahadi
1,
Mohamadariff Othman
1,
Kamilia Kamardin
2,
Mousa I. Hussein
3 and
Ali Imran Najam
4
1
Department of Electrical Engineering, University of Malaya, Kuala Lumpur 50603, Malaysia
2
Malaysia-Japan International Institute of Technology (MJIIT), Universiti Teknologi Malaysia, Kuala Lumpur 54100, Malaysia
3
Department of Electrical Engineering, United Arab Emirates University, Al Ain 15551, UAE
4
National Electronics Complex of Pakistan (NECOP), Islamabad 44000, Pakistan
*
Author to whom correspondence should be addressed.
Electronics 2021, 10(3), 267; https://doi.org/10.3390/electronics10030267
Submission received: 1 December 2020 / Revised: 7 January 2021 / Accepted: 11 January 2021 / Published: 23 January 2021
(This article belongs to the Special Issue Design and Theoretical Study of New Antennas)

Abstract

:
Communication with low radar signature platforms requires antennas with low backscatter, to uphold the low observability attribute of the platforms. In this work, we present the design for a Fabry–Perot (F-P) cavity antenna with low monostatic radar cross section (RCS) and enhanced gain. In addition, peak radiation is tilted inthe elevation plane. This is achieved by incorporating phase gradient metasurface (PGM) with absorptive frequency selective surface (FSS). The periodic surface of metallic square loops with lumped resistors forms the absorptive surface, placed on top of a partially reflecting surface (PRS) with an intervening air gap. The double-sided PRS consists of uniform metallic patches etched in a periodic fashion on its upper side. The bottom surface consists of variable-sized metallic patches, to realize phase gradient. The superstrate assembly is placed at about half free space wavelength above the patch antenna resonating at 6.6 GHz. The antenna’s ground plane and PRS together construct the F-P cavity. A peak gain of 11.5 dBi is achieved at 13° tilt of the elevation plane. Wideband RCS reduction is achieved, spanning 5.6–16 GHz, for x- and y-polarizations of normally incident plane wave. The average RCS reduction is 13 dB. Simulation results with experimental verifications are presented.

1. Introduction

Stealth targets are platforms which absorb or scatter the impinging electromagnetic waves, and hence are low detectable targets on a radar screen. These air/sea/land-based platforms have low radar cross section (RCS) areas and are essential for military and defense. Usually, to communicate with these platforms, antennas are mounted on them, and as antennas are a big source of radar signature, the overall RCS of the platforms increases significantly, easing their detectability on a radar [1,2]. Therefore, the design and development of antennas with low RCS for stealth targets is attracting more and more attention.
One of the promising methods, based on metasurfaces, for achieving RCS reduction of a planar antenna is to utilize a frequency selective surface (FSS), either as a radome [3,4], or as a modified ground plane [5,6,7]. In both configurations, the intended antenna operation (in-band) is preserved/least disturbed, while it is ensured that out-of-band frequencies are either absorbed or transmitted through (band passed), respectively. Recently, wideband RCS reduction including both in-band and out-of-band frequencies was investigated in [8]. A band pass FSS was combined with an absorbing FSS (AFSS) and placed at a certain height above a 2 × 2 patch array antenna. This achieved out-of-band absorption. The surface acted transparently for in-band frequencies. For in-band absorption, patch resonators were employed, co-planed with array elements. The antenna characteristics were unaltered. A double-layered resistive metasurface was investigated in [9], to reduce in-band as well as out-of-band RCS of a patch antenna. The upper layer held above the patch antenna reduced out-of-band RCS, whereas the in-plane lower layer loaded around the patch antenna reduced the in-band RCS. The total band of RCS reduction covered 2–15.5 GHz of frequency range, and ~2.8 GHz was the patch antenna’s operating frequency range. The gain loss was 0.6 dB.
When metasurfaces are employed in the configuration of a Fabry–Perot (F-P) cavity, backscattering can be reduced, and peak radiation of the underlying source antenna can also be enhanced. In Reference [10], enhancement of gain along with wideband RCS reduction was achieved based on a composite superstrate design that utilized absorptive FSS (resistive square loops) on top and a partially reflecting surface (PRS) on its bottom. This superstrate was held at a certain height above the patch antenna in order to form an F-P cavity. The transmission and reflection characteristics of the composite surface were designed in a way that in incident mode, the out of band frequencies were being absorbed, while in-band frequencies passed with slight attenuation, thereby reducing both out-of-band and in-band RCS simultaneously. In radiation mode, the in-band wave was intensified due to PRS effect of the composite surface, enhancing the radiated gain. Using a similar technique, the RCS reduction from 2–14 GHz was achieved in [11], along with an antenna gain enhancement of 4.3 dB; however, the in-band RCS reduction was inferior. The in-band RCS performance of [11] was improved in [12] by employing a metamaterial absorber (MA). In Reference [12], out-of-band frequencies were absorbed by absorptive FSS and in-band frequencies were passed without being attenuated. Once reaching the antenna surface, in-band wave was absorbed by a metamaterial absorber layer surrounding the antenna with an intervening gap. In the radiation mode, a periodic surface below the AFSS formed a quasi-PRS in conjunction with the ground plane of the antenna and enhanced the radiated gain. In this way, wideband RCS reduction (in-band + out-of-band) and gain enhancement were achieved simultaneously. Similarly, gain enhancement, wideband RCS reduction, as well as operating frequency reconfiguration were achieved in [13]. The frequency reconfiguration in [13] was achieved based on the technique presented in [14], in which varactor diodes were used within the capacitive grid of the PRS in order to achieve tunable reflection phases, and thus the tuning of the operating frequency. In another work [15], scattering of incoming in-band wave towards the non-threat direction and absorption of out-of-band wave were achieved by employing phase gradient metasurface (PGM) and MA, respectively. Excellent broadside peak radiation enhancement was attained for a patch radiator. In the same work [15], the design without MA was also presented, with gain increase even higher. It is important to note that the use of PGM in this work was primarily for scattering away, and not absorption, of the in-band incident wave. Although a good in-band RCS reduction was achieved, from a stealth point of view, absorption of incoming radar waves might be preferable over scattering them away.
A different type of antenna is a tilted beam antenna. Instead of employing complex electronic phase shifting techniques or bulky mechanical methods for beam tilting, a gradient-based metasurface is a more practical method for achieving a beam tilt when a fixed angle is desired. It is useful in commercial and military applications where above/below the horizon communication is desired, such as in a base station (BS) [16], satellite communication platforms [17], side looking airborne radar (SLAR) [18], as well as other defense-related imaging and reconnaissance applications. The technique of achieving beam tilt is to introduce a gradient in the dimensions of the periodic elements which constitute the PRS. The designed phase gradient metasurface can direct the radiated wave away from the boresight to a tilted angle direction. The gradation in the constituent unit cell elements varies the reflection magnitude and phase along the inductive or capacitive grid, and this variation of transmission/reflection properties gives rise to a beam redirection effect. The principle was used in [19,20,21,22] to achieve ±20°, 33°, 18°, and 27° beam tilt, respectively.
Owing to a number of applications of tilted beam antennas [16,17,18], which also includes their use in military applications, an investigation of their RCS suppression is deemed important. According to the background literature, it is evident that a composite superstrate in an F-P cavity configuration has been utilized for wideband RCS reduction, as well as boresight gain enhancement. It can also be observed that a progressive phase delay mechanism introduced into a PRS can redirect the antenna beam. Therefore, leveraging the two concepts together in a single antenna system, to exploit the advantages of both, is worth exploring. In this work, we aim to design a phase gradient metasurface with an absorptive FSS, in an attempt to achieve wideband incident wave absorption for monostatic RCS reduction, as well as high gain and tilted beam operation in the transmission mode of the antenna system. The designed F-P cavity is excited by a rectangular patch antenna operating at 6.6 GHz (C-band). A beam tilt of 13° is achieved in the E-plane, with low side lobe levels (SLLs), and the achieved gain is 11.5 dBi. For x and y incident wave polarizations, 13 dB average monostatic RCS reduction is achieved, spanning over 5.6–16 GHz (96.3% bandwidth). The antenna is fabricated to verify the simulation results.

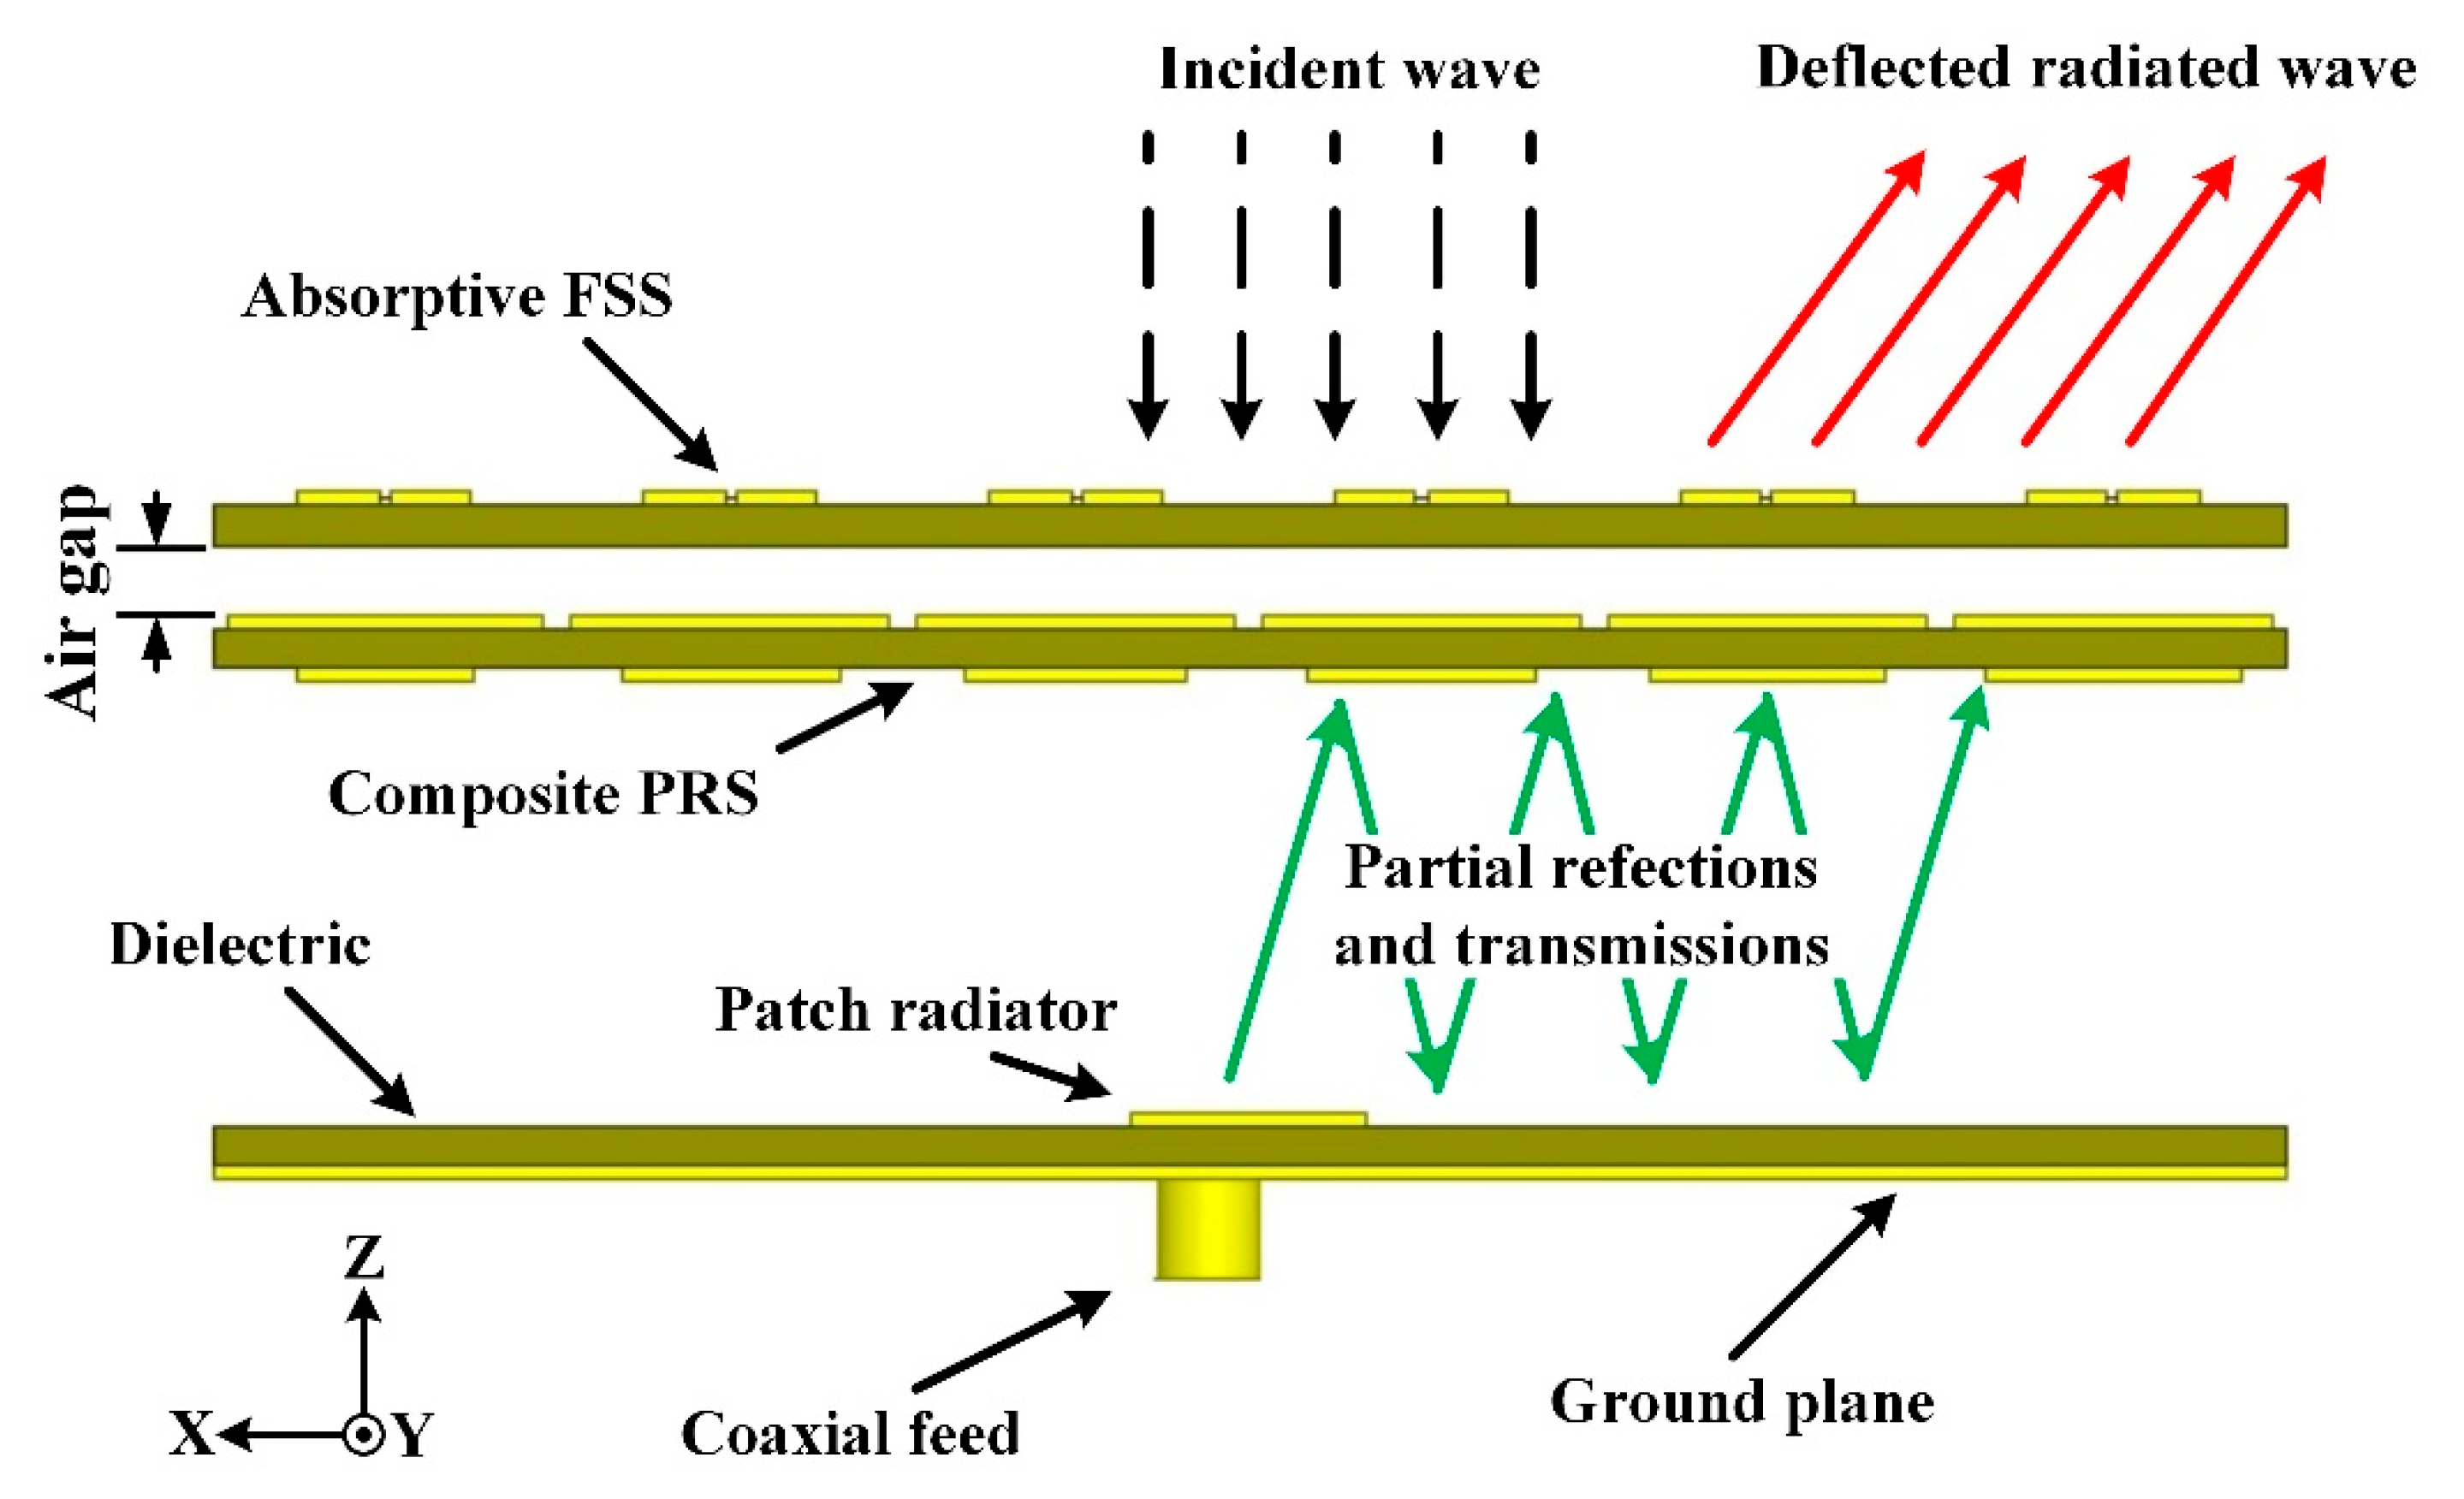
2. Proposed Antenna System and Its Operation

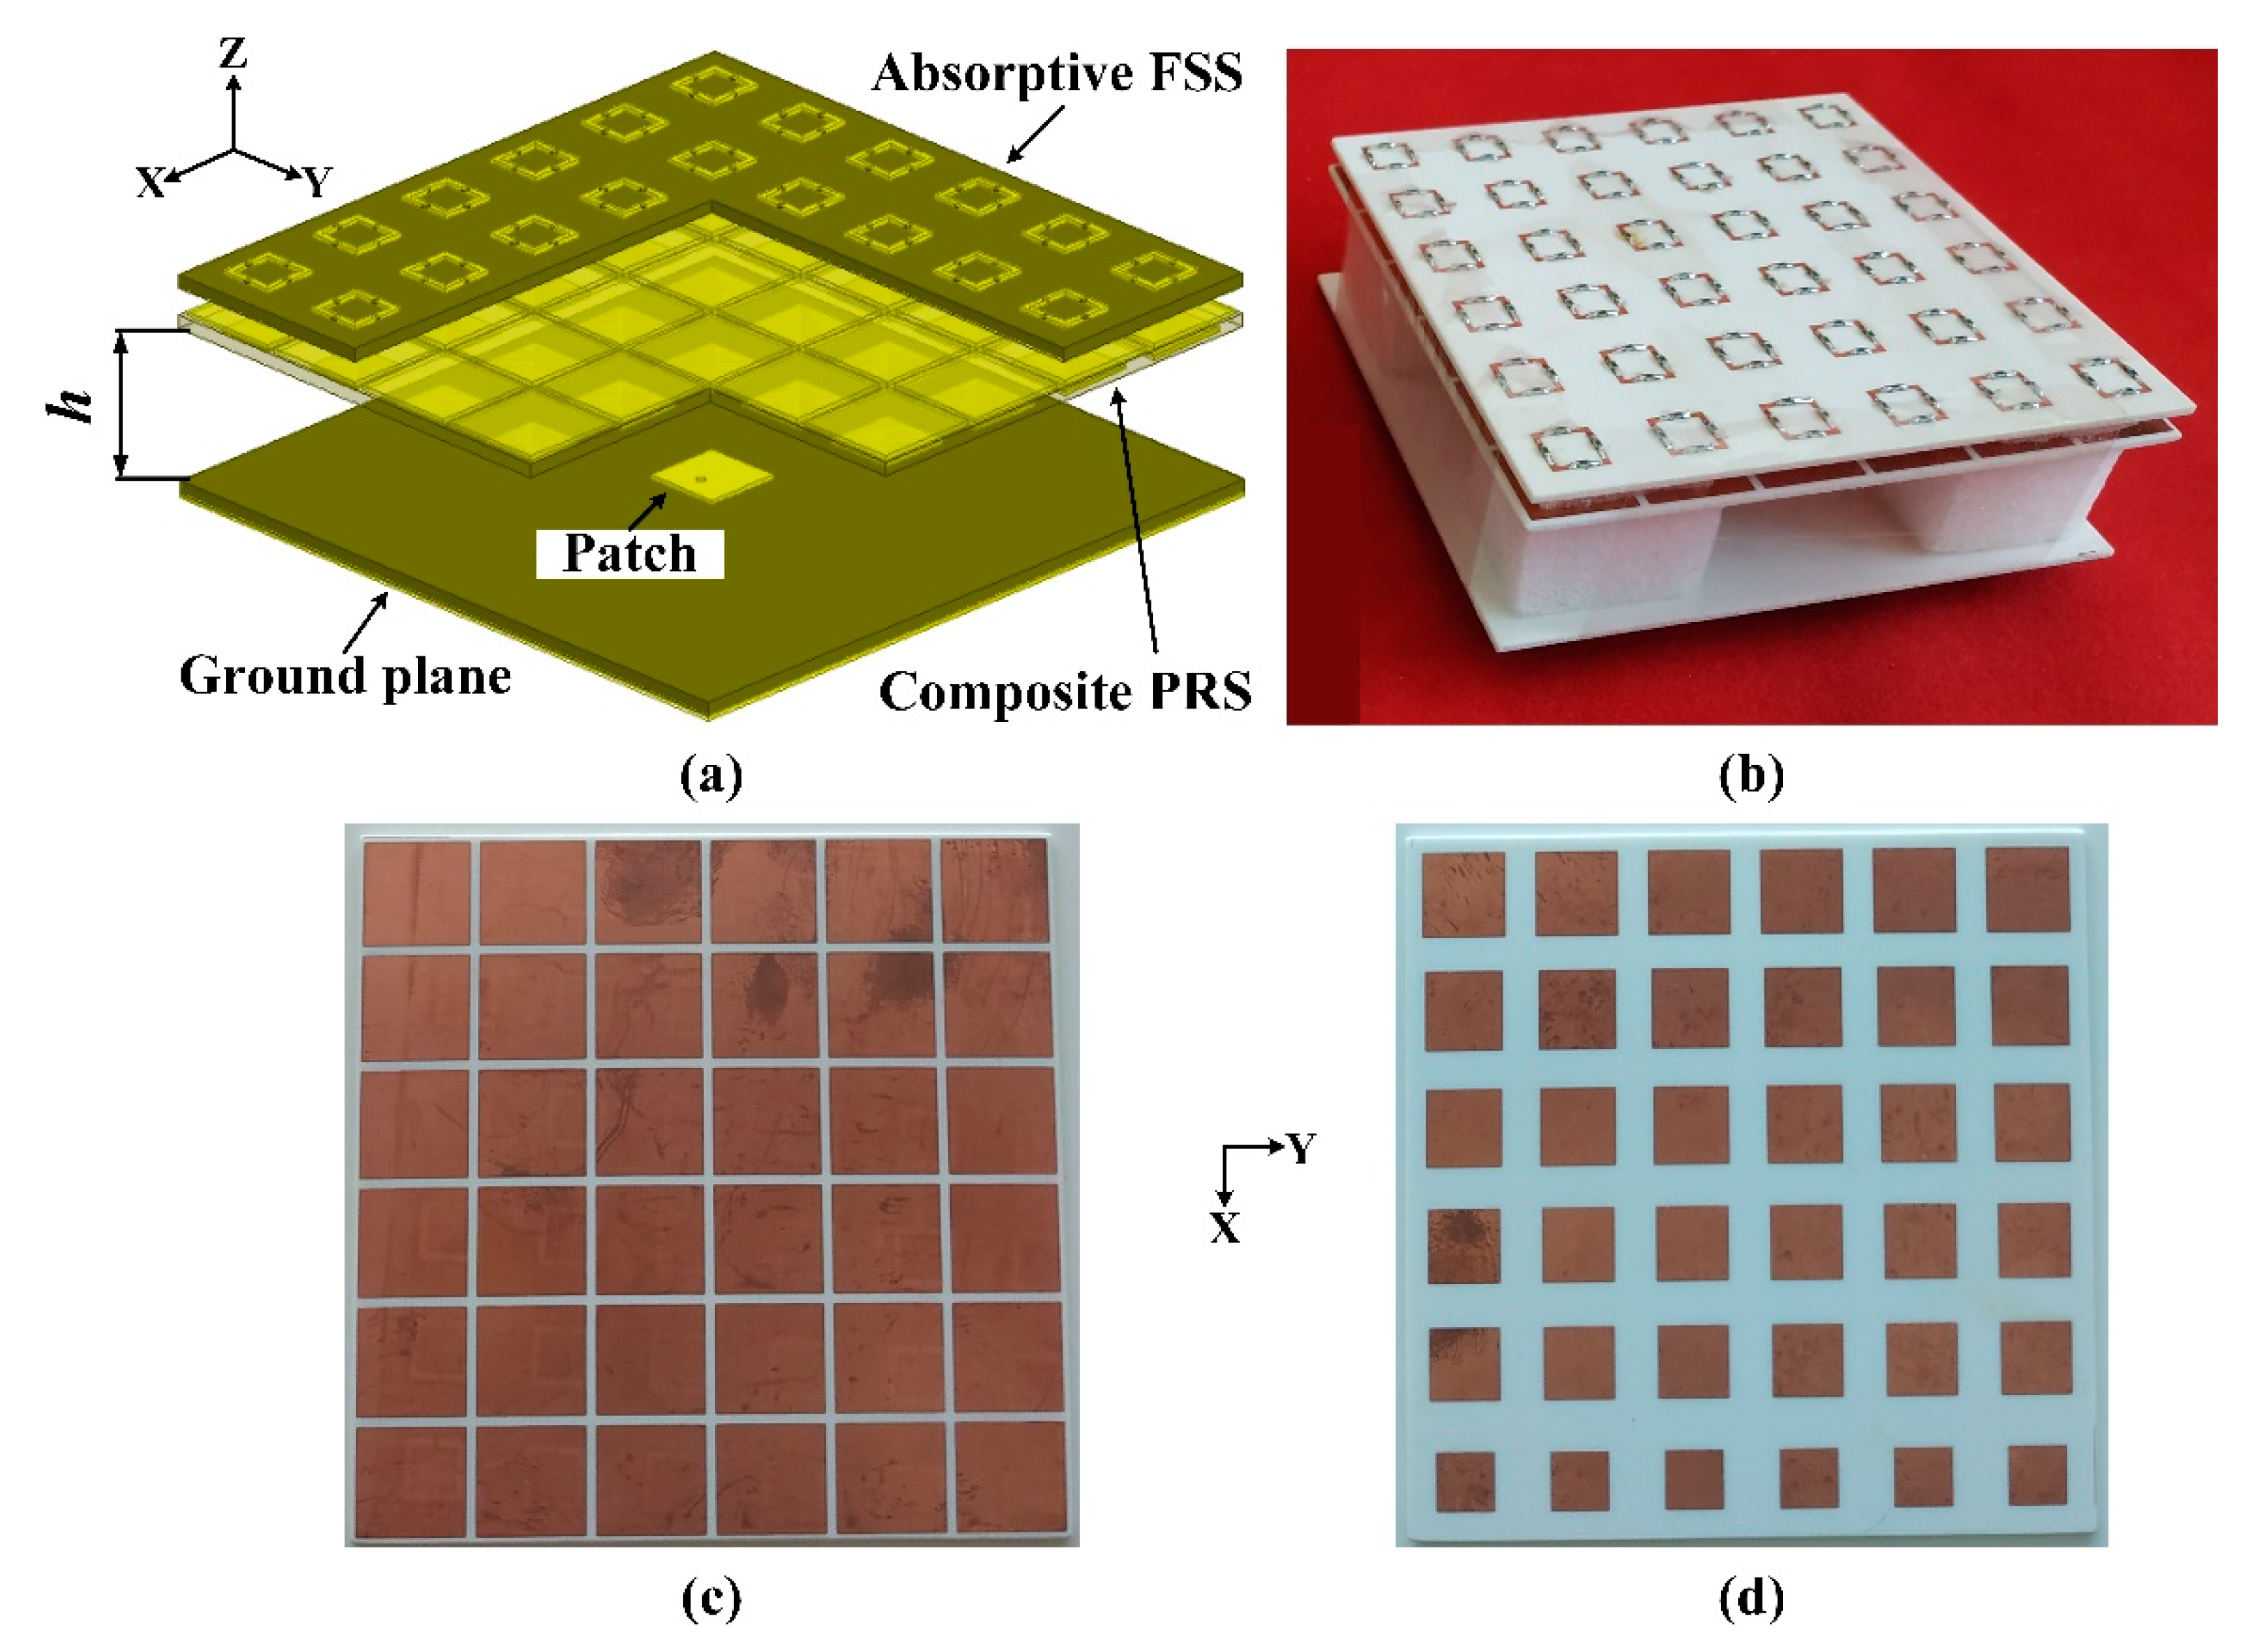
2.1. Fabry–Perot (F-P) Cavity Antenna

The schematic of the proposed F-P antenna system is given in Figure 1. The excitation source of the cavity is a rectangular patch antenna resonating at 6.6 GHz, within C-band. C-band has been selected as many radar deployments can be found within this band [23]. The operating frequency can be easily shifted by varying the dimensions of the patch, keeping under consideration the resonance condition of the F-P cavity. The F-P cavity is formed between the ground plane and the partially reflecting surface (PRS). The designed PRS is a composite superstrate which means both of its sides have been etched with a metallic pattern. All dielectric laminates used in the design are Rogers RO4003C, with dielectric constant εr = 3.38 (process), and thickness of 1.52 mm. Above the PRS superstrate with some air gap, absorptive FSS composed of resistive periodic elements is present. The cavity resonance condition for the F-P antenna shown in Figure 1 can be calculated using Equation (1) given as [24]:
h = ((φPRS + φG)/π) λ/4 + N λ/2
where h is cavity height, φPRS is the reflection phase of PRS, φG is the reflection phase of the ground plane, λ is free space operating wavelength, and N is the resonance order taken zero here (zeroth order resonance).
For full metallic ground plane, its reflection phase value is taken as π rad. A conventional cavity usually resonates around h = λ/2 at free space wavelength. The cavity height of our design is 20 mm. Next, the working principle of the superstrate assembly is explained by its unit cell configuration.

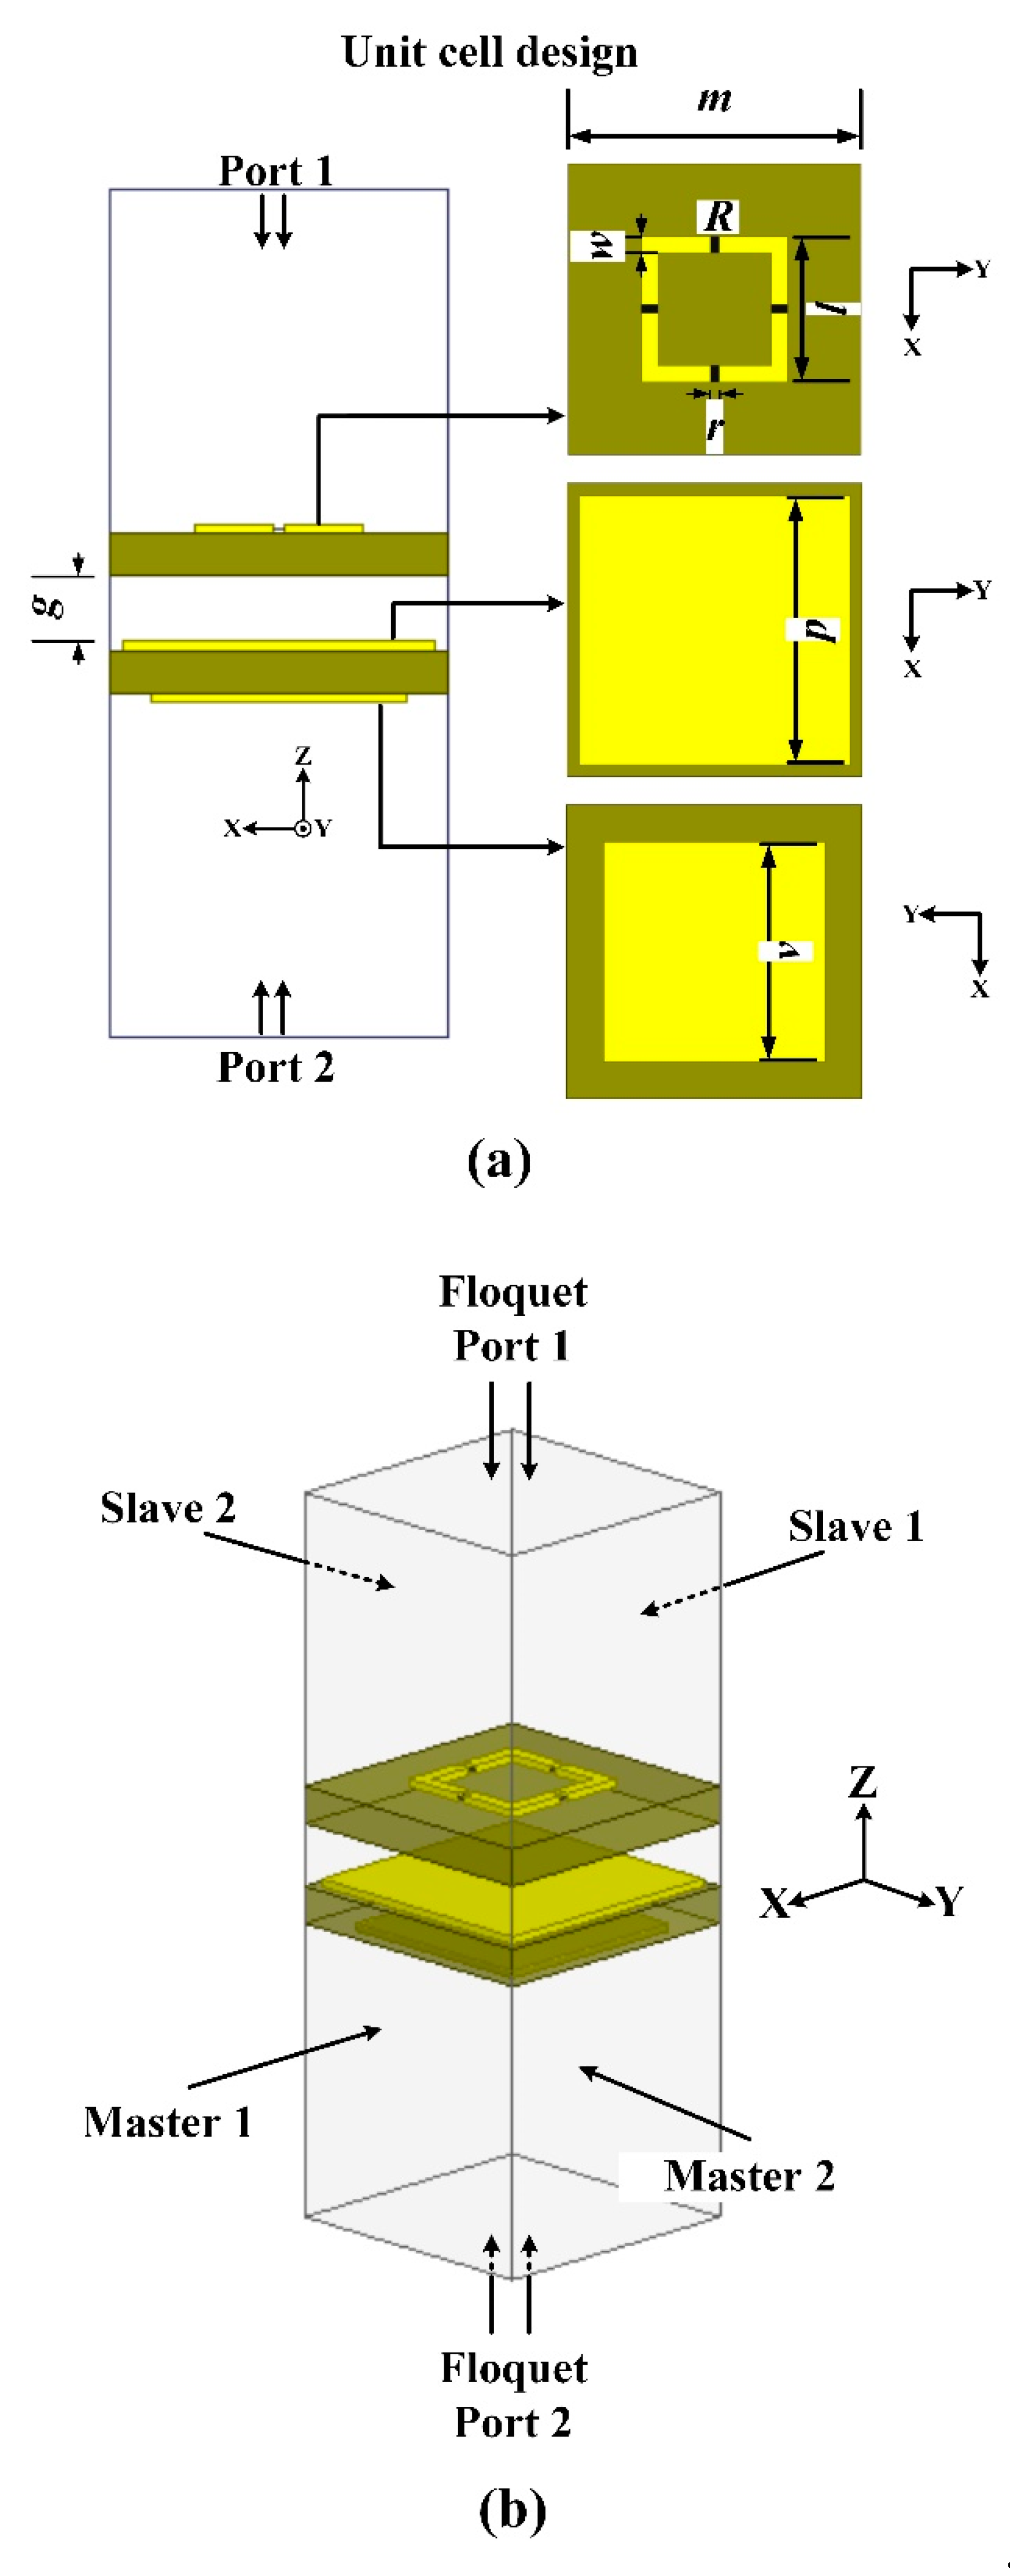
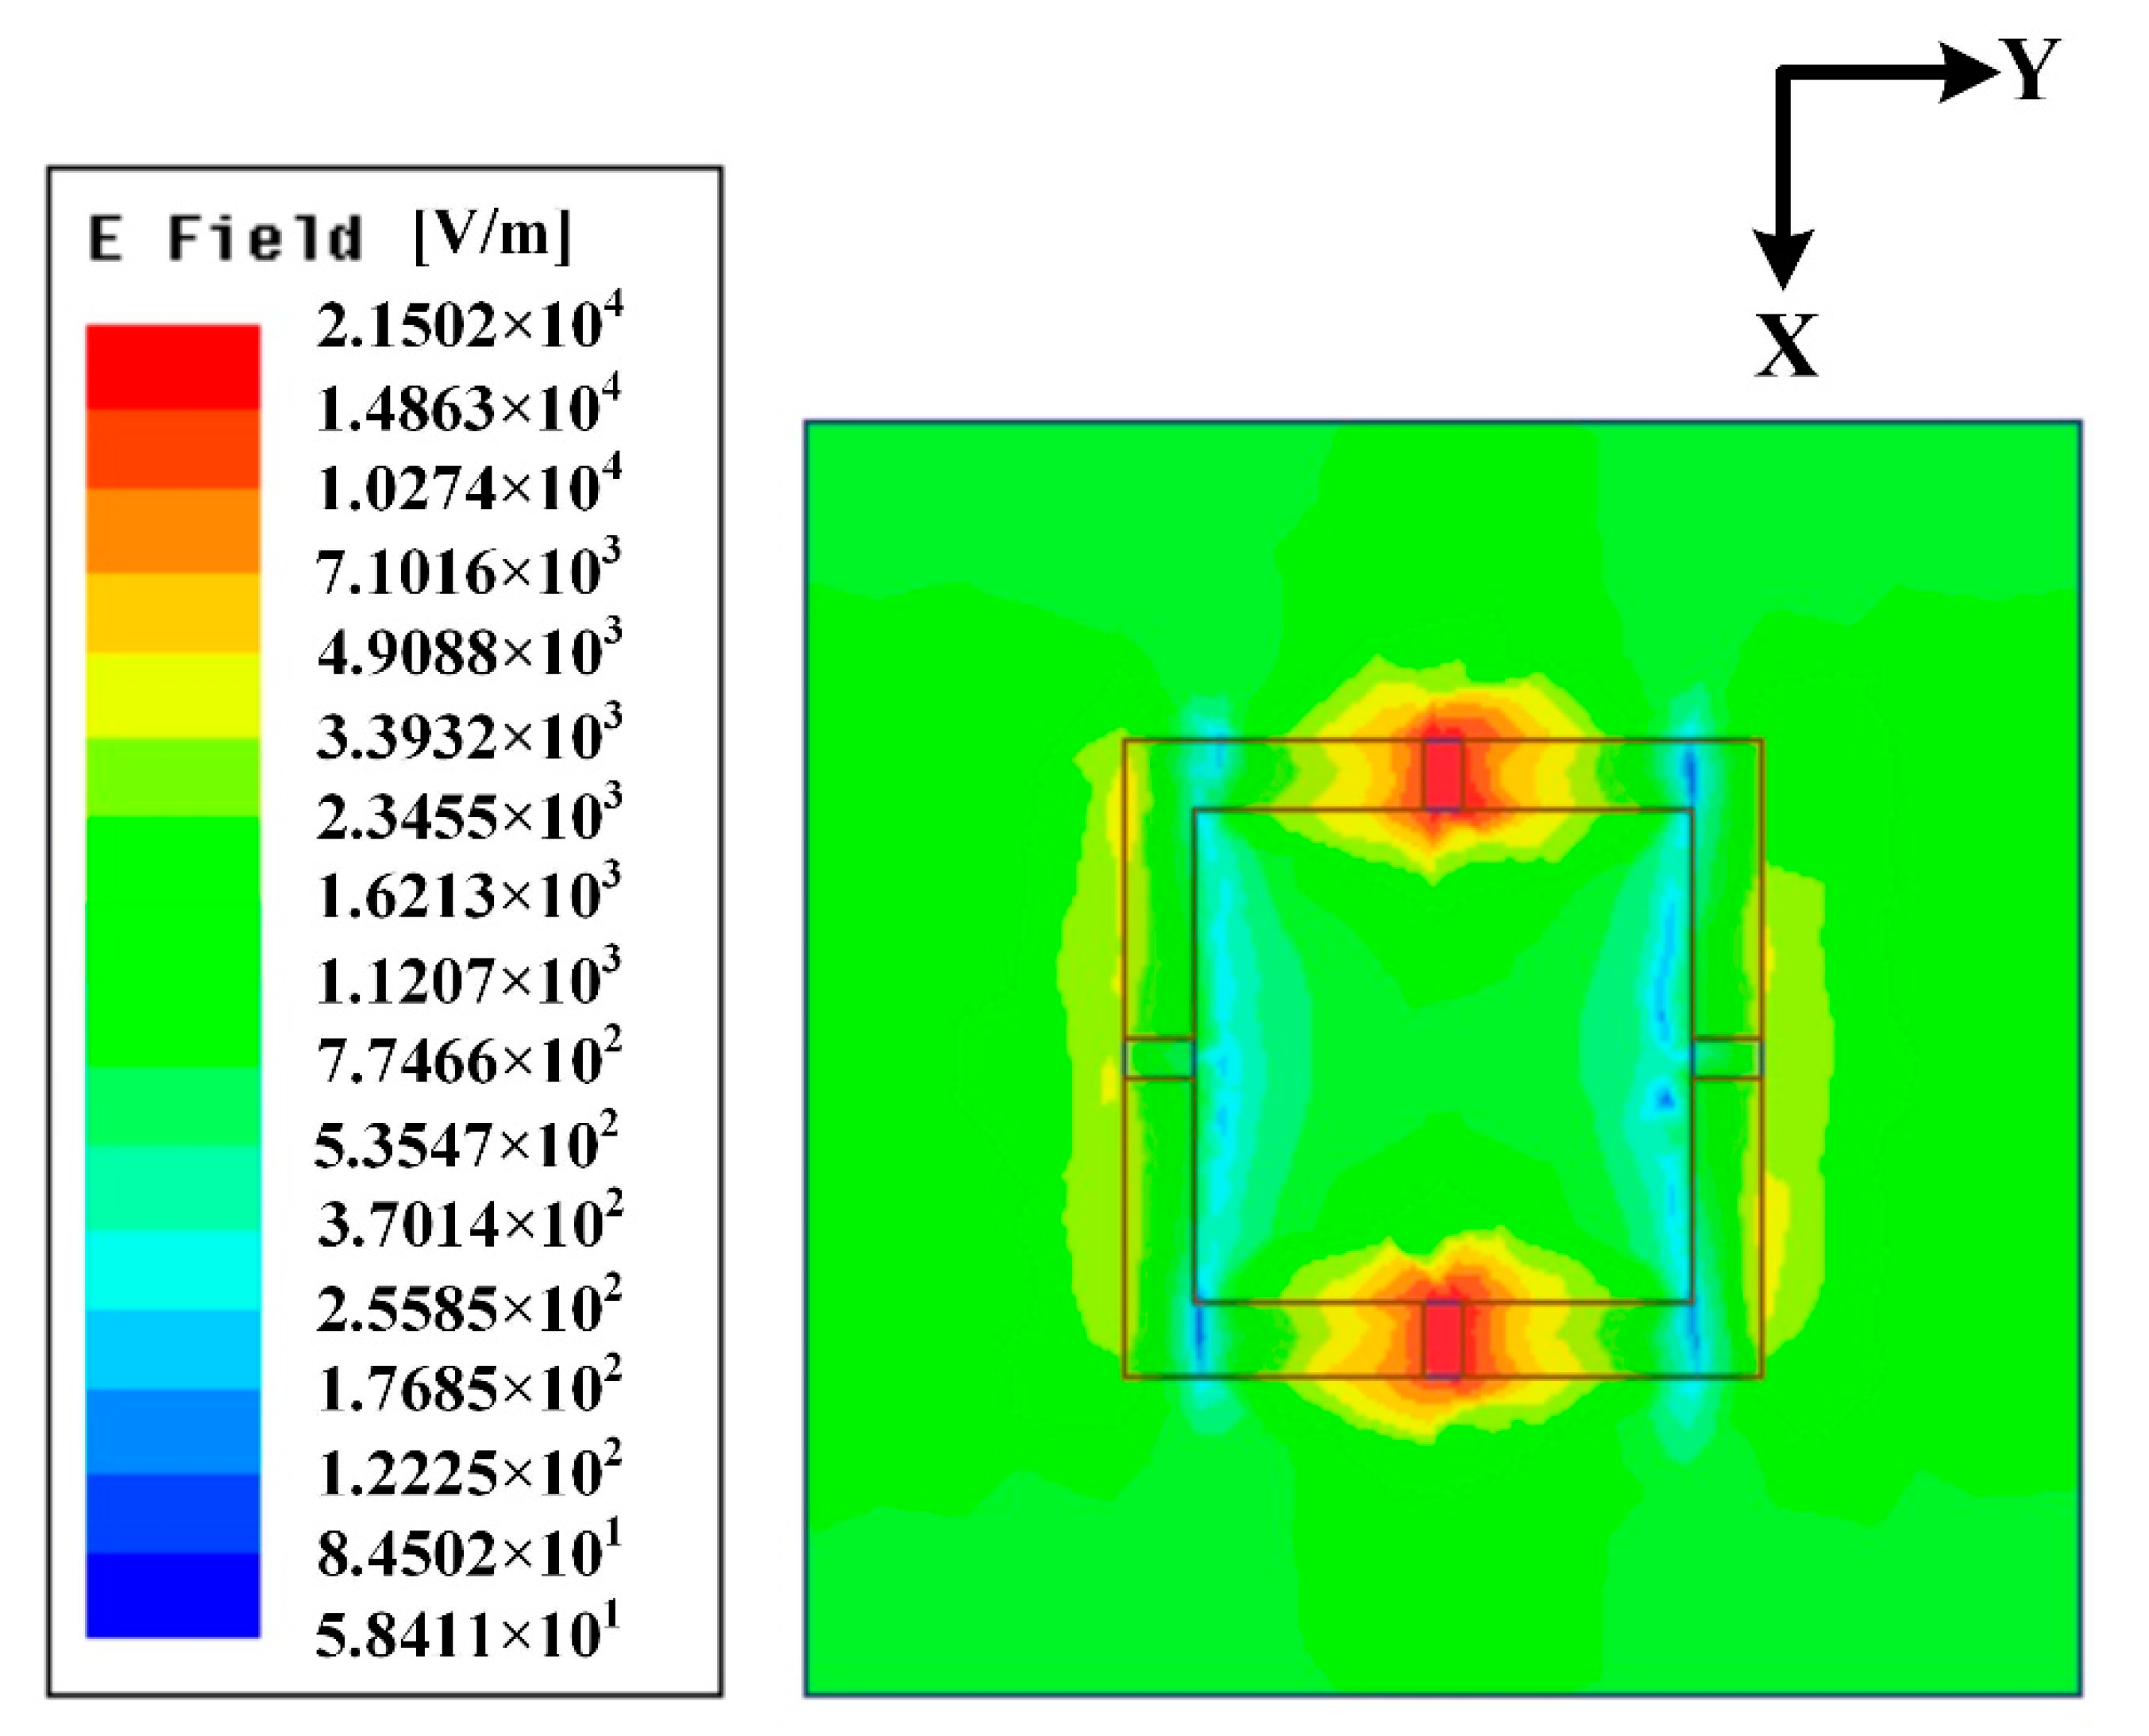
2.2. Unit Cell Configuration

The unit cell of the proposed design is displayed in Figure 2a. A metallic square loop with four lumped resistors (of 100 Ω each) constitutes the top absorptive surface. The lower part is a composite PRS that has a fixed size metallic patch on its upper side, and its bottom also has a metallic patch, but its size is variable. Both patches are square in shape. From the literature, it is well known that a surface of periodic resistive metallic loops etched on a dielectric that has a full backing metal plate functions as a wideband absorber of the electromagnetic (EM) wave [25]. Due to this backing metal plane, no EM wave can transmit/pass through it. When the goal is to design a low RCS F-P antenna using the said absorber, its (absorber’s) backing metal plane is modified or replaced with a partially reflecting surface. This modification is essential, as a full metallic plate directly above the antenna would disrupt the antenna’s operation by fully reflecting the EM wave, thus, not allowing the transmission and reception of the signal through the antenna. Now, coming back to the proposed unit cell as shown in Figure 2, our designed PRS is dual sided. Since our objective, in addition to RCS reduction, is also beam tilting, the lower surface of the PRS has been constructed from gradated patches (gradient surface). The purpose of upper surface of the PRS is to decouple the resistive surface from the lower phase gradient surface; otherwise, the absorption of the incident wave would suffer. Thus, the fixed size PRS patch acts as an intervening layer that is necessary to ensure parallel achievement of wideband absorption of the incident wave, as well as the beam tilting of the radiated wave. The frequency responses of transmission and reflection for a wave incident on the absorbing surface (from the positive z-axis towards the negative z-axis), and the frequency response of reflection for a wave striking the PRS (from the negative z-axis towards the positive z-axis) are sufficient to design and understand the unit cell operation and are discussed next.
A high-frequency structure simulator (HFSS) was used to model the unit cell. The simulation was performed by applying Floquet port excitation and master/slave boundary conditions, as indicated in Figure 2b. The detailed frequency responses are presented next. For an incident wave towards the positive z-axis, the reflection coefficient (S22) in terms of its phase and magnitude response is shown in Figure 3a,b, respectively. These plots would determine how the transmitted wave from the antenna is going to interact with, primarily, the surface consisting of variable-sized patches, the phase gradient surface. A number of curves can be seen for each plot; each curve corresponds to a particular value of patch size (v). The values for the unit cell dimensions (g, m, R, w, l, r, and p) are shown in Table 1. The patch size varies from 8 mm to 12 mm. It is evident from Figure 3a that an appropriate phase gradient has been achieved at 6.6 GHz frequency. The range of the reflection phases is from +158° (for v = 8 mm) to −130° (for v = 12 mm), approximately. This totals to 288° of phase gradient space. Thus, the variable length patch surface effectively forms a phase gradient metasurface. From Figure 3b, the magnitude response at 6.6 GHz shows high values of reflectivity, all above 0.8, and this implies that the gain enhancement of the radiated wave would be achieved after determining the proper cavity height (resonance condition). The S22 reflection phase plotted against varying patch size is shown in Figure 3c. This plot is also shown for the 6.6 GHz frequency. It reiterates that the reflection phase decreases (lags) when the gradient patch size is increased.
For varying patch size, the frequency response of reflection magnitude (S11) for a wave incident towards the negative z-axis is shown in Figure 4a. It can be seen that the magnitude of reflection is below −10 dB over a wide band, i.e., from about 7 GHz to 16 GHz. Around 6.6 GHz and slightly below, the reflection magnitude stays about −4 dB. This means that most of the incident wave is not being reflected backwards towards the positive z-axis. Before explaining how absorption of the incident wave takes place, it is necessary to also analyze transmission response (S21) of the wave when it is incident towards the negative z-axis. This response is shown in Figure 4b for various values of patch size, and it can be seen that from 7 GHz to 14.5 GHz, the magnitude of transmission is well below −10 dB. Around 6.6 GHz, it is about −8 dB (for v = 10 mm) and below. Therefore, from the above discussion, it is clear that reflection, as well as transmission, has been minimized over a wide range of frequencies, and this implies that most of the incident wave should be absorbed on the top resistive surface. Mathematically, the absorption can be calculated using Equation (2) as [26]:
A(ω) = 1 − Γ(ω) − T(ω)
where A is absorption, Γ is reflection, T is transmission, and ω is frequency. From Equation (2), when reflection and transmission is −10 dB and below, the absorption of incident wave is 80% or more. From Figure 4, it can be witnessed that from 7 GHz to 14.5 GHz, both reflection and transmission are below −10 dB; thus, good out-of-band RCS reduction has been achieved. Around operating frequency, some degree of absorption degradation can be seen; nevertheless, in-band RCS reduction along with antenna gain enhancement can still be obtained [13,27]. The transmission response shown in Figure 4b corresponds to the incident wave from Port 1 to Port 2 (S21) of the unit cell. Its S12 response (from Port 2 to Port 1) is exactly alike, as the unit cell (and thus the superstrate) is a passive structure. To avoid repetition, the plot has not been shown here. However, it is important to highlight that the transmission at operating frequency is about −8 dB and below (S21 = S12), which implies the radiation efficiency of the F-P antenna is expected to be somewhat compromised. The presented plots in Figure 3; Figure 4 are for TE wave polarization. Because the unit cell design is symmetric, TM wave polarization would give exactly the same response, and therefore has been omitted for brevity.
It is noteworthy that the top absorptive surface (absorptive FSS) alone would only act as a bandpass/bandstop filter, and its interaction with the incident wave is based on the resonance determined by its dimensions. However, the key to achieve incident wave absorption is the integration of the top surface with the composite PRS, which (as an integrated unit) would aid in achieving the suppression of radar backscattering. Before proceeding to the next section, it is important to discuss how the absorptive FSS and PRS behave individually to the application of the incident wave. For the absorptive FSS alone, the frequency responses of reflection (S11) and transmission (S21) magnitude are shown in Figure 5a. The inset shows the simulated model. Geometrical dimensions can be referenced from Table 1. From Figure 5a, it can be observed that the absorptive FSS behaves more like a bandpass filter towards the edges of the band. Around the center of the band, the reflection tends to rise while the transmission tends to decrease, and based on their absolute levels, it can be inferred that the incident wave energy is experiencing a degree of dissipation. Likewise, for the PRS alone, the S11 and S21 magnitudes are shown in Figure 5b. The inset depicts the simulated model. Each curve corresponds to a particular value of the patch size (v). As expected, low transmission and high reflection is observed over a wide band. Therefore, the combination of the two layers (absorptive FSS and PRS) is mandatory in order to achieve absorption, i.e., low reflection and low transmission, as was shown in Figure 4. The behavior of absorption with respect to the intervening air gap between absorptive FSS and PRS is discussed in Section 2.3. It is also necessary to mention that the term absorptive, here, only refers to the inclusion of resistors to the frequency selective metallic loops.
Electric (E)-field plotted on the top face of unit cell is shown in Figure 6. The plot is for the case of transverse electric (TE) incident field (y-polarized), at a frequency of 12 GHz, and for the gradient patch size (v) of 12 mm. A strong magnitude of E-field can be witnessed across the two resistor gaps that lie orthogonal (along the x-axis) to the direction of the E-field vector. This indicates the primary absorption mechanism, as the resistors within these gaps would dissipate the impinging field energy as heat. The transverse magnetic (TM) field plot would be similar because the unit cell geometry is symmetric, except that the intense E-field would now appear at the resistor gaps lying along the y-axis. The plot in Figure 5 has been shown only at 12 GHz for a wave incident towards the negative z-axis; identical plots are expected to be witnessed at other frequencies also, and therefore have been excluded for briefness.

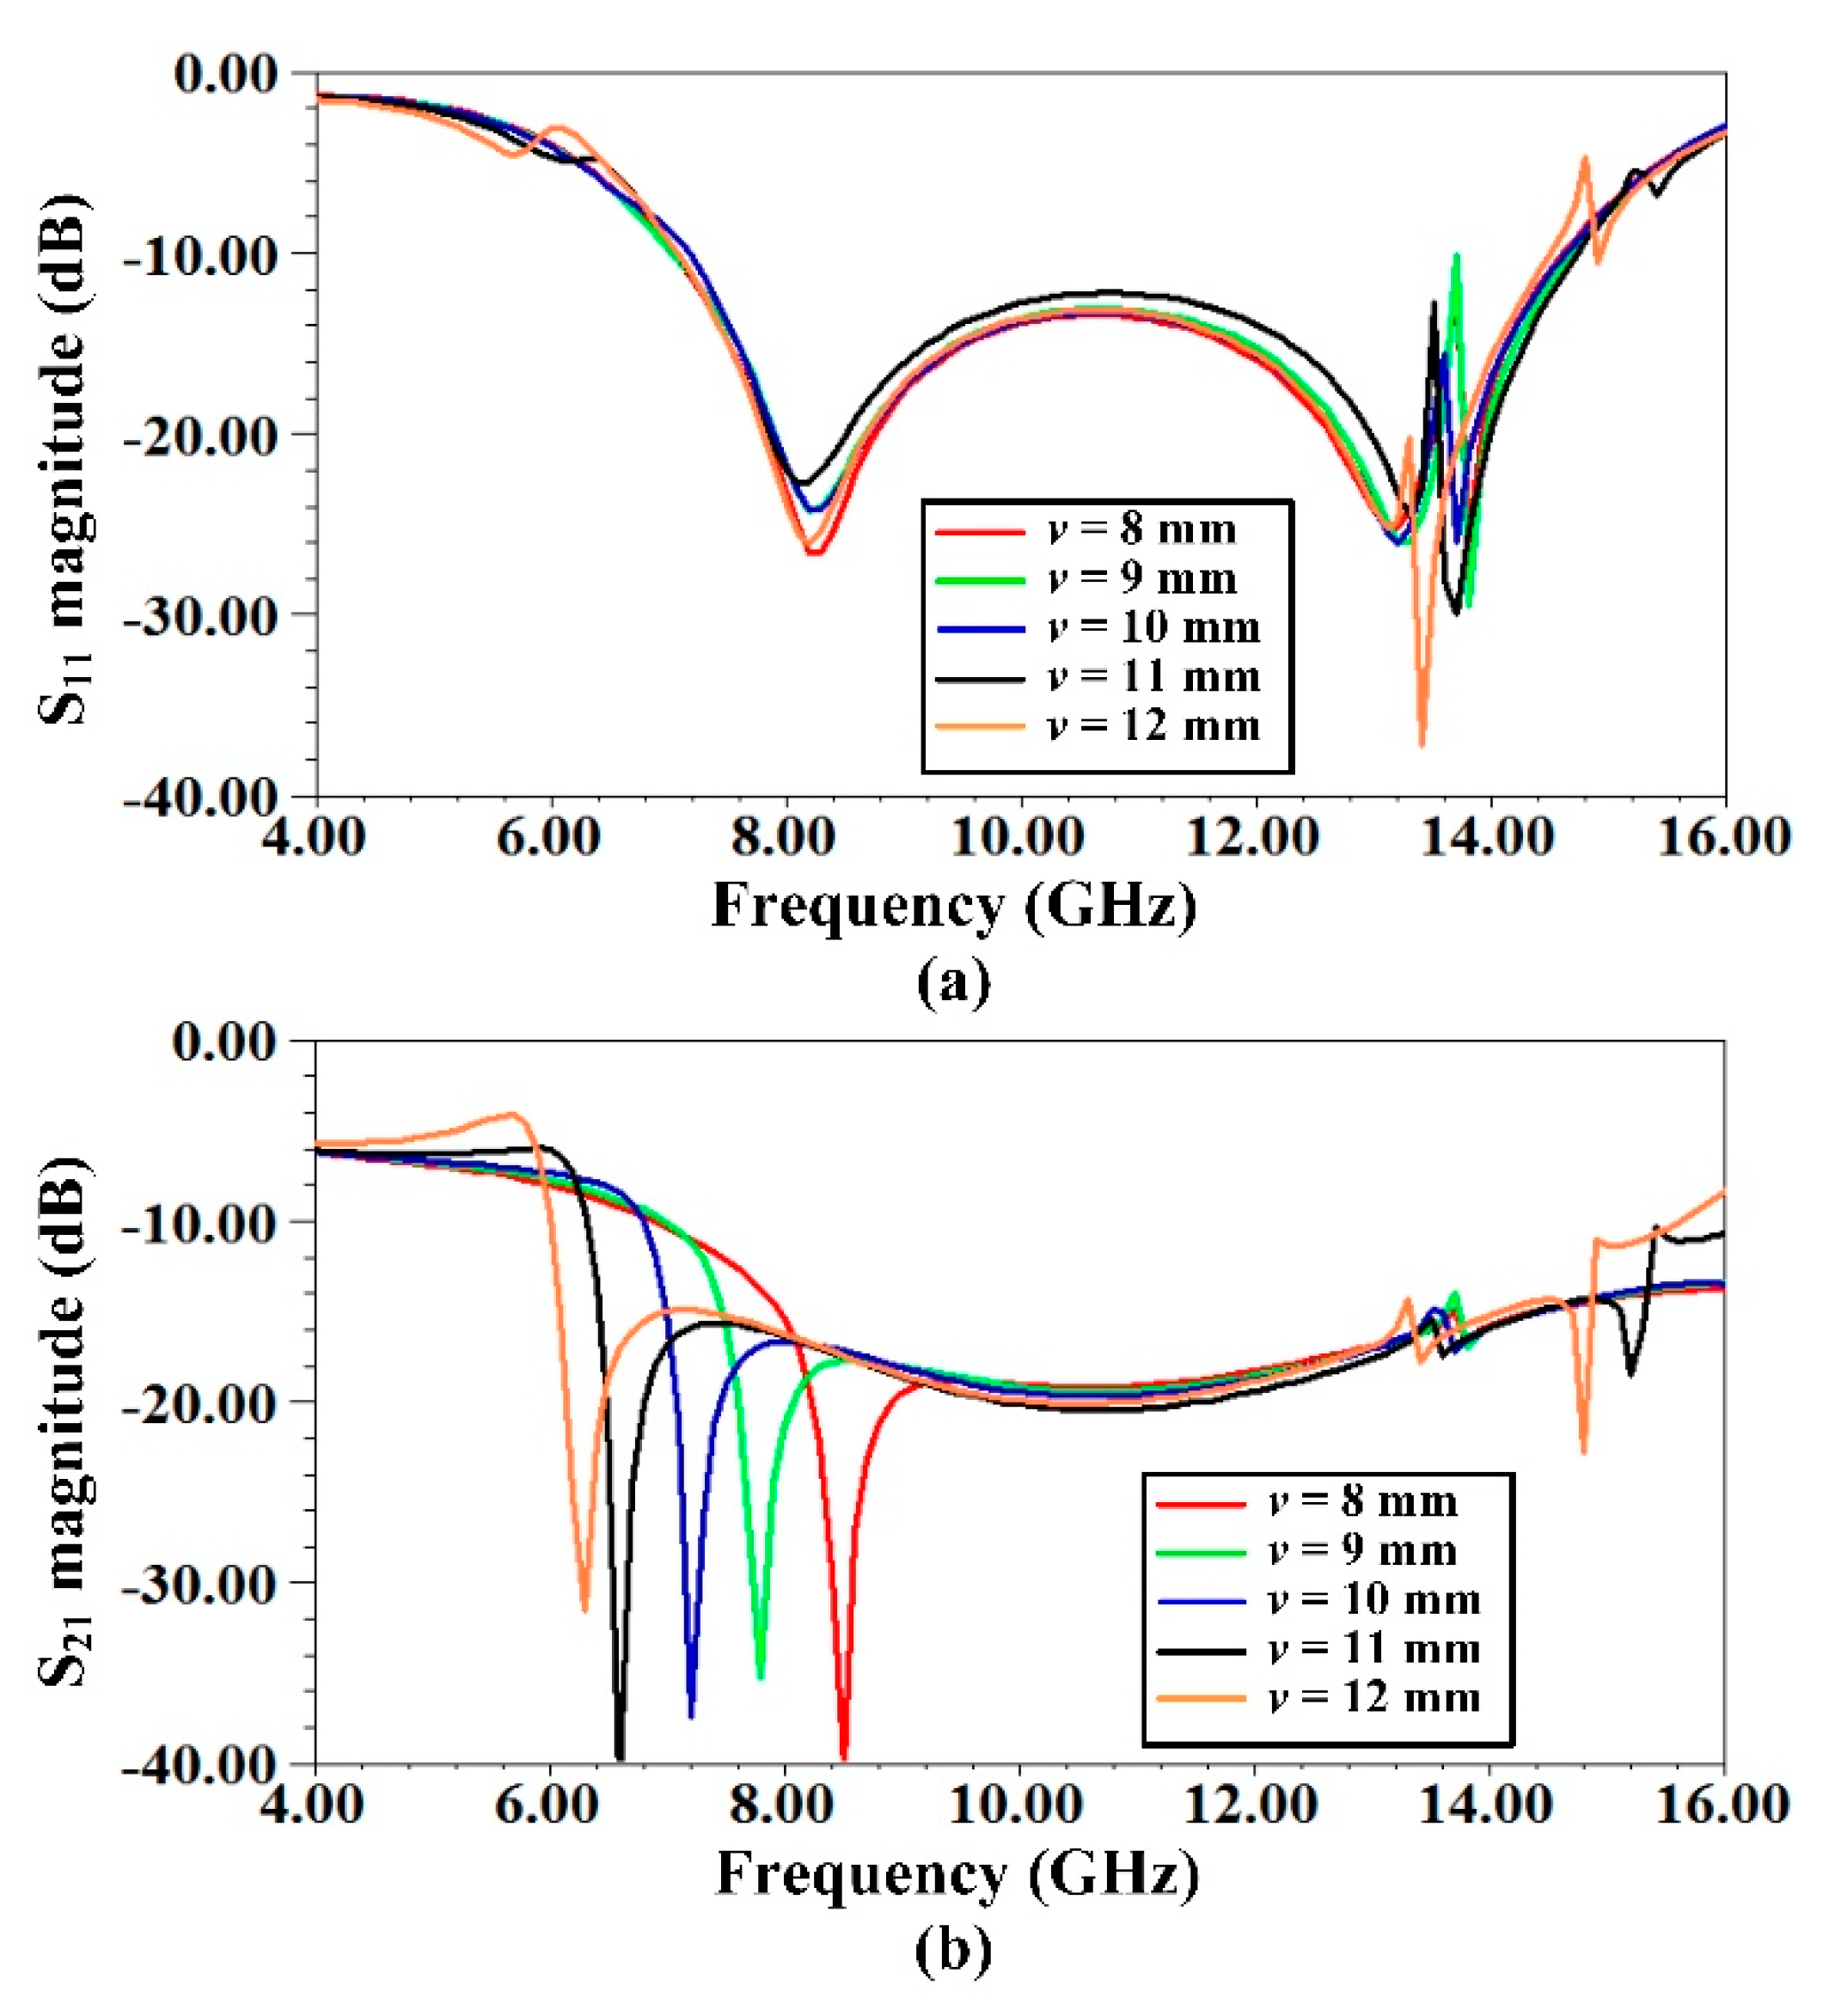
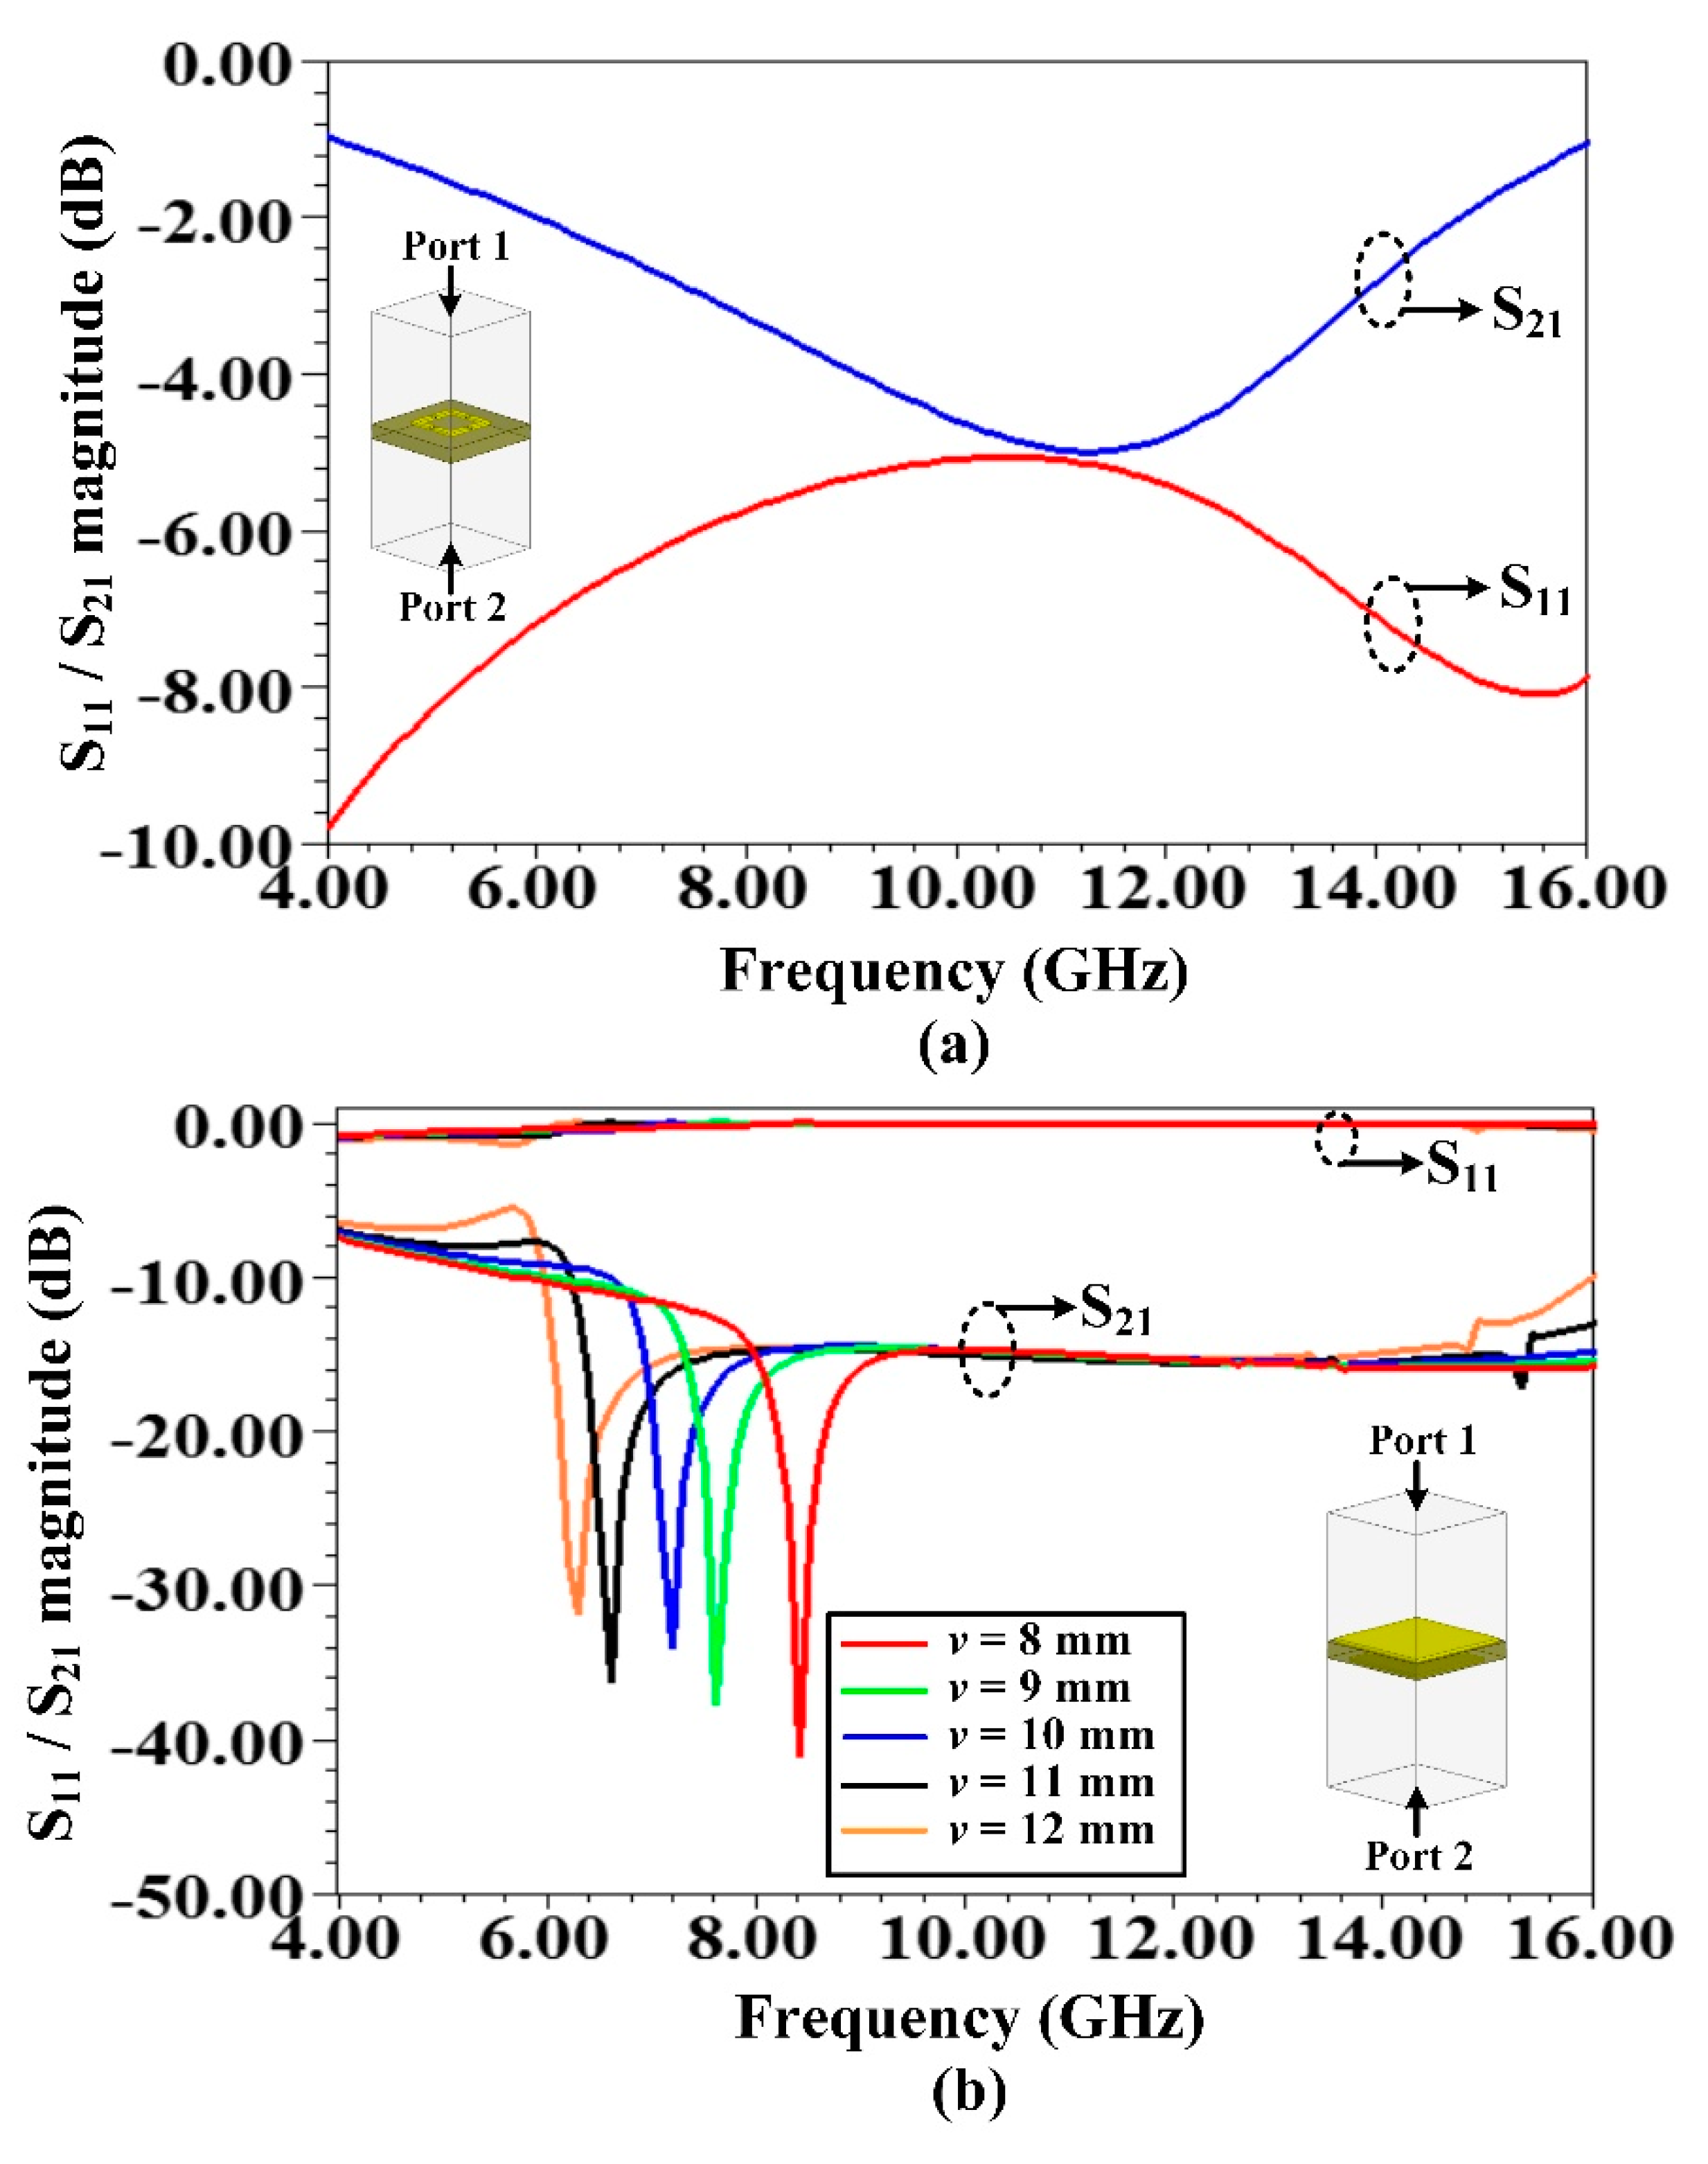
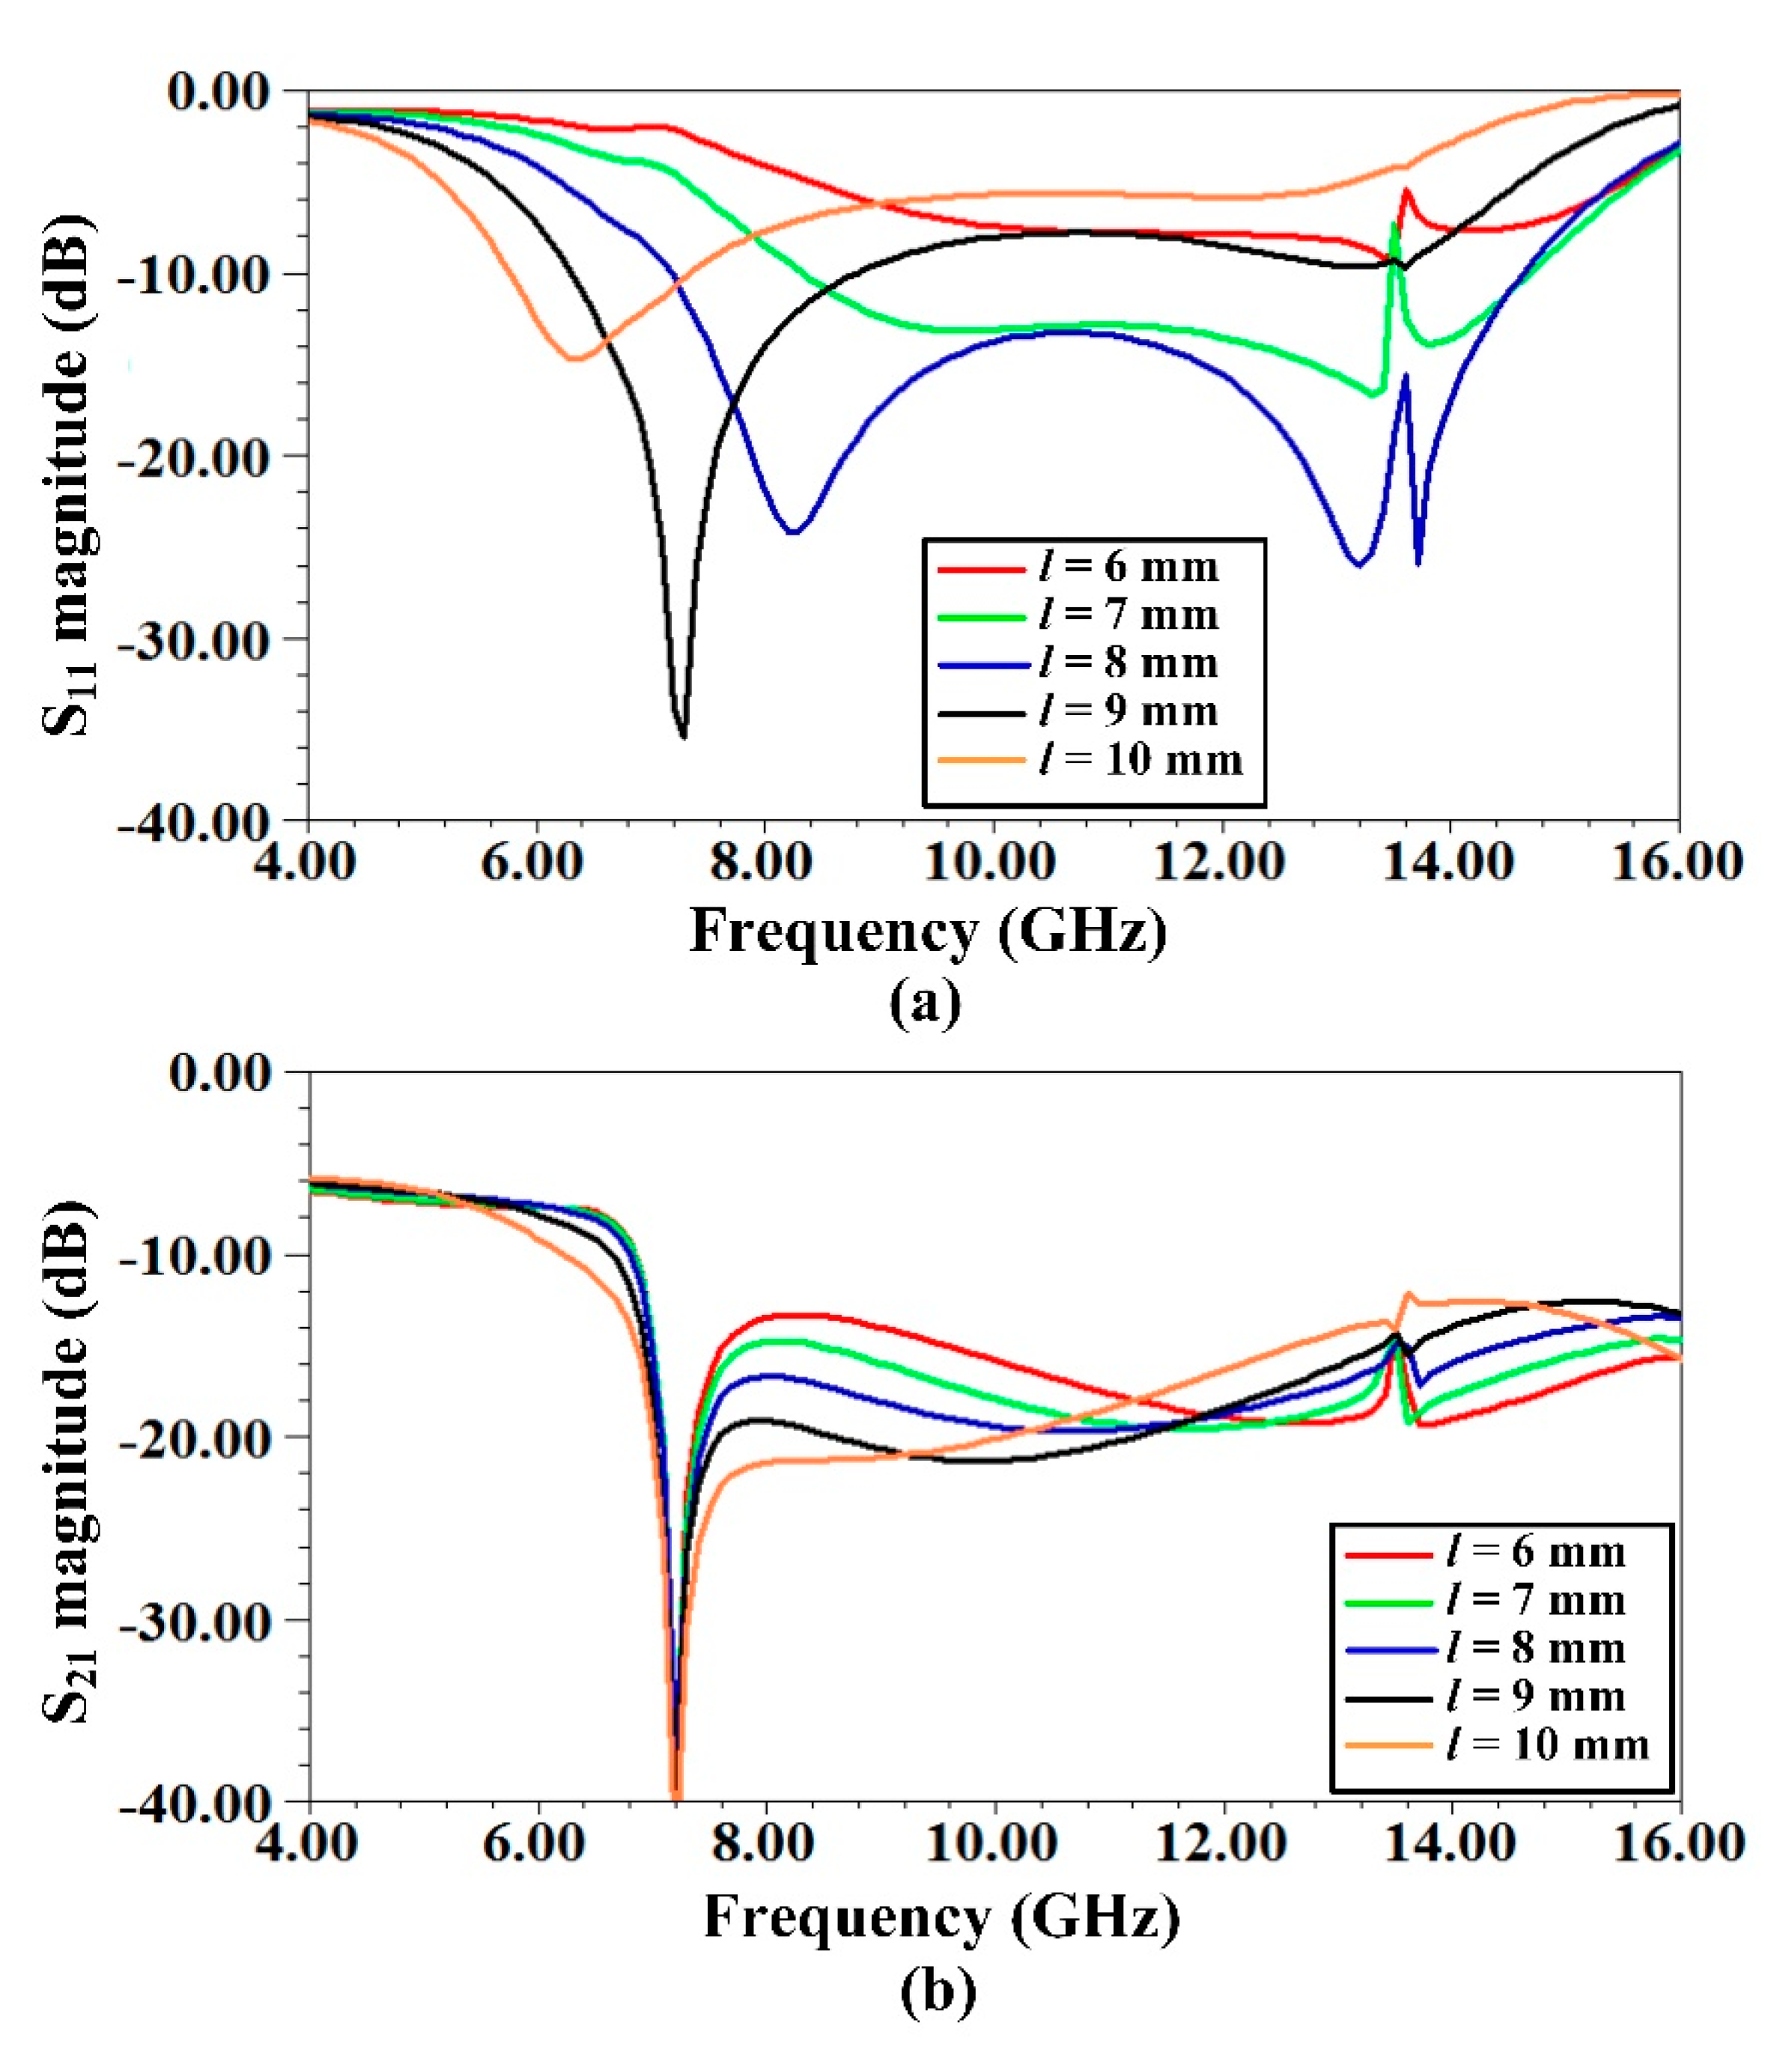
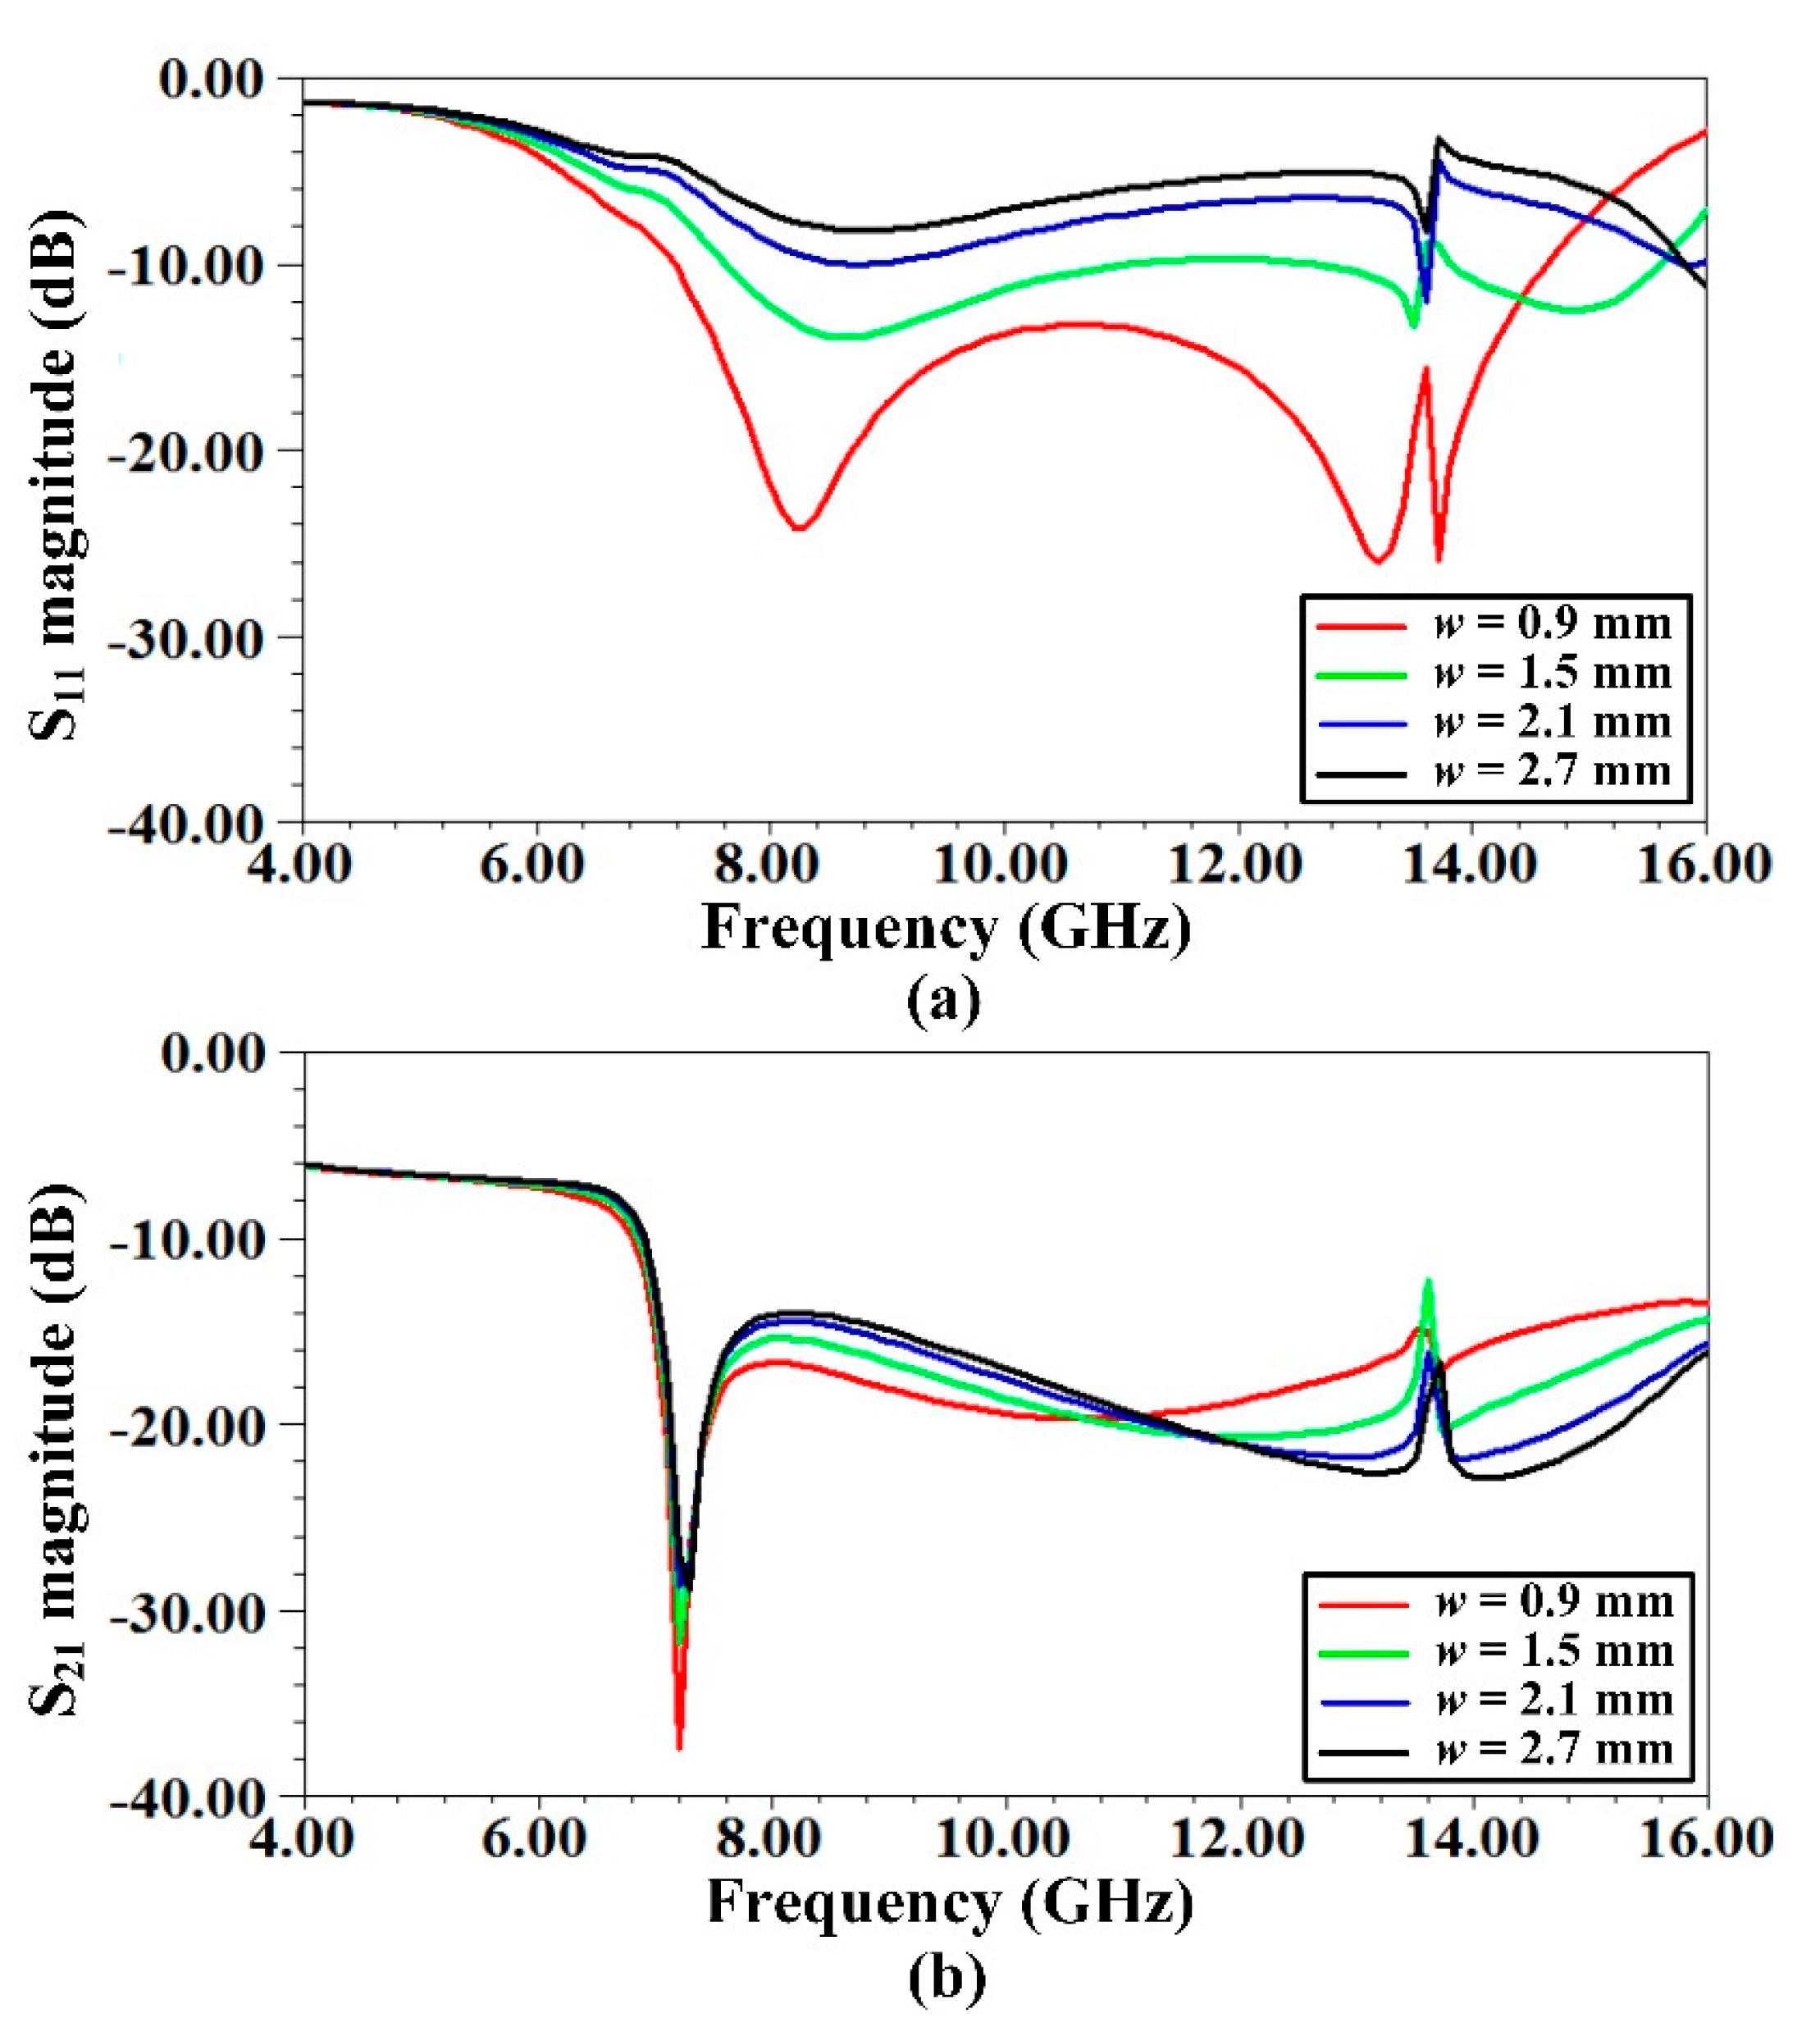
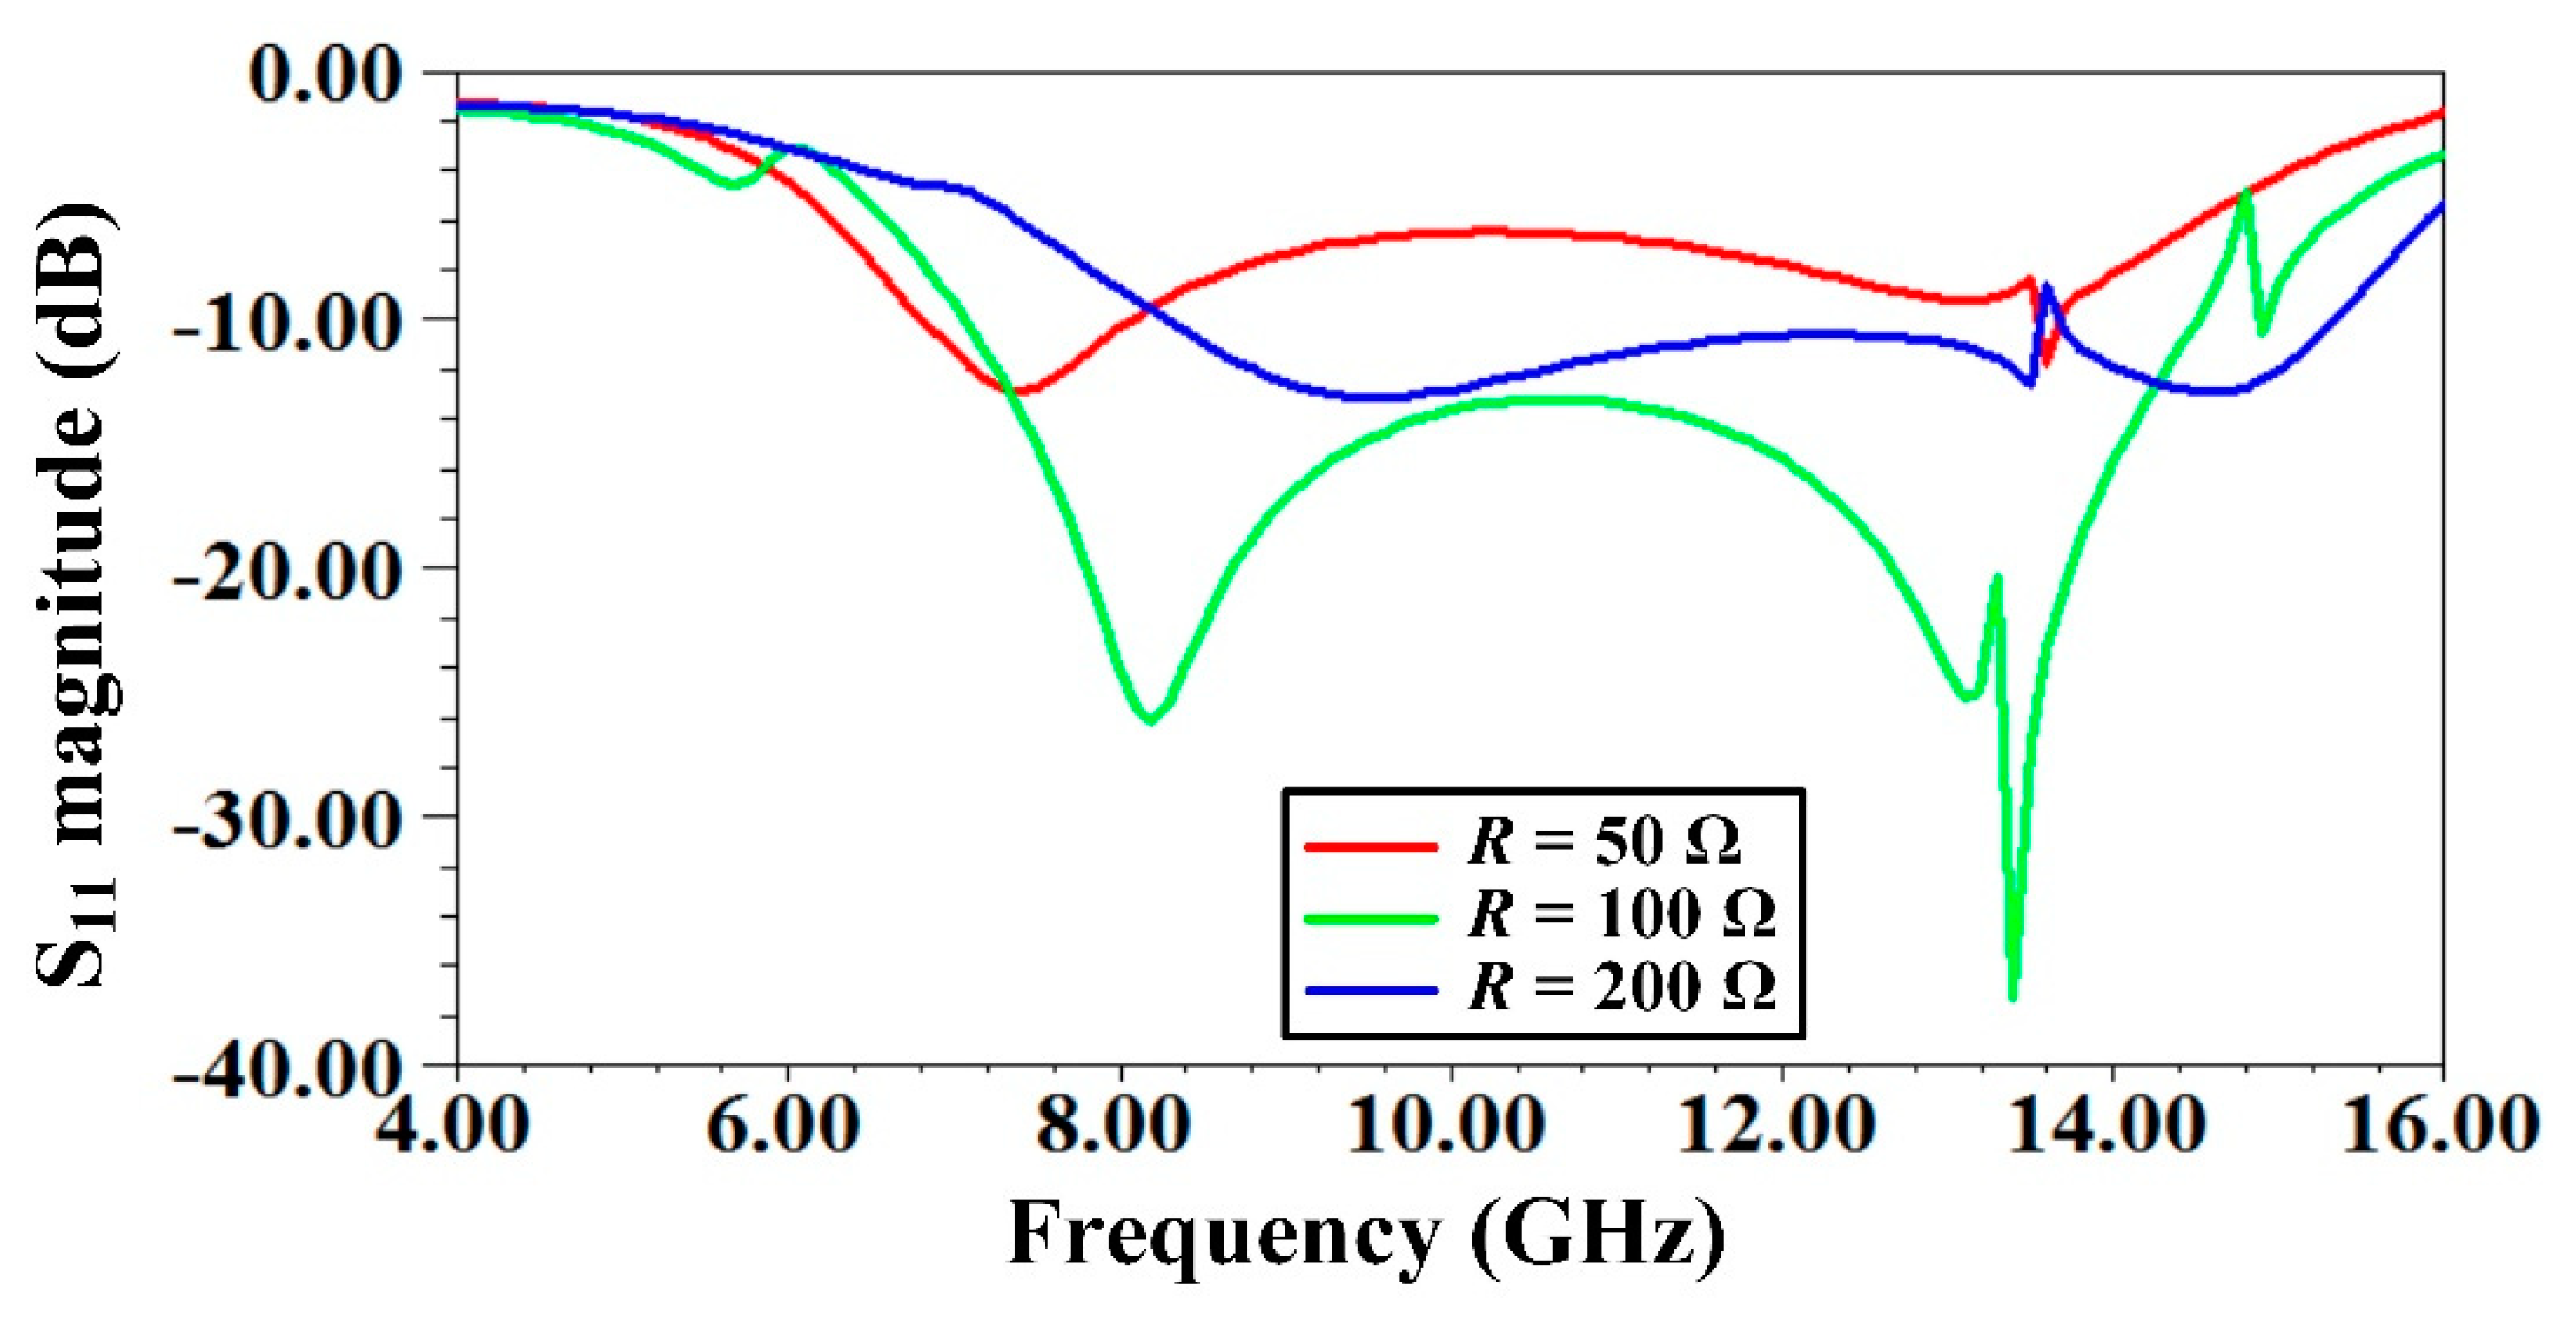
2.3. Parametric Analysis

Next, a brief parametric analysis is presented to help understand how the scattering parameters behave as the structural values are varied. This, in turn, facilitates reaching an optimized unit cell design. The unit cell dimensions included in the parametric analysis are loop length (l), loop width (w), fixed patch length (p), air gap (g), and resistance (R). Only those transmission (S21/S12)/reflection (S11/S22) parameters have been presented that experience a significant impact as a result of the variation of the corresponding structural dimension. Figure 7, Figure 8, Figure 9, Figure 10 and Figure 11 display all the plots that have been studied under parametric analysis. Other than the parameter that is being varied, the remaining dimensions have been kept fixed, and their values are given in Table 1. |S11| corresponding to varying l is shown in Figure 7a, while |S21| is shown in Figure 7b. From the two plots, it is observed that length of the loop plays a significant role in determining the absolute absorption level, as well as its bandwidth. The frequency responses of |S11| and |S21| for various w values are displayed in Figure 8a,b, respectively. The plots show that the changing loop width primarily affects the level of absorption. Therefore, it can be concluded that an optimized set of loop length and width is responsible for achieving the maximum absorption over the widest bandwidth, provided the air gap (g) and resistance (R) are kept fixed. This statement holds true from the perspective of the unit cell that is under discussion; nevertheless, it should be remembered that the loop alone is inherently a narrowband structure.
Next, the variation of p is studied; its |S11|, |S21|, and |S22| are displayed in Figure 9a–c, respectively. From Figure 9a,b, it can be observed that some further fine tuning of absolute absorption can be achieved by tuning p, particularly at the operating frequency. However, the bandwidth of absorption does not show significant dependence on the value of p. Furthermore, from Figure 9c, it can be inferred that the tuning of p also controls the PRS reflectivity value, and thereby the antenna gain enhancement. At operating frequency, the variation of p varies the reflection magnitude from 0.55 (medium reflectivity) to 0.93 (high reflectivity). Thus, the parameter p primarily relates to the radiation property of the antenna. The frequency responses of |S11|, |S21|, and ϕ(S22) against varying g are displayed in Figure 10a–c, respectively. From Figure 10a,b, it is observed that the intervening air gap between the absorptive FSS and PRS plays a significant role in eliminating the backscattered wave. This is evident because the effect on wave refection is more, while it is meagre for the wave transmission. Thus, the bandwidth, as well as the levels of absorption, are highly dependent on the air gap value. The impact of g on the phase of reflectivity (ϕ(S22)) is insignificant (Figure 10c).
Finally, the frequency response of |S11| with respect to R is shown in Figure 11. It manifests that the value of resistor also has a significant effect on the magnitude of incident wave reflection, thereby impacting the absorption phenomenon. Once the impedance of the top surface matches closely to the impedance of the impinging wave, most of the wave is dissipated as heat on the surface of the absorber, and thus the radar backscatter is reduced. The optimized dimensions of unit cell and the F-P cavity are given in Table 1.

3. Simulation Results and Experimental Validation

The simulated model of the designed F-P antenna is shown in Figure 12a. It consists of a 6 × 6 unit cell grid. The excitation source is a square microstrip patch antenna having dimensions of 11 × 11 mm2. The input signal pin is displaced 2 mm towards the positive x-axis, from the center of the patch. It is well known that the conventional F-P cavity resonates at λ/2, if φPRS = φG = π. Therefore, from Equation (1), the cavity height (h) of the proposed design turns out to be 22.73 mm at the operating frequency. However, as the gradient PRS has varying reflection phases over its surface, the final cavity height was optimized to 20 mm, keeping under consideration the antenna matching, tilt angle, as well as the SLL performance. Antenna simulations were carried out using full wave analysis in HFSS. Fabricated prototype is shown in Figure 12b. The top and bottom patterns of the composite PRS dielectric are shown in Figure 12c,d, respectively. A hard foam-type material was precisely cut and used as an air gap spacer between the antenna and PRS, as well as between the PRS and absorptive FSS. A small amount of glue was applied to attach the spacers and the structure. Some taping was done additionally, across the four sides, in order to keep the structure strongly intact. This made the structure robust enough for testing and repeatability. The soldered RF resistors were high frequency resistors from Vishay. Anechoic chamber testing was performed for measuring far-field radiation and radar scattering properties. S-parameter measurement was done on Keysight’s network analyzer. The increasing gradient was implemented along negative x-axis. The final optimized lengths of the square gradated patches along with their reflection phase values are given in Table 2. These gradient values were achieved by parametric optimizations of the patch sizes, and the corresponding reflection phases were extracted from the unit cell simulations. A different set of gradient values would be required in order to steer the main beam to a different tilt angle; therefore, a steering model developed in [28], which predicts the tilt angles, could be of great insight.

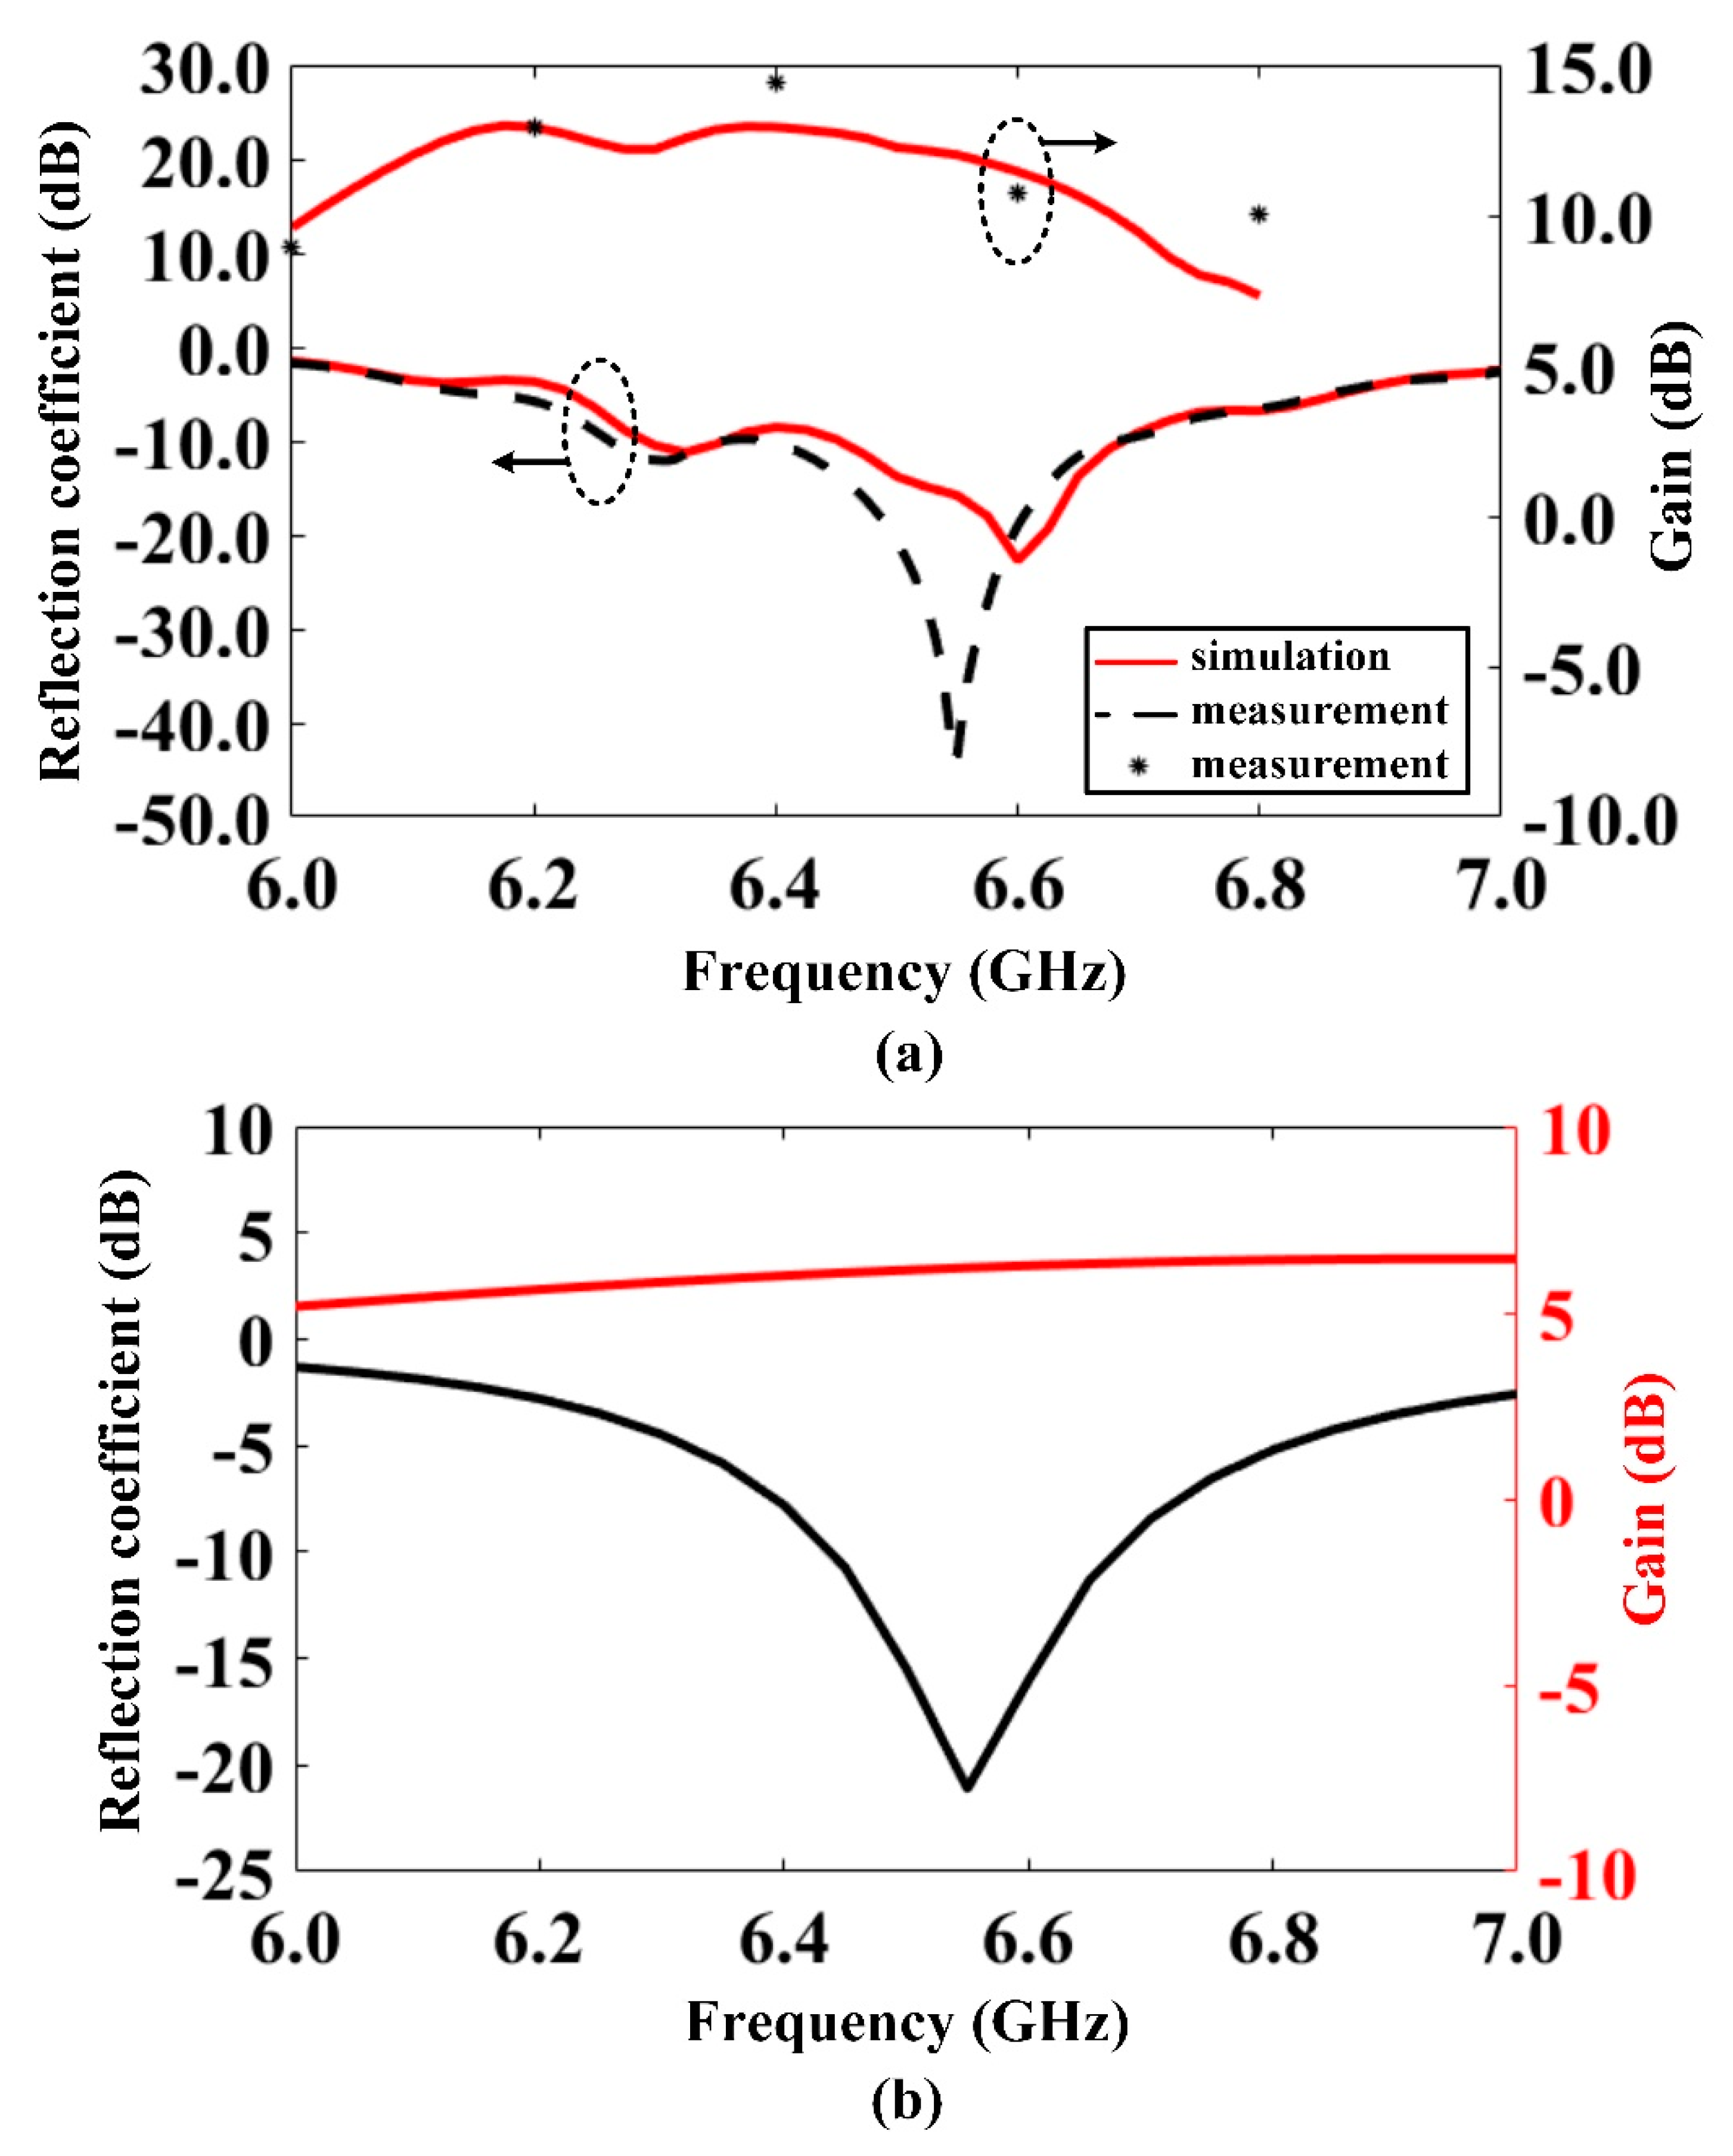
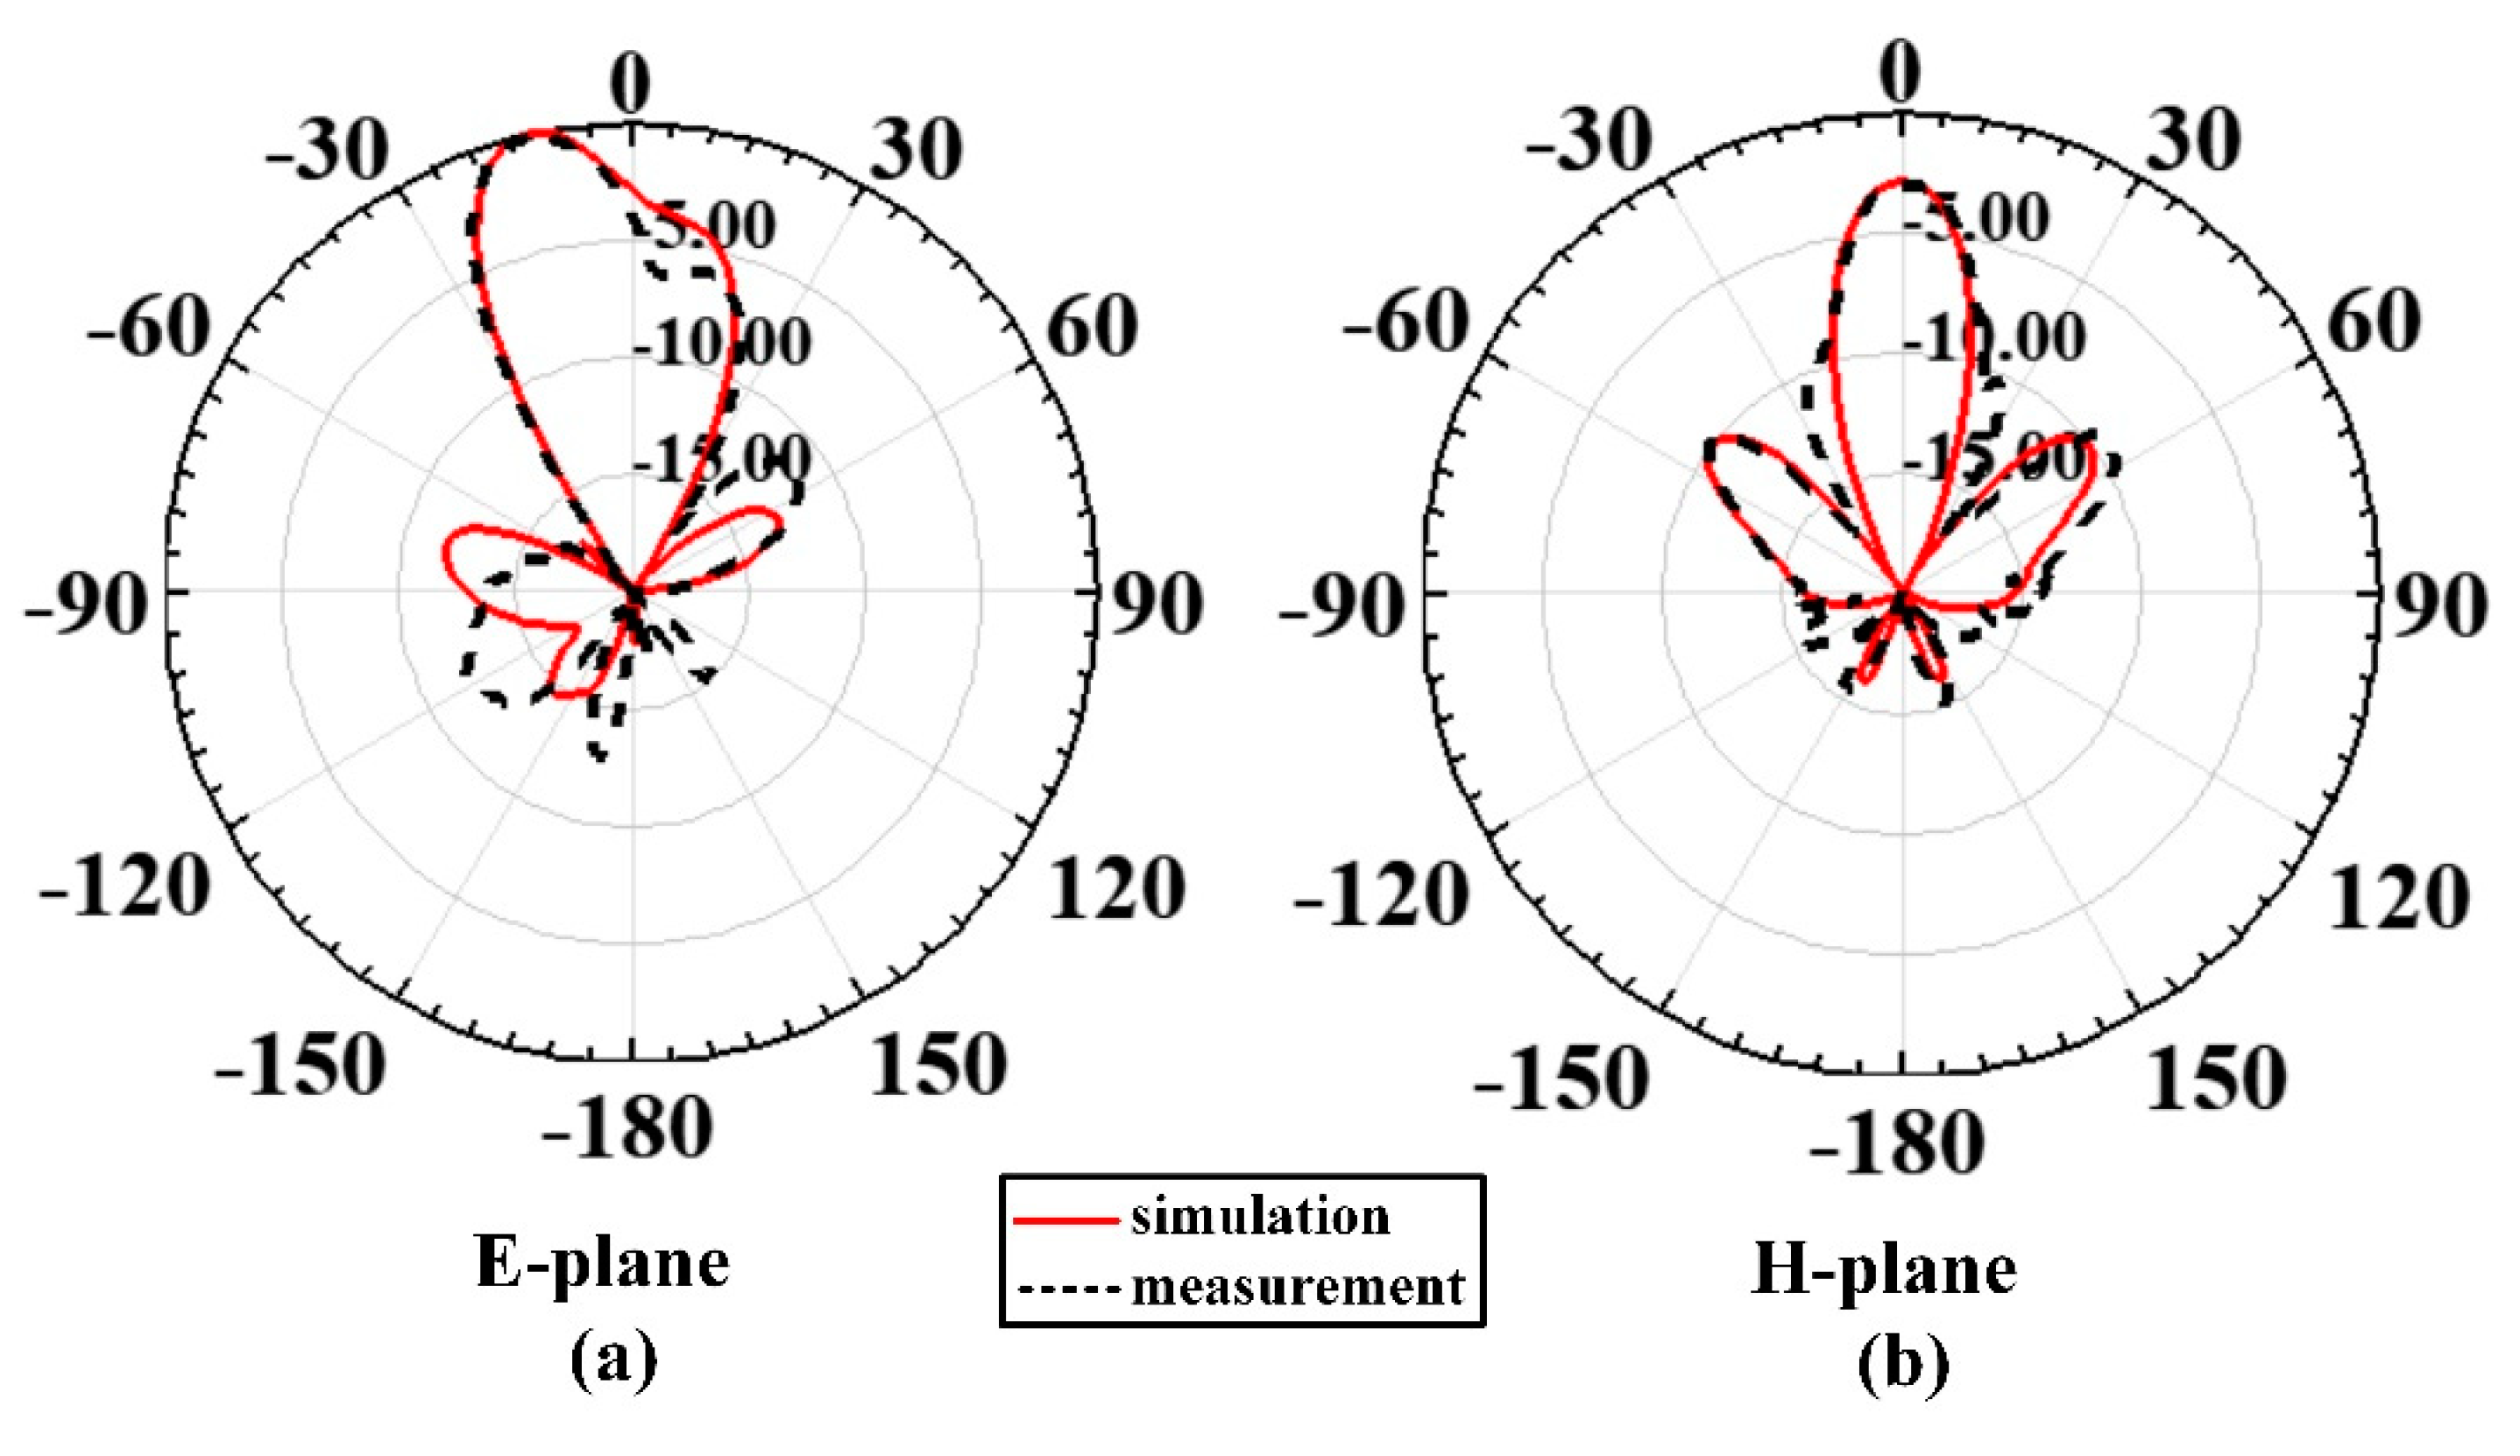
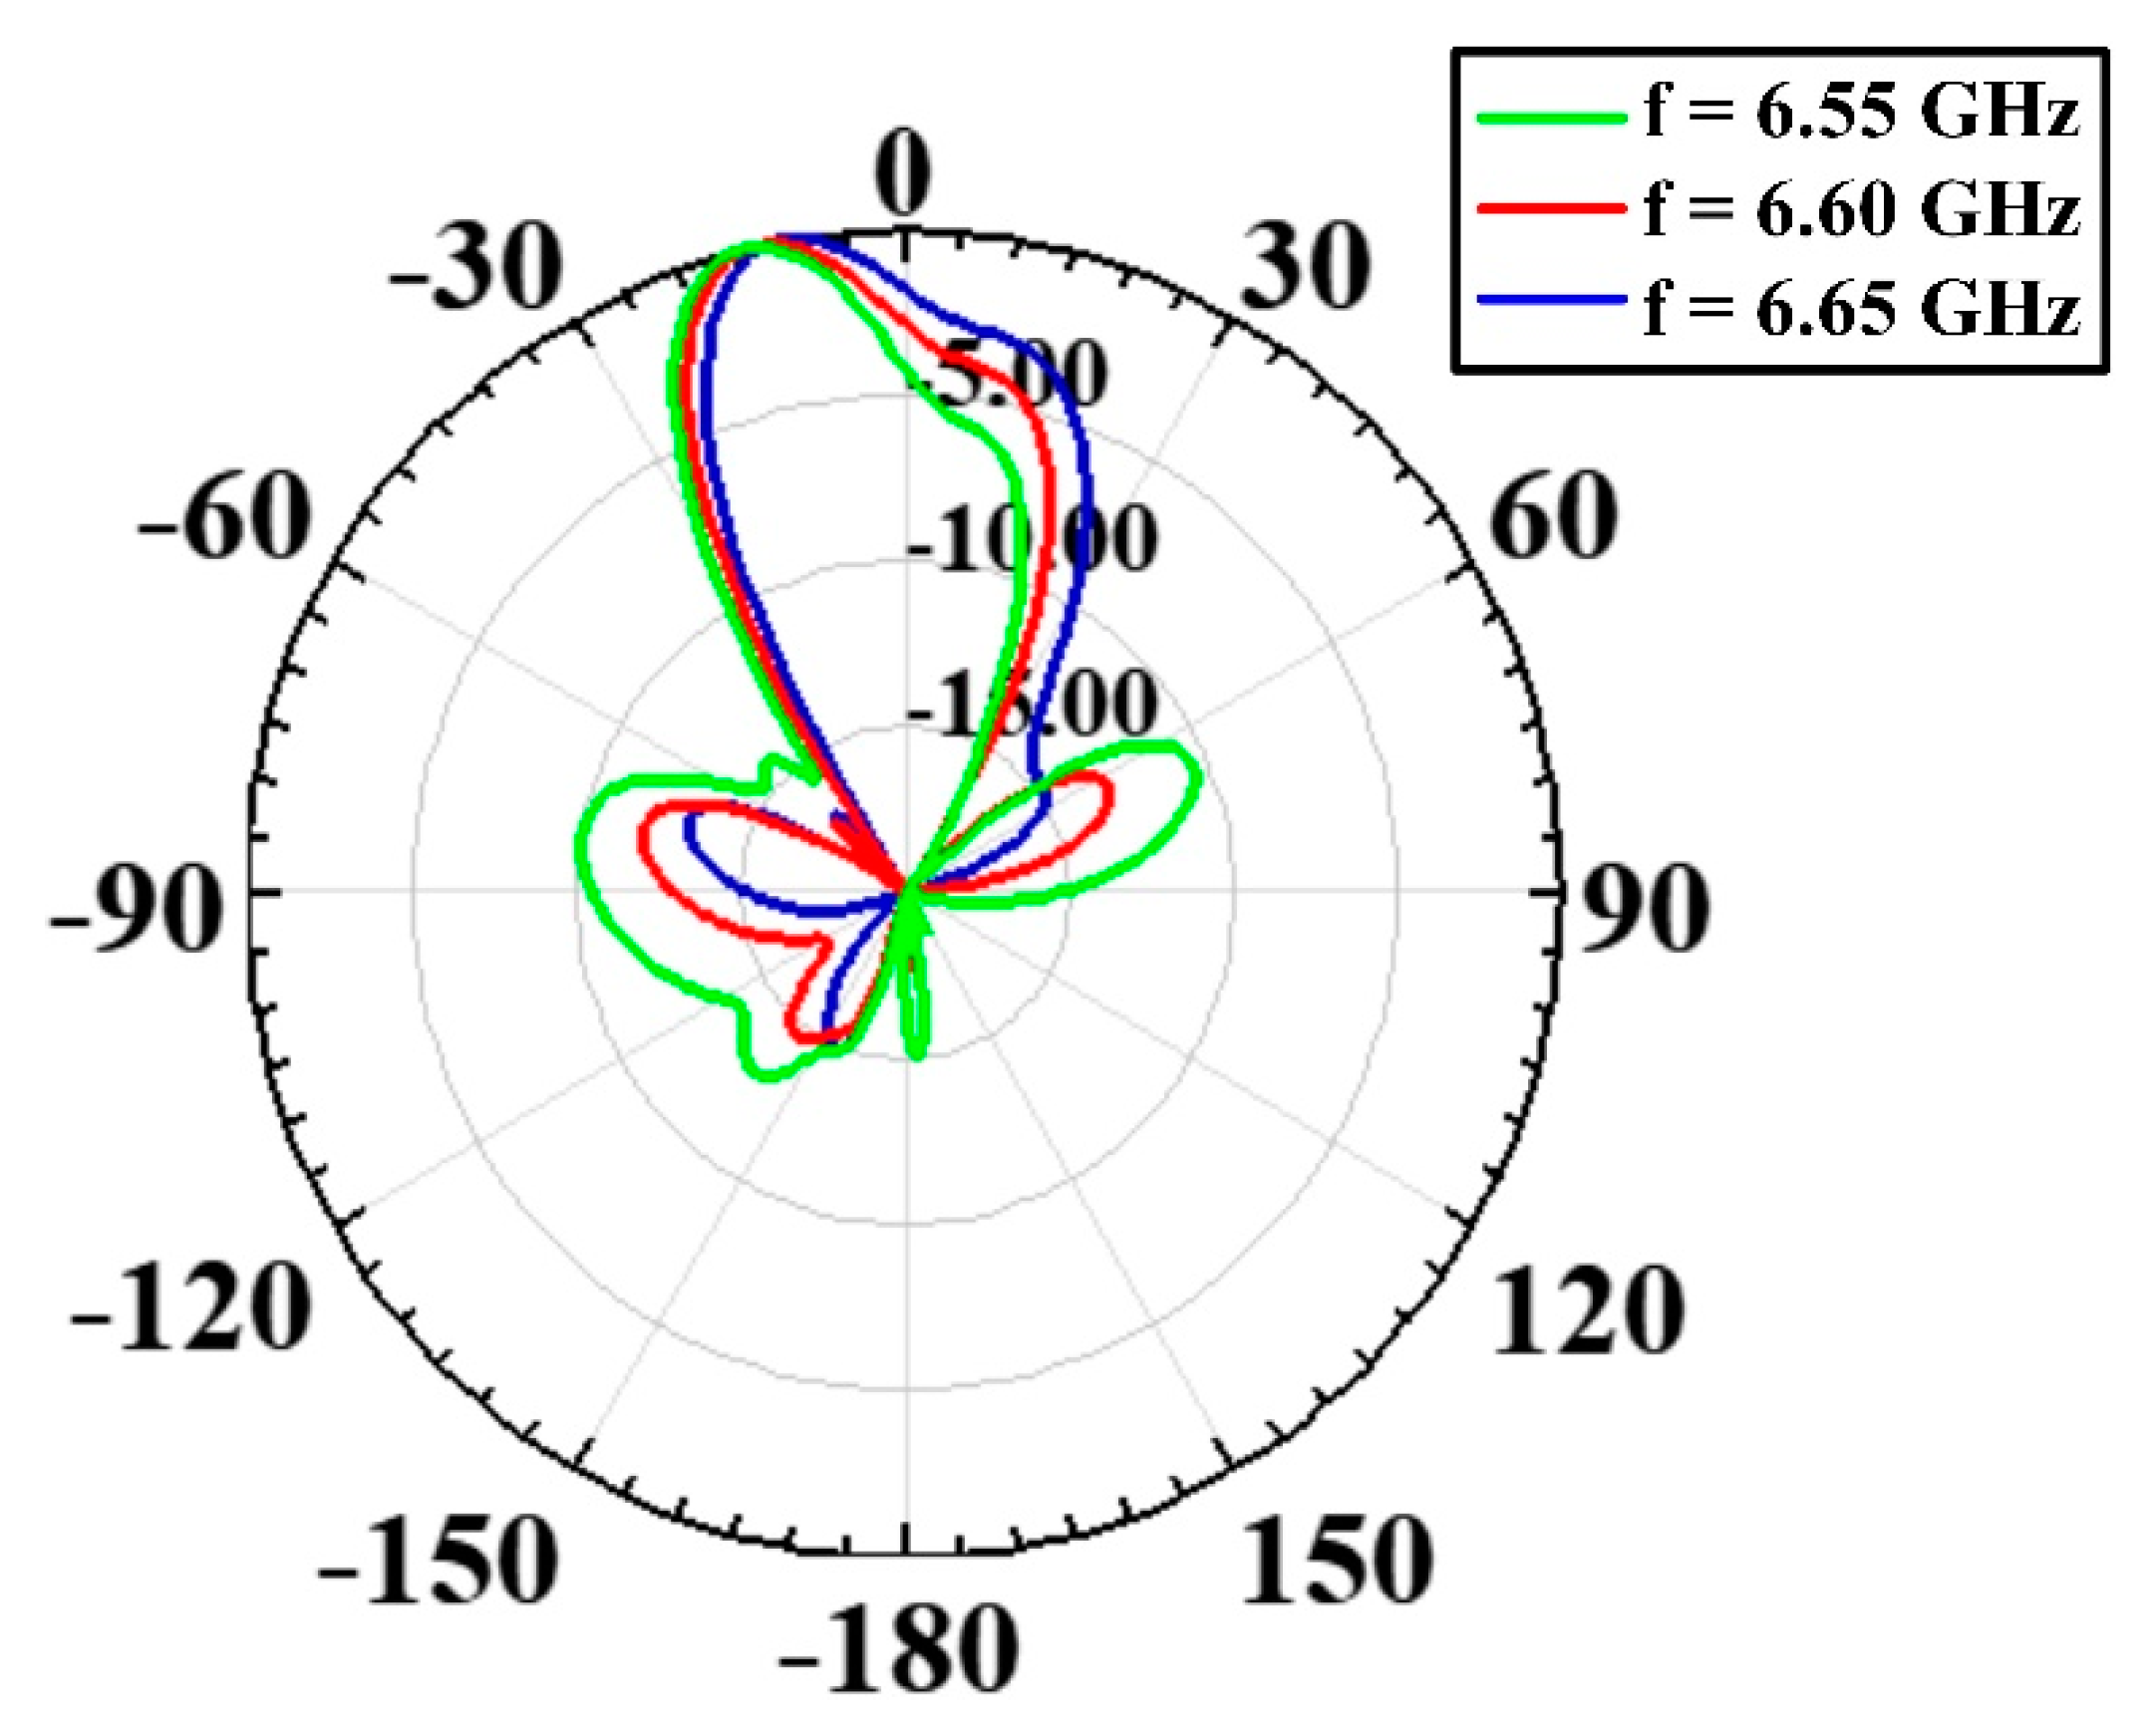
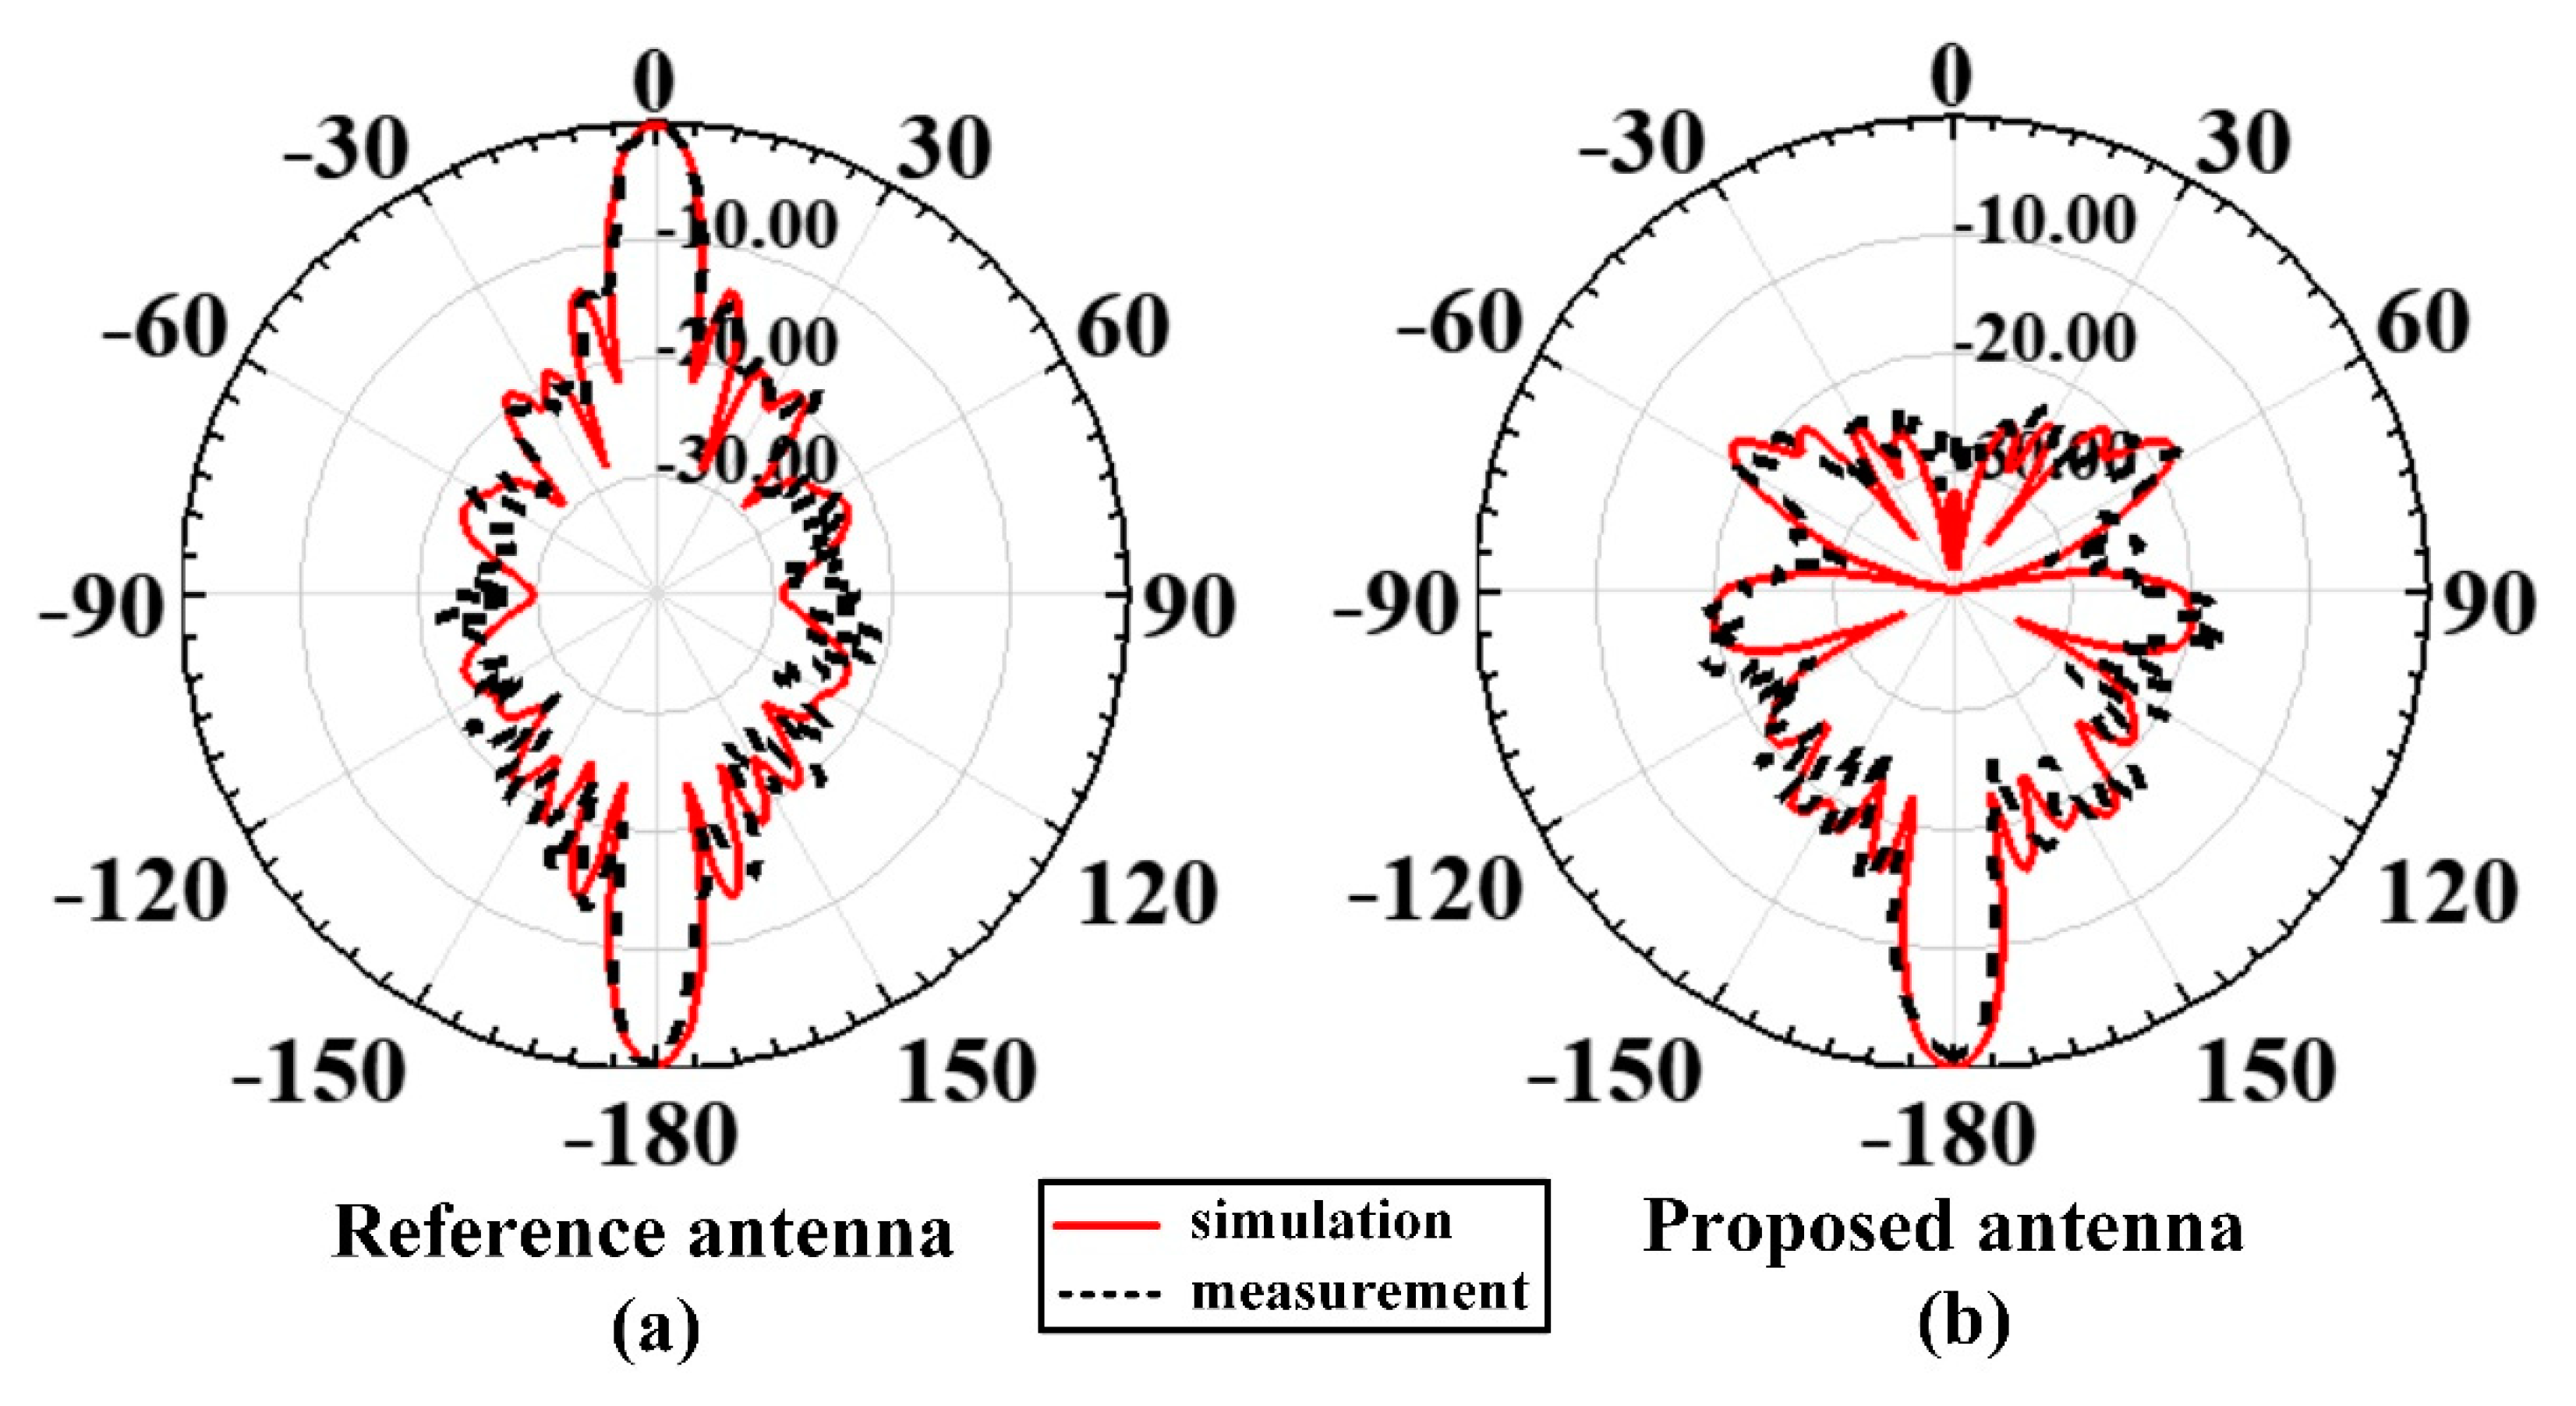
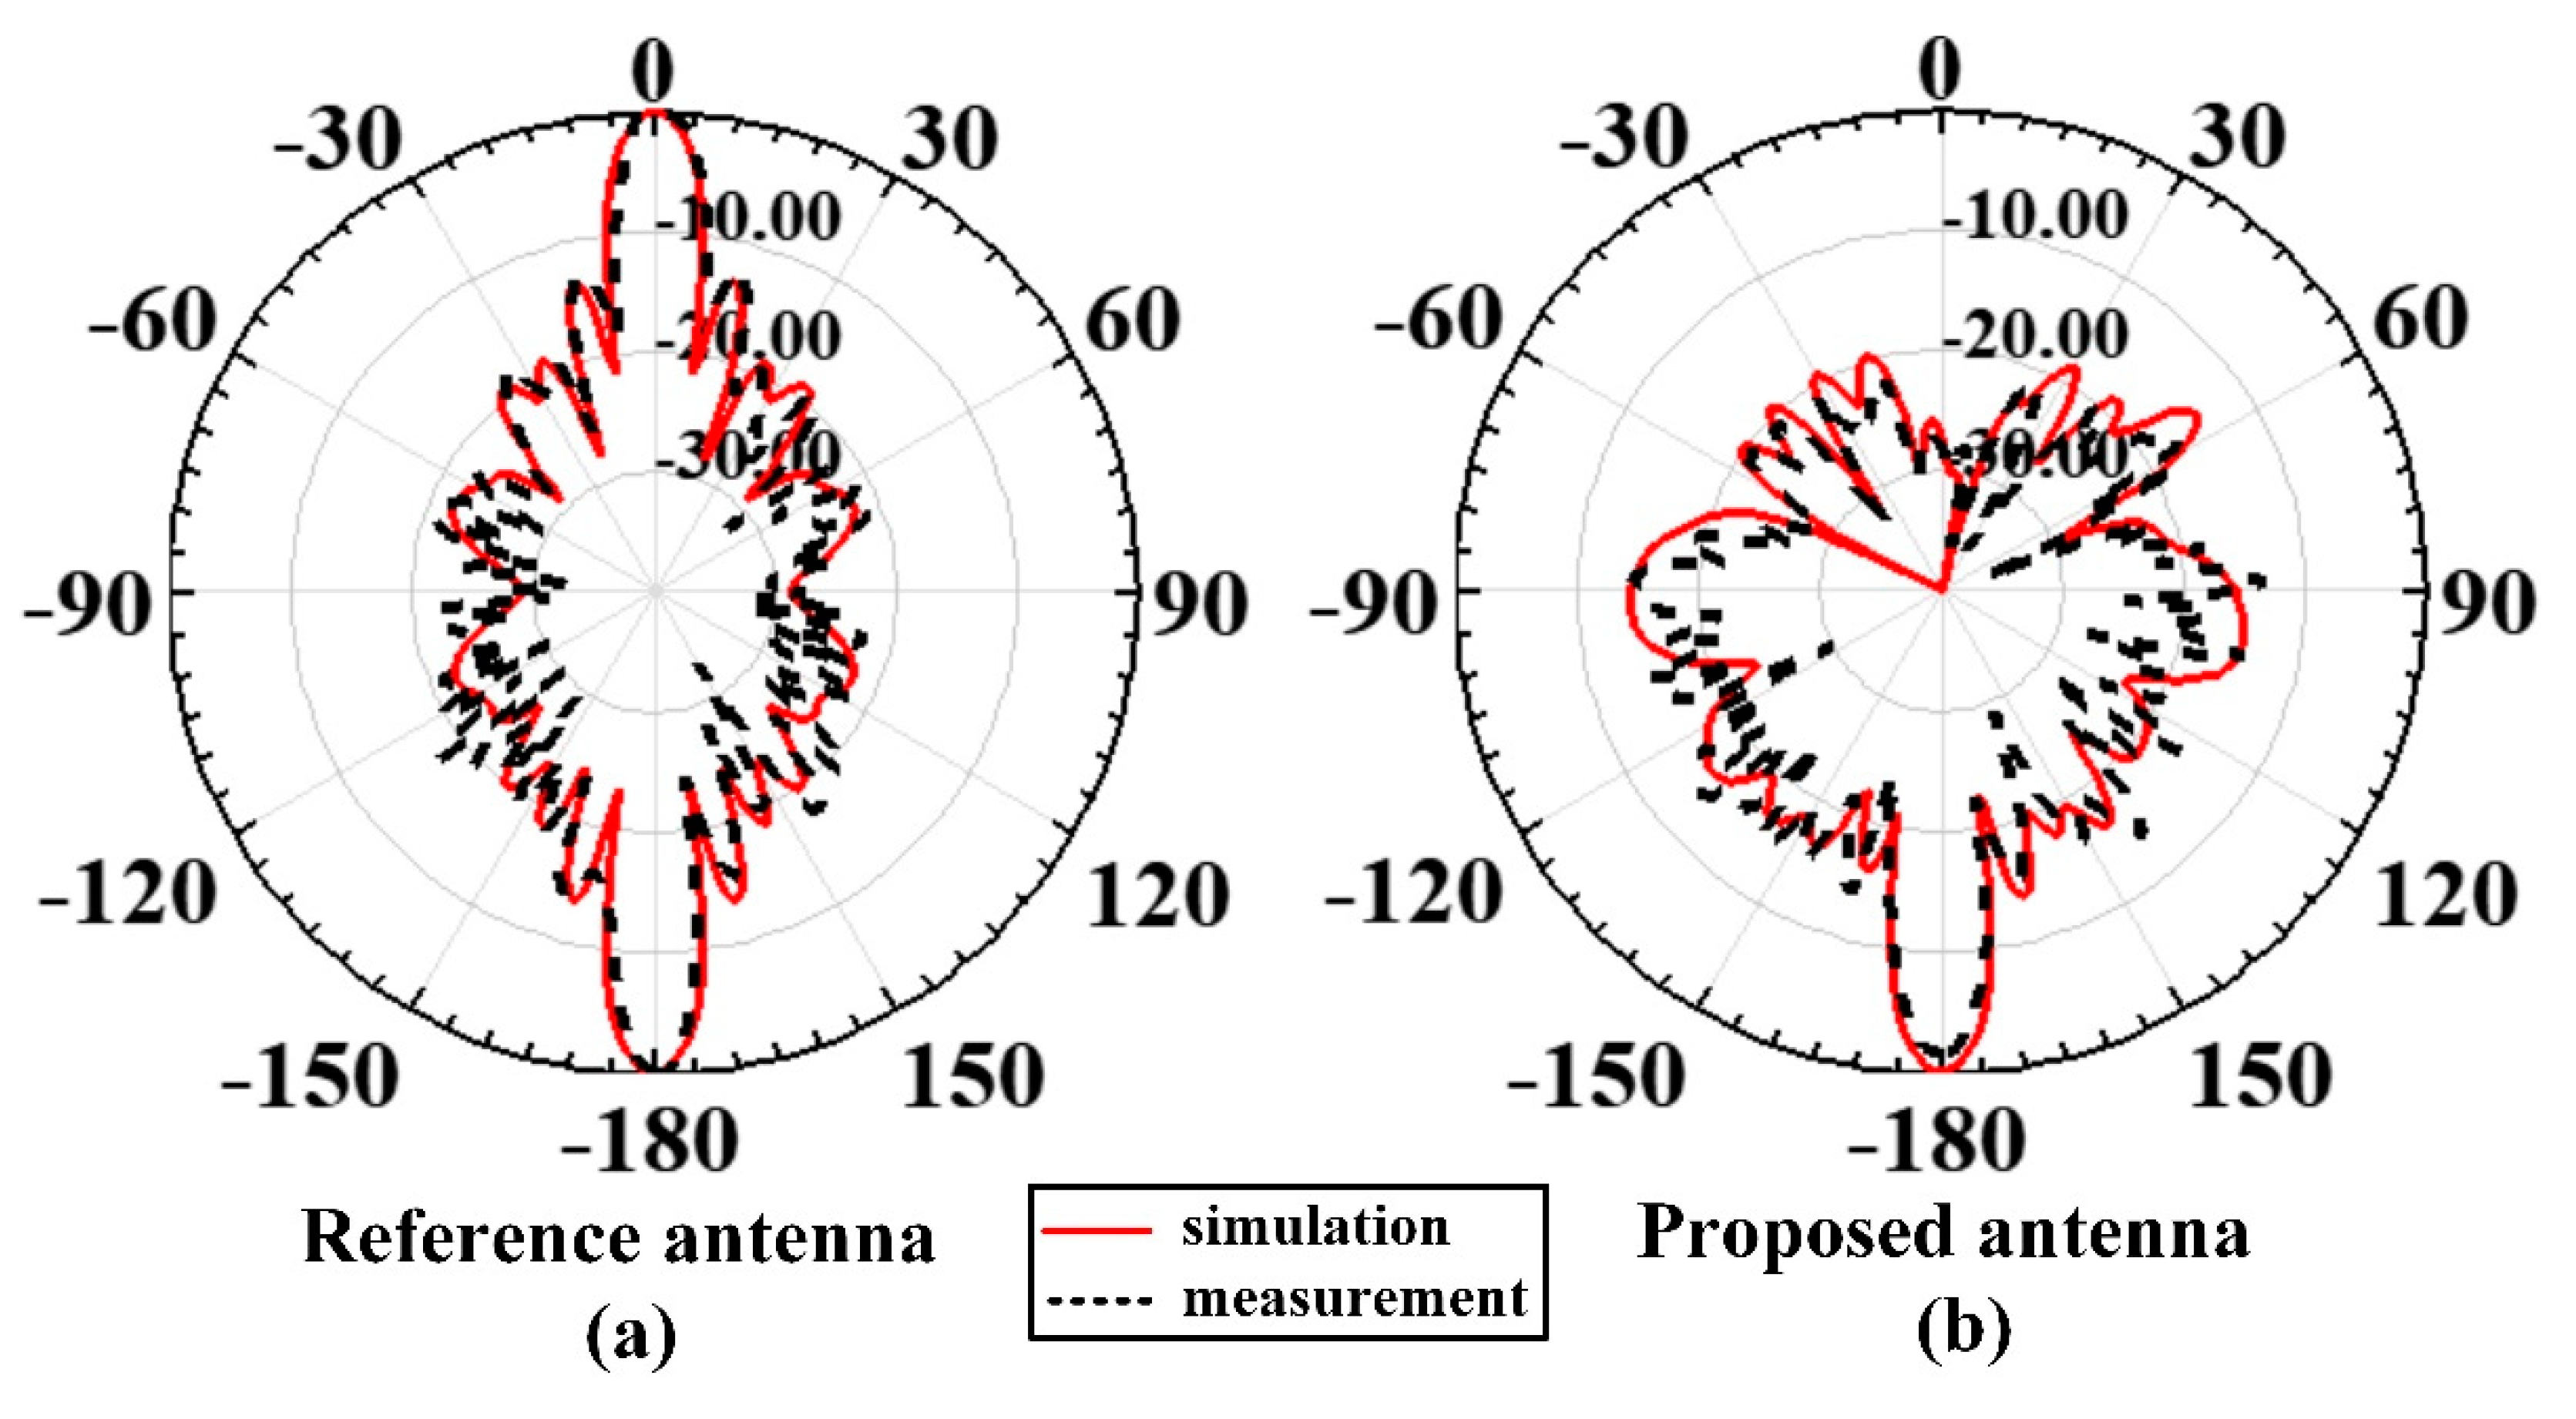
3.1. Antenna Results

The simulated vs. measured reflection coefficient (S11) plot of the proposed F-P design is shown in Figure 13a. The −10 dB impedance bandwidth (BW) is 240 MHz (3.65%), extending from 6.45 GHz to 6.69 GHz, and a good impedance match is achieved at an operating frequency approaching −23 dB. The measured result follows the trend of the simulated plot; the discrepancy is attributed to manufacturing tolerances. The frequency response of gain for the proposed antenna is also given in Figure 13a. The maximum achieved gain is 11.5 dBi. The 3 dB gain bandwidth is ~750 MHz (11.76%) and extends from about 6 GHz to 6.75 GHz. The measured response is in satisfactory agreement with the simulation results. The left shift of the maximum gain frequency could be because of the final height of the cavity, which had been slightly varied in the simulations to fine tune the tilt angle/gain, the side lobe levels (SLLs), and antenna matching. The plots in Figure 13b display reflection coefficient, and gain vs. frequency, of the reference antenna (antenna without the PRS and the absorptive FSS). When reflection coefficient responses of the proposed and reference antennas are compared, it is observed that both antennas are well matched at operating frequency. When gain responses are compared, it can be seen that the presence of the superstrate structure above the reference antenna increases its gain by 5.24 dB.
The radiation efficiency of the reference antenna at 6.6 GHz is 95%. The radiation efficiency of the proposed antenna reduces to 79% (which is expected). This reduction in efficiency is attributed to the radiated wave’s energy losses within the conductors, dielectric, and resistors of the superstrate structure.
The radiation patterns of the proposed design at operating frequency are given in Figure 14. The E-plane radiation pattern is displayed in Figure 14a. As can be seen, the peak radiation is deflected from the boresight. The main lobe appears at a tilt angle of 13°, with SLLs below −12 dB. The measured pattern agrees well with the simulated pattern. The tilt appears in the axis in which the gradient has been implemented, i.e., the x-axis, as per Figure 12. The beam deflection occurs towards the negative x-axis, as patch elements from the positive x-axis towards the negative x-axis show gradual phase lag, realized by gradual increase of patch length [29]. Simulated and measured H-plane patterns are shown in Figure 14b. The half power beamwidths (HPBWs) for E-plane and H-plane are 23° and 20°, respectively.
To highlight how the radiation pattern changes with frequency, Figure 15 illustrates radiation patterns plotted at three different frequencies. Satisfactory main lobe deflection can be observed over a bandwidth of ~100 MHz, with more or less similar tilt angle. With an increase in frequency, SLLs decrease; however, at the same time, pattern broadening occurs.

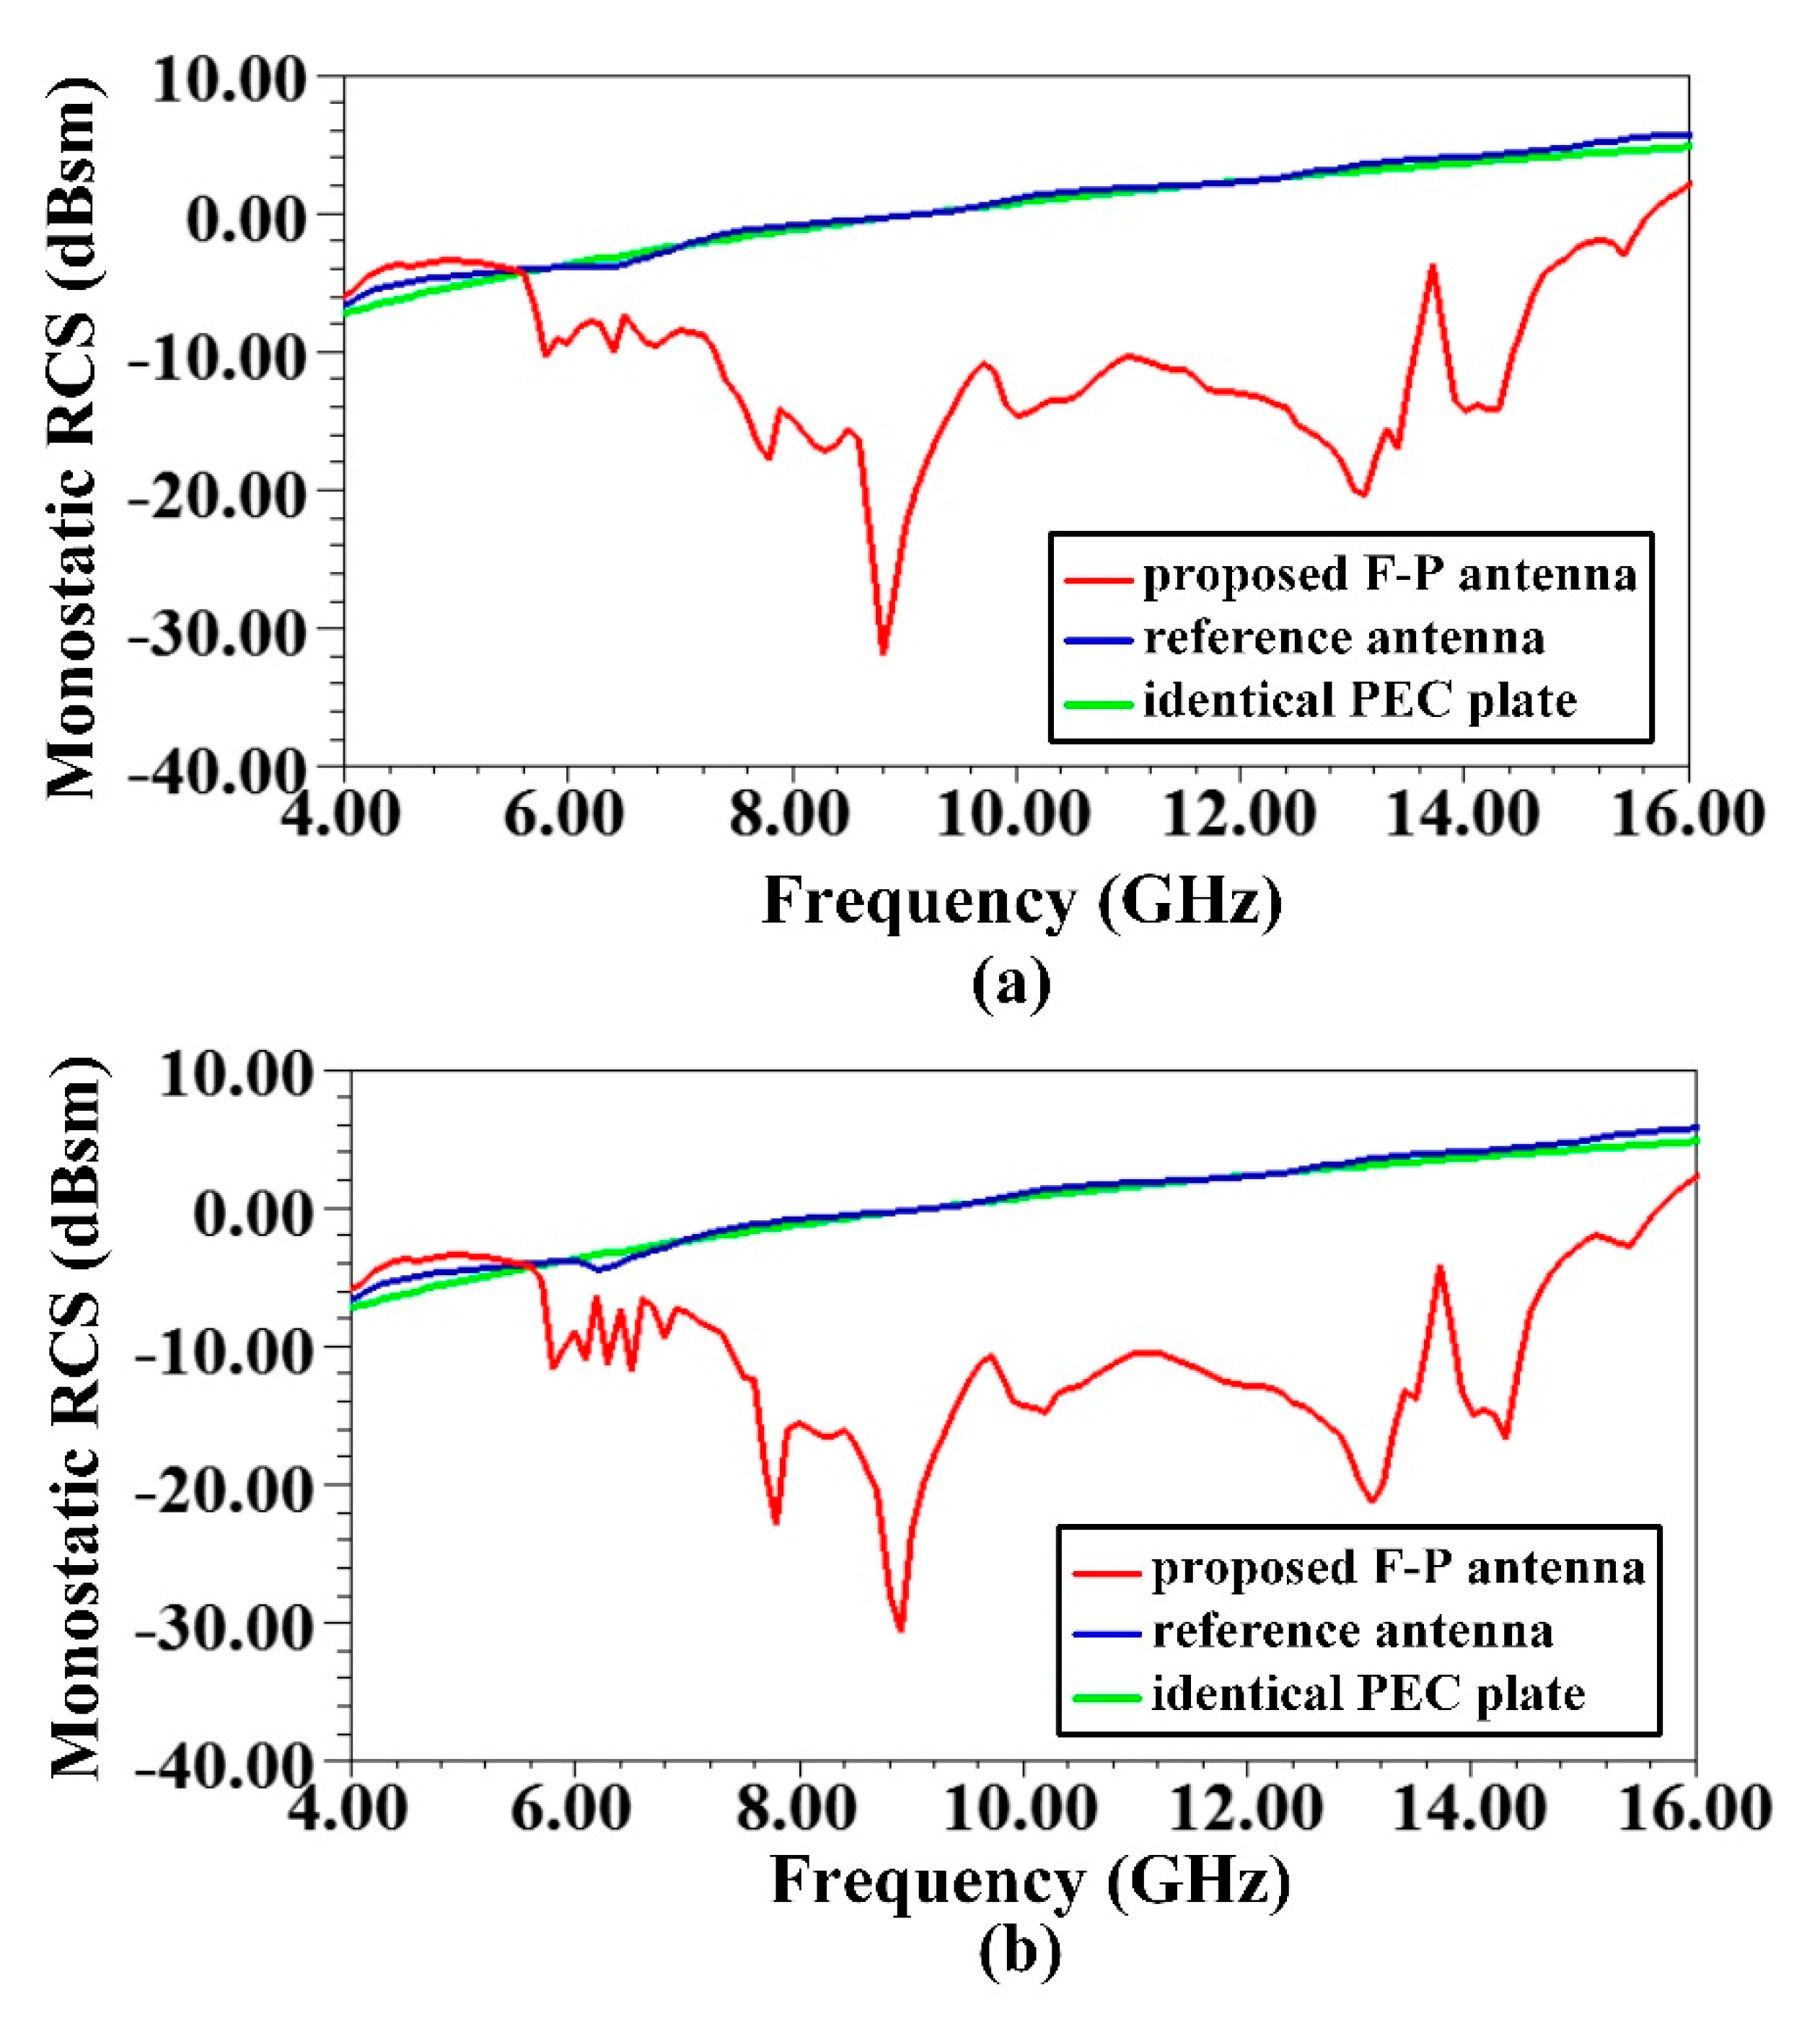
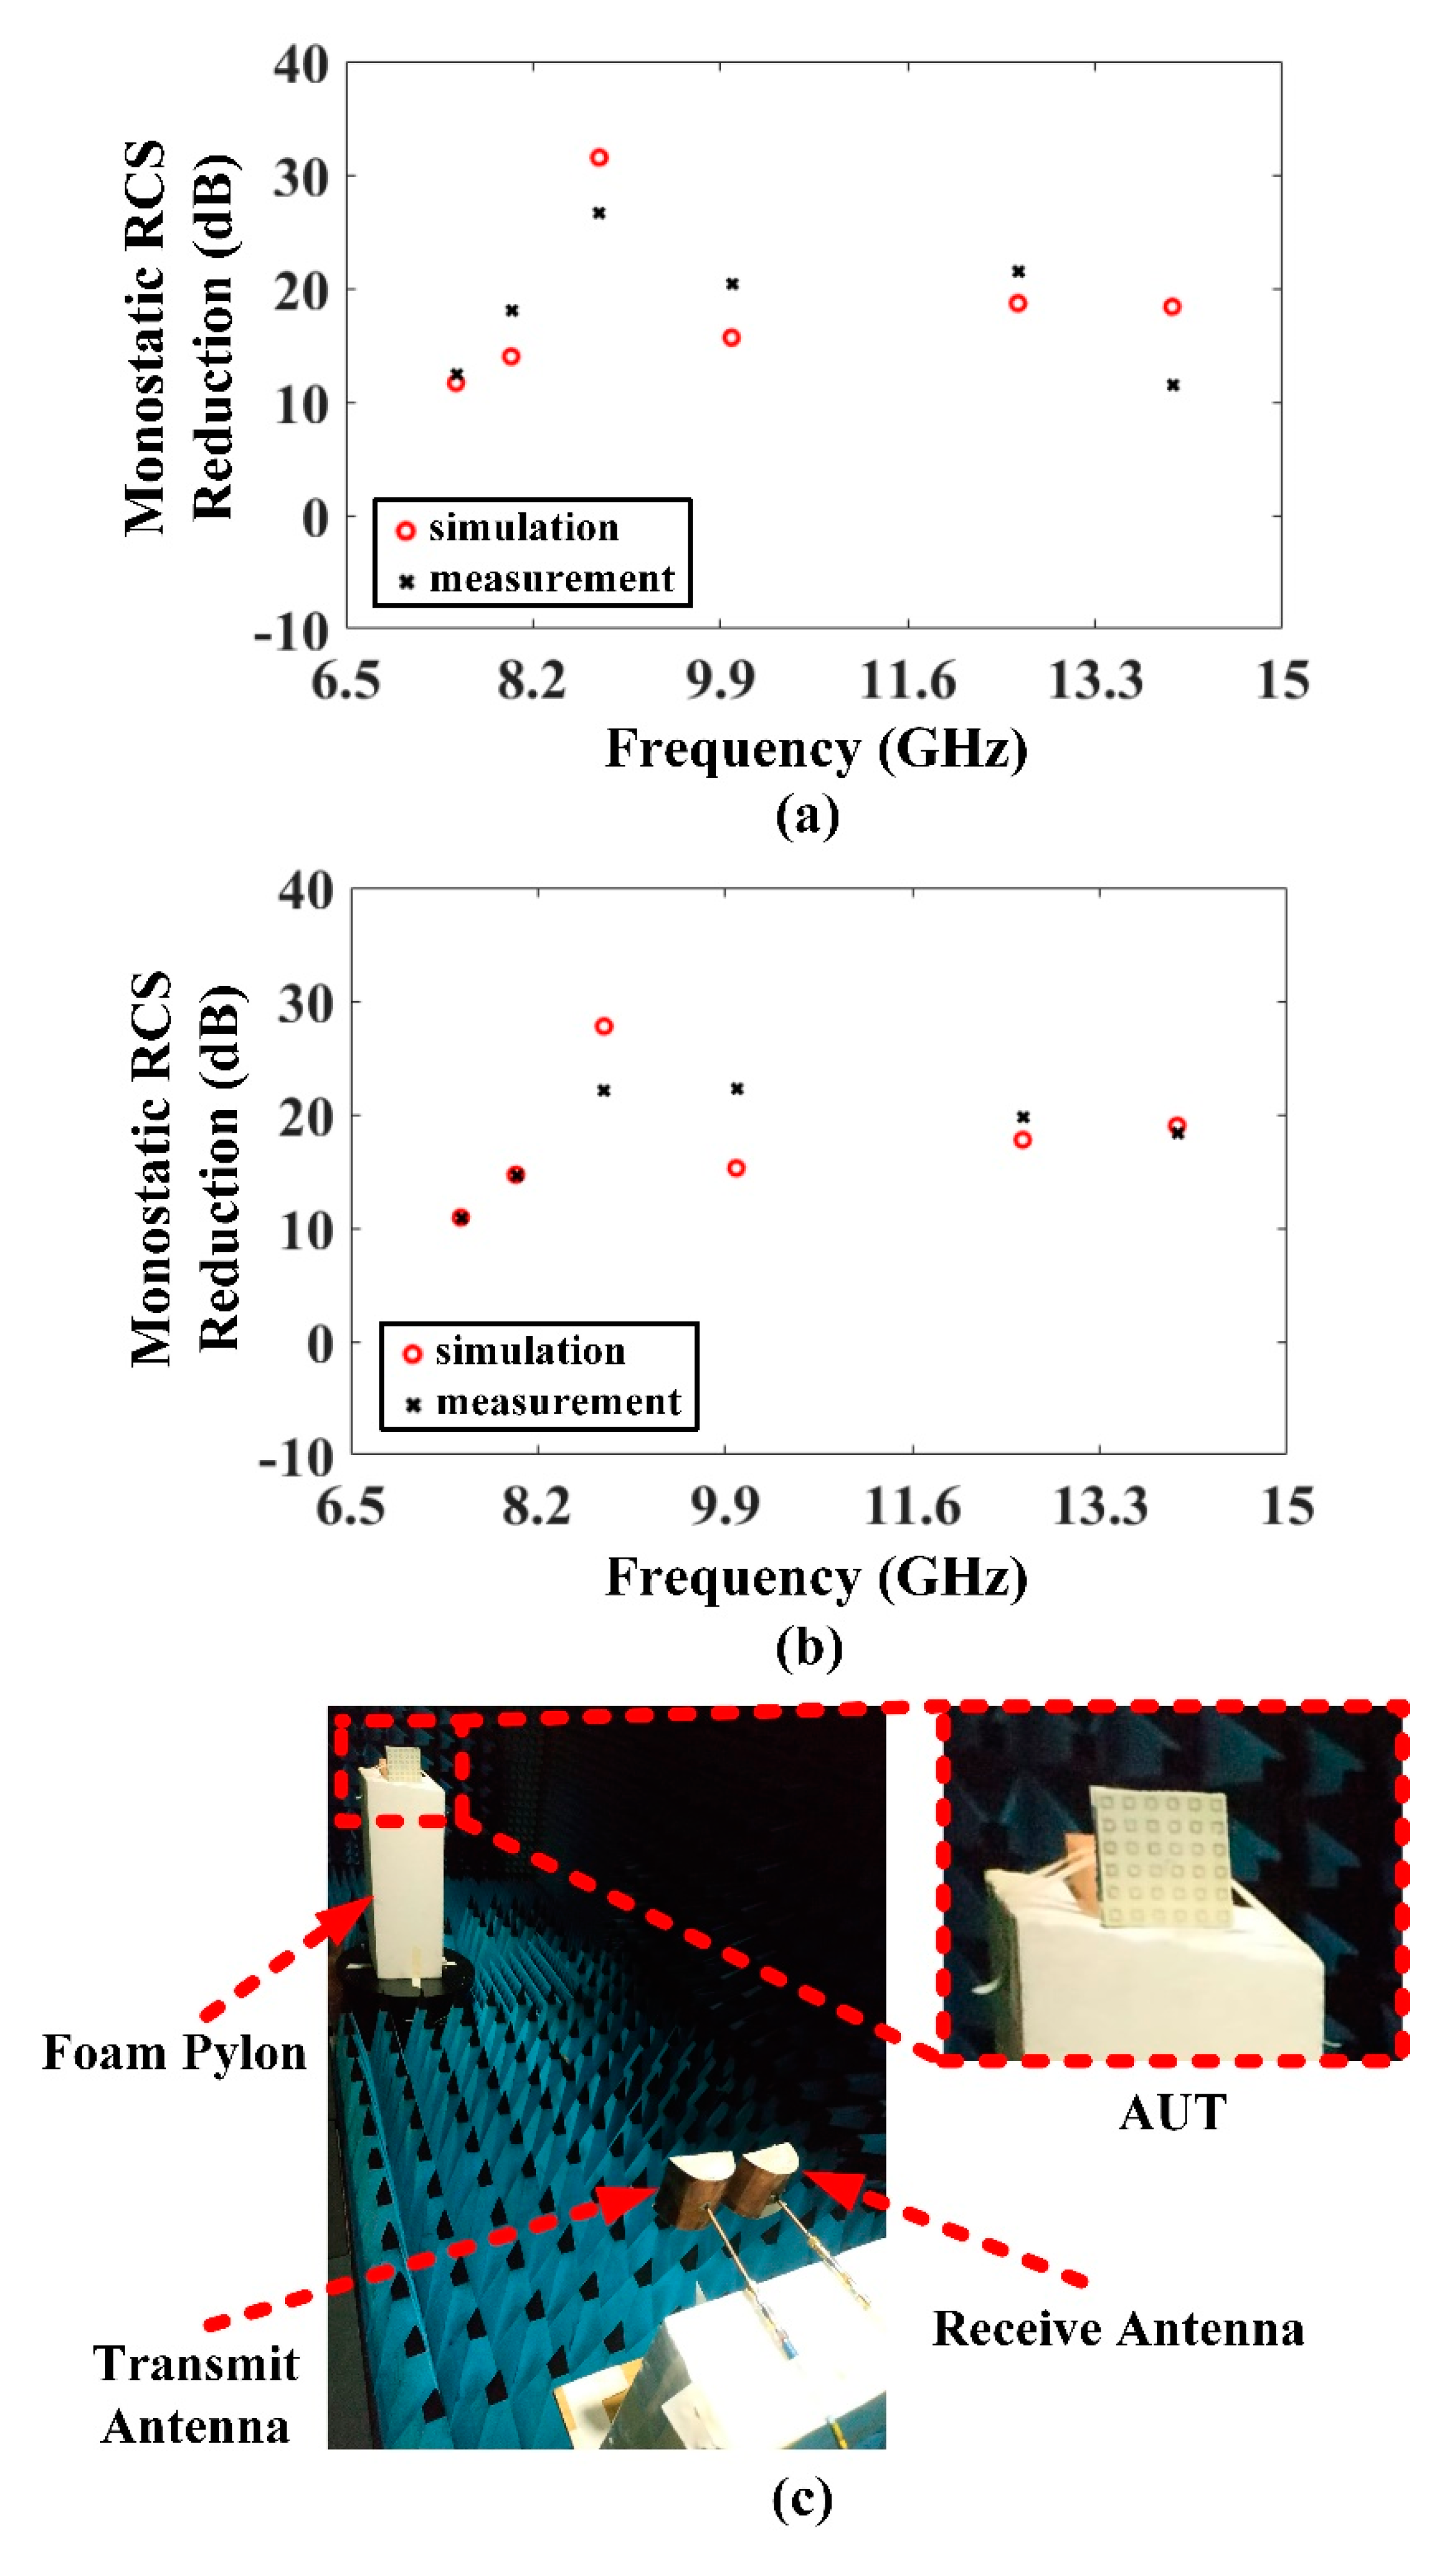
3.2. Scattering Results

Next, monostatic backscattering performance of the F-P antenna is presented. The focus of this work is on monostatic RCS reduction, as in most real-world applications, such as surveillance/reconnaissance radars, the transmitter and receiver are co-located. The simulated monostatic RCS frequency response for a normally incident x-polarized (x-pol) wave is shown in Figure 16a; also included in this plot is the simulated reference RCS of a patch antenna, and calculated RCS of a perfect electric conductor (PEC) plate of similar size. It can be observed that the RCS of reference patch antenna is identical to that of a PEC plate. The radar cross section of the PEC plate can be calculated using the following Equation (3):
σPEC = 4πS22
where σPEC represents radar cross section of PEC plate (m2), S is the surface area of the PEC plate (m2), and λ is wavelength. For the proposed antenna, as is evident from Figure 16a, wideband RCS reduction including in-band frequencies is achieved spanning 5.6–16 GHz, equaling 96.3% bandwidth. The maximum reduction is 31 dB, occurring at 8.8 GHz. Over the entire band, the average RCS reduction is 13 dB. Around operating frequency, the RCS reduction degradation is as expected, and still 5 dB of reduction, from the reference antenna, is achieved. Likewise, for y-pol normally incident wave, simulated frequency response of monostatic RCS is shown in Figure 16b. The RCS reduction performance is almost symmetric to Figure 16a. In this case also, wideband RCS reduction from 5.6 GHz to 16 GHz (96.3% BW) is achieved. The in-band RCS reduction is more than 3 dB. About 30 dB of maximum RCS reduction occurs and appears at 8.9 GHz. The average RCS reduction is 13 dB for y-pol incident wave. The scattering performance for the reference and proposed antennas are shown for the matched impedance case.
Referring back to Figure 4, some peaks can be observed around 14 GHz and slightly higher. In fact, there are two sets of such peaks, one at roughly 13.8 GHz, and the second around 15 GHz. For the first set, if we observe Figure 4a, it can be seen that these peaks have a dynamic range of about 37 dB. At the same frequency, the peaks shown in Figure 4b have an almost insignificant dynamic range, and hence Figure 4a would primarily dictate the way the wave would interact with the top surface at this frequency. Figure 4a indicates the reflection response of a wave incident towards the negative z-axis. The response is shown for different patch sizes (v values), and their combined effect in the full structure would in fact increase the overall reflection. This implies that the RCS reduction should deteriorate at this frequency. This sudden RCS deterioration can clearly be observed at exactly the same frequency in Figure 16a,b.
The results in Figure 4 have been obtained from unit cell simulations (periodic boundary conditions and Floquet ports), whereas the results in Figure 15 have been obtained from the actual structure simulation (using perfectly matched layer (PML) boundary setup). Therefore, it can be inferred that the sudden peaks observed in Figure 4a are not a simulation artifact; rather, these represent the actual resonance of the structure. For the second set of peaks, their dynamic range is not significant enough to be easily identifiable in Figure 16, although a corresponding little impact can still be observed.
In order to validate the measured RCS frequency response performance, two pairs of in-house fabricated parabolic reflector antennas, with half wave dipole sources, were utilized to determine the scattering performance. Six discrete frequency points, spread over the frequency range of interest, could be measured. One significant advantage of using these antennas is that their form factor is smaller as compared with horn antennas, and hence the practical monostatic RCS measurement (which is in fact a quasi-monostatic environment) is closer to the ideal simulated (pure) monostatic environment. Figure 17a,b presents the comparison between simulated and measured RCS reduction for x-pol and y-pol of the incident wave, respectively. It can be witnessed that the achieved measured reduction values satisfactorily follow the simulated performance on all frequency points, and hence the measurement can be considered to be a successful validation of the design concept. Figure 17c shows one scenario of the measurement setup. The proposed as well as reference antennas were terminated with a matched impedance for scattering measurements. To further elaborate, simulated vs. measured RCS reduction values at the measured frequency points are listed in Table 3. The absolute difference between simulated and measured average RCS reduction is less than 0.5 dB for both polarizations of the incident wave.
To show angular (±90°) stability of the design, the response of monostatic RCS against oblique angle incidences for orthogonal polarizations has also been investigated. For the yoz principal plane with x-pol incident wave, Figure 18a displays simulation vs. measurement plot of normalized monostatic RCS angular response for the reference antenna, and Figure 18b displays the same for the proposed prototype antenna. Likewise, for xoz plane with y-pol incident wave, Figure 19a shows simulation vs. measurement plot of normalized monostatic The RCS angular response for the reference antenna, and Figure 19b displays the said plot for the prototype antenna. All these patterns have been plotted at 8.8 GHz. For the yoz plane, about ±13° of RCS reduction is achieved, while this value increases to ±18° for the xoz plane. For both planes, the maximum value of RCS reduction exceeds 27 dB, and therefore this means that significant portion of the incident wave is being absorbed at the resistive surface of the antenna. The measured results are in sufficient agreement with the simulation results, and the discrepancy witnessed can be attributed to measurement setup issues.

4. Discussion

To compare and analyze the proposed work with similarly reported works, Table 4 is presented. In all previous works, it can be observed that the peak radiation is oriented towards the broadside, unlike the proposed antenna. The upfront advantage of the proposed antenna over other works is its tilted beam radiation at an angle of 13°, achieved in parallel with the RCS reduction, as well as gain enhancement. When gain is compared, although it is slightly lower than other designs, nevertheless, the cavity size as well as the cavity height is also smaller as compared with other designs [24]. More importantly, the achieved gain value is also at a tilt angle, and the lower value of gain can be attributed to scanned angle loss [30]. The average RCS reduction is better than most of the works, and the RCS reduction bandwidth is also wider as compared with other designs. The proposed antenna, in particular, can benefit applications in the military realm where low radar signature platforms are of utmost importance. One example is a Side-Looking Airborne Radar (SLAR), which employs side looking antennas [18]. Multiple input multiple output (MIMO) technology is also paving its way into military applications [5,6], and as such, the proposed work can be extended towards realization of low RCS MIMO antennas drawing diversity gain achieved through pattern decorrelation [31]. In fact, for any general military application where off-the horizon communication is desired, the proposed low RCS tilted beam antenna would be more beneficial over a low RCS broadside beam antenna.

5. Conclusions

In this work, a low RCS high gain F-P cavity antenna is presented, which employs a phase gradient surface to achieve an additional functionality of beam deflection. The design incorporates an absorptive FSS, consisting of lumped resistors soldered in periodic square loops, and a composite PRS. The upper surface of the PRS is a uniform layer of periodic patches. The bottom layer consists of variable length patches to realize the gradient implementation. The patch antenna acts as the excitation source of cavity formed between ground plane and PRS. A high gain beam with 13° tilt angle in the elevation plane is achieved, along with wideband RCS reduction. The average RCS reduction is 13 dB over a bandwidth of 5.6–16 GHz (96.3%), which also includes in-band frequencies. Future extension of this work can be the further enhancement of the in-band RCS reduction by implementation of in-band metamaterial absorber, or any other strategy. Improvement of the tilt angle by employing multiple gradient layers can also be considered. Having low RCS property, it is feasible to use the antenna with low scattering defense/military platforms, and particularly where communication is desired in a fixed off-the-horizon direction. It is believed that this research will attract further interest in the use of PGM within low scattering F-P antennas.

Author Contributions

Conceptualization, H.U. and T.B.A.L.; methodology, H.U. and T.B.A.L.; software, H.U.; investigation, H.U.; resources, T.B.A.L., Y.Y. and K.K.; writing—original draft preparation, H.U.; writing—review and editing, T.B.A.L.; supervision, T.B.A.L., W.N.L.B.W.M., M.O., M.I.H. and A.I.N.; project administration, T.B.A.L., Y.Y., W.N.L.B.W.M. and K.K.; funding acquisition, T.B.A.L., Y.Y. and M.I.H. All authors have read and agreed to the published version of the manuscript.

Funding

This research was funded by the University of Malaya (UM), grant number GPF015A-2019.

Conflicts of Interest

The authors declare no conflict of interest.

References

  1. Wilsen, C.; Davidson, D. The radar cross section reduction of microstrip patches. In Proceedings of the IEEE, AFRICON’96, Stellenbosch, South Africa, 27 September 1996; pp. 730–733. [Google Scholar]
  2. Wiesbeck, W.; Heidrich, E. Influence of antennas on the radar cross section of camouflaged aircraft. In Proceedings of the 92 International Conference on Radar, Brighton, UK, 12–13 October 1992; pp. 122–125. [Google Scholar]
  3. Chen, Q.; Fu, Y. A planar stealthy antenna radome using absorptive frequency selective surface. Microw. Opt. Technol. Lett. 2014, 56, 1788–1792. [Google Scholar] [CrossRef]
  4. Costa, F.; Monorchio, A. A Frequency Selective Radome with Wideband Absorbing Properties. IEEE Trans. Antennas Propag. 2012, 60, 2740–2747. [Google Scholar] [CrossRef]
  5. Thummaluru, S.R.; Chaudhary, R.K. Reducing the RCS of MIMO Antenna using Angularly Stable FSS. In Proceedings of the 2019 URSI Asia-Pacific Radio Science Conference (AP-RASC), New Delhi, India, 9–15 March 2019; pp. 1–4. [Google Scholar]
  6. Thummaluru, S.R.; Kumar, R.; Chaudhary, R.K. Isolation enhancement and radar cross section reduction of MIMO antenna with frequency selective surface. IEEE Trans. Antennas Propag. 2018, 66, 1595–1600. [Google Scholar] [CrossRef]
  7. Genovesi, S.; Costa, F.; Monorchio, A. Low-Profile Array with Reduced Radar Cross Section by Using Hybrid Frequency Selective Surfaces. IEEE Trans. Antennas Propag. 2012, 60, 2327–2335. [Google Scholar] [CrossRef]
  8. Xue, J.; Jiang, W.; Gong, S. Wideband RCS reduction of microstrip array antenna based on absorptive frequency selective surface and microstrip resonators. Int. J. Antennas Propag. 2017, 2017, 1–11. [Google Scholar] [CrossRef]
  9. Long, M.; Jiang, W.; Gong, S. Double-layer miniaturised-element metasurface for RCS reduction. IET Microw. Antennas Propag. 2016, 11, 705–710. [Google Scholar] [CrossRef]
  10. Pan, W.; Huang, C.; Chen, P.; Ma, X.; Hu, C.; Luo, X. A Low-RCS and High-Gain Partially Reflecting Surface Antenna. IEEE Trans. Antennas Propag. 2014, 62, 945–949. [Google Scholar] [CrossRef]
  11. Cong, L.-L.; Cao, X.-Y.; Li, W.; Zhao, Y. A new design method for patch antenna with low RCS and high gain performance. Prog. Electromagn. Res. 2016, 59, 77–84. [Google Scholar] [CrossRef] [Green Version]
  12. Mu, J.; Wang, H.; Wang, H.; Huang, Y. Low-RCS and gain enhancement design of a novel partially reflecting and absorbing surface antenna. IEEE Antennas Wirel. Propag. Lett. 2017, 16, 1903–1906. [Google Scholar] [CrossRef]
  13. Huang, C.; Pan, W.; Ma, X.; Luo, X. A Frequency Reconfigurable Directive Antenna with Wideband Low-RCS Property. IEEE Trans. Antennas Propag. 2016, 64, 1173–1178. [Google Scholar] [CrossRef]
  14. Ourir, A.; Burokur, S.; De Lustrac, A. Electronically reconfigurable metamaterial for compact directive cavity antennas. Electron. Lett. 2007, 43, 698–700. [Google Scholar] [CrossRef]
  15. Jia, Y.; Liu, Y.; Zhang, W.; Wang, J.; Gong, S.; Liao, G. High-Gain Fabry-Perot Antennas with Wideband Low Monostatic RCS Using Phase Gradient Metasurface. IEEE Access 2019, 7, 4816–4824. [Google Scholar] [CrossRef]
  16. Dadgarpour, A.; Zarghooni, B.; Virdee, B.S.; Denidni, T.A. Beam Tilting Antenna Using Integrated Metamaterial Loading. IEEE Trans. Antennas Propag. 2014, 62, 2874–2879. [Google Scholar] [CrossRef]
  17. Mehmood, A.; Karabey, O.H.; Jakoby, R. Dielectric Resonator Antenna with Tilted Beam. IEEE Antennas Wirel. Propag. Lett. 2016, 16, 1119–1122. [Google Scholar] [CrossRef]
  18. Sumantyo, J.T.S. Design of tilted beam circularly polarized antenna for CP-SAR sensor onboard UAV. In Proceedings of the 2016 International Symposium on Antennas and Propagation (ISAP), Okinawa, Japan, 24–28 October 2016; pp. 658–659. [Google Scholar]
  19. Ourir, A.; Burokur, S.; de Lustrac, A. Phase-varying metamaterial for compact steerable directive antennas. Electron. Lett. 2007, 43, 493–494. [Google Scholar] [CrossRef]
  20. Nakano, H.; Mitsui, S.; Yamauchi, J. Tilted-beam high gain antenna system composed of a patch antenna and periodically arrayed loops. IEEE Trans. Antennas Propag. 2014, 62, 2917–2925. [Google Scholar] [CrossRef]
  21. Katare, K.K.; Chandravanshi, S.; Biswas, A.; Akhtar, M.J. Beam-switching of Fabry–Perot cavity antenna using asymmetric reflection phase response of bianisotropic metasurface. IET Microw. Antennas Propag. 2019, 13, 842–848. [Google Scholar] [CrossRef]
  22. BChacko, P.; Augustin, G.; Denidni, T.A. Tilted-beam superstrate antenna with low-profile and high-gain. In Proceedings of the 2016 IEEE International Symposium on Antennas and Propagation (APSURSI), Fajardo, Puerto, 26 June–1 July 2016; pp. 341–342. [Google Scholar]
  23. Oyan, M.J.; Hamran, S.-E.; Damsgard, L.; Berger, T. Compact Airborne C-Band Radar Sounder. IEEE Trans. Geosci. Remote. Sens. 2014, 52, 6326–6332. [Google Scholar] [CrossRef]
  24. Foroozesh, A.; Shafai, L. Investigation into the effects of the patch-type FSS superstrate on the high-gain cavity resonance antenna design. IEEE Trans. Antennas Propag. 2009, 58, 258–270. [Google Scholar] [CrossRef]
  25. Costa, F.; Monorchio, A.; Manara, G. Analysis and Design of Ultra Thin Electromagnetic Absorbers Comprising Resistively Loaded High Impedance Surfaces. IEEE Trans. Antennas Propag. 2010, 58, 1551–1558. [Google Scholar] [CrossRef] [Green Version]
  26. Landy, N.I.; Sajuyigbe, S.; Mock, J.J.; Smith, D.R.; Padilla, W.J. Perfect Metamaterial Absorber. Phys. Rev. Lett. 2008, 100, 207402. [Google Scholar] [CrossRef] [PubMed]
  27. Jiang, H.; Xue, Z.; Li, W.; Ren, W.; Cao, M. Low-RCS High-Gain Partially Reflecting Surface Antenna with Metamaterial Ground Plane. IEEE Trans. Antennas Propag. 2016, 64, 4127–4132. [Google Scholar] [CrossRef]
  28. Ratni, B.; Merzouk, W.A.; De Lustrac, A.; Villers, S.; Piau, G.-P.; Burokur, S. Design of Phase-Modulated Metasurfaces for Beam Steering in Fabry–Perot Cavity Antennas. IEEE Antennas Wirel. Propag. Lett. 2017, 16, 1401–1404. [Google Scholar] [CrossRef]
  29. Ji, L.-Y.; Guo, Y.J.; Qin, P.-Y.; Gong, S.-X.; Mittra, R. A Reconfigurable Partially Reflective Surface (PRS) Antenna for Beam Steering. IEEE Trans. Antennas Propag. 2015, 63, 2387–2395. [Google Scholar] [CrossRef]
  30. Mailloux, R.J. Phased Array Antenna Handbook; Artech House: Norwood, MA, USA, 2017. [Google Scholar]
  31. Hassan, T.; Khan, M.U.; Attia, H.; Sharawi, M.S. An FSS Based Correlation Reduction Technique for MIMO Antennas. IEEE Trans. Antennas Propag. 2018, 66, 4900–4905. [Google Scholar] [CrossRef]
  32. Zhang, L.; Wan, X.; Liu, S.; Yin, J.Y.; Zhang, Q.; Wu, H.T.; Cui, T.J. Realization of low scattering for a high-gain Fabry–Perot antenna using coding metasurface. IEEE Trans. Antennas Propag. 2017, 65, 3374–3383. [Google Scholar] [CrossRef]
Figure 1. Schematic of designed antenna system.
Electronics 10 00267 g001
Figure 2. (a) Unit cell structure; (b) Unit cell boundary conditions (dimensions are shown in Table 1).
Electronics 10 00267 g002
Figure 3. Reflection response of the positive z-axis incident wave. (a) Reflection phase; (b) Reflection magnitude (linear); (c) Reflection phase versus gradient patch size (shown at 6.6 GHz).
Electronics 10 00267 g003
Figure 4. Reflection and transmission response of the negative z-axis incident wave. (a) Reflection magnitude; (b) Transmission magnitude.
Electronics 10 00267 g004
Figure 5. Reflection/transmission response of individual layers of unit cell. (a) Absorptive frequency selective surface (FSS); (b) Partially reflecting surface (PRS).
Electronics 10 00267 g005
Figure 6. Electric (E)-field overlay plot shown on absorber surface for y-polarized incident wave (plot shown in dB scale).
Electronics 10 00267 g006
Figure 7. Frequency response against loop length (l). (a) Reflection magnitude; (b) Transmission magnitude.
Electronics 10 00267 g007
Figure 8. Frequency response against loop width (w). (a) Reflection magnitude; (b) Transmission magnitude.
Electronics 10 00267 g008
Figure 9. Frequency response against fixed patch length (p). (a) Reflection magnitude; (b) Transmission magnitude; (c) Reflection magnitude for the positive z-axis incident wave.
Electronics 10 00267 g009
Figure 10. Frequency response against air gap (g). (a) Reflection magnitude; (b) Transmission magnitude; (c) Reflection phase for the positive z-axis incident wave.
Electronics 10 00267 g010
Figure 11. Reflection magnitude response for different resistance (R) values.
Electronics 10 00267 g011
Figure 12. Antenna structure. (a) Simulated model; (b) Fabricated prototype; (c) PRS top side; (d) PRS bottom side (gradient pattern).
Electronics 10 00267 g012
Figure 13. Reflection coefficient and gain vs. frequency response. (a) Proposed antenna; (b) Reference antenna (without superstrate structure).
Electronics 10 00267 g013
Figure 14. Principal plane patterns. (a) E-plane; (b) H-plane.
Electronics 10 00267 g014
Figure 15. Radiation pattern plotted at various frequencies (f).
Electronics 10 00267 g015
Figure 16. Monostatic radar cross section (RCS) frequency response. (a) x-Polarized incident wave; (b) y-Polarized incident wave.
Electronics 10 00267 g016
Figure 17. Simulated vs. measured monostatic RCS reduction plotted at discrete frequency points. (a) x-Pol incident wave; (b) y-Pol incident wave; (c) RCS measurement setup. (AUT, antenna under test).
Electronics 10 00267 g017
Figure 18. Normalized monostatic RCS angular response for the yoz plane with x-pol incident wave at 8.8 GHz. (a) Reference antenna; (b) Proposed antenna.
Electronics 10 00267 g018
Figure 19. Normalized monostatic RCS angular response for xoz plane with y-pol incident wave at 8.8 GHz. (a) Reference antenna; (b) Proposed antenna.
Electronics 10 00267 g019
Table 1. Finalized structural dimensions (unit, mm).
ParametergmlwrphvR
Value3.21680.90.514.720variable100 Ω
Table 2. Gradient patch dimensions (v) with associated reflection phase values.
Gradient Patch Lengths (mm)8.21010.210.71111.8
Reflection Phase Values158.51°105.61°88.37°−27.28°−83.8°−125.03°
Table 3. Simulated vs. measured RCS reduction values at measured frequency points.
S. No.Frequency Points (GHz)RCS Reduction (dB)
x-pol Simulatedx-pol Measuredy-pol Simulatedy-pol Measured
1.7.511.6712.410.9210.87
2.813.9918.1214.6914.62
3.8.831.5326.6527.7722.09
4.1015.6620.3215.2722.23
5.12.618.6821.4917.7619.82
6.1418.3811.481918.37
Average RCS Reduction (dB)18.3218.4117.5718
Table 4. Previous works compared with the proposed antenna.
Ref.Aperture Size/Cavity HeightCenter FrequencyGainRCS Band/BandwidthAverage RCS SuppressionPeak Radiation
[10]2.3 λ × 2.3 λ/0.58 λ11.5 GHz13.2 dBi6–14 GHz
(8 GHz)
10 dB
[27]3.7 λ × 3.7 λ/0.73 λ10 GHz18.4 dBi8–17 GHz
(9 GHz)
13 dB
[12]2.53 λ × 2.53 λ/0.67 λ7.65 GHz12.3 dBi5–13 GHz
(8 GHz)
not given
[15]
(a) 1
3.36 λ × 3.36 λ/0.7 λ8.4 GHz19.2 dBi7–11 GHz
(4 GHz)
6.4 dB
[15]
(b) 1
3.36 λ × 3.36 λ/0.7 λ8.4 GHz17.9 dBi7–15 GHz
(8 GHz)
9.9 dB
[32]3.67 λ × 3.67 λ/0.62 λ10 GHz19.8 dBi8–12 GHz
(4 GHz)
8.76 dB
[13]2.79 λ × 2.79 λ/0.68 λReconfigurable
9.05–10 GHz
13.7 dBi7–14 GHz
(7 GHz)
not given
This work2.11 λ × 2.11 λ/0.44 λ6 GHz11.5 dBi5.6–16 GHz
(10.4 GHz)
13 dB13°
1 [15] (a) and [15] (b) refer to the two designs presented in ref. [13].
Publisher’s Note: MDPI stays neutral with regard to jurisdictional claims in published maps and institutional affiliations.

