Article

Investigation of Input Modalities Based on a Spatial Region Array for Hand-Gesture Interfaces

1
Faculty of Information Engineering and Automation, Kunming University of Science and Technology, Kunming 650500, China
2
School of System Engineering, Kochi University of Technology, Kochi 780-8515, Japan
3
State Key Laboratory of Fluid Power and Mechatronic Systems, School of Mechanical Engineering, Zhejiang University, Hangzhou 310027, China
*
Author to whom correspondence should be addressed.
Electronics 2021, 10(24), 3078; https://doi.org/10.3390/electronics10243078
Submission received: 28 October 2021 / Revised: 4 December 2021 / Accepted: 7 December 2021 / Published: 10 December 2021
(This article belongs to the Special Issue Physical Diagnosis and Rehabilitation Technologies)

Abstract

:
To improve the efficiency of computer input, extensive research has been conducted on hand movement in a spatial region. Most of it has focused on the technologies but not the users’ spatial controllability. To assess this, we analyze a users’ common operational area through partitioning, including a layered array of one dimension and a spatial region array of two dimensions. In addition, to determine the difference in spatial controllability between a sighted person and a visually impaired person, we designed two experiments: target selection under a visual and under a non-visual scenario. Furthermore, we explored two factors: the size and the position of the target. Results showed the following: the 5 × 5 target blocks, which were 60.8 mm × 48 mm, could be easily controlled by both the sighted and the visually impaired person; the sighted person could easily select the bottom-right area; however, for the visually impaired person, the easiest selected area was the upper right. Based on the results of the users’ spatial controllability, we propose two interaction techniques (non-visual selection and a spatial gesture recognition technique for surgery) and four spatial partitioning strategies for human-computer interaction designers, which can improve the users spatial controllability.

1. Introduction

In the field of human-computer interaction, there has been a wealth of related research on improving computer input efficiency, including voice input and gesture input, and among which interaction technologies based on common spaces and interaction technologies based on gesture recognition have also been commercialized and applied. Therefore, it is necessary to study the space operation range commonly used by users and combine the advantages of air gesture operation to obtain a new type of human-computer interaction input channel to improve the interaction experience and efficiency.
Spatial gestures and related recognition techniques have been widely used in various scenarios, such as intangible user interfaces and large-screen interactions. Generally, those gestures are to be executed by users in spatial areas within easy reach. Movement of the hands as a change of 3D positional data is an increasingly important input modality for computer interaction. In this mode, users often move their hands up and down in space to achieve a corresponding purpose.

1.1. Gesture Recognition

The field of gesture recognition has been a hot topic, with various potential applications from playing games to medical treatment. Different researchers have utilized various devices to conduct studies in this area. In terms of gesture data collection, common methods include: data gloves [1]; Kinect video capture devices [2]; Leap Motion capture devices [3]; collecting data through the device’s first-view camera in the AR/VR environment [4,5]; and the use of heterogeneous sensors to collect data to improve the recognition rate [6]. In terms of experiment types, image segmentation [4] and image classification [2] are more common, and researching non-contact tactile feedback in AR/VR environments [5]. In [7], a cross-label recognition system is proposed. Promoting gesture recognition by improving large data intelligent editing processes [6]. There is also an identification method that measures the distance and angle between the fingers [1,8] studied arm gestures. Gesture recognition has many applications, such as gestures that interact with animation in shadow puppet shows [6] and interact with television [9]. In the area of medicine, doctors can use gestures to safely interact with computers to control images without the need to touch an operating room screen [10]. Navigating and manipulating large amounts of data suitable for high-resolution wall displays [11]. In the driving field, by exploring the space in front of an in-car screen, in-car touchscreen interaction can be expanded with the careful application of a target expansion strategy, allowing interaction with in-car systems to be more convenient [12]. Gesture recognition uses several technologies. In [1], the recognition rate is improved through a deep learning-based gesture spotting algorithm. In [4], a gesture recognition deep neural network was proposed which recognizes ego hand gestures from videos (videos containing a single gesture) by generating and recognizing embeddings of ego hands from image sequences of varying lengths. A novel deep neural network is designed in [7], which embeds gestures in the high-dimensional Euclidean space. It tackles the spatial resolution limits imposed by RF hardware and the specular reflection effect of RF signals. In [2], the support vector machine (SVM) classifier is used to classify the data. Ultrasonic haptic technology is used in E to develop and integrate air haptics that do not require wearing or holding any equipment in the virtual reality game experience [5]. This paper presents a set of spatial partitioning strategies for designers as guidelines that can improve the types of technologies described.

1.2. Interaction Based on a Spatial Region

Gesture interaction has developed rapidly as one of the important research areas of human-computer interaction. However, we have checked the existing literature and found that researchers are more concerned with new interactive technologies developed by interactive channels such as large screens, cameras, and sensors. These studies have made great contributions to improving the efficiency of human-machine interaction. Human activities and space are closely linked, so researchers must pay attention to the controllability capabilities of users’ space. Interaction techniques based on a spatial region array are novel and promising and have a wide range of applications. To achieve multi-layer interaction, a novel multi-layered gesture recognition method using Kinect has been proposed and explores the essential linguistic characters of gestures [13]. The method can obtain relatively high performance. Multi-layer interaction techniques divide the interaction space into multiple interaction layers. Each layer has a special function; users can access different commands by accessing the different layers. The overall interaction height and different minimum layer thicknesses for vertical and horizontal search tasks were experimentally explored in [14]. In [15], three target selection techniques were developed for air pointing: small angular ray casting movements, large movements in a 2D plane, and movements in a 3D volume. Although those techniques were designed systematically to use from one to three dimensions, the target selection techniques were presented without strategies of common space partitioning. Many researchers have designed techniques based on spatial regions, but they have not focused on the division of space [16,17]. Some researchers have tried to divide the space using angles [18,19,20,21,22]. However, there is a lack of basic research on common spatial partitioning. The purpose of this paper is to explore common operational spatial partitioning in the user interface.

1.3. Interaction of Visually Impaired Individuals

There is a need for computer interactions that can also be used by visually impaired individuals; meeting this need has appealed to many researchers. A framework was proposed for exploring the differences between the spatial sense ability of visually impaired and sighted persons in three longitudinal models [23]. Through exploring the effect of spatial ability on a visually impaired person’s sense of position within web pages, we know users can obtain an accurate overview of a web page with audio feedback when using a touchscreen [24]. By connecting the use of touch sensation and other multimedia design elements, it was found that touch sensation plays a critical role in improving application design for people with visual impairments [25]. Although there is a lack of systematic study on the common operational spatial region array of a visually impaired individual, gesture-free interaction by the status of thumb (GIST) is a wearable gestural interface that uses a depth camera to collect a users’ hand gestures and can help a visually impaired individual perform everyday tasks [26]. There are techniques based on the two-dimensional structures of a keyboard surface that explore different methods of non-visual interaction [27]. To enable the blind to read the text, an affordable mobile application for the visually impaired person was proposed. The text could be read into speech format using text-to-speech conversion in a Text to Speech (TTS) framework [28]. Immersive virtual reality (VR) to provide a realistic walking experience for the visually impaired is proposed in [29]. A novel immersive interaction using a walking aid, i.e., a white cane, is designed to enable users with visual impairments to process ground recognition and inference processes realistically.
In summary, interactive technology based on spatial gestures has been integrated into people’s daily lives, including visual users and visually impaired people. Therefore, further research on interaction technology based on spatial gestures is beneficial to improve the interaction efficiency between users and computers in daily life.

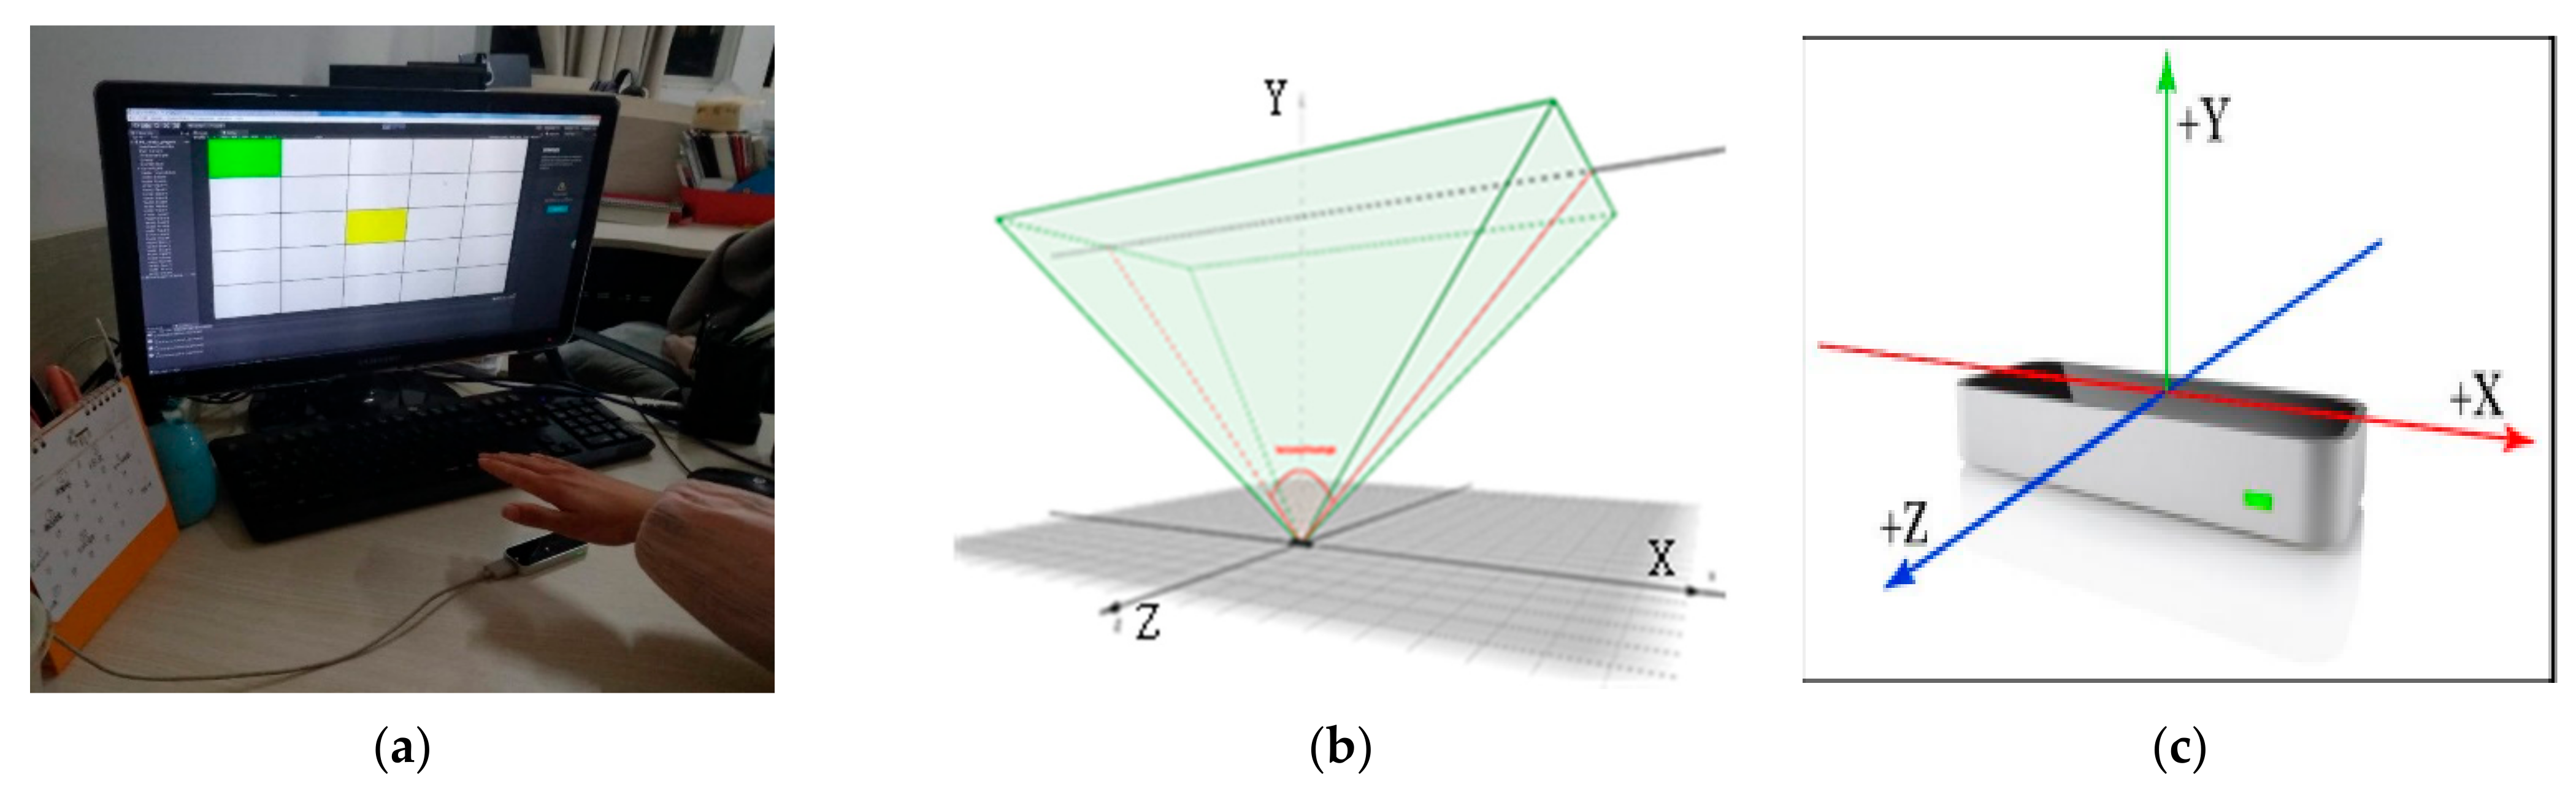
2. Materials and Methods

The extensive research mentioned above has focused on design techniques. However, this paper focuses on developing a set of guidelines based on spatial partitioning strategies. To assess users’ spatial controllability, we attempt to reveal the common operational region when executing spatial gestures. Thus, in this paper, we have focused on investigating input modalities based on a spatial region array for hand gesture interfaces. We conducted a systematic study of human performance when selecting targets with a spatial region array, and developed two interaction techniques and four spatial partitioning strategies as design guidelines for human-computer interaction designers.
A Leap Motion M010 controller, a computer (including a keyboard and a display screen), and an experimental model designed by Unity 3D in the C# language were used in the experiment. The Leap Motion device can detect the hand’s position in a range from 25° to 165° and is symmetrical. The experimental program was designed in Visual Studio 2019 and the Unity 3D Environment and ran on a 3.60 GHz AMD Ryzen R5-3600 CPU PC with Windows 10 Professional. The display resolution was set to 1000 × 800 pixels in the pilot studies and 1920 × 1080 pixels in Experiment 1 and Experiment 2.
To improve the users’ spatial controllability, we first focused on the height and width of a rectangle (in front of and parallel to the screen) representing the average range of hand movements when a user sits down at a desk. We first determined the common operation area through a pilot study, which was realized by Leap Motion and unity 3D, as shown in Figure 1a. Leap Motion systems can detect and track hands, fingers, and finger-like tools. Its visual range is an inverted pyramid with the spire in the center of the equipment, as shown in Figure 1b. Leap motion’s system adopts the right-hand Cartesian coordinate system, and the returned values are in real-world millimeters. The origin is at the center of the leap motion controller. The x-axis and z-axis are on the horizontal plane of the device, the x-axis is parallel to the long side of the device, the z-axis is parallel to the short side, and the y-axis is vertical upward, as shown in Figure 1c. Leap motion provides a set of dataset updates, and each frame of data contains a list of basic tracking data. When a hand is detected, it is assigned a unique ID indicator. For as long as the motion is analyzed, the leap motion program will give the frame motion factors based on the motion of the hand. Through the hand object, the current position information of the hand can be obtained. Unity 3D is a tool for creating interactive applications. It adopts a graphical development environment and can deploy projects to multiple platforms such as Windows. Unity’s coordinates are world coordinates, which are consistent with leap motion, so we can accurately locate the hand motion in unity’s world coordinates.
We imported a toolkit that supports Leap Motion gesture development in Unity. The toolkit contains prefabricated hands, related gesture action scripts, and case demonstrations, all of which can be used to help developers complete Leap Motion development work. The next step was to build an experimental development platform and add the “LeapHandController” prefab to the created scene. By observing whether the hand on the interface was within the capture range of the camera, we adjusted it to a suitable position and adjusted the size of the hand controller. The parameter was set to 1 to make it the same size as the real hand, so that the real hand could be moved in real-time to control the movement of the virtual hand, which is convenient for the user interaction operation described later. We imported the “Vectrosity” plug-in to meet the interface drawing requirements in our experiment. In this experiment, the plug-in was used to edit the experimental interface and achieve dynamic performance (for example, green represented a random target; when the target was selected, it appeared red; and yellow indicated the movement trajectory of the hand, etc.). To achieve the purpose of collecting experimental data, we recorded the acquired data in an Excel file and saved the file to the local disk. The logic processing of the business was implemented by C#. The logic included the method of drawing rectangles, the method of drawing UI interface, the method of setting the timer, the method of deleting rectangles, the method of randomly generating non-repeated layers, the method of setting data table, and the method of writing data to the Excel table.

2.1. Pilot Study

The study focused on designing, conducting, and analyzing a users’ performance on a spatial region array, and addressed the following issues:
  • Finding the physical limits of the common operational spatial region in the vertical and horizontal direction and setting this region as a study object.
  • Finding the threshold of the target size levels when the users accomplish the target selection tasks under the visual and non-visual scenarios.
  • Finding the relationship between the target regions when the users accomplish the target select operations under the visual and non-visual scenarios.
Many possible factors impact the interaction between the users and the Leap Motion controller. For example, the size of the spatial region array, the sensitivity of the Leap Motion device, a visual or non-visual task, and whether the users’ performance of the task used the left or right hand. For the study’s manageability and validity, we restricted our investigation to a situation where users sat in front of the Leap Motion device, centering it between the computer screen and the users’ body, as Figure 1a shows.

2.1.1. Participants

Twelve students (two females, 10 males) participated in the user study. Their ages ranged from 22 to 30 (M = 25, SD = 2.08). The average body height was 168.17 cm (SD = 8.96). All of them were daily computer users.

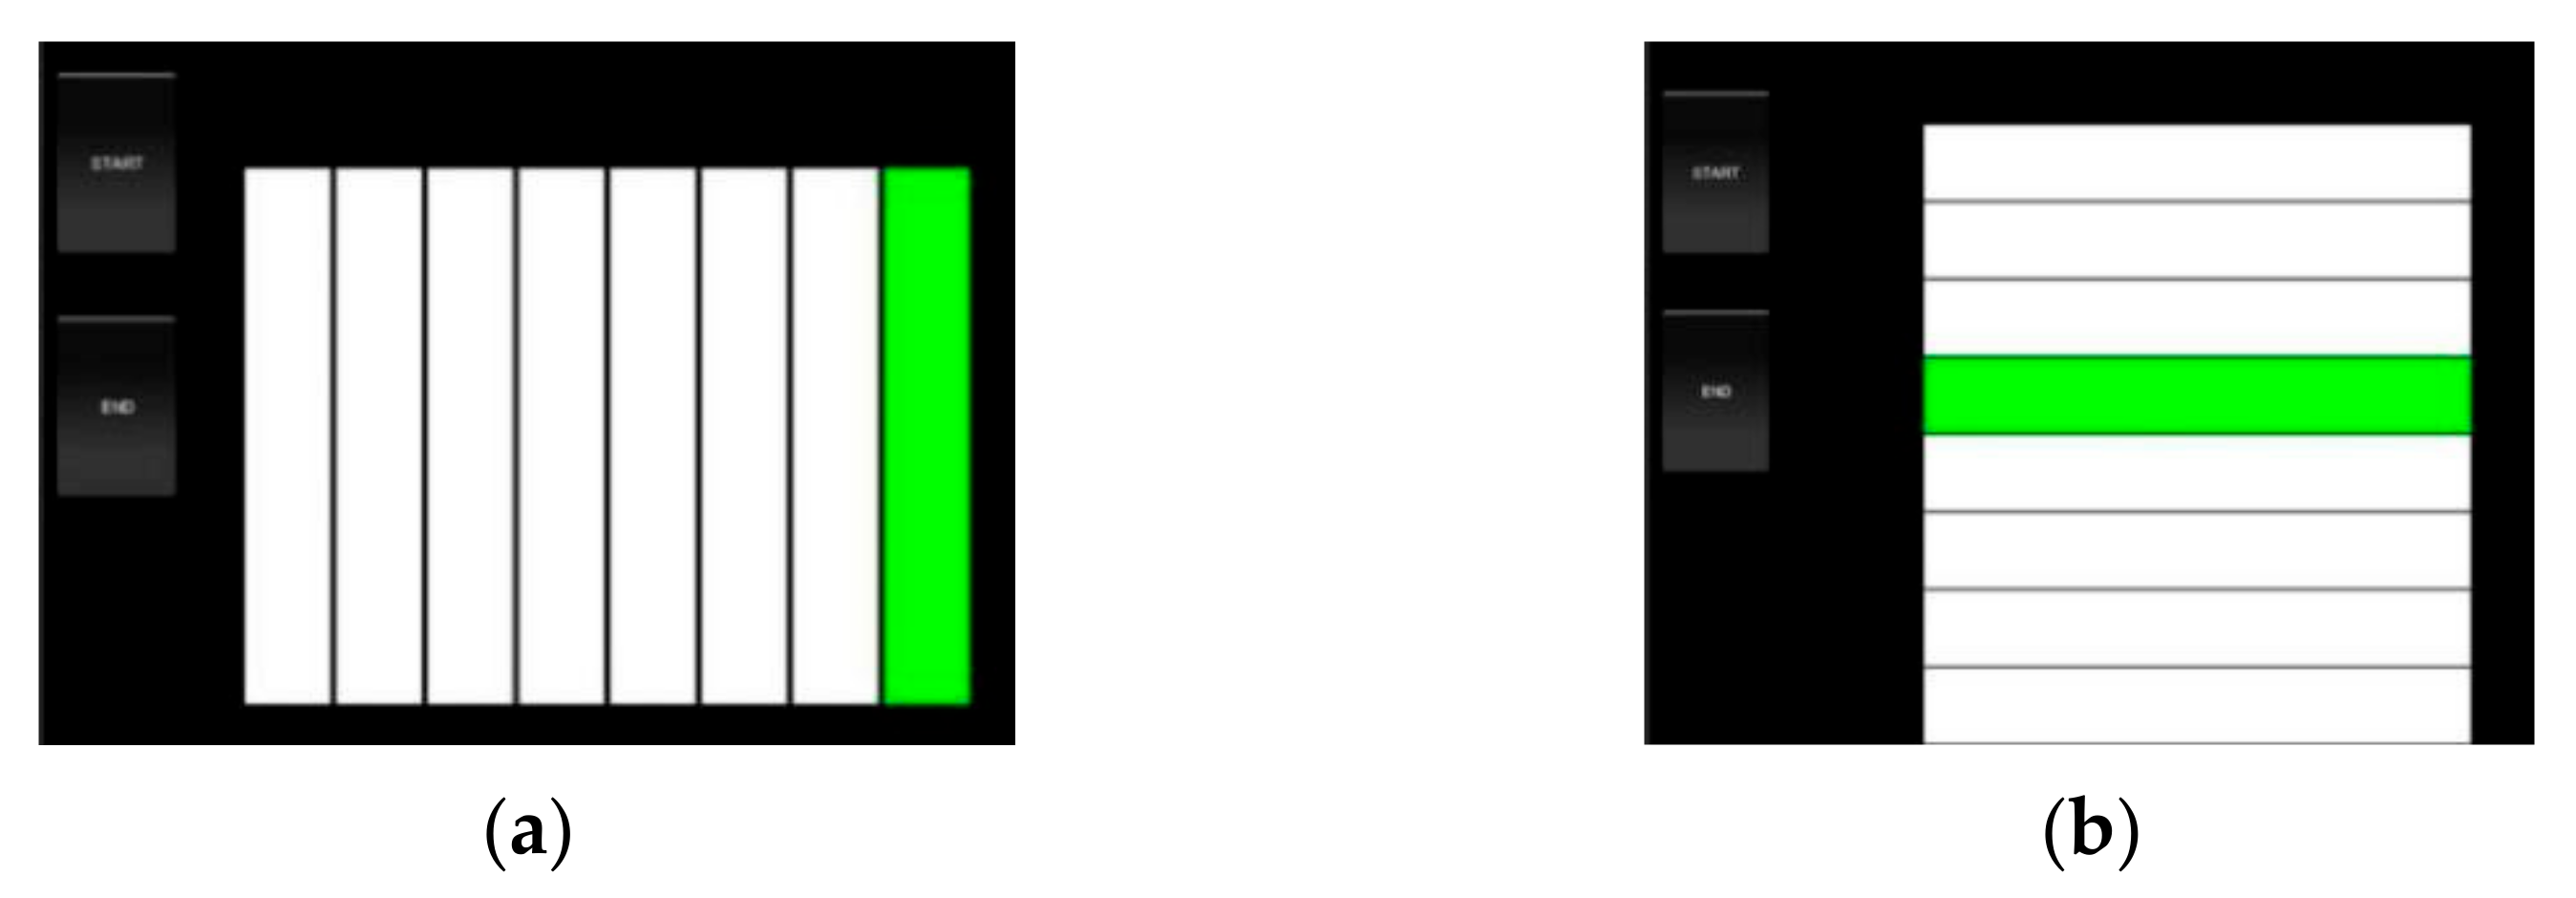
2.1.2. Task & Procedure

To test the users’ horizontal and vertical common range, we set visual cues to let the user move their hands horizontally and vertically while selecting the target block. First, the user pressed the “Start” button, and a green target block appeared randomly in a horizontal or vertical direction, as shown in Figure 2a,b. Taking the spatial position corresponding to the target block as a reference, when the user’s hand moved to the spatial position in front of the screen corresponding to the target block, the block would turn red. A second target block would then randomly appear. In this and subsequent target selection tasks, the target block was always displayed in red when a gesture was made toward it. When the user thought their hand overlapped the target block, they could select the target by pressing the left Ctrl button. At the same time, the position of the users’ hand was saved into an Excel file, and the next target selection task began.
Prior to the formal experiment, the participants were allowed to warm up by practicing until they understood and performed the task correctly. Taken together, these two experiments included the following: 12 subjects × 8 block levels × 14 repetitions × 2 directions = 2688 target selection trials.

2.1.3. Result

We analyzed the frequency of the user’s hand position at each interval. We then were able to reach a conclusion regarding the user’s vertical and horizontal common range, which was used as the study object of the following experiments.
After analyzing the collected data, we found that individuals manipulated their hands horizontally within the range (−220, 240) and vertically over the range (30, 370). The effective horizontal range was an interval of (−190, +190), and the vertical range was an interval of (50, 350), as Figure 3a,b show. We then chose 80% of this interval as the most common operational range, which was defined as a rectangle. The vertical interval was (80, 320), and the horizontal interval was (−152, +152). So the common operational region was an area of 240 mm × 304 mm, located 80 mm above the desktop.
Based on these results, we set this common operational region as a study object and divided it into differently sized target arrays and target regions through even spatial partitioning. The common operational region was divided into four evenly sized sections, as shown in Table 1. There were six target-size levels, as shown in Table 2. We then designed experiments in which the participants attempted target selection tasks at different target-size levels, and with target positions within the different regions.
In addition, differences between sighted and visually impaired individuals were also considered. The participants finished target selection tasks under both visual and non-visual scenarios. We then analyzed the data collected, including the average time and error rate.
The contributions of this work are:
  • It improves understanding the users and their controllability of space by identifying the common spatial region of users and the thresholds of target size and position.
  • We proposed two interaction techniques and four interaction strategies concerning the target size and position in the spatial region.

3. Experiment 1: Visual Scenario

To test the users’ performance accuracy when conducting the interaction task, we set a visual cue for sighted users.

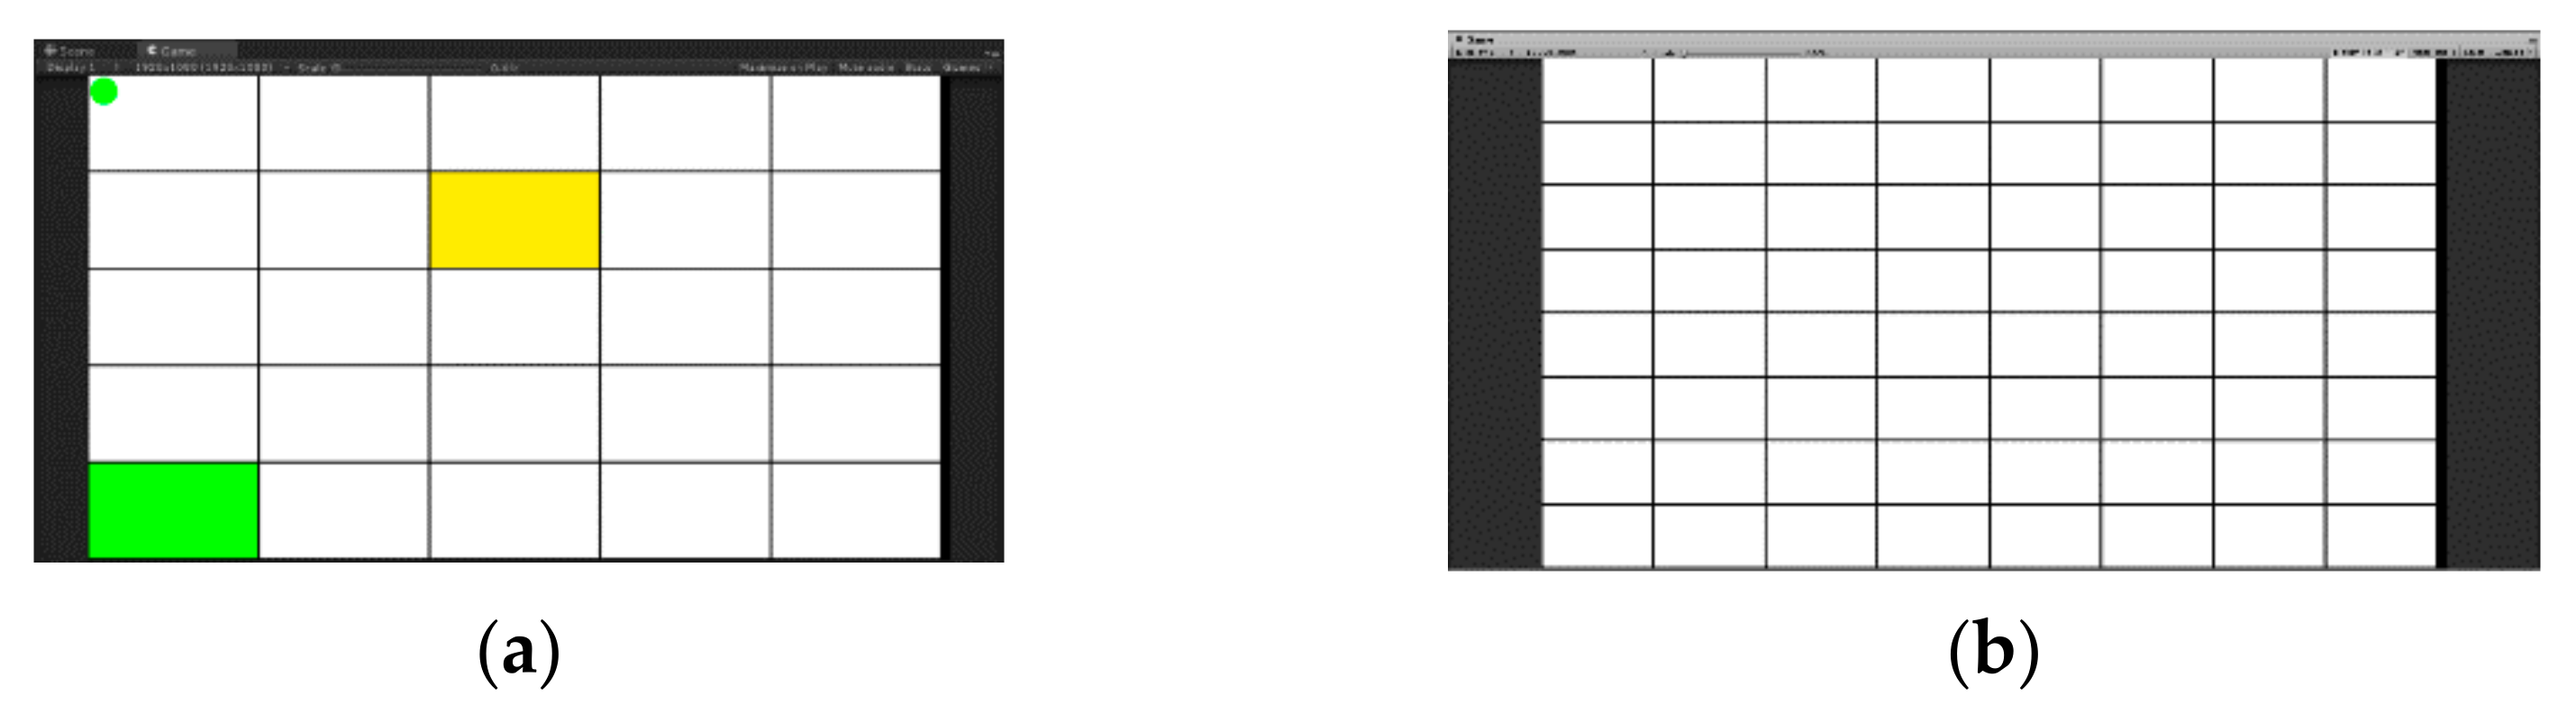
3.1. Participants & Apparatus

The participants and apparatus in Experiment 1 were the same as in the pilot study.

3.2. Task & Procedure

In Experiment 1, the current position of the users’ hand mapping to the current block was shown on the experiment screen in real time. The target block turned from green to red while the current block overlapped with it, as shown in Figure 4. The user sat in a chair at the desk before the computer as they did in the pilot study.
To maintain consistency in the experimental data, we saved the data to an Excel file at the end of a single target selection task, which was the moment the left Ctrl button was pressed. In addition, the experiment recorded a standard timestamp for an incremental time in the Unity 3D program. Once the user pressed the left Ctrl button to complete a target, the next target selection task began timing. To ensure an equal time for task selection, the user always placed their left index finger on the left Ctrl button. Before the formal experiment, participants were allowed a warm-up practice session until they could understand and perform the task correctly. In total, the experiment consisted of the following: 12 subjects × 6 target size levels × 4 target regions × 2 blocks × 3 repetitions = 1728 target selection trials.

3.3. Results

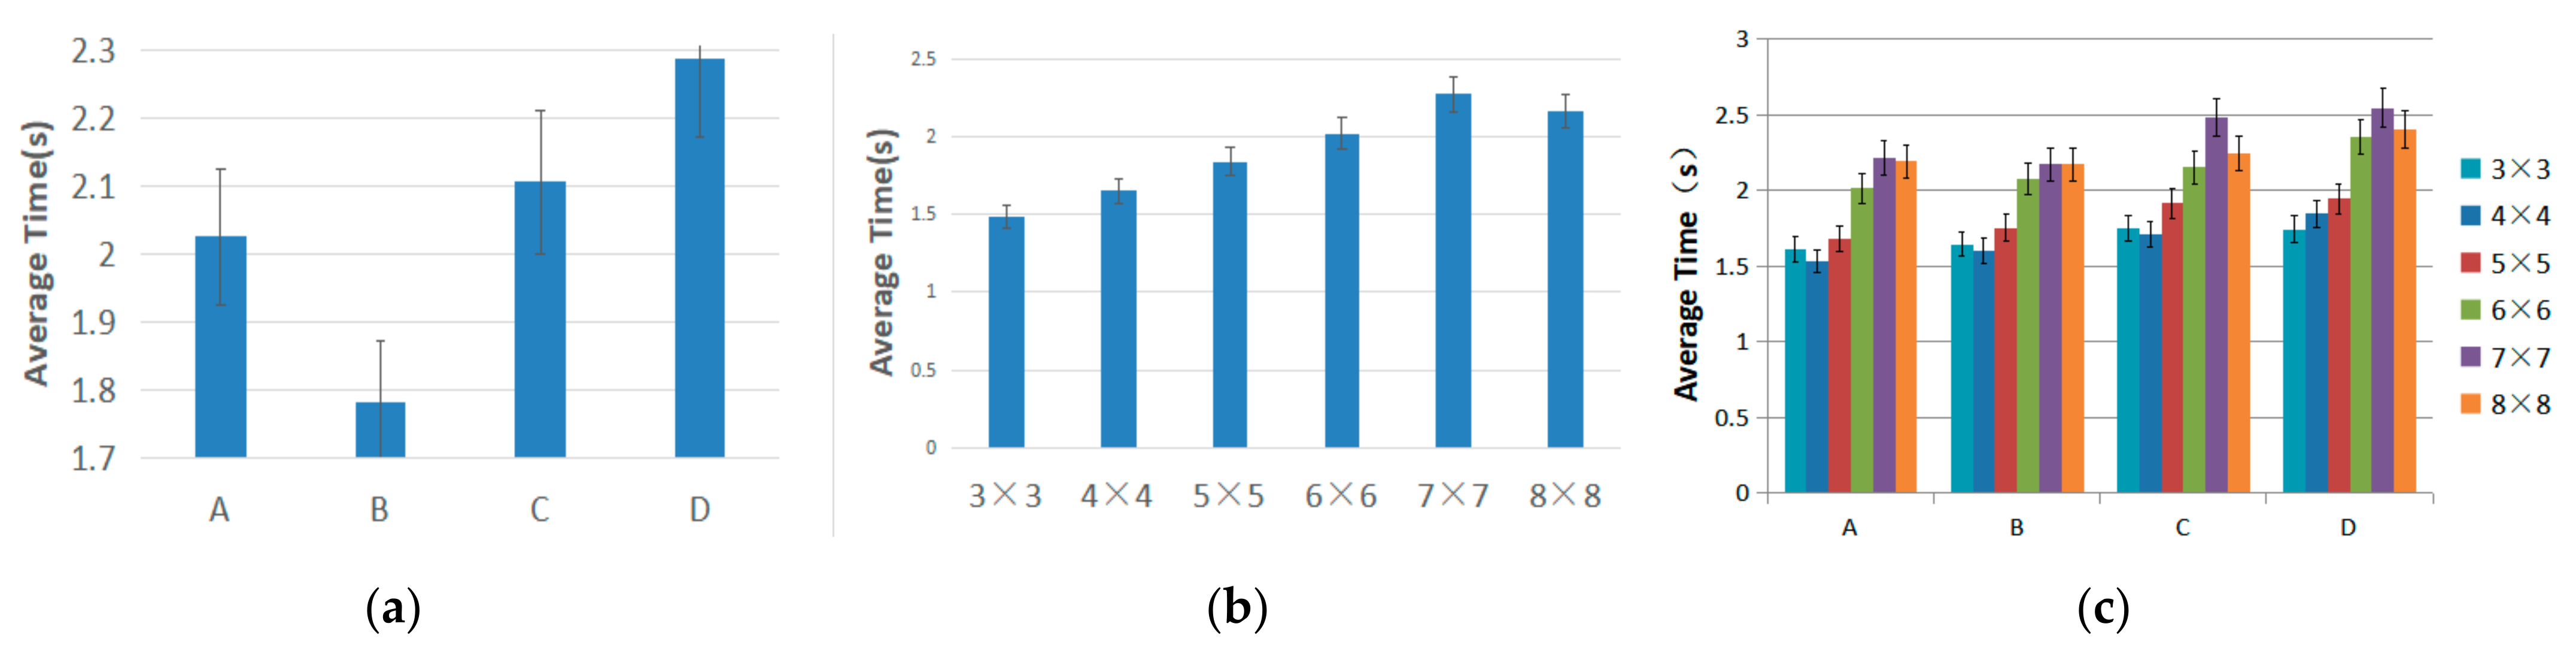
3.3.1. Selection Time

In the process of the experimental data analysis, we set the target level (3 × 3, 4 × 4, 5 × 5, 6 × 6, 7 × 7, and 8 × 8) and the target region (A, B, C, and D) as independent variables. In this way, we performed repeated measurements ANOVAs (α = 0.05) on the time and accuracy of the target selection. The target selection time was defined as beginning from when the user clicked the Start button or pressed the left Ctrl button to when the user pressed the left Ctrl button again.
There was a main effect on the average time of the different regions (F2.058, 22.634 = 11.460, p < 0.001), see Figure 5a. The post hoc tests showed that there were no significant differences among the regions (p > 0.05) except for between regions B and C (p = 0.035) and regions B and D (p < 0.001). Region B had the fastest completion time, and region D had the slowest completion time.
There was a main effect for the average time of the different levels of target size (F2.321, 25.531 = 20.714, p < 0.001), see Figure 5b. The post hoc tests showed that the shortest time was for the 3 × 3 level, and the longest was for the 7 × 7 level. There were no significant differences between the 3 × 3, 4 × 4, and 5 × 5 levels (p > 0.119). There were no significant differences between the 6 × 6, 7 × 7, and 8 × 8 levels (p > 0.05).
Further analysis of the level of target size × target region on selection time showed there was no significant interaction (F4.272, 46.992 = 1.601, p = 0.187), see Figure 5c. When the users selected a target in the 3 × 3 level, the shortest selection time was needed on average, while the 7 × 7 level had the longest time.

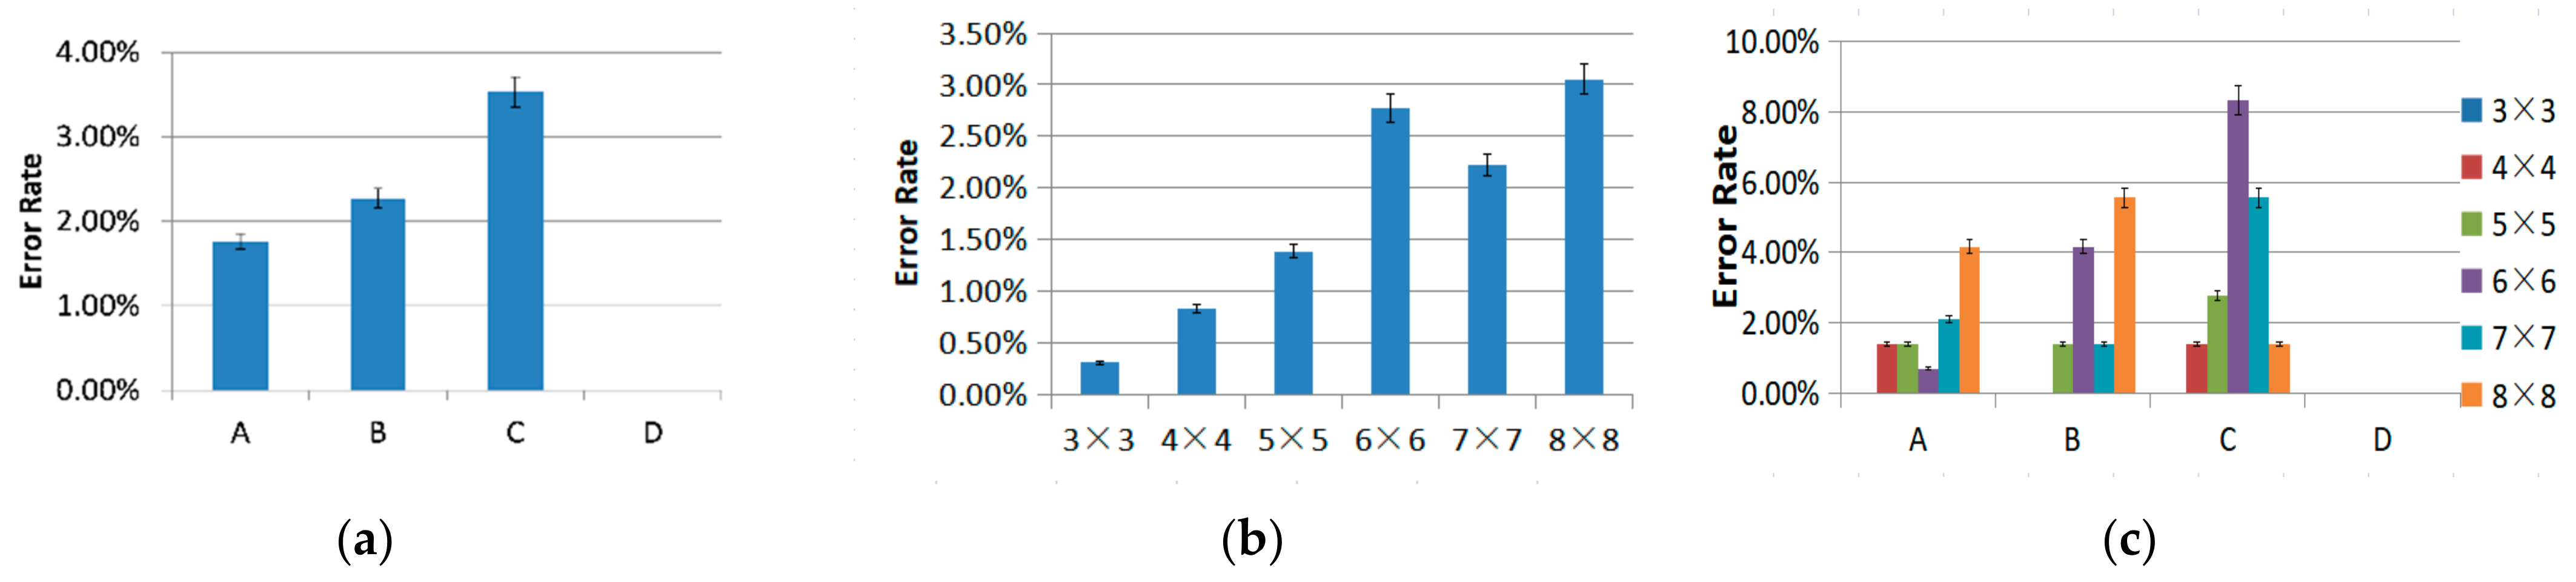
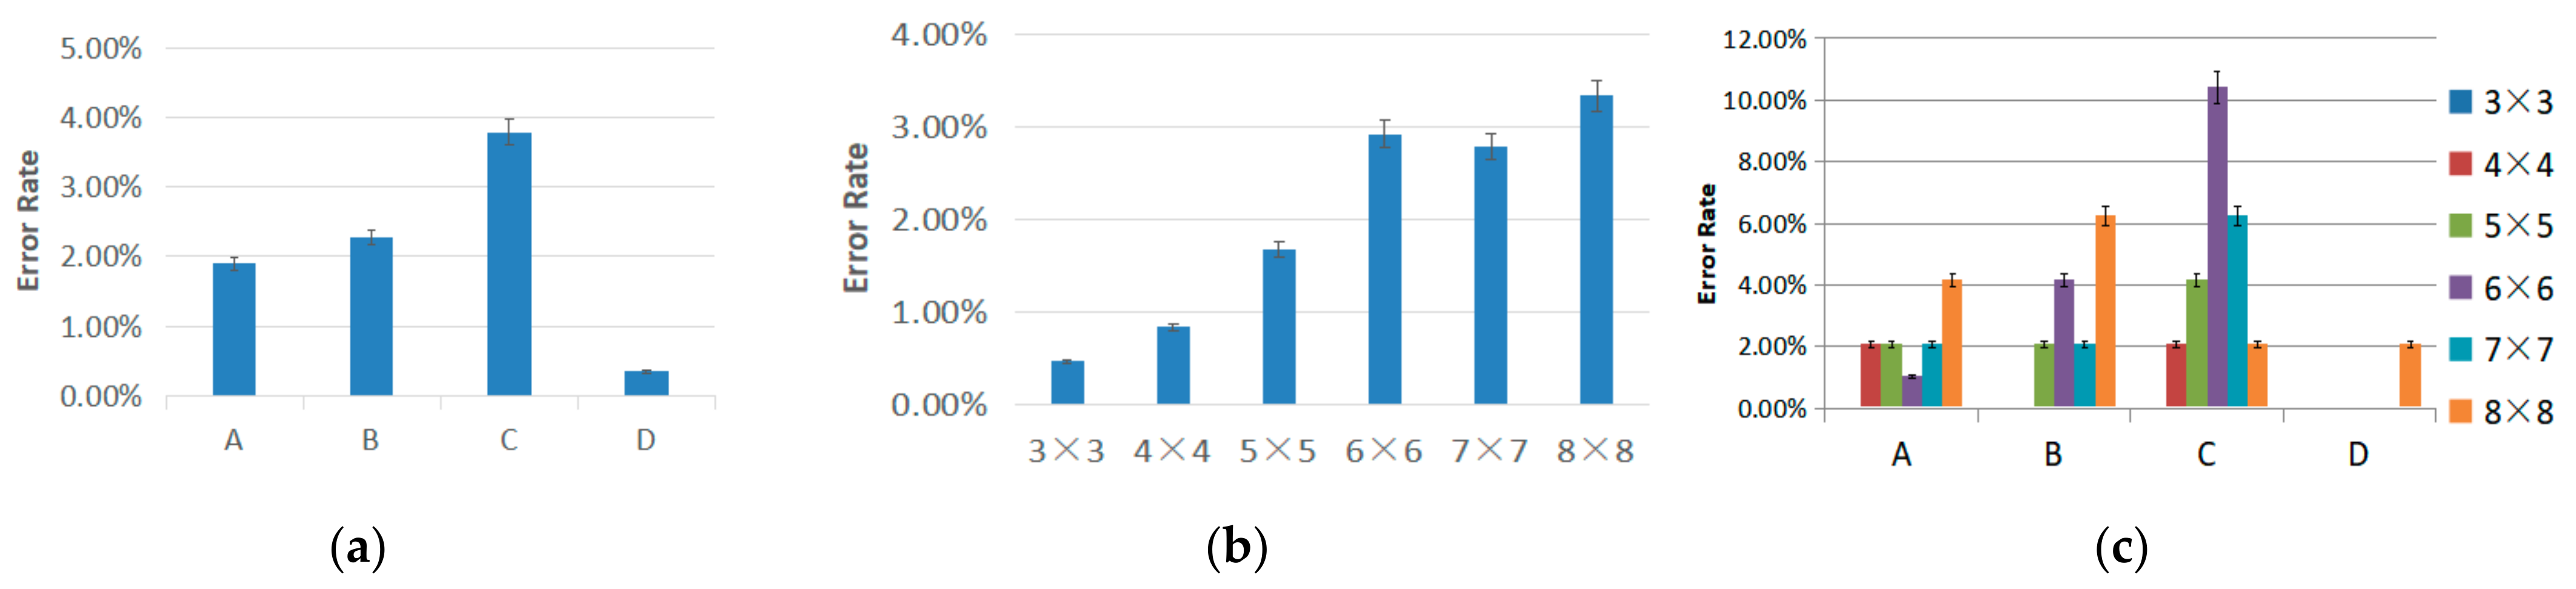
3.3.2. Selection Error Rate

The percentage of trials in which subjects made erroneous selections was defined as the selection error rate.
As shown in Figure 6a, there was a main effect on the average error rate of the different regions (F3, 33 = 4.240, p = 0.012). Post hoc tests showed no significant differences among all the regions (p > 0.052), except between regions B and D (p = 0.033). Region D had the lowest completion error rate, and region C had the highest completion error rate.
As shown in Figure 6b, different target sizes had no significant effect on the average error rate (F2.402,26.419 = 2.617, p = 0.083). The post hoc tests showed no significant differences among all the target size levels (p > 0.157). The 3 × 3 level had the lowest error rate, and the 8 × 8 level had the highest. The higher the target size level, the higher the error rate when selecting the target. The largest increase in the error rate for adjacent levels was from the 5 × 5 to the 6 × 6 level. Thus, a target size of 5 × 5 (60.8 mm length and 48 mm width) provided a threshold for the most selections without a noticeable change in error rate.
Further analysis of what effect target size level × target region had on selection error rate showed there was no significant interaction (F4.256, 46.816 = 1.665, p = 0.171), see Figure 6c. The 3 × 3 target size level had the lowest selection error rate. The second-lowest selection error rate was the 4 × 4 level. The 8 × 8 level produced the highest error rate. The participants had the lowest error rate (0%) when the target region was D (bottom-right corner) and the highest error rate (3.54%) when the target region was C (bottom-left corner).
In previous literature [19], the author studied pointing at virtual buttons. The space is divided into 5 different sizes according to the angle, that is, the number of buttons. The experimental results show that the error rates are 0, 3.6%, 2.2%, 16.0%, 3.2%, respectively. As shown in Figure 6a, the error rates of our results are 0.31%, 0.83%, 1.39%, 2.78%, 2.22%, 3.06%, and the overall error rate is better. We also divided the regions, discussed the situation of each region, and the comprehensive situation of region and size. The literature only considers the error rate and not the task completion time. We comprehensively analyze the error rate and time and give suggestions for designing interactive technologies based on spatial regions, which are more convincing. Next, we studied the division of spatial regions in the absence of vision and give suggestions for designing interactive technologies based on spatial regions in the absence of vision.

3.4. Comparative Experiment 1

The participants in Experiment 1 were the same as in the pilot study, so they were trained and familiar with the experiment. To eliminate this influence, we invited 12 external participants who didn’t know the experiment in advance. The experiment process was the same as experiment 1.

3.4.1. Selection Time

There was a main effect on the average time of the different regions (F2.058, 22.634 = 11.168, p < 0.001), see Figure 7a. The post hoc tests showed that there were no significant differences among the regions (p > 0.05) except for between regions B and C (p = 0.023) and regions B and D (p = 0.002). Region B had the fastest completion time, and region D had the slowest completion time.
There was a primary effect regarding the average time of the different levels of target size (F2.321, 25.531 = 20.870, p < 0.001), see Figure 7b. The post hoc tests showed that the shortest time was for the 3 × 3 level, and the longest was for the 7 × 7 level. There were no significant differences among the 3 × 3, 4 × 4, and 5 × 5 levels (p > 0.37). There were no significant differences among the 6 × 6, 7 × 7, and 8 × 8 levels (p > 0.05).
Further analysis of the level of target size × target region on selection time showed there was no significant interaction (F4.272, 46.992 = 1.635, p = 0.178), see Figure 7c. When the users selected a target in the 3 × 3 level, the shortest selection time was needed on average, while the 7 × 7 level had the longest time.

3.4.2. Selection Error Rate

As shown in Figure 8a, there was a primary effect on the average error rate of the different regions (F3, 33 = 3.996, p = 0.016). Post hoc tests showed no significant differences among all the regions (p > 0.063). Region D had the lowest completion error rate, and region C had the highest completion error rate.
As shown in Figure 8b, there was no significant effect for the average error rate of the different target sizes (F2.109, 23.199 = 2.184, p = 0.133). The post hoc tests showed no significant differences among all the target size levels (p > 0.122). The 3 × 3 level had the lowest error rate, and the 8 × 8 level had the highest.
Further analysis of target size level × target region on selection error rate showed there was no significant interaction (F4.9, 53.903 = 1.628, p = 0.17), see Figure 8c.
Compared with Experiment 1, the error rate of this experiment was slightly higher, and the average time was slightly longer, caused by the fact that new participants were not familiar with the experiment. The results showed that the regions (and levels) with the highest or lowest error rates were the same as Experiment 1. The regions (and levels) with the fastest or slowest average time were the same as Experiment 1, as shown in Figure 7 and Figure 8.

4. Experiment 2: Non-Visual Scenario

To test the accuracy when the users performed the task with an eyes-free scenario, we set voice guidance for a visually impaired individual. The position of the users’ hand mapping to the current block was shown on the experiment screen in real time, and the target block turned from green to red while the current block overlapped it.

4.1. Participants & Apparatus

The participants and apparatus in Experiment 2 were the same as in the pilot study.

4.2. Task & Procedure

The design and tasks were almost the same as in Experiment 1. The difference in Experiment 2 was that there was no visual feedback for the users, only voice guidance. The beginning guide audio was “The target block is X”, and it would then announce the number of the block of the users’ hand in real time. The participants already knew the number of the target block. This cycle would continue until the task was completed, and then the audio would announce, “This round of the experiment ends”. Before the formal experiment, participants were allowed to warm up with a practice session until they could understand and perform the task correctly. In total, the experiment consisted of the following: 12 subjects × 6 target size levels × 4 target regions × 2 blocks × 3 repetitions = 1728 target selection trials.

4.3. Results

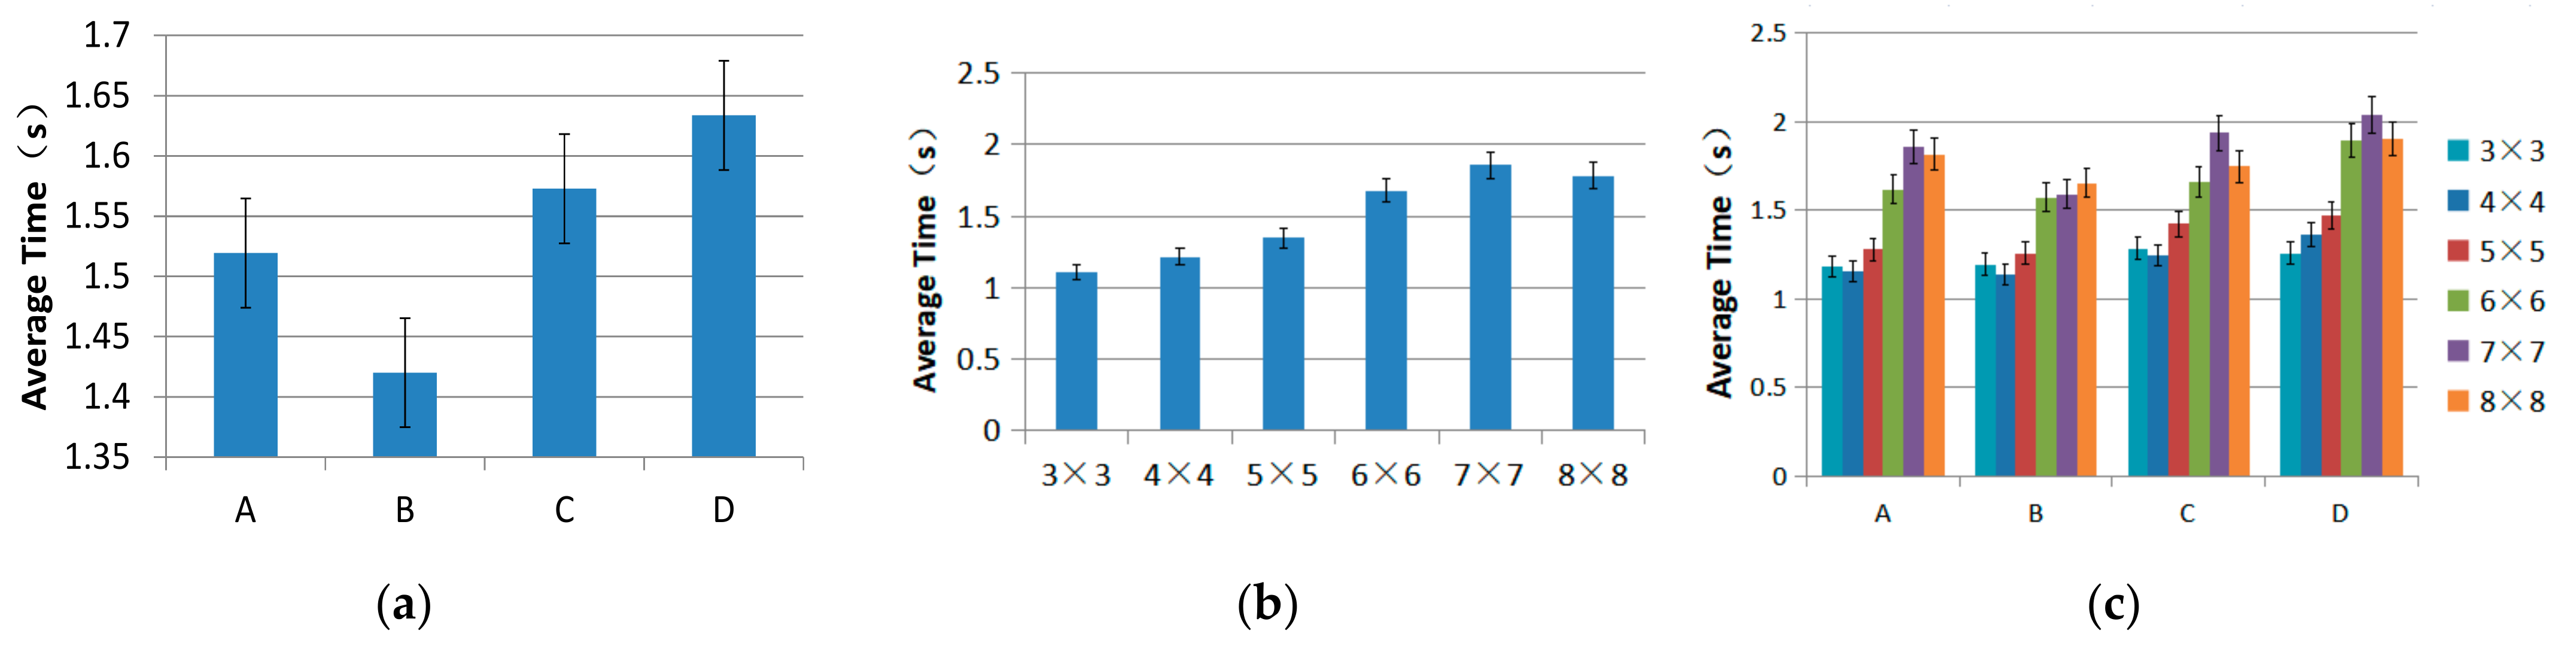
4.3.1. Selection Time

We found a main effect on the average time of different regions (F3, 33 = 13.496, p < 0.001), see Figure 9a. The post hoc tests showed a significant difference between regions A and C (p = 0.007) and regions A and D (p = 0.002). There was a significant difference between regions B and C (p = 0.042) and regions B and D (p = 0.002). Other regions had no significant differences (p > 0.975). Region B had the fastest completion time, and region D had the slowest.
As shown in Figure 9b, there was a primary effect on the average time of the different target sizes (F2.222, 24.445 = 24.893, p < 0.001). A post hoc test showed no significant difference between the 3 × 3 and 4 × 4 levels (p = 0.231). There was no significant difference between the 5 × 5 and 6 × 6 levels (p = 0.270). There was no significant difference between the 7 × 7 and 8 × 8 levels (p = 0.142). The 3 × 3 level had the fastest completion time, and the 8 × 8 level had the slowest completion time. The higher the target size level, the longer the time needed to select the target. The largest increase in selection time for adjacent levels was from the 6 × 6 to the 7 × 7 level. Thus, the target size of 6 × 6 (50.67 mm length and 40 mm width) provided a threshold of the most selections without a noticeable change in selection time.
Further analysis of target size level × target region on selection time showed there was no significant interaction (F4.912, 54.027 = 1.575, p = 0.184), see Figure 9c. The shortest selection time was needed when users selected a target in the 3 × 3 level. The second shortest level was the 4 × 4 level, while the 8 × 8 level took the longest time.

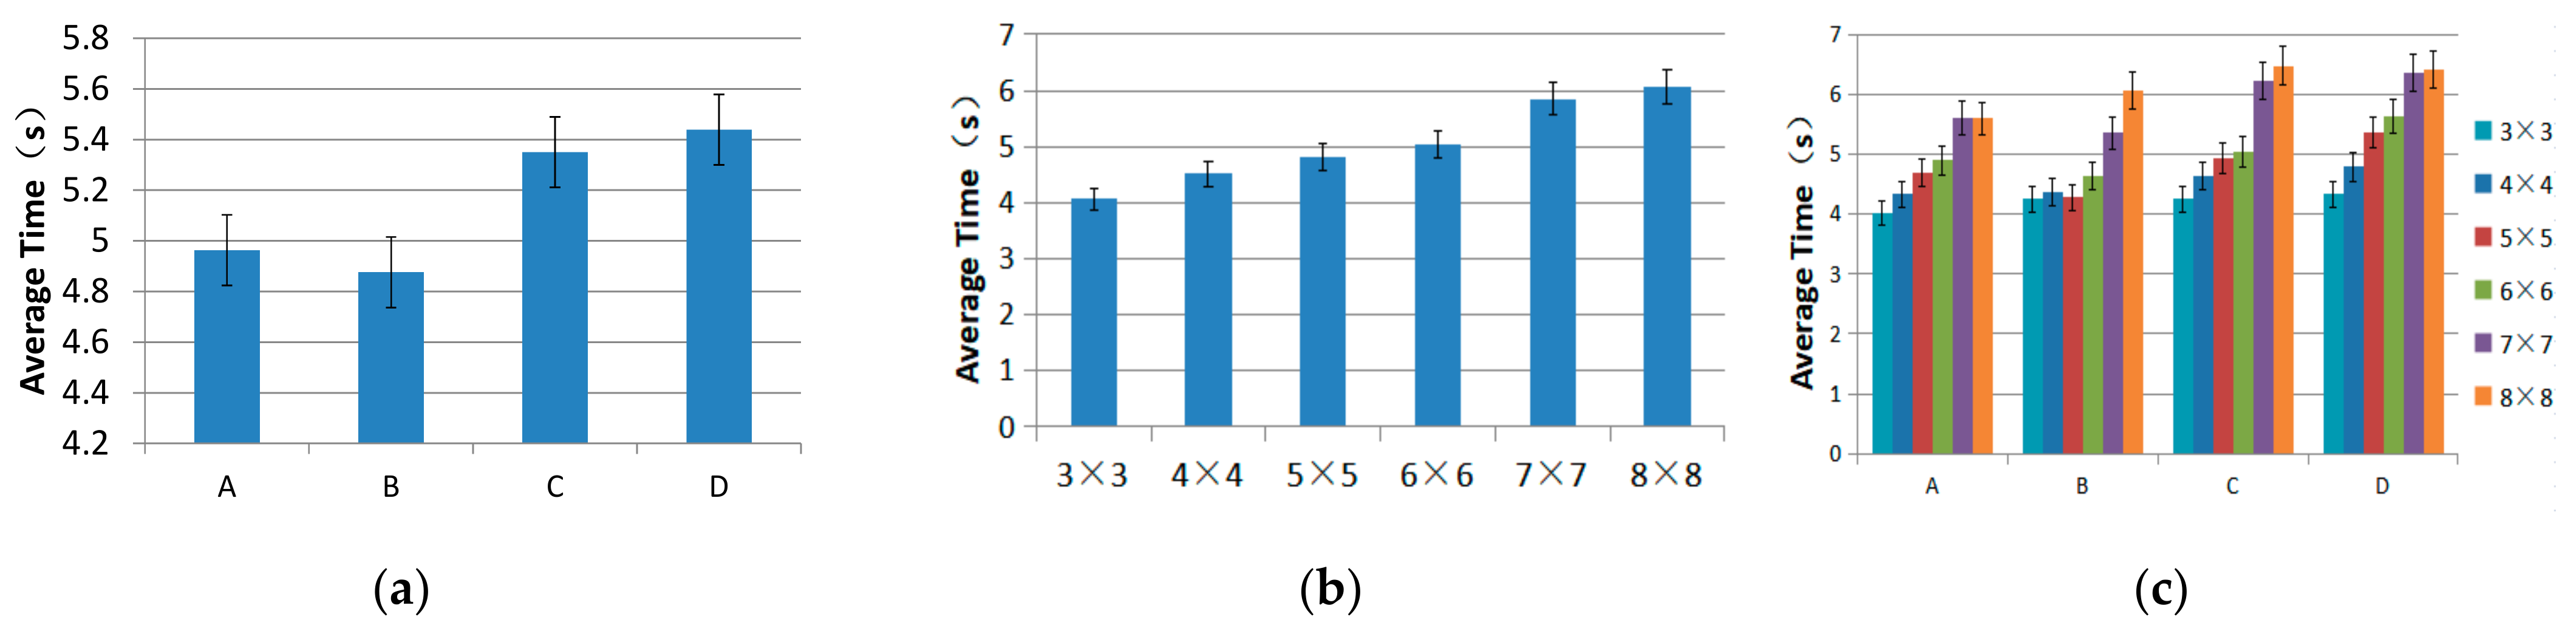
4.3.2. Selection Error Rate

There was no significant effect concerning the average error rate of the different regions (F3, 33 = 0.909, p = 0.447), see Figure 10a. The post hoc tests showed no significant differences among all the regions (p = 0.670). Region B had the lowest completion error rate, and region C had the highest.
As shown in Figure 10b, there was no significant effect concerning the average error rate of the different target sizes (F5, 55 = 4.388, p = 0.002). The post hoc tests showed no significant differences among all the levels of target size (p > 0.156), except for the 3 × 3 level and 6 × 6 level (p = 0.030). The 3 × 3 level had the lowest completion error rate, and the 8 × 8 level had the highest completion error rate. The higher the target size level, the higher the error rate needed to select a target. The largest increase in the selection error rate for adjacent levels was from the 4 × 4 to the 5 × 5. Thus, a target size of 4 × 4 (76 mm length and 60 mm width) provided a threshold of the most selections without a noticeable change in selecting error rate.
Further analysis of the target size level × target region on selection error rate showed there were no significant interaction (F5.122, 56.337 = 1.524, p = 0.196), see Figure 10c. On average, the 3 × 3 target size level had the lowest selection error rate. The second-lowest selection error rate was for the 4 × 4 level. The 8 × 8 level produced the highest error rate. The participants reached the lowest selection error rate (3.54%) when the target region was B (upper-right corner), and the highest error rate (6.31%) when the target region was C (bottom-left corner).

4.4. Comparative Experiment 2

The participants in Experiment 2 were the same as in the pilot study, so they were trained and familiar with the experiment. To eliminate this influence, we invited 12 external participants who did not know the experiment in advance. The experiment process was the same as experiment 2.

4.4.1. Selection Time

We found a main effect on the average time of different regions (F3, 33 = 13.474, p < 0.001), see Figure 11a. The post hoc tests showed a significant difference between regions A and C (p = 0.007) and regions A and D (p = 0.003). There was a significant difference between regions B and C (p = 0.042) and regions B and D (p = 0.002). Other regions had no significant differences among them (p > 0.994). Region B had the fastest completion time, and region D had the slowest completion time.
As shown in Figure 11b, there was a main effect on the average time of the different target sizes (F2.222, 24.445 = 25.009, p < 0.001). A post hoc test showed no significant difference between the 3 × 3 and 4 × 4 levels (p = 0.227). There was no significant difference between the 5 × 5 and 6 × 6 levels (p > 0.05). There was no significant difference between the 7 × 7 and 8 × 8 levels (p > 0.05). The 3 × 3 level had the fastest completion time, and the 8 × 8 level had the slowest completion time.
Further analysis of target size level × target region on selection time showed there was no significant interaction (F4.912, 54.027 = 1.574, p = 0.184), see Figure 11c.

4.4.2. Selection Error Rate

There was no significant effect for the average error rate of the different regions (F3, 33 = 0.883 p = 0.46), see Figure 12a. The post hoc tests showed no significant differences among all the regions (p > 0.05). Region B had the lowest completion error rate, and region C had the highest completion error rate.
As shown in Figure 12b, there was no significant effect for the average error rate of the different target sizes (F5, 55 = 3.193, p = 0.013). The post hoc tests showed no significant differences among all the levels of target size (p > 0.109). The 3 × 3 level had the lowest completion error rate, and the 8 × 8 level had the highest completion error rate.
Further analysis of the target size level × target region on selection error rate showed there were no significant interaction (F6.461,71.069 = 1.085, p = 0.381), see Figure 12c. Compared to Experiment 2, the error rate of this experiment was slightly higher, and the average time was slightly longer, caused by the fact that new participants were not familiar with the experiment. The results showed that the regions (and levels) with the highest or lowest error rates were the same as in Experiment 2. The regions (and levels) with the fastest or slowest average time were the same as Experiment 2, as shown in Figure 11 and Figure 12.

5. Discussion & Conclusions

In this work, we analyzed the users’ common operational area regarding partitioning and the difference in spatial controllability between a sighted and a visually impaired individual. We introduced three experiments and a pilot study concerning the common spatial range and the thresholds of the target size level in the spatial region for a sighted and visually impaired individual. We compared the speed and accuracy of the target dimensions of six different levels and the difference in speed and accuracy among the four azimuth regions of A, B, C, and D in both visual and non-visual scenarios. Many of our performance study results were statistically significant, which allows us to draw many meaningful conclusions about human-computer interaction in spatial regions that can be used for designing techniques for sighted and visually impaired individuals. This paper focused on systematically analyzing the common operational range of one dimension and the threshold of two dimensions. The results are as follows:
  • Common operational range. As a result of the pilot study, the horizontal range of the common operational range was the interval of (−152, +152), and the vertical range was the interval of (80, 320), which means that the rectangle’s length was 304 mm, and the width was 240 mm.
  • Threshold of target size levels. For a sighted person, the threshold target size was the 5 × 5 level, whose length was 60.8 mm, and the width was 48 mm. For a visually impaired individual, the threshold target size was the 4 × 4 level, whose length was 76 mm, and the width was 60 mm.
  • Target region thresholds. For a sighted individual, the threshold target regions were region B with the shortest selection time, and region D with the lowest selection error rate. There was a significant difference between regions B and D. For a visually impaired individual, the threshold target region with the shortest selection time was region B. There were no significant differences in the error rate of target selection among all the levels.
Based on the above results and findings, we have developed a set of preliminary guidelines regarding target selection in spatial partitioning scenarios:
  • For visual scenarios, Region D (the bottom-right corner) is not recommended when high speed in selecting a target is needed. However, due to its lower error rate, region D remains a good alternative for scenes with higher requirements for a correct rate.
  • For visual scenarios, the 6 × 6 level (50.7 mm × 40 mm) is not recommended because both its error rate and the average time were high. We recommend the 5 × 5 level (60.8 mm × 48 mm) after considering the selection time and error rate.
  • For non-visual scenarios, we recommend region B (the upper-right corner) after considering the selection time and error rate. Another reason is that region B costs the least time and error rate when selecting targets.
  • For non-visual scenarios, we recommend the 4 × 4 level (76 mm × 60 mm) after considering the selection time and error rate because it served as the threshold.
In the case of vision, researchers can refer to the design suggestions in Table 3 when studying the space operation capabilities between users and computer screens or designing interactive technologies based on spatial regions. In the case of non-vision, researchers can refer to the design suggestions in Table 4 when studying the space operation capabilities between users and computer screens or designing interactive technologies based on spatial regions.
Based on these results, we propose two techniques for two different application scenarios, described in the following paragraphs.
A spatial gesture recognition technique for surgery can help users select targets by using spatial region cognition and hand gestures during surgery. This technique is designed based on the partitioning strategies of a common operational spatial region array. This technique can meet the strict requirements of sanitary conditions during surgery (as opposed to a touchscreen and most other existing interfaces).
Non-visual selection is a system integrated with screen reading software allowing a visually impaired person to select targets easily. This technique is designed based on the partitioning strategies of a common operational spatial region array. Users can use this system to interact with the internet and web more easily. In addition, the user no longer needs a keyboard because this system uses Leap Motion to detect a users’ hand motions and provides voice guidance when choosing targets and to do further work.
In the future, we will further expand the results of this study and contribute to technology accessibility for visually impaired individuals, including the exploration of a threshold for three-dimensional interaction.

Author Contributions

Methodology, validation, data curation, writing—review and editing, visualization, H.W.; conceptualization, formal analysis, resources, supervision, project administration, funding acquisition, J.Y.; software, data curation, methodology, writing—original draft preparation, Y.Z.; formal analysis, resources, supervision, project administration, investigation, Y.H.; investigation, supervision, methodology, resources, X.Z.; methodology, resources, formal analysis, supervision, S.W. All authors have read and agreed to the published version of the manuscript.

Funding

This work was funded by the National Natural Science Fund, grant (61741206).

Acknowledgments

The author thanks the editor and others for their comments and suggestions for this article.

Conflicts of Interest

The authors declare no conflict of interest.

References

  1. Lee, M.; Bae, J. Deep learning based real-time recognition of dynamic finger gestures using a data glove. IEEE Access 2020, 8, 219923–219933. [Google Scholar] [CrossRef]
  2. Marin, G.; Dominio, F.; Zanuttigh, P. Hand gesture recognition with leap motion and Kinect devices. In Proceedings of the 2014 IEEE International Conference on Image Processing (ICIP), Paris, France, 27–30 October 2014. [Google Scholar]
  3. Chatterjee, I.; Xiao, R.; Harrison, C. Gaze+gesture: Expressive, precise and targeted free-space interactions. In Proceedings of the 2015 ACM on International Conference on Multimodal Interaction (ICMI ′15), Association for Computing Machinery, New York, NY, USA, 9–13 November 2015; pp. 131–138. [Google Scholar]
  4. Chalasani, T.; Smolic, A. Simultaneous segmentation and recognition: Towards more accurate ego gesture recognition. In Proceedings of the 2019 IEEE International Conference on Computer Vision Workshops, Seoul, Korea, 27–28 October 2019. [Google Scholar]
  5. Martinez, J.; Griffiths, D.; Biscione, V.; Georgiou, O.; Carter, T. Touchless haptic feedback for supernatural VR Experiences. In Proceedings of the 25th IEEE Conference on Virtual Reality and 3D User Interfaces, VR 2018-Proceedings, Tuebingen/Reutlingen, Germany, 18–22 March 2018. [Google Scholar]
  6. Park, J.; Jin, Y.; Cho, S.; Sung, Y.; Cho, K. Advanced machine learning for gesture learning and recognition based on intelligent big data of heterogeneous sensors. Symmetry 2019, 11, 929. [Google Scholar] [CrossRef] [Green Version]
  7. Zhang, Y.; Yang, Z.; Zhang, G.; Wu, C.; Zhang, L. XGest: Enabling Cross-Label gesture recognition with RF signals. ACM Trans Sens. Netw. TOSN 2021, 17, 1–23. [Google Scholar] [CrossRef]
  8. Liu, M.; Nancel, M.; Vogel, D. Gunslinger: Subtle arms-down mid-air interaction. In Proceedings of the 28th Annual ACM Symposium on User Interface Software & Technology (UIST ′15), Association for Computing Machinery, New York, NY, USA, 9 August 2015; pp. 63–71. [Google Scholar]
  9. Zaiţi, I.A.; Pentiuc, S.G.; Vatavu, R.D. On free-hand TV control: Experimental results on user-elicited gestures with leap motion. Pers. Ubiquitous Comput. 2015, 5, 821–838. [Google Scholar] [CrossRef]
  10. Sa-Nguannarm, P.; Senavongse, W.; Charoenpong, T.; Kiatsoontorn, K. Hand movement recognition by using a touchless sensor for controlling images in operating room. In Proceedings of the 2018 International Electrical Engineering Congress (iEECON), Krabi, Thailand, 7–9 March 2018. [Google Scholar]
  11. Liu, C. Leveraging physical human actions in large interaction spaces. In Proceedings of the Adjunct Publication of the 27th Annual ACM Symposium on User Interface software and Technology (UIST ′14 Adjunct), Association for Computing Machinery, New York, NY, USA, 5–8 October 2014; pp. 9–12. [Google Scholar]
  12. Aslan, I.; Krischkowsky, A.; Meschtscherjakov, A.; Wuchse, M.; Tscheligi, M. A leap for touch: Proximity sensitive touch targets in cars. In Proceedings of the 7th International Conference on Automotive User Interfaces and Interactive Vehicular Applications (AutomotiveUI ′15), Association for Computing Machinery, New York, NY, USA, 1–3 September 2015; pp. 39–46. [Google Scholar]
  13. Feng, J.; Shengping, Z.; Shen, W.; Yang, G.; Debin, Z. Multi-Layered gesture recognition with kinect. J. Mach. Learn. Res. 2015, 1, 227–254. [Google Scholar]
  14. Spindler, M.; Stellmach, S.; Dachselt, R. PaperLens: Advanced magic lens interaction above the tabletop. In Proceedings of the ACM International Conference on Interactive Tabletops and Surfaces (ITS ′09), Association for Computing Machinery, New York, NY, USA, 23–25 November 2009; pp. 69–76. [Google Scholar]
  15. Cockburn, A.; Quinn, P.; Gutwin, C.; Ramos, G.; Looser, J. Air pointing: Design and evaluation of spatial target acquisition with and without visual feedback. Int. J. Hum. Comput. Stud. 2011, 6, 401–414. [Google Scholar] [CrossRef]
  16. Gareth, Y.; Hamish, M.; Daniel, G.; Elliot, P.; Robert, B.; Orestis, G. Designing mid-air haptic gesture controlled user interfaces for cars. ACM Hum.-Comput. Interact. 2020, 4, 1–23. [Google Scholar]
  17. Spindler, M.; Schuessler, M.; Martsch, M.; Dachselt, R. Pinch-Drag-Flick vs. spatial input: Rethinking zoom & pan on mobile displays. In Proceedings of the SIGCHI Conference on Human Factors in Computing Systems (CHI ′14), Association for Computing Machinery, New York, NY, USA, 26 April–1 May 2014; pp. 1113–1122. [Google Scholar]
  18. Jingyu, C.; Victoria, K.; Alan, M.; Elias, G.; David, H.; Joseph, T. A momentum-conserving implicit material point method for surface tension with contact angles and spatial gradients. ACM Trans. Graph. 2021, 4, 1–16. [Google Scholar]
  19. Lee, M.; Kwahk, J.; Han, S.H.; Lee, H. Relative pointing interface: A gesture interaction method based on the ability to divide space. Int. J. Ind. Ergon. 2020, 75, 02878. [Google Scholar] [CrossRef]
  20. Cha, Y.; Myung, R. Extended Fitts’ law for 3D pointing tasks using 3D target arrangements. Int. J. Ind. Ergon. 2013, 4, 350–355. [Google Scholar] [CrossRef]
  21. Brand, D.; Meschtscherjakov, A.; Büchele, K. Pointing at the HUD: Gesture interaction using a leap motion. In Proceedings of the 8th International Conference on Automotive User Interfaces and Interactive Vehicular Applications (AutomotiveUI ‘16 Adjunct), Association for Computing Machinery, New York, NY, USA, 24–26 October 2016; pp. 167–172. [Google Scholar]
  22. Davis, M.M.; Gabbard, J.L.; Bowman, D.A.; Gracanin, D. Depth-Based 3D gesture multi-level radial menu for virtual object manipulation. In Proceedings of the 2016 IEEE Virtual Reality (VR), Greenville, SC, USA, 19–23 March 2016. [Google Scholar]
  23. Schinazi, V.; Thrash, T.; Chebat, D. Spatial navigation by congenitally blind individuals. In Wiley Interdisciplinary Reviews: Cognitive Science; Wiley & Sons: New York, NY, USA, 2016. [Google Scholar]
  24. Abidin, A.H.Z.; Xie, H.; Wong, K.W. Touch screen with audio feedback: Content analysis and the effect of spatial ability on blind people’s sense of position of web pages. In Proceedings of the 2013 International Conference on Research and Innovation in Information Systems (ICRIIS), Kuala Lumpur, Malaysia, 27–28 November 2013. [Google Scholar]
  25. Muniandy, M.; Sulaiman, S. Touch sensation as part of multimedia design elements to improve computer accessibility for the blind users. In Proceedings of the 2017 International Conference on Research and Innovation in Information Systems (ICRIIS), Langkawi, Malaysia, 16–17 July 2017. [Google Scholar]
  26. Khambadkar, V.; Folmer, E. GIST: A gestural interface for remote nonvisual spatial perception. In Proceedings of the 26th Annual ACM Symposium on User Interface Software and Technology (UIST ′13), Association for Computing Machinery, New York, NY, USA, 8–11 October 2013; pp. 301–310. [Google Scholar]
  27. Khurana, R.; McIsaac, D.; Lockerman, E.; Mankoff, J. Nonvisual interaction techniques at the keyboard surface. In Proceedings of the 2018 CHI Conference on Human Factors in Computing Systems (CHI ′18). Association for Computing Machinery, New York, NY, USA, 21–26 April 2018; pp. 1–12. [Google Scholar]
  28. Wahab, M.; Mohamed, A.; Sukor, A.; Teng, O. Text reader for visually impaired person. In Journal of Physics: Conference Series; IOP Publishing: Bristol, UK, 2021. [Google Scholar]
  29. Jinmo, K. VIVR: Presence of immersive interaction for visual Impairment virtual reality. IEEE Access 2020, 8, 196151–196159. [Google Scholar]
Figure 1. Schematic figure of experimental process and equipment: (a) experimental process, including pilot study, experiment 1 and 2; (b) the detectable spatial area of Leap Motion; (c) coordinate system of Leap Motion.
Electronics 10 03078 g001
Figure 2. The beginning interface of the pilot experiment: (a) the horizontal experiment; (b) the vertical experiment.
Electronics 10 03078 g002
Figure 3. The results of the pilot study: (a) the results of the horizontal experiment; (b) the results of the vertical experiment.
Electronics 10 03078 g003
Figure 4. The experiment interface of Experiments 1 and 2: (a) experiment interface of the 5 × 5 level; (b) experiment interface of the 8 × 8 level.
Electronics 10 03078 g004
Figure 5. The average time of Experiment 1. The error bars represent a 95% confidence interval: (a) average selection time with different regions; (b) average selection time with different target size levels; and (c) average selection time for different target size levels and different regions (A, B, C, and D).
Electronics 10 03078 g005
Figure 6. The error rate of Experiment 1. The error bars represent a 95% confidence interval: (a) average error rate with different regions; (b) average error rate with different target size levels; and (c) average error rate for different target size levels under different regions (A, B, C, and D).
Electronics 10 03078 g006
Figure 7. The average time of comparative Experiment 1. The error bars represent a 95% confidence interval: (a) average selection time with different regions; (b) average selection time with different target size levels; and (c) average selection time for different target size levels and different regions (A, B, C, and D).
Electronics 10 03078 g007
Figure 8. The error rate of comparative Experiment 1. The error bars represent a 95% confidence interval: (a) average error rate with different regions; (b) average error rate with different target size levels; and (c) average error rate for different target size levels under different regions (A, B, C, and D).
Electronics 10 03078 g008
Figure 9. Average times of Experiment 2. Error bars represent a 95% confidence interval: (a) average selection time with different regions; (b) average selection time with different target size levels; and (c) average selection time for different target size levels under different regions (A, B, C, and D).
Electronics 10 03078 g009
Figure 10. The error rate of Experiment 2. The error bars represent a 95% confidence interval: (a) average error rate with different regions; (b) average error rate with different target size levels; (c) average error rate for different target size levels under different regions (A, B, C, and D).
Electronics 10 03078 g010
Figure 11. The average time of comparative Experiment 2. The error bars represent a 95% confidence interval: (a) average selection time with different regions; (b) average selection time with different target size levels; and (c) average selection time for different target size levels and different regions (A, B, C, and D).
Electronics 10 03078 g011
Figure 12. The error rate of comparative Experiment 1. The error bars represent a 95% confidence interval: (a) average error rate with different regions; (b) average error rate with different target size levels; and (c) average error rate for different target size levels under different regions (A, B, C, and D).
Electronics 10 03078 g012
Table 1. The position of each region.
RegionABCD
PositionUpper LeftUpper RightBottom LeftBottom Right
Table 2. The target size (length × width) at each level of the experimental condition.
Level3 × 34 × 45 × 56 × 67 × 78 × 8
Size (mm)101.33 × 8076 × 6060.8 × 4850.7 × 4043.43 × 34.2938 × 30
Table 3. Design suggestions for selecting spatial targets under visual conditions.
Longest TimeShortest TimeTime ThresholdHighest Error RateLowest Error RateError ThresholdProposal
Size43.43 × 34.2960.8 × 4860.8 × 4838 × 30101.33 × 8060.8 × 4860.8 × 48
RegionDB/CD/D
Table 4. Design suggestions for selecting spatial targets under non-visual conditions.
Longest TimeShortest TimeTime ThresholdHighest Error RateLowest Error RateError ThresholdProposal
Size38 × 3050.7 × 4050.7 × 4038 × 30101.33 × 8076 × 6076 × 60
RegionDB/CB/D
Publisher’s Note: MDPI stays neutral with regard to jurisdictional claims in published maps and institutional affiliations.

