Abstract
Early and objective autism spectrum disorder (ASD) assessment, as well as early intervention are particularly important and may have long term benefits in the lives of ASD people. ASD assessment relies on subjective rather on objective criteria, whereas advances in research point to up-to-date procedures for early ASD assessment comprising eye-tracking technology, machine learning, as well as other assessment tools. This systematic review, the first to our knowledge of its kind, provides a comprehensive discussion of 30 studies irrespective of the stimuli/tasks and dataset used, the algorithms applied, the eye-tracking tools utilised and their goals. Evidence indicates that the combination of machine learning and eye-tracking technology could be considered a promising tool in autism research regarding early and objective diagnosis. Limitations and suggestions for future research are also presented.
1. Introduction
The Diagnostic and Statistical Manual of Mental Disorders defines autism spectrum disorder (ASD) as a highly complicated neurodevelopmental disorder with complex etiological causes [1] characterised by social communication/interaction difficulties and repetitive behaviours/interests [2], prevalent in 1% of the world’s population [3]. It was first introduced by Kanner [4], who described it as involving “resistance to change” and “need for sameness”. Asperger in [5] defined ASD as “autistic psychopathy,” meaning autism (self) and psychopathy (personality). ASD reaches a high male-to female ratio, attaining an average of 4:1, a steep increase to 10:1 in “high functioning autism” or Asperger syndrome and a fall to 2:1 in people presenting comorbidity with moderate-to-severe intellectual disability [6].
In addition to reduced social interaction and communication, restricted, repetitive, and stereotyped behaviour, people with ASD tend to show a deficit in eye gaze, a characteristic which cannot cause autism [2] but which constitutes an important item in several diagnostic tests [7]. Eye gaze deficits of ASD people are related both to social and non-social stimuli. As far as social and facial stimuli are concerned, individuals with ASD are likely to have difficulties to preferentially attend both biological motion, i.e., gestures of the body, expressions of the face, as well as the eyes of others [8]. In other words, individuals with ASD tend to show visual differences in visual attention to faces, compared to typically developing ones. Regarding non-social stimuli, individuals with ASD appear to show differences in comparison with typically developing people, i.e., impaired global and intact local visual processing [9].
Early ASD assessment and intervention have long-term outcomes for ASD children and their families, who require educational, medical, social, and economic support to improve the quality of their lives. ASD assessment challenges professionals, as there are not any well-established biophysiological diagnostic tests [10,11]. Thus, diagnosis is usually based on behavioural assessment, employing standardised tools of high validity and reliability, such as the Autism Diagnostic Observation Schedule (ADOS) [7] and the Autism Diagnostic Interview-Revised (ADI-R) [12]. These tools, broadly recognised in research, are presented as the gold standard for ASD diagnosis regarding clinical settings [13,14]. Nevertheless, their utilisation requires numerous materials, takes considerable time and is rather costly [10,11]. In addition, complex clinical protocols are included, whereas experienced and trained interviewers, who can affect the diagnostic procedure, are required [10,11,15]. Taken together, these challenges can often lead to a delayed diagnosis, resulting in a delay regarding the onset of early intervention [11]. Literature shows that when interventions start before ASD children reach age 5, children show a significantly increased success rate (67%), in comparison with the 11% success rate when interventions start later than age 5 [16].
Eye-tracking technology is considered an advantageous approach to ASD research, as it offers the ability to detect autism and features of it [8,17] earlier and in a more objective and reliable way than conventional assessment [18]. There has been a steep increase in the number of eye-tracking studies concerning autism during the last decade, either due to easier access to eye-tracking technology [19], or because of the special devices and software devised contributing to easier and less-expensive recording of eye-tracking data [18].
Eye-tracking instruments are often combined with modern artificial intelligence techniques, such as machine learning, a data driven technique, based on advanced learning of mathematics, statistical estimation, and theories of information [20] in which the computer algorithm is trained in order to analyse a set of data observed and learns the latent patterns in a statistical approach [20,21]. Machine learning can contribute to autism research by providing a less biased and reproducible second opinion [22], i.e., early autism screening [23] and diagnosis enhancement [20], as well as different behaviours [24] and brain activity observation [25]. Moreover, machine learning can be a valid biomarker-based technique that can contribute to objective ASD diagnosis [26]. Machine learning has also been applied in the Internet of Things (IoT) systems for ASD assessment [27,28]. Finally, regarding intervention, the quality of life of ASD people can be improved by assistive technology in the training of children with autism spectrum disorders [29].
Our Contribution
This systematic review provides a comprehensive discussion of the literature concerning machine learning and eye-tracking ASD studies conducted since 2015. To our knowledge, although machine learning and eye-tracking technology hold promise for earlier and more objective autism diagnosis, this is the first systematic review study concerning machine learning and eye-tracking ASD studies, irrespective of the stimuli/tasks and dataset used, the algorithms applied, the eye-tracking tools utilised, and their goals. The only systematic review, similar to this one, presents 11 papers about early ASD assessment which applied ML models related only to children’s social visual attention (SVA) [26]. Thus, the present study reviews machine learning and eye-tracking technology ASD studies formulating the hypothesis that machine learning and eye-tracking technology can contribute to an earlier and more objective ASD detection.
2. Method
Search Strategy
The present study is an extended version of the systematic review presented on 7 July 2021, in the 10th International Conference on Modern Circuits and Systems Technologies. Studies were selected on 2 different dates, i.e., on 24 December 2020, and on 19 September 2021, from the PubMed® database. Searches on the database were carried out by the first author and aimed at identifying English, full-text articles, published after 2015, utilising the following Boolean string ((((eye-tracking) OR (gaze)) OR (eye movement)) AND (autism)) AND (Machine Learning). Studies complying with the following inclusion criteria were selected: (a) patient groups had an ASD diagnosis, although there were also participants with ASD and ASD+ADHD diagnosis in [30]; (b) control groups consisted of TD participants apart from one study with Low/Medium/High ASD risk and ASD participants only [31]; (c) participants’ ages ranged from toddlers to adults; (d) the aim of the studies was ASD detection using machine learning combined with eye-tracking technology. PRISMA recommendations concerning how to avoid the risk of bias were considered. Thus, the first author initially selected study abstracts and then he assessed full texts to check the inclusion criteria. Information relevant to the study was extracted, such as the aim of the study, ASD assessment, participants, eye-tracking tasks/stimuli, EM measures, ML models, data reduction techniques, results, and conclusions.
3. Results
3.1. Review Flow
The PRISMA 2020 flow diagram of study selection is presented in Figure 1. Searches on PubMed® identified 33 articles and one systematic review study. Fifteen of the articles were removed after their title and abstract had been screened. Twelve more articles were identified in the reference lists of chosen articles. Therefore, the present systematic review involves 30 articles and one systematic review study.
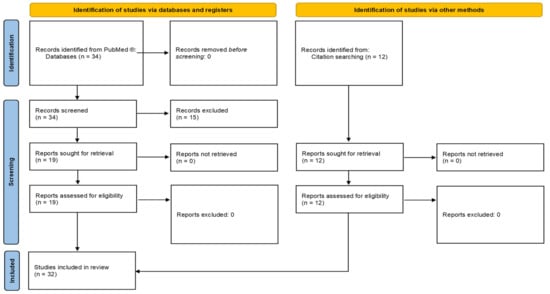
Figure 1.
PRISMA 2020 flow diagram of study selection.
3.2. Selected Studies of the Systematic Review
The selected studies are presented in Table 1 according to the stimuli and/or their topic.

Table 1.
Selected studies.
4. Discussion
The studies presented employed various eye-tracking instruments, applied machine learning in different ways, distributed several tasks, and had a wide range of sample sizes, age groups, and functional skills of participants. Specifically, four emotion recognition studies, seven video-based, twelve image-based, two web-browsing, one gaze and demographic features, one movement imitation, one virtual reality (VR) interaction, one social interaction task (SIT), and one face-to-face conversation study are presented.
4.1. Emotion Recognition Studies
Four eye-tracking and machine learning studies which distributed emotion recognition tasks were identified. In [32] a facial emotion recognition task was employed. Random Forest was applied to classify eye fixations of ASD and TD participants according to their task performance, gaze information, and face features. Results pointed to differences concerning response time and eye movements but no difference concerning emotion recognition accuracy. A high classification accuracy (86%) was achieved. In [30] the authors carried out one more eye-tracking and emotion recognition study and created a Random Forest regressor to predict an SRS-2 score [33] measuring social impairment and RBS-R score [34] measuring restricted, repetitive, and stereotyped behaviours and interests. ASD, ADHD, ASD+ADHD and TD participants were recruited. A high prediction accuracy was achieved on the SRS-2 total score (R2 = 0.325) and its subscales. RBS-R was also predicted with high accuracy (R2 = 0.302) concerning total score but not its subscales. In another study, the researchers compared the gaze and emotion recognition between ASD and TD children wearing Google Glass [35]. Three trials were conducted using 125 images. Elastic net model was applied as a base classifier. Elastic net classifiers, in addition to standard logistic regression classifiers, were trained on subsets of the features as well as three separate trials for various ablations. A classification accuracy of 0.71 was achieved across all trials by the model. Elastic net models showed a better performance compared to logistic regression ablation models utilised in most of the tasks. Due to the limited sample size, the authors did not manage to make a machine learning classifier that could outperform other classifiers in which only age and gender features were utilised.
Finally, Ref. [36] conducted a study in which the eye-movements of ASD and age- and IQ-matched TD participants were measured in three tasks containing facial stimuli. Participants were asked to observe a face (the Freeview task), recognise the emotional expression of this face (the Emotion recognition task), or evaluate whether the brow or the mouth in a particular face was wider (the Brow/Mouth task). The authors applied a facial features landmark detection algorithm [37], which finds key points related to several features of the face in an automatic way. Additionally, for each trial, visual information obtained from the surrounding area of the subject’s fixation locations was fed to a deep learning neural network classifier regarding emotion recognition. More particularly, a masked version of the face was presented in the trial made by a convolution of the initial image with a Gaussian filter and a smooth kernel density estimation. This version concerned the fixation distribution, preserving the areas of the face image on which the participant fixated and blurring the remaining ones. In this way, the ML algorithm contributed to face emotion decoding of the masked image. Additionally, regarding emotion recognition, a measure utilising the visual information obtained by the participant’s scan path was created. The emotion recognition task played the most important role in revealing differences between the participants. Specifically, TD participants achieved the highest accuracy (92%), and the ML algorithm achieved the same accuracy by using the TD participants’ data. However, ASD individuals achieved a lower accuracy (85%), whereas an accuracy of 90% was reached by the algorithm when the same set of images was given. ASD participants appeared to face difficulties with paying attention to the appropriate parts of the face in order to extract information related to emotion recognition when compared with TD participants.
Taken together, the above-mentioned studies show that emotion recognition can lead to valuable results in some eye-tracking and machine learning ASD studies. Specifically, in [36], emotion recognition task played the most important role in revealing differences between ASD and TD participants. Additionally, a high prediction accuracy was achieved in [30] regarding social impairment and restricted, repetitive, and stereotyped behaviours and interests. On the other hand, although there was a high classification accuracy in [32], there were no differences between ASD and TD participants when emotion recognition accuracy was taken into account. Finally, Elastic net models hold promises for future research when some of the constraints encountered in [35] are overcome.
4.2. Video-Based Studies
We identified seven studies which used videos with different stimuli. One study tracked young ASD and TD individuals’ gaze while they were watching four short videos [38]. Five features were calculated for each video, i.e., standard deviation of gaze points, standard deviation of difference in gaze points, standard deviation between the gaze and annotated object of interest, root mean square error (RMSE) between the gaze and annotated object of interest, and delay in looking at the object of interest. An SVM with a third-degree polynomial kernel was applied for ASD and TD classification. CARS scores were utilised to assess the severity of autism. A multi-layer perceptron regressor was employed. When all four videos were linked, and their features were combined into one feature vector, a high accuracy was achieved regarding autism detection with object of interest annotation (98.3%) and autism detection without object of interest annotation (93.3%). Additionally, videos were trimmed and 15 second random segments were presented. Particularly, the average accuracy was approximately 95.75% with the object of interest annotated, whereas a mean of 92.5% was achieved when the object of interest was not annotated. A proof-of-concept regression model was developed to estimate the severity of the condition, thus achieving a mean absolute error regarding CARS of 2.03. In another study, a 10 second video clip was displayed to children [39]. It was a muted video in which a woman was mouthing the alphabet. The goal of the study was to evaluate the fixation time spent on various areas of the female’s face. Permutation tests were used for AOI discrimination weight testing. The results showed that only the difference in time spent on fixating at the moving mouth and body was significant enough to differentiate ASD from TD children. SVM with fivefold-cross validation concerning the fixation time on AOIs was computed with an aim to differentiate ASD participants achieving high accuracy (85.1%), sensitivity (86.5%), and specificity (83.8%).
An automatic method based on two Long Short-Term Memory (LSTM) hidden layers of 20 neurons, each utilising different fitness values focusing on the cascade eye movements, i.e., amplitude, duration, acceleration, was used in [3]. ASD and TD children were asked to watch a joint-attention video while their gaze was being recorded. By employing a neural network, the status of 83% of ASD children with a confidence higher than 95% was validated. In [22], ASD and TD children were asked to watch videos that could be stimulating for their eye gaze. A visual representation of their eye gaze, i.e., scan paths, was created. Because the scan paths were few, image augmentation was used to produce synthetic samples by operating image transformations aiming at uncertainty reduction and accuracy increase. Data dimension was reduced by scaling all images down, converting them to greyscale, and using PCA. Traditional ML models, i.e., Naïve Bayes, SVM, and RF were applied. ANN were employed as well, including a single hidden layer consisting of 50, 200 and 500 neurons in addition to two hidden layers consisting of 80 and 40 neurons. Tenfold-cross validation was utilised. Results showed that traditional ML models had an average AUC of 0.7 when compared with ANN that achieved an accuracy higher than 90%. Specifically, the single hidden layer model consisting of 200 neurons had the best performance in discerning ASD participants (accuracy = 92%). Therefore, simple neural network models and a small dataset can be thought of as a promising approach reaching high classification accuracy.
ASD and TD children looked at the same social stimuli of [22] in [40]. The study aimed at ASD stratification concerning ASD eye movement clusters in relationship with the severity of disorder symptoms. Individual scan paths were made and scaled down for dimension reduction. There was a comparison of four feature extraction methods, i.e., scan paths conversion into grayscale, PCA, the t-Distributed Stochastic Neighbour Embedding technique (t-SNE) [41], and the autoencoder. Three k values were selected (k = 2, k = 3, k = 4) resulting in three clustering structures. According to the results obtained, when the k value was increased, the quality of clusters decreased. Moreover, clusters were poorly separated when either pixel-based features, or PCA, or t-SNE were used. On the contrary, autoencoder provided better cluster separation showing a relationship between faster eye movement and higher ASD symptom severity.
In [42], high-functioning ASD and age- and IQ-matched TD individuals participated in a free-viewing paradigm and watched movie clips presenting two or more characters engaged in conversation. An artificial neural network was trained for the segmentation of stimuli of 22 movie clips which were naturalistic and dynamic. Both ASD and TD individuals opted for gazing at specific features of the face. ASD participants paid less attention to the face in general than TD ones. Specifically, ASD participants spent less time looking at the centre of the face, i.e., the nose. However, there were no significant differences compared to TD participants when eye and mouth looking time were concerned. Furthermore, individual looking time rates showed a convergence to a stable mean, as more data were added. In other words, the combinations of 1, 3, 5, 8, and 11 movie clips showed that gaze duration on core features of the face turned out to be increasingly stable within-subject, within-group, and between-group levels.
Gazefinder was used to create the best-fit diagnostic algorithm with an aim to distinguish school-aged and adolescent ASD individuals from TD individuals of the same age [10]. The diagnostic performance was evaluated in two ways: the first was an ML procedure known as the leave-one-out (LOO) method. The second was a test in another control group, i.e., an independent sample of the same age range, aiming at the diagnostic predictability of the best-fit diagnostic algorithm validation. Social and preferential paradigms were utilised. Τhe sensitivity (74%), specificity (80%), and accuracy (78%) were relatively high and the area under curve (AUC) of the best-fit algorithm was 0.84. The cross-validation showed an AUC of 0.74 and the validation in the second control group was 0.91. Concerning its diagnostic performance, the best-fit algorithm performed in accordance with the diagnostic assessment tools for ASD.
The results of the video-based studies provide evidence that they can play an important role in ASD research as well. Specifically, the SVM algorithm brought high classification accuracy [39] even when the object of interest was not annotated [38]. The dataset size also played an important role as a high classification accuracy can be achieved by applying LSTM [3], whereas a broader dataset could have decreased both uncertainty and overfitting. On the contrary, simple neural network models combined with a small dataset could be a promising approach to reaching high classification accuracy [22]. In [40], the autoencoder provided better cluster separation, pointing to a relationship between faster eye movement and higher ASD symptom severity. The Artificial Neural Network applied in [42] showed that ASD participants spent less time looking at the centre of human faces, i.e., the nose of people engaged in conversations. Finally, Gazefinder, used to create the best-fit diagnostic algorithm, managed to distinguish school-aged and adolescent ASD individuals from TD individuals of the same age [10].
4.3. Image-Based Studies
Twelve studies employing images as stimuli were found. The first study, aiming to classify ASD and TD children, distributed pictures of Chinese female faces [43]. A posteriori AOIs were created from features based on eye gaze coordinates, eye motion, and a combination of variables extracted for each image per subject when k-means clustering was applied. An a priori AOI approach was applied as well and was computed on combined variables as a baseline feature extraction method, thus contributing to the comparison of the performance of different SVMs. A selection of eye gaze coordinates in addition to eye motion features were consequently depicted by using N-Gram modelling combined with the orderless frequency Bag of Words (BoW). Five different SVMs were trained. The SVM, which was based on BoW histogram features with combined variables obtained from k-means clustering, performed better in ASD discrimination (AUC = 0.92, Accuracy = 86.89%). In a study conducted by the same authors, ASD and TD children were asked to memorise many faces (Caucasian and Chinese) and recognise them between some additional Caucasian and Chinese faces [21]. For the definition of a posteriori AOIs, k-means clustering was utilised. Feature representation per image, concerning each subject, was provided by histogram feature extraction. There were differences in the features selected for clustering faces of the same race, faces of other races and all faces. The leave-one-out cross-validation strategy was applied for training set and test set separation, whereas a radial basis function (RBF) kernel SVM was trained aiming at image-level classification. RBF kernel SVM applied on all faces performed better than SVM applied on other race faces and same race faces (accuracy = 88.51%, sensitivity = 93.10%, specificity = 86.21%, AUC = 0.89). In [11], images were distributed as stimuli consisting of different types of content (social scene, human face, and object) and time of exposure (1 s, 3 s, 5 s). The aim of the study was to differentiate ASD from TD children by employing a kNN algorithm. “Social scene” stimulus combined with a 5 s exposure time reached the highest classification accuracy at 98.24% and was the most effective stimulus. Additionally, a 5 s exposure time reached the highest accuracy (95.24%).
In [44], low-functioning ASD and TD children were asked to see other-race faces, own-race strange faces, and own-race familiar faces as experimental stimuli. Specifically, the authors wanted to explore whether ASD children would show a difference in face- fixation patterns concerning the different types of faces in comparison with TD children. A K-means clustering algorithm was applied to divide each image into 64 Areas of Interest (AOIs), whereas the features were selected by utilising the minimal redundancy and maximal relevance (mRMR) algorithm. Support Vector Machine (SVM) was applied, based on eye-tracking data, to distinguish low-functioning ASD children from TD ones. Overall, the highest classification accuracy concerning unfamiliar, other-race faces was 72.50% (AUC = 0.77) with 32 of the 64 features selected. The highest classification accuracy concerning own-race strange faces was 70.63% (AUC = 0.76) with 18 features selected. Finally, the highest classification accuracy concerning own-race familiar faces was 78.33% (AUC = 0.84) with 48 features selected. The classification accuracy combining three types of faces reached a highest accuracy of 84.17% (AUC = 0.89) with 120 features selected.
In [45], electroencephalography (EEG) and eye-tracking data were combined for ASD children identification. SVM was applied. ASD and TD children participated in EEG recording and in an eye-tracking task, in which photos of an own-race young girl and of another-race young girl were displayed. There were eight a priori AOIs. ASD participants made less gazes on the face, nose and mouth concerning not only other-race, but also own-race faces. A minimum-redundancy-maximum-relevance method [46] was applied for feature selection computing. Own-race face, other-race face and both types of face SVM classification accuracy was compared showing that both types of face models achieved the best performance (accuracy = 75.89%, AUC = O.87). The combination of eye-tracking data with EEG data reached the highest classification accuracy (85.44%) and AUC (0.93) with 32 features selected.
In [47], the authors recruited high-functioning ASD and TD people and asked them to passively view 700 natural scene images using a novel, three-layered SVM saliency-model, which contained pixel-level attributes (e.g., contrast), object-level attributes (e.g., shape), and semantic-level attributes (e.g., faces) regarding 5551 annotated objects. According to the results, ASD individuals had a stronger bias for central fixation and their attention toward low-level saliency was stronger, whereas their attention toward semantic-level saliency was weaker. Specifically, ASD individuals paid less attention to faces and objects of another’s gaze in comparison with TD individuals. The statistical significance of this effect increased at later fixations. The stronger bias for central fixation in ASD individuals was associated with a slower saccade velocity. Regarding temporal analysis, the attentional differences of ASD individuals were more prominent at later fixations, when the importance of semantic-level effects increased. The computational saliency model results were confirmed by direct analysis of fixation characteristics, which showed that ASD individuals had an increased saliency for text and operability, i.e., objects that are mechanical and manipulable. Finally, low-level and/or object-level saliency cannot solely explain the semantic saliency difference shown in ASD individuals. The researchers of a recent study [48] were greatly inspired by the above-mentioned study [47]. The same eye-tracking data were used and a feature selection, based on the Fisher score method [49], was performed, aiming at finding the most discriminative images. Their goal was to obtain image features from natural scenes in an automatic way, using deep neural networks (DNNs) and finally utilising these features to differentiate ASD from TD people by training a linear SVM. The results revealed that TD participants could be better classified by what they looked at, instead of by the way they shifted their gaze. Moreover, images that had high Fischer scores could effectively distinguish the two groups of subjects. The bias for central fixation in ASD was the most differential information. The automatic approach proposed in this study contributed to a better understanding of ASD peoples’ attention traits without depending on any previously acquired knowledge of the disorder, achieving a high classification accuracy (92%).
CNN and LSTM were combined for ASD and TD children classification according to their scan paths [50]. The Saliency4ASD grand challenge eye movement dataset, i.e., an eye movement dataset publicly released for ASD classification algorithms evaluation containing eye movement data of 14 TD and 14 ASD children, was used [51]. Gaze data from ASD and TD children participating in a free-viewing task of 300 social and non-social images depicting either people, or objects, or naturalistic scenes were utilised. The Sal-GAN neural network [52] was used to create the reference saliency map followed by features extraction from the patches associated with eye gaze coordinates existing in the saliency map. The extracted features were fed to two CNN-LSTM architectures that showed differences concerning the number of layers. The six-layer CNN-LSTM architecture with batch normalisation achieved the best ASD discrimination performance (accuracy = 74.22%). In [53], the Saliency4ASD grand challenge eye movement dataset was used for ASD and TD children differentiation as well [51]. Two ML methods for ASD prediction were proposed. The first was a synthetic saccade approach called STAR-FC in which there was a representation of a typical non-ASD individual’s baseline scan path in combination with the real scan path and other auxiliary data that were input into a deep learning classifier. The second was a more holistic, image-based approach, according to which, the input image, combined with a sequence of fixation maps, was fed to a Convolutional Neural Network (CNN) or a Recurrent Neural Network (RNN). The image-based approaches showed a slightly better performance when compared with synthetic saccade approaches concerning both accuracy and AUC. A relatively high prediction accuracy (67.23%) was reached on the validation dataset and on the test dataset (62.13%). High and low-functioning ASD and TD children participated in a study in which a computerised visual-orienting task was distributed [15]. At the centre of a screen, a directional cue was presented, which was either the gaze of a human face, or the gaze of a cartoon face, or a pointing finger, or an arrow. Four pictures of objects were also presented in four directions around this directional cue, one of which was the target and the rest were the confounds. Participants were requested to follow the directional cue, to look at the picture of the target object, and fixate on the target to receive rewarding feedback. A KNN algorithm was applied reaching an overall classification accuracy of 81.08%. TD participants performed better than high-Functioning ASD ones, whereas high-Functioning ASD participants performed better than low-Functioning ASD ones. Non-gaze directional cues also contributed to group distinction, suggesting that people with ASD show domain-general visual orienting deficits.
In [54], there was an attempt to create an early ASD diagnosis tool based on raw videos recorded at home. The authors used a dataset of videos of ASD and TD children looking at their mothers’ images on a computer screen. The tracking learning detection algorithm was used to extract features as eye gaze trajectories from videos. Additionally, an accumulative histogram was introduced to examine gaze patterns of ASD and TD children derived from the trajectories of eye movements based on various amounts of video frames (20, 40, 50, and 100 video frames). SVM was applied to differentiate ASD from TD children. Principal component analysis (PCA) combined with kernel PCA (KPCA) were used for feature extraction and data dimension reduction. All the models reached an accuracy higher than 77%. However, the highest accuracies were achieved when KPCA was used. Additionally, SVM on 40 video frames was the best model (accuracy = 93.7%). There was one additional study by the same authors in which the same dataset was used, whereas an additional dataset of ASD children was added to balance the ASD and TD participants [55]. The tracking learning detection algorithm was used to extract features as eye gaze trajectories from videos. Then, features were divided into angle and length. Accumulative and non-accumulative histograms were created for single and combined features. These two histograms were fed to six three-layer LSTM networks for classification. Additionally, KPCA was computed for data reduction in order to feed six SVMs. SVM performance and LSTM performance were compared. Features based on accumulative histograms brought better results than those based on non-accumulative ones. Moreover, LSTM networks were 6.2% more accurate than SVM. LSTM, in combination with accumulative histograms on dataset 2, achieved the best ASD discrimination performance concerning accuracy (92.60%), sensitivity (91.9%), and specificity (93.4%). There was a balance between the ASD and TD participants when compared with the previous study [54], increasing the ML model’s validity. However, there was no controlled-setting and direct eye-movement measurement that could improve the accuracy and objectivity of the study.
Taken together, most image-based studies applied either the SVM algorithm on its own or combined with other algorithms. More particularly, in [43], the SVM, which was based on BoW histogram features with combined variables obtained from k-means clustering, performed better in ASD discrimination. In a study by the same authors, RBF kernel SVM applied on all faces showed the best performance [21]. SVM was applied in [44] based on eye-tracking data and reached the highest accuracy when three types of faces were combined. In [45], SVM was applied as well and the combination of eye-tracking data with EEG data reached the highest classification accuracy. A novel three-layered SVM saliency-model was applied in [47], showing that ASD people have atypical visual attention throughout multiple levels and categories of objects compared with TD ones. Linear SVM differentiated ASD from TD people without depending on any previously acquired knowledge of the disorder, achieving a high classification accuracy [48]. In [54], SVM on 40 video frames achieved the best discrimination accuracy. In one additional study by the same authors, the same dataset and an additional dataset of ASD children were used to balance the ASD and TD participants [55]. The LSTM networks were 6.2% more accurate than the SVM. The KNN algorithm was applied in two studies and a very good performance was achieved [11,15]. There were also two studies in which classification accuracy was lower. Specifically, the six-layer CNN-LSTM architecture with batch normalization achieved the best ASD discrimination performance between ASD and TD children [50]. Finally, an image-based approach with a sequence of fixation maps showed a slightly better performance concerning accuracy in ASD classification compared with a synthetic saccade approach called STAR-FC [53].
4.4. Web-Browsing Studies
The two web-browsing studies identified employed web-browsing tasks [18,56]. The first study used eye-tracking technology aiming to observe the eye movements of high-functioning ASD adults and non-ASD participants while they were doing two tasks on some web pages: Browsing and Searching [56]. Page-specific and generic Areas of Interest (AOIs) were defined. A logistic regression algorithm was applied. Search tasks achieved a best performance of 0.75 and Browse tasks achieved a best performance of 0.71 when training on selected media took place. Generic AOIs are more appropriate for tasks like the Browse task, whereas tasks, such as the Search task, need page-specific AOIs. Some additional variables, i.e., participant gender, the level of visual complexity of the web pages, or the correct answer AOI in the Search tasks, did not significantly influence the classification performance. The most recent study [18] contained similar tasks with the previous one. Specifically, the Browse task was the same as the one distributed in the first study, but the search time was limited to thirty seconds per page. In this way, difficulty was increased and there was a better results classification. Additionally, a Synthesis task was introduced, which was similar with the Search task in the first study, but asked participants to find at least two distinct elements on the page, compare them, and find a third element that was not explicit. The maximum time limit allowed per web page was 120 s. Generic and page-specific AOIs were defined but more extraction configurations were added than in the previous paper. Logistic regression algorithm was applied. Results showed that all tasks showed discrimination power and the classification accuracy achieved in this study was comparable to the accuracy in the previous study. Search task brought the best results (0.75), first Browse task and Synthesis task scored slightly lower, i.e., 0.74 and 0.73, respectively, whereas the Browse task of the present study scored a little lower (0.65). The increase in task difficulty, i.e., Synthesis task addition, did not bring better discrimination accuracy. In addition, both groups had different web-browsing strategies even when a web-browsing time limit existed. Finally, the content and granularity level and the AOIs present can affect the classification accuracy, unlike elements, such as the visual complexity of the pages and gender of the participants.
4.5. Gaze and Demographic Features Study
One study combining Gaze and Demographic features, such as age and gender, was carried out for autism classification [31]. Three machine learning classifiers, i.e., random regressions forests, C4.5 decision trees, and PART, were tested on participants with low -, medium -, and high-risk for ASD, and ASD participants as well. A high classification accuracy was reached regarding PART (96.2%), C4.5 (94.94%) and Random Regression Forest (93.25%), when outliers were removed.
4.6. Movement Imitation Study
In a study which dealt with eye gaze and motion tracking, ASD and TD adults were asked to be engaged in a simple movement imitation task [57]. SVM algorithm with radial basis function (RBF) was applied for classification. A combination of SVM-RFE, t-test, mRMR and ReliefF rankings was made for the generalisation of classifier predictions improvement. T-test with bagging and wrapped t-test were used for feature selection stability improvement. ASD and non-ASD participants were classified with 73% accuracy regarding kinematic measures, and with 70% accuracy regarding eye movement. When eye-tracking and kinematic measures were combined, an increased accuracy was achieved (78%). Overfitting and stable feature selection issues were overcome by applying nested validation and feature selection, which aimed at selection stability. The experimental condition containing the most discriminative features between ASD and non-ASD participants was when non-ASD participants successfully imitated unusual movement kinematics, whereas ASD participants failed to do so.
4.7. Virtual Reality (VR) Interaction Study
Virtual reality (VR) interaction was applied to ASD individuals as well [58]. A scenario with real-life objects depicting a couple in the garden with their dog was presented to see children’s visual mechanism. First, a preliminary experiment was carried out and then the scenario was distributed to TD adults aiming at building a machine learning model with two groups of people (low autistic traits group and high autistic traits group). Then, a test experiment took place in which the scenario was distributed to a group of young ASD males with the aim to evaluate machine learning models. Seven machine learning models were applied (Logistic regression, Naïve Bayes Classifier, kNN, SVM, Decision Tree, Random Forest, Gradient Boosting Decision Tree (GBDT)) and an eighth Ensemble Model that combined the previous models. The Ensemble Model achieved the best performance in the preliminary experiment (accuracy = 0.73, precision = 0.68, recall = 0.81, f1-score = 0.74 and AUC = 0.90). Additionally, 77% of the ASD participants in the test experiment were effectively verified as showing high levels of autistic traits. In other words, this model can predict high autistic traits and has good generalisation ability.
4.8. Social Interaction Task (SIT) Study
There was one study in which ASD and TD adults were asked to participate in a Social Interaction Task (SIT) [59]. Specifically, they sat in front of a computer screen and were informed that they were going to take part in a small conversation with a woman, whose part had been recorded. They were asked to behave like they were taking part in a natural conversation. The participants’ face, gaze behaviour, and voice were recorded while taking part in the interaction. The Random Forest approach was applied. The best accuracy (73%), sensitivity (67%), and specificity (79%) were reached only when facial expressions and vocal characteristics were considered. Gaze behaviour did not provide any evidence about significant group differences. One possible explanation could be that the eye gaze measurement was of low precision.
4.9. Face-to-Face Conversation Study
Eye-tracking technology was also applied in face-to-face conversations for ASD and TD children classification [60]. The combination of visual fixation and conversation length data was examined to evaluate if the ML model performance could be improved. Participants’ gaze was recorded while they were engaged in a structured interview with a female interviewer. The conversation consisted of four sessions arranged in chronological order: general questions, hobby sharing, yes/no questions, and question raising. Moreover, four Areas of Interest (AOIs) were analysed (eyes, mouth, whole face, and whole body). Four ML classifiers were utilised for classification, i.e., support vector machine (SVM), linear discriminant analysis (LDA), decision tree (DT), and random forest (RF). The SVM classifier achieved the highest accuracy, reaching 92.31% with the use of only three features, i.e., length of total session, mouth in the first session, whole body in the third session. The accuracy was higher than that acquired when using only visual fixation features (maximum accuracy: 84.62%), or only session-length features (maximum accuracy: 84.62%), showing that the combination of features could lead to accurate ASD and TD children classification.
5. Limitations
The limitations of the study could be summarised as follows: (a) studies were selected only from the PubMed® database; (b) search on PubMed® was carried out by using only one Boolean string; (c) only articles published after 2015 were included; and (d) the selected studies mainly utilised machine learning and eye-tracking technology. Future research could search for studies in more databases i.e., Scopus®, use more keywords while searching for articles, include studies published before 2015, and identify studies utilising additional tools/techniques for ASD assessment.
6. Conclusions
The present systematic review study involved 30 articles and 1 systematic review study concerning Machine Learning and eye-tracking ASD studies conducted since 2015. They were identified in PubMed® Database and most of them employed image and video stimuli. There were also four emotion recognition studies two of which found results of increased significance. In addition, there were two web-browsing studies, one gaze and demographic features study, one movement imitation study, one virtual reality (VR) interaction study, one social interaction task (SIT) study and one face-to-face conversation study.
It is difficult to compare the results of all the above-mentioned studies as they included different tasks and datasets, applied different algorithms, utilised different eye-tracking tools and had different goals. Moreover, there were limitations in some studies, such as limited sample size, difficulty to create and/or choose an appropriate algorithm/task and find significant eye-tracking results. Despite these differences and limitations, the results obtained showed that most of the studies utilised Machine Learning and eye-tracking technology for ASD classification and reached an accuracy higher than 80%. Additionally, there were five studies that applied Machine Learning and eye-tracking technology with a different approach. Finally, when Eye-tracking and Machine Learning were combined with Kinematic Measures and Electroencephalography (EEG), classification accuracy increased showing that multimodal assessment can be more reliable and accurate.
Therefore, the formulated hypothesis is supported, for the present systematic review study, and Machine Learning and eye-tracking technology appear to contribute to an earlier and more objective ASD detection. Regarding suggestions for future research, Machine Learning and eye-tracking technology could be used to identify not only ASD, but other disorders, such as anxiety and schizophrenia. The combination of Machine Learning and eye-tracking technology with other technological approaches could be promising for future research as well. Internet of Things (IoT)-based systems, for instance, could be considered as one more developing method used not only to improve ASD diagnosis, but also the Quality of Life of autistic people. Future research could also deal with assistive technology in the training of children with autism spectrum disorders, as it can play an important role in improving the quality of life of ASD children, whereas it is also thought to have potentials in intervention programmes and ASD research. Finally, we would also like to involve and apply Machine Learning, eye-tracking and other tools used for ASD assessment in our future research, i.e., systematic reviews and experiments.
Author Contributions
Conceptualization, K.-F.K., C.K.S.-D., P.S. and G.F.F.; methodology, K.-F.K.; validation, K.-F.K.; investigation, K.-F.K.; resources, K.-F.K.; data curation, K.-F.K., G.F.F.; writing—original draft preparation, K.-F.K.; writing—review and editing, K.-F.K., C.K.S.-D.; supervision, C.K.S.-D., P.S. and G.F.F.; project administration, C.K.S.-D., P.S. and G.F.F. All authors have read and agreed to the published version of the manuscript.
Funding
This project has received funding from the European Union’s Horizon 2020 research and innovation programme under grant agreement No 957406.
Conflicts of Interest
The authors declare no conflict of interest.
References
- Casanova, M.F. The Neuropathology of Autism. Brain Pathol. 2007, 17, 422–433. [Google Scholar] [CrossRef] [PubMed]
- American Psychiatric Association. Diagnostic and Statistical Manual of Mental Disorders, 5th ed.; American Psychiatric Association: Washington, DC, USA, 2013. [Google Scholar]
- Carette, R.; Cilia, F.; Dequen, G.; Bosche, J.; Guerin, J.-L.; Vandromme, L. Automatic Autism Spectrum Disorder Detection Thanks to Eye-Tracking and Neural Network-Based Approach. In Proceedings of the International Conference on IoT Technologies for Healthcare, Angers, France, 24–25 October 2017; Springer: Cham, Switzerland; pp. 75–81. [Google Scholar]
- Kanner, L. Autistic Disturbances of Affective Contact. Nerv. Child 1943, 2, 217–250. [Google Scholar]
- Asperger, H. Die “autistischen Psychopathen” Im Kindesalter. Eur. Arch. Psychiatry Clin. Neurosci. 1944, 117, 76–136. [Google Scholar] [CrossRef]
- Fombonne, E. Epidemiology of Pervasive Developmental Disorders. Pediatr. Res. 2009, 65, 591–598. [Google Scholar] [CrossRef]
- Lord, C.; Rutter, M.; DiLavore, P.C.; Risi, S. ADOS. Autism Diagnostic Observation Schedule. Manual; Western Psychological Services: Los Angeles, CA, USA, 2001. [Google Scholar]
- Klin, A.; Shultz, S.; Jones, W. Social Visual Engagement in Infants and Toddlers with Autism: Early Developmental Transitions and a Model of Pathogenesis. Neurosci. Biobehav. Rev. 2015, 50, 189–203. [Google Scholar] [CrossRef] [Green Version]
- Nayar, K.; Voyles, A.C.; Kiorpes, L.; Di Martino, A. Global and Local Visual Processing in Autism: An Objective Assessment Approach. Autism Res. 2017, 10, 1392–1404. [Google Scholar] [CrossRef]
- Tsuchiya, K.J.; Hakoshima, S.; Hara, T.; Ninomiya, M.; Saito, M.; Fujioka, T.; Kosaka, H.; Hirano, Y.; Matsuo, M.; Kikuchi, M. Diagnosing Autism Spectrum Disorder without Expertise: A Pilot Study of 5-to 17-Year-Old Individuals Using Gazefinder. Front. Neurol. 2021, 11, 1963. [Google Scholar] [CrossRef]
- Vu, T.; Tran, H.; Cho, K.W.; Song, C.; Lin, F.; Chen, C.W.; Hartley-McAndrew, M.; Doody, K.R.; Xu, W. Effective and Efficient Visual Stimuli Design for Quantitative Autism Screening: An Exploratory Study. In Proceedings of the 2017 IEEE EMBS International Conference on Biomedical & Health Informatics (BHI), Orlando, FL, USA, 16–19 February 2017; pp. 297–300. [Google Scholar]
- Lord, C.; Rutter, M.; Le Couteur, A. Autism Diagnostic Interview-Revised: A Revised Version of a Diagnostic Interview for Caregivers of Individuals with Possible Pervasive Developmental Disorders. J. Autism Dev. Disord. 1994, 24, 659–685. [Google Scholar] [CrossRef] [PubMed]
- Goldstein, S.; Ozonoff, S. Assessment of Autism Spectrum Disorder; Guilford Publications: New York, NY, USA, 2018. [Google Scholar]
- Kamp-Becker, I.; Albertowski, K.; Becker, J.; Ghahreman, M.; Langmann, A.; Mingebach, T.; Poustka, L.; Weber, L.; Schmidt, H.; Smidt, J. Diagnostic Accuracy of the ADOS and ADOS-2 in Clinical Practice. Eur. Child Adolesc. Psychiatry 2018, 27, 1193–1207. [Google Scholar] [CrossRef]
- He, Q.; Wang, Q.; Wu, Y.; Yi, L.; Wei, K. Automatic Classification of Children with Autism Spectrum Disorder by Using a Computerized Visual-Orienting Task. PsyCh J. 2021, 10, 550–565. [Google Scholar] [CrossRef] [PubMed]
- Fenske, E.C.; Zalenski, S.; Krantz, P.J.; McClannahan, L.E. Age at Intervention and Treatment Outcome for Autistic Children in a Comprehensive Intervention Program. Anal. Interv. Dev. Disabil. 1985, 5, 49–58. [Google Scholar] [CrossRef]
- Frank, M.C.; Vul, E.; Saxe, R. Measuring the Development of Social Attention Using Free-Viewing. Infancy 2012, 17, 355–375. [Google Scholar] [CrossRef] [PubMed]
- Yaneva, V.; Eraslan, S.; Yesilada, Y.; Mitkov, R. Detecting High-Functioning Autism in Adults Using Eye Tracking and Machine Learning. IEEE Trans. Neural Syst. Rehabil. Eng. 2020, 28, 1254–1261. [Google Scholar] [CrossRef] [PubMed]
- Sasson, N.J.; Elison, J.T. Eye Tracking Young Children with Autism. J. Vis. Exp. JoVE 2012, 61, 3675. [Google Scholar] [CrossRef] [PubMed] [Green Version]
- Bone, D.; Goodwin, M.S.; Black, M.P.; Lee, C.-C.; Audhkhasi, K.; Narayanan, S. Applying Machine Learning to Facilitate Autism Diagnostics: Pitfalls and Promises. J. Autism Dev. Disord. 2015, 45, 1121–1136. [Google Scholar] [CrossRef] [PubMed] [Green Version]
- Liu, W.; Li, M.; Yi, L. Identifying Children with Autism Spectrum Disorder Based on Their Face Processing Abnormality: A Machine Learning Framework. Autism Res. 2016, 9, 888–898. [Google Scholar] [CrossRef]
- Carette, R.; Elbattah, M.; Cilia, F.; Dequen, G.; Guérin, J.-L.; Bosche, J. Learning to Predict Autism Spectrum Disorder Based on the Visual Patterns of Eye-Tracking Scanpaths. In Proceedings of the HEALTHINF, Prague, Czech Republic, 22–24 February 2019; pp. 103–112. [Google Scholar]
- Peral, J.; Gil, D.; Rotbei, S.; Amador, S.; Guerrero, M.; Moradi, H. A Machine Learning and Integration Based Architecture for Cognitive Disorder Detection Used for Early Autism Screening. Electronics 2020, 9, 516. [Google Scholar] [CrossRef] [Green Version]
- Crippa, A.; Salvatore, C.; Perego, P.; Forti, S.; Nobile, M.; Molteni, M.; Castiglioni, I. Use of Machine Learning to Identify Children with Autism and Their Motor Abnormalities. J. Autism Dev. Disord. 2015, 45, 2146–2156. [Google Scholar] [CrossRef] [PubMed]
- Zhou, Y.; Yu, F.; Duong, T. Multiparametric MRI Characterization and Prediction in Autism Spectrum Disorder Using Graph Theory and Machine Learning. PLoS ONE 2014, 9, e90405. [Google Scholar] [CrossRef]
- Minissi, M.E.; Giglioli, I.A.C.; Mantovani, F.; Raya, M.A. Assessment of the Autism Spectrum Disorder Based on Machine Learning and Social Visual Attention: A Systematic Review. J. Autism Dev. Disord. 2021, 1–16. [Google Scholar] [CrossRef]
- Alam, M.E.; Kaiser, M.S.; Hossain, M.S.; Andersson, K. An IoT-Belief Rule Base Smart System to Assess Autism. In Proceedings of the 2018 4th International Conference on Electrical Engineering and Information & Communication Technology (iCEEiCT), Dhaka, Bangladesh, 13–15 September 2018; pp. 672–676. [Google Scholar]
- Hosseinzadeh, M.; Koohpayehzadeh, J.; Bali, A.O.; Rad, F.A.; Souri, A.; Mazaherinezhad, A.; Rezapour, A.; Bohlouli, M. A Review on Diagnostic Autism Spectrum Disorder Approaches Based on the Internet of Things and Machine Learning. J. Supercomput. 2020, 77, 2590–2608. [Google Scholar] [CrossRef]
- Syriopoulou-Delli, C.K.; Gkiolnta, E. Review of Assistive Technology in the Training of Children with Autism Spectrum Disorders. Int. J. Dev. Disabil. 2020, 1–13. [Google Scholar] [CrossRef]
- Jiang, M.; Francis, S.M.; Tseng, A.; Srishyla, D.; DuBois, M.; Beard, K.; Conelea, C.; Zhao, Q.; Jacob, S. Predicting Core Characteristics of ASD Through Facial Emotion Recognition and Eye Tracking in Youth. In Proceedings of the 2020 42nd Annual International Conference of the IEEE Engineering in Medicine & Biology Society (EMBC), Montreal, QC, Canada, 20–24 July 2020; pp. 871–875. [Google Scholar]
- Canavan, S.; Chen, M.; Chen, S.; Valdez, R.; Yaeger, M.; Lin, H.; Yin, L. Combining Gaze and Demographic Feature Descriptors for Autism Classification. In Proceedings of the 2017 IEEE International Conference on Image Processing (ICIP), Beijing, China, 17–20 September 2017; pp. 3750–3754. [Google Scholar]
- Jiang, M.; Francis, S.M.; Srishyla, D.; Conelea, C.; Zhao, Q.; Jacob, S. Classifying Individuals with ASD through Facial Emotion Recognition and Eye-Tracking. In Proceedings of the 2019 41st Annual International Conference of the IEEE Engineering in Medicine and Biology Society (EMBC), Berlin, Germany, 23–27 July 2019; pp. 6063–6068. [Google Scholar]
- Bruni, T.P. Test Review: Social Responsiveness Scale–Second Edition (SRS-2). J. Psychoeduc. Assess. 2014, 32, 365–369. [Google Scholar] [CrossRef]
- Bodfish, J.W.; Symons, F.J.; Lewis, M.H. The Repetitive Behavior Scale (Western Carolina Center Research Reports). Morganton NC West. Carol. Cent. 1999. [Google Scholar]
- Nag, A.; Haber, N.; Voss, C.; Tamura, S.; Daniels, J.; Ma, J.; Chiang, B.; Ramachandran, S.; Schwartz, J.; Winograd, T. Toward Continuous Social Phenotyping: Analyzing Gaze Patterns in an Emotion Recognition Task for Children with Autism through Wearable Smart Glasses. J. Med. Internet Res. 2020, 22, e13810. [Google Scholar] [CrossRef]
- Król, M.E.; Król, M. A Novel Machine Learning Analysis of Eye-Tracking Data Reveals Suboptimal Visual Information Extraction from Facial Stimuli in Individuals with Autism. Neuropsychologia 2019, 129, 397–406. [Google Scholar] [CrossRef]
- Bulat, A.; Tzimiropoulos, G. How Far Are We from Solving the 2d & 3d Face Alignment Problem? (And a Dataset of 230,000 3d Facial Landmarks). In Proceedings of the IEEE International Conference on Computer Vision, Venice, Italy, 22–29 October 2017; pp. 1021–1030. [Google Scholar]
- Ahuja, K.; Bose, A.; Jain, M.; Dey, K.; Joshi, A.; Achary, K.; Varkey, B.; Harrison, C.; Goel, M. Gaze-Based Screening of Autistic Traits for Adolescents and Young Adults Using Prosaic Videos. In Proceedings of the 3rd ACM SIGCAS Conference on Computing and Sustainable Societies, Guayaquil, Ecuador, 15–17 June 2020; p. 324. [Google Scholar]
- Wan, G.; Kong, X.; Sun, B.; Yu, S.; Tu, Y.; Park, J.; Lang, C.; Koh, M.; Wei, Z.; Feng, Z. Applying Eye Tracking to Identify Autism Spectrum Disorder in Children. J. Autism Dev. Disord. 2019, 49, 209–215. [Google Scholar] [CrossRef]
- Elbattah, M.; Carette, R.; Dequen, G.; Guérin, J.-L.; Cilia, F. Learning Clusters in Autism Spectrum Disorder: Image-Based Clustering of Eye-Tracking Scanpaths with Deep Autoencoder. In Proceedings of the 2019 41st Annual International Conference of the IEEE Engineering in Medicine and Biology Society (EMBC), Berlin, Germany, 23–27 July 2019; pp. 1417–1420. [Google Scholar]
- Van der Maaten, L.; Hinton, G. Visualizing Data Using T-SNE. J. Mach. Learn. Res. 2008, 9, 2579–2605. [Google Scholar]
- Reimann, G.E.; Walsh, C.; Csumitta, K.D.; McClure, P.; Pereira, F.; Martin, A.; Ramot, M. Gauging Facial Feature Viewing Preference as a Stable Individual Trait in Autism Spectrum Disorder. Autism Res. 2021, 14, 1670–1683. [Google Scholar] [CrossRef]
- Liu, W.; Yu, X.; Raj, B.; Yi, L.; Zou, X.; Li, M. Efficient Autism Spectrum Disorder Prediction with Eye Movement: A Machine Learning Framework. In Proceedings of the 2015 International Conference on Affective Computing and Intelligent Interaction (ACII), Xi’an, China, 21–24 September 2015; pp. 649–655. [Google Scholar]
- Kang, J.; Han, X.; Hu, J.-F.; Feng, H.; Li, X. The Study of the Differences between Low-Functioning Autistic Children and Typically Developing Children in the Processing of the Own-Race and Other-Race Faces by the Machine Learning Approach. J. Clin. Neurosci. 2020, 81, 54–60. [Google Scholar] [CrossRef]
- Kang, J.; Han, X.; Song, J.; Niu, Z.; Li, X. The Identification of Children with Autism Spectrum Disorder by SVM Approach on EEG and Eye-Tracking Data. Comput. Biol. Med. 2020, 120, 103722. [Google Scholar] [CrossRef]
- Peng, H.; Long, F.; Ding, C. Feature Selection Based on Mutual Information Criteria of Max-Dependency, Max-Relevance, and Min-Redundancy. IEEE Trans. Pattern Anal. Mach. Intell. 2005, 27, 1226–1238. [Google Scholar] [CrossRef]
- Wang, S.; Jiang, M.; Duchesne, X.M.; Laugeson, E.A.; Kennedy, D.P.; Adolphs, R.; Zhao, Q. Atypical Visual Saliency in Autism Spectrum Disorder Quantified through Model-Based Eye Tracking. Neuron 2015, 88, 604–616. [Google Scholar] [CrossRef] [Green Version]
- Jiang, M.; Zhao, Q. Learning Visual Attention to Identify People with Autism Spectrum Disorder. In Proceedings of the IEEE International Conference on Computer Vision, Venice, Italy, 22–29 October 2017; pp. 3267–3276. [Google Scholar]
- Hart, P.E.; Stork, D.G.; Duda, R.O. Pattern Classification; Wiley: Hoboken, NJ, USA, 2000. [Google Scholar]
- Tao, Y.; Shyu, M.-L. SP-ASDNet: CNN-LSTM Based ASD Classification Model Using Observer Scanpaths. In Proceedings of the 2019 IEEE International Conference on Multimedia & Expo Workshops (ICMEW), Shanghai, China, 8–12 July 2019; pp. 641–646. [Google Scholar]
- Duan, H.; Zhai, G.; Min, X.; Che, Z.; Fang, Y.; Yang, X.; Gutiérrez, J.; Callet, P.L. A Dataset of Eye Movements for the Children with Autism Spectrum Disorder. In Proceedings of the 10th ACM Multimedia Systems Conference, Amherst, MA, USA, 18–21 June 2019; pp. 255–260. [Google Scholar]
- Pan, J.; Ferrer, C.C.; McGuinness, K.; O’Connor, N.E.; Torres, J.; Sayrol, E.; Giro-i-Nieto, X. Salgan: Visual Saliency Prediction with Generative Adversarial Networks. arXiv 2017, arXiv:1701.01081. [Google Scholar]
- Liaqat, S.; Wu, C.; Duggirala, P.R.; Cheung, S.S.; Chuah, C.-N.; Ozonoff, S.; Young, G. Predicting ASD Diagnosis in Children with Synthetic and Image-Based Eye Gaze Data. Signal Process. Image Commun. 2021, 94, 116198. [Google Scholar] [CrossRef]
- Li, J.; Zhong, Y.; Ouyang, G. Identification of ASD Children Based on Video Data. In Proceedings of the 2018 24th International Conference on Pattern Recognition (ICPR), Beijing, China, 20–24 August 2018; pp. 367–372. [Google Scholar]
- Li, J.; Zhong, Y.; Han, J.; Ouyang, G.; Li, X.; Liu, H. Classifying ASD Children with LSTM Based on Raw Videos. Neurocomputing 2020, 390, 226–238. [Google Scholar] [CrossRef]
- Yaneva, V.; Ha, L.A.; Eraslan, S.; Yesilada, Y.; Mitkov, R. Detecting Autism Based on Eye-Tracking Data from Web Searching Tasks. In Proceedings of the 15th International Web for All Conference, Lyon, France, 23–25 April 2018; pp. 1–10. [Google Scholar]
- Vabalas, A.; Gowen, E.; Poliakoff, E.; Casson, A.J. Applying Machine Learning to Kinematic and Eye Movement Features of a Movement Imitation Task to Predict Autism Diagnosis. Sci. Rep. Nat. Publ. Group 2020, 10, 8346. [Google Scholar] [CrossRef]
- Lin, Y.; Gu, Y.; Xu, Y.; Hou, S.; Ding, R.; Ni, S. Autistic Spectrum Traits Detection and Early Screening: A Machine Learning Based Eye Movement Study. J. Child Adolesc. Psychiatr. Nurs. 2021. [Google Scholar] [CrossRef]
- Drimalla, H.; Scheffer, T.; Landwehr, N.; Baskow, I.; Roepke, S.; Behnia, B.; Dziobek, I. Towards the Automatic Detection of Social Biomarkers in Autism Spectrum Disorder: Introducing the Simulated Interaction Task (SIT). NPJ Digit. Med. 2020, 3, 25. [Google Scholar] [CrossRef] [Green Version]
- Zhao, Z.; Tang, H.; Zhang, X.; Qu, X.; Hu, X.; Lu, J. Classification of Children with Autism and Typical Development Using Eye-Tracking Data From Face-to-Face Conversations: Machine Learning Model Development and Performance Evaluation. J. Med. Internet Res. 2021, 23, e29328. [Google Scholar] [CrossRef]
Publisher’s Note: MDPI stays neutral with regard to jurisdictional claims in published maps and institutional affiliations. |
© 2021 by the authors. Licensee MDPI, Basel, Switzerland. This article is an open access article distributed under the terms and conditions of the Creative Commons Attribution (CC BY) license (https://creativecommons.org/licenses/by/4.0/).