Abstract
Solid wood floors are widely used as an interior decoration material, and the color of solid wood surfaces plays a decisive role in the final decoration effect. Therefore, the color classification of solid wood floors is the final and most important step before laying. However, research on floor classification usually focuses on recognizing complex and diverse features but ignores execution speed, which causes common methods to not meet the requirements of online classification in practical production. In this paper, a new online classification method of solid wood floors was proposed by combining probability theory and machine learning. Firstly, a probability-based feature extraction method (stochastic sampling feature extractor) was developed to obtain rapid key features regardless of the disturbance of wood grain. The stochastic features were determined by a genetic algorithm. Then, an extreme learning machine—as a fast classification neural network—was selected and trained with the selected stochastic features to classify solid wood floors. Several experiments were carried out to evaluate the performance of the proposed method, and the results showed that the proposed method achieved a classification accuracy of 97.78% and less than 1 ms for each solid wood floor. The proposed method has advantages including a high execution speed, great accuracy, and flexible adaptability. Overall, it is suitable for online industry production.
1. Introduction
Solid wood is an important natural resource and is widely used in various furniture manufacturing processes due to its unique color and natural wood grain [1]. The final step before distribution for sale is the color classification by experienced workers, since the color consistency of a batch of boards affects its commercial value [2]. However, wood color grading by trained workers has low efficiency and strong subjectivity in the wood processing industry [3].
Currently, some studies have been conducted, and several algorithms have been used for color classification, including support vector machine (SVM) [4], K-nearest neighbors (K-NN) [5], decision trees [6], fuzzy rules [7], and neural network [8,9,10,11]. The SVM is sensitive to missing data when constructing support vectors with training samples, and it is difficult to achieve high accuracy due to the wood grain interference [12,13,14]. K-NN employs the entire dataset that serves as the feature space and calculates the distance between the given example and each labeled sample to classify unknown samples based on prior knowledge. However, the calculation of the distance is time consuming and increases with the data amount, which makes it unacceptable for wood floor online classification industry production [15]. The decision tree method uses a flowchart-like structure that is based on attribute tests. However, due to its conditional control statements, it is difficult to design a robust structure for various kinds of wood floors with countless grain disturbances [6]. Fuzzy rules introduce human fuzzy characteristics into the classification rules and achieve more robustness than pure decision trees. However, the fuzzy logic depends on the determination of expert experience, which is difficult to build the rules in fields [16]. The neural network is able to learn weights from the training dataset and has a generalization ability for the testing dataset with an appropriate structure [17]. However, traditional neural networks with simple structures are sensitive to the input data and are not suitable for handling high dimension inputs such as an image, which will cause high computational costs on a fully connected input layer [18].
With the development of hardware, especially high-performance graphic processing units (GPUs), deep learning has become more widely used due to its parallelable computing structure. The proposal of the convolutional layer greatly improves the classification accuracy and has recently been widely used in the classification field [19]. The convolutional feature extractor can extract features from images automatically [20], but it requires adequate training samples, long training time, and high-performance execution equipment, which increases industrial production costs and limits its industrial application.
Additionally, wood grain also has a great influence on the color classification of solid wood boards. Although adding the number of convolutional layers to extract high-level abstract features could reduce, to a certain extent, the influence of wood grain on classification accuracy, the execution time of the deep convolutional networks is too long for online production.
Therefore, a fast and automatic floor classification method is urgently needed for wood floor manufactory industries, which should meet the speed and color consistency requirements of online wood production. Moreover, solid wood floor industries, in their practical production, require that the classification method should be rapidly trained in the field to meet the switching of different floors whenever necessary and that the algorithm should be robust to various wood grain distributions. On the other hand, the processing time should be as short as possible and must meet the requirement of dealing with the continuously coming wood floor stream.
The aim of this research is to develop an online method to identify the color grade of solid wood floors for industrial production. Although wood grain varies, the color of the solid wood floor is uniform. Therefore, considering the color probability distribution of the solid wood floor image pixels [21], a stochastic sampling feature extractor was proposed to extract features based on probability theory and obtain rapid color features regardless of the wood grain disturbance. The color features that reduced the high-dimensional image data of solid wood were transformed into the low-dimensional color features in order to reduce the complexity of the classifier model and hasten the execution efficiency. Then, a fast classification neural network (extreme learning machine, ELM) [22] was constructed to classify solid wood floors based on color features that were optimized by the genetic algorithm.
The specific contributions of this work are as follows:
- A stochastic sampling feature extractor (SSFE) was developed and proved based on probability theory for extracting quickly statistical features from the wood floor images with flexible equipment adaptability.
- The genetic algorithm was used to optimize those statistical features considering the complexity and accuracy of the classification neural network.
- A flexible workflow was presented for classifying solid wood floors online in the industry.
2. Materials and Method
2.1. Materials and Data Collection
The image acquisition system for solid wood floors was built in our laboratory to obtain experimental data, as shown in Figure 1. The acquisition system included a line scan camera, conveyor belt, light source, and photoelectric sensor, where the camera was on the top of the belt gap, the photoelectric sensor was located at both sides of the conveyor belt, and the light source was a white strip light. The camera used was a Linea LA-GC-02K05B color line scan camera produced by Teledyne DALSA with a resolution of 2048×2, and the max line frequency was 26 kHz. The photoelectric sensor was the ES12-D15NK (LanHon, Shanghai, China) with direct current (DC) type and normal open features.
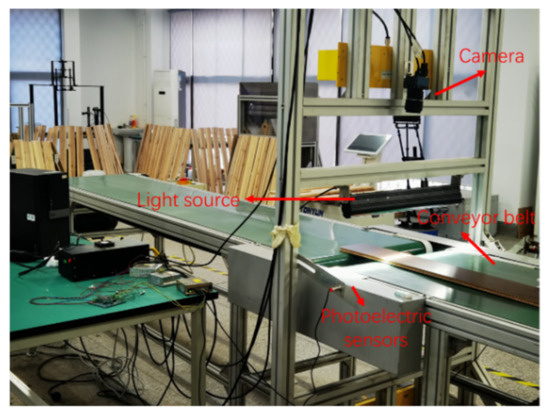
Figure 1.
Image acquisition system to collect solid wood floor images.
The trigger module generated an effective pulse to trigger the camera to scan continuously until the solid wood floor passed away the photoelectric sensor. By adjusting the parameters of the camera and the brightness of the light source, solid wood floor images were collected, and a scanning photo of the solid wood floor including the background had the dimensions: 12,450 × 2048 × 3 (width × height × channels), as shown in Figure 2. Finally, 432 solid wood floor images were collected to construct an experimental dataset. These solid wood floor images were labeled into three kinds of color grades: light grade, medium grade, and dark grade, by experienced workers from the Dehua TuBao New Decoration Material Company. The detailed data segmentation is listed in Table 1.
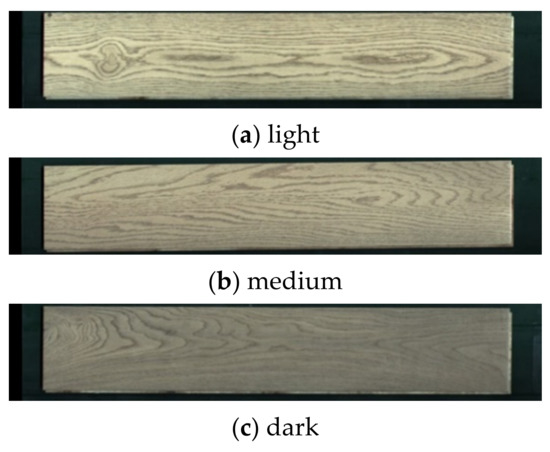
Figure 2.
Solid wood floors with three color grades: light, medium, and dark.

Table 1.
Experimental data segmentation of three color grades.
2.2. Online Classification Method of Solid Wood Floors
The proposed classification algorithm included three main parts: (1) statistical features extracted by a stochastic sampling feature extractor, (2) key features selected by the genetic algorithm, and (3) classification by the extreme learning machine. The whole workflow of the proposed online classification method is shown in Figure 3. Firstly, the purity configuration was based on the performance of the classification system hardware. The low-performance hardware was given a low-purity configuration, while, in contrast, the high-performance hardware was given a higher purity configuration. Secondly, the input wood floor image was randomly extracted with the optimized sampling configuration, and then, the sampled points were converted in color space [23] to obtain statistical features including color and texture features by rule filtering. Finally, the classification network was trained on a genetic algorithm (GA) under different requirements. According to the device performance and classification speed requirement, the appropriate priority configuration coupled with the trained neural network weights could be utilized to obtain the color grade in the field.
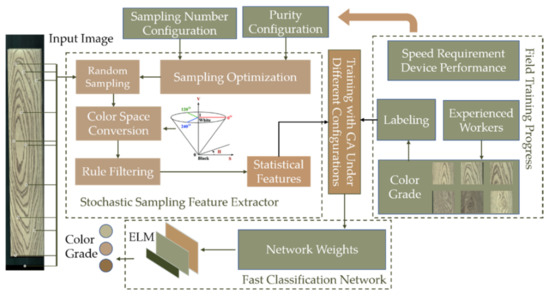
Figure 3.
Workflow of the proposed online classification method of solid wood floors. ELM: extreme learning machine, GA: genetic algorithm.
2.2.1. Stochastic Sampling Feature Extractor
In practical solid wood floor production, the wood grain has a significant influence on the accuracy of color classification. Conventional methods utilize the robustness of deep convolutional layers against the disturbance of various wood grains. However, the deep convolutional extractor causes a lack of interpretability and speed loss and often requires long training progress and high training device cost, which is impractical to classify various solid wood floor styles in the field. Therefore, a relatively simple stochastic sampling feature extractor (SSFE) was proposed to extract reliable wood floor color based on probability theory with minimal computational costs. Figure 4 shows the difference between the traditional convolutional feature extractor and the proposed SSFT.
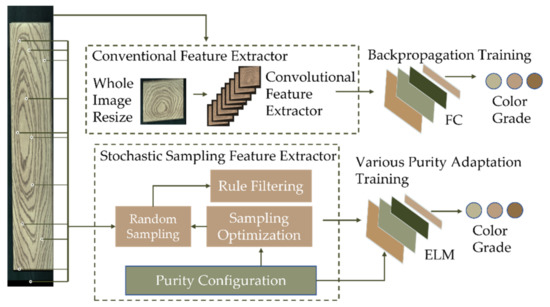
Figure 4.
Difference between convolutional feature extractor and the proposed stochastic sampling feature extractor. FC: fully connected layers.
In the SSFT, the first step is random sampling in order to obtain a reliable wood color. The colors of wood floor image pixels were divided into two categories: (1) original wood floor color based on the human color perception and (2) disturbing color including wood grain and background. The original wood floor color is denoted as , and the disturbing color is denoted as . A subset of the original image color set is obtained when sampling from the wood floor image:
An extracted pixel can be denoted as a discrete random variable, . According to the occurrence probability of two colors and , the probability of is calculated as , and the probability of is calculated as , and the two probabilities should satisfy as follows:
Assume sampling samples from the input wood floor image, a subset color can be obtained, which is a mixture of and . The sampling progress can be viewed as a binomial experiment, so the times of random events and occurring are recorded as random variables and . The probability distributions of these two variables are:
The second step of the SSFT is rule filtering to extract the color . According to the wood industry, the brightness of is higher than . From this perspective, the filtering rule was designed as a sorting progress according to the brightness in the extracted subset ; and, only samples with top brightness could be filtered down to the following classification.
Then, the color purity of the filtered samples is denoted as and defined as follows:
The is a hyperparameter and set based on the device performance. Then, the operation parameters are optimized as follows:
By solving Equation (5) to obtain an optimized , the SSFE is able to extract wood color under the purity requirement, . Meanwhile, the sampling parameter controls the robustness against the interference.
The third step of the SSFT is feature extraction. After n pixels are sampled from a floor image, a set of features should be constructed based on subsequent neural network classification by comparing the differences between solid wood floors of different color grades. Considering that the human eye perceives color not only based on differences in hue but also the brightness and vividness, the color information was mainly incarnated by the color moments in HSV space and Lab space in terms of the color grade of solid wood floors classification. Finally, 12 statistical features were designed including lmean, amean, bmean, hmean, smean, vmean, lvar, avar, bvar, hvar, svar, and vvar.
2.2.2. Feature Selection Based on Genetic Algorithm
Feature selection has an important role in classification to maximize the classification accuracy and minimize the number of features that slows the network inference progress. A genetic algorithm (GA) [24] was used to search the optimal feature combination. GA is a random search method that is capable of efficiently discovering large search spaces, which is commonly used in feature selection. Furthermore, unlike other search algorithms, the GA conducts a global search rather than a local, or greedy search. The basic concept is to evolve a population of individuals, each of which is a possible solution of how features are selected [25,26]. The GA is made up of three main operators: reproduction, crossover, and mutation. The GA begins by randomly seeding a population of potential solutions. At the end of each generation, the population is evaluated and tested for algorithm termination. If the termination condition is not met, the population is re-evaluated by running it through the three GA operators. This process would be repeated until the stopping criterion is met [27], as shown in Figure 5.
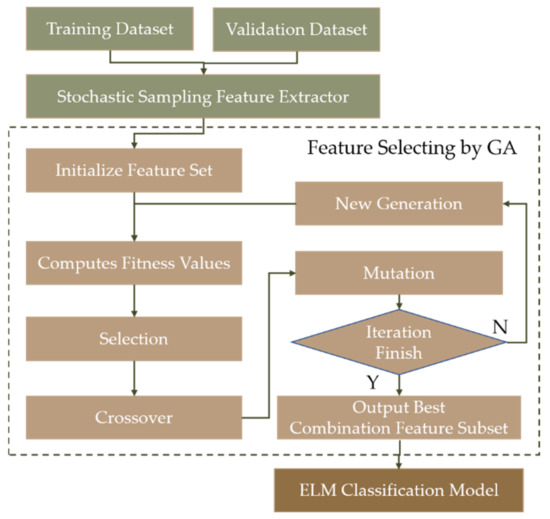
Figure 5.
Flow chart for feature selection with genetic algorithm. GA: Genetic Algorithm.
2.2.3. Fast Classification Network Based on ELM
In real-world wood floor production, the floor colors may be different in each production batch due to the external environment and materials, which means that the definition of the color grades changes frequently. Conventional neural networks adopt a backpropagation algorithm to train the weights, which is a time-consuming process, which is unacceptable in the industry field if the training was a constant task. In this study, we employed the ELM as the backbone classifier with the advantages of a strong generalization ability and fast learning speed [21,28]. An ELM usually uses a single-layer feedforward network containing three layers: an input layer, a hidden layer, and an output layer.
The hidden layer in the ELM can be expressed as follows:
where is the input for the neural network, which are the extracted features from the SSFE in our experiments, is the number of the hidden nodes, is the number of training samples, is the weights of the inputs, is the weight of the outputs, is the bias of the -th hidden node, is an activation function, and is the output of the ELM and the color grade.
In the experiment, the range of was [−1, 1], and the range of was [0, 1]. The learning process achieved the lowest errors between the true values (or targets) and outputs , which was expressed as follows:
In other words, it found the parameters, including , , and bi, that make the equation above tenable.
Assuming H is the output of the hidden nodes and β is the weight of the outputs, the equation can be expressed as follows:
where T is the expected output.
Once the input weights Wi and bias bi of the ELM are determined, the output matrix of the hidden nodes H is definite. In this way, the ELM model with one hidden layer can be transformed into a linear system , and the weights of outputs β can be calculated as follows:
where H+ is the generalized inverse of matrix H, and T is the expected output.
Finally, the flow chart of the proposed method for the online classification of solid wood floors is shown in Figure 6. The SSFE extracted statistical features as the inputs of the ELM classifier to reduce the complexity of the classifier and speed up the execution efficiency by transforming the high-dimensional solid wood floor image data into low-dimensional color features.
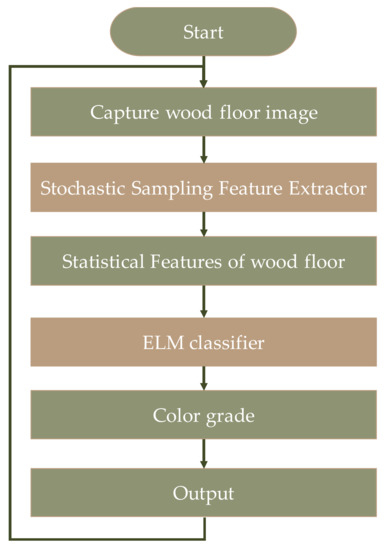
Figure 6.
Flow chart of the proposed method for online classification of solid wood floors.
3. Results and Discussions
3.1. Experiment and Metrics
The color classification programs of solid wood floors experiments were written in Python, using the machine learning library Scikit-Learn and deep learning framework Pytorch. The software, hardware, and compilation environment configuration are listed in Table 2.
Table 2.
Software and hardware environment configuration.
To evaluate the performance of the proposed method, an evaluation criterion, accuracy, was used and defined as:
where is the number of wood floors classified correctly, is the total number of floors, and is the overall classification accuracy.
3.2. Evaluating Performance of the Proposed Model
3.2.1. Hyperparameters of Stochastic Sampling Feature Extractor
The hyperparameters and strictly affect the performance of the SSFE. The hyperparameter controls the sample number picked by the sampling progress, which would affect the following computing speed from the perspective of processing the data amount. On the other hand, the hyperparameter controls the numbers that can pass through the rule filtering, by which the final classification accuracy is determined. In order to evaluate the effect of these two hyperparameters, the structure of the subsequent ELM was fixed. In the experiment, the number of hidden layer neurons (of the ELM) was set to 14, and the output was set to three (determined by the target color grades).
Firstly, a comparative experiment was carried out to test the effect of , where the was set to 0.95. Figure 7 shows the accuracy changing tendency of the overall classification accuracy corresponding with the increase in . As the total sampling number increases, the accuracy presents a rising tendency. The total number of samples determines the number of filtered samples ultimately used for feature extraction. Equation (5) shows that when and are fixed, the number of samples that are filtered by the rule increases as the total sampling number increases. When taking a few samples to classify the color grade of the solid wood floors, the samples which are filtered by the rule are not suitable to extract features, since using few samples to represent the original color of solid wood floors is not reliable. With the increase in , these samples tend to show a higher possibility of representing the original color of solid wood floors. The extracted features can reflect the color grade of solid wood floors more accurately, which brings the higher classification accuracy at the cost of performance.
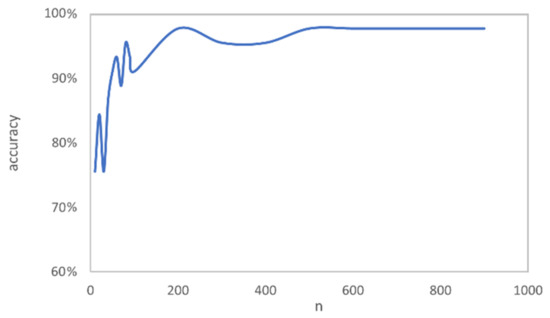
Figure 7.
The accuracy changing tendency of the overall classification accuracy corresponding to the increase in .
Moreover, the filtering rules also have an effect on classification accuracy. When the interference during sampling increases or the requirement for purity is higher, the rules that are utilized to filter samples become stricter. This means that when increasing the value of and in Equation (5), the filtered samples will decrease with being fixed. However, the filtered samples have a higher probability of representing the color grade of floors than loose rules. Figure 8 shows the classification accuracy corresponding to different values of with an increase in , where was fixed to 1000 and was set to 0.95. It can be seen that the classification accuracy does not seem to be affected. Even under the extreme condition , I.e., in which the wood grain of the floor occupies most of the floor area, the over-classification can still reach 93.33%. This occurs mainly because the base number of total samples is large, and there are still enough remaining samples after rule filtering, which leads to a higher probability of representing the color grade of the floors even under strict rules.
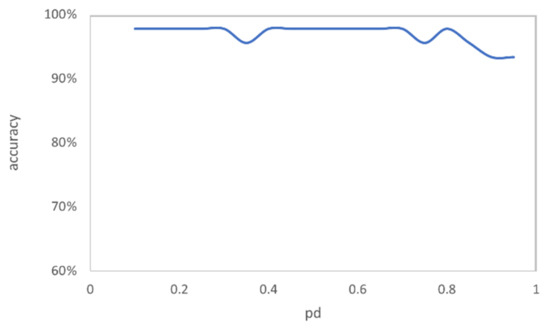
Figure 8.
The classification accuracy under different values.
Figure 9 shows the condition of classification accuracy when different values of are set, which is similar to . Changes to hyperparameter have almost no effect when is large. In summary, has a significant inference on the classification accuracy because the number of filtered samples is mainly determined by . When n is large enough, and will have only a small impact on .
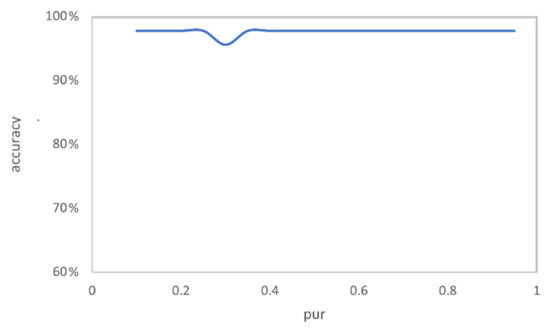
Figure 9.
The classification accuracy under different values.
3.2.2. Features Selected by GA
After confirming the color space for feature extraction, we used GA to search the feature subset. The optimization goal was to maximize the classification accuracy on the test set, with the hyperparameters fixed temporarily, where was set to 5000 and was set to 0.95. The number of neurons in the hidden layer and the output layer of the ELM were set to 14 and three, respectively. The number of neurons in the input layer depended on the number of features. The fitness value () was defined as follows:
The features selection searching process is shown in Figure 10. In the initial generation, there are various evaluation values, which highlight the accuracy of the selected features that were used for the subsequent neural network. With the growth in the generation number, the accuracy points of the classification method, corresponding to the best combination of features, gather together slowly, although some points are out of the rule due to mutation. In the end, all the feature combinations tended to have the same fitness, which means that the algorithm reached its convergence.
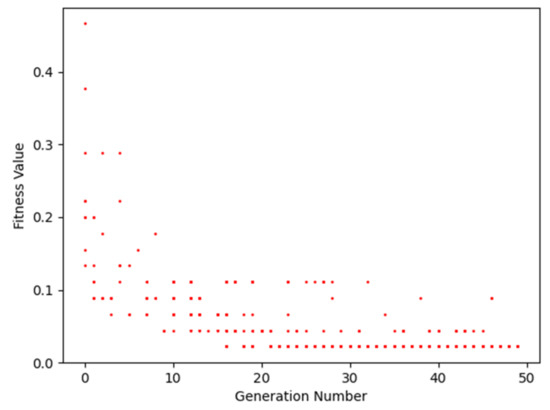
Figure 10.
Feature subset searching process using GA.
The search space of the feature combinations is quite large, and the searched feature combinations are not a single result. Table 3 lists some combinations of the features searched by the GA. By comparing the results of all selected features, we found that most feature combinations that were searched by the GA included the first-order moment of channel “l” in the Lab color space. This shows that the color depth of different solid wood floors is mainly reflected in the brightness of visual perception. Therefore, the brightness distribution of the entire solid wood floor image is an important feature for the classification result. It is also worth mentioning that by comparing feature combinations of groups 6 and 8 with other groups, the contribution of the first-order “h” channel in the classification is average. This also shows that different color grades of solid wood floors have similar hues—the difference in how the human eye perceives different color grades is caused by changes in color depth. Compared with other groups, group 5 uses the least features and achieves the same model accuracy; moreover, the first-order moment of the “s” channel is also related to the color depth. As for the “b” channel in the Lab color space, this represents the component of blue to yellow, because the solid wood floors’ color tone is mainly yellow from the standpoint of human perceived of color; this is especially evident on light-colored and medium-colored floors. Compared with the accuracy rate of 89% with all the features, this confirms the effectiveness of feature selection.
Table 3.
Comparison results for different feature subsets searched by GA.
3.2.3. Classification Performance
Table 4 shows the confusion matrix of the test results, in which the model was trained under the condition of hyperparameter set to 0.3, set to 0.98, and the feature set including the first-order moment of the “l“ channel and ”b” channel in the Lab color space—also including the “s” channel in HSV color space. The dark color grade and the light color grade floor scan can be recognized correctly with high accuracy. The medium color grade floors may be recognized as a light color grade. In fact, from the perspective of human visual perception, compared to the light color grade and dark color grade, there are more differences between different medium color grade floors. It seems that the medium color grade oscillates between the light color grade and the dark color grade. This may lead to fuzzy boundaries between the light color grade and medium color grade. Even so, the classification accuracy of medium color grade is still up to 93.33% in the testing set.
Table 4.
Confusion matrix of the test results.
3.3. Classification Performance Evaluation for Different Methods
In order to evaluate the performance of the proposed method—comparing other published methods—six repeated experiments were carried out. The results are listed in Table 5, where the first seven methods were all deep learning methods and the last two are the methods based on color features. Among these deep learning methods, MNASNet showed the lowest accuracy on the testing set, and the other six methods showed similar accuracy. The two methods based on color features—the proposed method and XGBoost method—achieved similar classification accuracy and were comparable to those deep learning methods.
Table 5.
Comparison of classification accuracy on the testing set for different methods, where the data are in the format of μ ± Δx, μ represents the mean value of the results, and Δx shows the confidence interval with a confidence limit of 0.95.
For online production, the running time of classification methods is another important index, which would determine the probability of practical engineering application. Therefore, another set of experiments was carried out to evaluate the complexity of different methods, and the results are listed in Table 6. In terms of the training time, the deep learning methods spent more time than the last two methods based on color features. Compared with the proposed method, the XGBoost model spent shorter training time due to without feature selection process.
Table 6.
The complexity of different methods.
For the online classification time, the cooperation company (Dehua TuBao New Decoration Material Company) required that the practical production time of each image should be less than 10 ms. Compared with the other six methods in Table 6, the proposed method has a much shorter classification time, and it is the only one meeting the practical production requirement.
Furthermore, Floating Point Operations Per Second (FLOPs) [33] is commonly used to the computational cost of a model in order to evaluate its complexity, and FLOPs of these seven methods are also listed in Table 6. It can be seen that the proposed method in this study has a great advantage in regard to computational cost compared with deep learning methods. All deep learning methods obtain high FLOPs, and some lightweight deep learning networks, such as MobileNetV2, have lower computational complexity due to the addition of depthwise separable convolution. This demonstrates that the computation complexity will increase when the convolutional feature extractor operates—compared with the SSFE—also proving the effectiveness of the proposed method for classification.
4. Conclusions
In this study, a flexible method was proposed by developing a stochastic sampling feature extractor and combining ELM for the online classification of solid wood floors in the industry. The stochastic sampling feature extractor was developed based on probability theory, a GA was used to search the feature space in order to rapidly extract optimal features with minimal computational resources, and the ELM was used for rapid classification. The proposed model was used to classify three color grades of solid wood floors with a classification accuracy of 97.78% and an image processing speed of less than 1 ms, which met the industrial production speed requirement. Comparing the experimental results, the proposed method has the following advantages:
- (1)
- The proposed method removes the influence of wood grain and background and is robust to the wood grain distribution of wood grain.
- (2)
- The proposed method satisfies flexible switching of the classification of different floor styles in production.
- (3)
- The proposed method’s image processing speed is much faster than that of deep learning methods, and the accuracy of the proposed method is comparable with that of deep learning methods.
On the other hand, it is worth noting that the proposed method for online classification is not completely automatic because it needs an expert to set up the classification system and provide training samples when changing from one batch of solid wood floors to another. Furthermore, the advantages of the proposed online method, such as accuracy, efficiency, and cost, should be verified in the industrial production compared with manual production in future, which is significantly important for popularization and application.
Author Contributions
All authors designed this work; T.Z., K.D. and Z.L. contributed equally to this work. K.D. and Z.L. carried out the experiments and validation of this work; T.Z. and K.D. wrote original draft preparation; X.Z., R.D. and C.N. reviewed and edited the manuscript. All authors have read and agreed to the published version of the manuscript.
Funding
This research was funded by the 2019 Jiangsu Province Key Research and Development Plan by the Jiangsu Province Science and Technology Agency, grant number BE2019112.
Conflicts of Interest
The authors declare no conflict of interest.
References
- Delgado, A.; Pereira, C.; De Brito, J.; Silvestre, J.D. Defect characterization, diagnosis and repair of wood flooring based on a field survey. Mater. Constr. 2018, 68, 1817. [Google Scholar] [CrossRef] [Green Version]
- Taqyudin, M.I.; Irawan, B.; Setianingsih, C. Wood Classification Based on Fiber Texture Using Backpropagation Method. In Proceedings of the 2019 International Conference on Sustainable Engineering and Creative Computing (ICSECC), Bandung, Indonesia, 20–22 August 2019; pp. 245–250. [Google Scholar] [CrossRef]
- Zhou, Z.; Wang, C.; Zhang, J.; Zhu, Z. Color difference classification of solid color printing and dyeing products based on optimization of the extreme learning machine of the improved whale optimization algorithm. Text. Res. J. 2020, 90, 135–155. [Google Scholar] [CrossRef]
- Duan, L.; Cui, G.; Gao, W.; Zhang, H. Adult Image Detection Method Base-on Skin Color Model and Support Vector Machine. In Proceedings of the 5th Asian Conference on Computer Vision: ACCV 2002, Melbourne, Australia, 22–25 January 2002; pp. 1–4. [Google Scholar]
- Shivashankar, S.; Kagale, M.R. Automatic Wood Classification using a Novel Color Texture Features. Int. J. Comput. Appl. 2018, 180, 34–38. [Google Scholar] [CrossRef]
- Zhuang, Z.; Liu, Y.; Ding, F.; Wang, Z. Online color classification system of solid wood flooring based on characteristic features. Sensors 2021, 21, 336. [Google Scholar] [CrossRef]
- Bombardier, V.; Schmitt, E. Fuzzy rule classifier: Capability for generalization in wood color recognition. Eng. Appl. Artif. Intell. 2010, 23, 978–988. [Google Scholar] [CrossRef] [Green Version]
- Nasir, V.; Nourian, S.; Avramidis, S.; Cool, J. Stress wave evaluation by accelerometer and acoustic emission sensor for thermally modified wood classification using three types of neural networks. Eur. J. Wood Wood Prod. 2019, 77, 45–55. [Google Scholar] [CrossRef]
- Blot, M.; Cord, M.; Thome, N. Max-min convolutional neural networks for image classification. In Proceedings of the 2016 IEEE International Conference on Image Processing (ICIP), Phoenix, AZ, USA, 25–28 September 2016; pp. 3678–3682. [Google Scholar] [CrossRef] [Green Version]
- Castellani, M.; Rowlands, H. Evolutionary Artificial Neural Network Design and Training for wood veneer classification. Eng. Appl. Artif. Intell. 2009, 22, 732–741. [Google Scholar] [CrossRef]
- Yang, J.; Huang, P.; Dai, F.; Sun, Y.; Wang, L.; Bi, H. Application of Deep Learning in Wood Classification. In Proceedings of the 2019 IEEE International Conference on Computer Science and Educational Informatization (CSEI), Kunming, China, 16–18 August 2019; pp. 124–129. [Google Scholar] [CrossRef]
- Hu, X.; Wang, P.; Xu, J. A wood color classifier based on CAV and SVM. Appl. Mech. Mater. 2013, 241–244, 483–487. [Google Scholar] [CrossRef]
- Khorsand, R.; Ghobaei-Arani, M.; Ramezanpour, M. FAHP approach for autonomic resource provisioning of multitier applications in cloud computing environments. Softw. Pract. Exp. 2018, 48, 2147–2173. [Google Scholar] [CrossRef]
- Panev, Y.; Kotsovinos, P.; Deeny, S.; Flint, G. The Use of Machine Learning for the Prediction of fire Resistance of Composite Shallow Floor Systems. Fire Technol. 2021, 57, 3079–3100. [Google Scholar] [CrossRef]
- Lin, Y.; Chen, D.; Liang, S.; Qiu, Y.; Xu, Z.; Zhang, J.; Liu, X. Wood Color Classification Based on Color Spatial Features and K-means Algorithm. In Proceedings of the ECON 2020 The 46th Annual Conference of the IEEE Industrial Electronics Society, Singapore, 18–21 October 2020; pp. 3847–3851. [Google Scholar] [CrossRef]
- Faria, J.; Martins, T.; Ferreira, M.; Santos, C. A computer vision system for color grading wood boards using Fuzzy Logic. In Proceedings of the 2008 IEEE International Symposium on Industrial Electronics, Cambridge, UK, 30 June–2 July 2008; pp. 1082–1087. [Google Scholar] [CrossRef] [Green Version]
- Shahidinejad, A.; Ghobaei-Arani, M. Joint computation offloading and resource provisioning for edge-cloud computing environment: A machine learning-based approach. Softw. Pract. Exp. 2020, 50, 2212–2230. [Google Scholar] [CrossRef]
- Nasir, V.; Nourian, S.; Zhou, Z.; Rahimi, S.; Avramidis, S.; Cool, J. Classification and characterization of thermally modified timber using visible and near-infrared spectroscopy and artificial neural networks: A comparative study on the performance of different NDE methods and ANNs. Wood Sci. Technol. 2019, 53, 1093–1109. [Google Scholar] [CrossRef]
- Zou, H.; Sun, X. 3D Face Recognition Based on an Attention Mechanism and Sparse Loss Function. Electronics 2021, 10, 2539. [Google Scholar] [CrossRef]
- Jenei, A.Z.; Kiss, G.; Tulics, M.G.; Sztahó, D. Separation of Several Illnesses Using Correlation Structures with Convolutional Neural Networks. Acta Polytech. Hung. 2021, 18, 47–66. [Google Scholar] [CrossRef]
- Khorsand, R.; Ghobaei-Arani, M.; Ramezanpour, M. A self-learning fuzzy approach for proactive resource provisioning in cloud environment. Softw. Pract. Exp. 2019, 49, 1618–1642. [Google Scholar] [CrossRef]
- Huang, G.B.; Zhu, Q.Y.; Siew, C.K. Extreme learning machine: Theory and applications. Neurocomputing 2006, 70, 489–501. [Google Scholar] [CrossRef]
- Chen, W.L.; Kan, C.D.; Lin, C.H.; Chen, Y.S.; Mai, Y.C. Hypervolemia screening in predialysis healthcare for hemodialysis patients using fuzzy color reason analysis. Int. J. Distrib. Sens. Netw. 2017, 13, 1–13. [Google Scholar] [CrossRef]
- Katoch, S.; Chauhan, S.S.; Kumar, V. A review on genetic algorithm: Past, present, and future. In Multimedia Tools and Applications; Springer: Berlin/Heidelberg, Germany, 2021; Volume 80, ISBN 1104202010139. [Google Scholar]
- Shi, J.; Li, Z.; Zhu, T.; Wang, D.; Ni, C. Defect Detection of Industry Wood Veneer Based on NAS and Multi-Channel Mask R-CNN. Sensors 2020, 20, 4398. [Google Scholar] [CrossRef]
- Sayed, S.; Nassef, M.; Badr, A.; Farag, I. A Nested Genetic Algorithm for feature selection in high-dimensional cancer Microarray datasets. Expert Syst. Appl. 2019, 121, 233–243. [Google Scholar] [CrossRef]
- Onah, J.O.; Abdulhamid, S.M.; Abdullahi, M.; Hassan, I.H.; Al-Ghusham, A. Genetic Algorithm based feature selection and Naïve Bayes for anomaly detection in fog computing environment. Mach. Learn. Appl. 2021, 6, 100156. [Google Scholar] [CrossRef]
- Huang, G.B.; Zhou, H.; Ding, X.; Zhang, R. Extreme learning machine for regression and multiclass classification. IEEE Trans. Syst. Man Cybern. Part B Cybern. 2012, 42, 513–529. [Google Scholar] [CrossRef] [PubMed] [Green Version]
- He, K.; Zhang, X.; Ren, S.; Sun, J. Deep residual learning for image recognition. In Proceedings of the IEEE conference on computer vision and pattern recognition, Las Vegas, NV, USA, 27–30 June 2016; pp. 770–778. [Google Scholar] [CrossRef] [Green Version]
- Simonyan, K.; Zisserman, A. Very deep convolutional networks for large-scale image recognition. In Proceedings of the 3rd International Conference on Learning Representations—ICLR 2015, San Diego, CA, USA, 7–9 May 2015; pp. 1–14. [Google Scholar]
- Sandler, M.; Howard, A.; Zhu, M.; Zhmoginov, A.; Chen, L.C. MobileNetV2: Inverted Residuals and Linear Bottlenecks. In Proceedings of the IEEE Conference on Computer Vision and Pattern Recognition, Salt Lake City, UT, USA, 18–23 June 2018; pp. 4510–4520. [Google Scholar] [CrossRef] [Green Version]
- Tan, M.; Chen, B.; Pang, R.; Vasudevan, V.; Sandler, M.; Howard, A.; Le, Q.V. Mnasnet: Platform-aware neural architecture search for mobile. In Proceedings of the IEEE/CVF Conference on Computer Vision and Pattern Recognition, Long Beach, CA, USA, 15–20 June 2019; pp. 2815–2823. [Google Scholar] [CrossRef] [Green Version]
- Hsia, S.C.; Wang, S.H.; Chang, C.Y. Convolution neural network with low operation FLOPS and high accuracy for image recognition. J. Real-Time Image Process. 2021, 18, 1309–1319. [Google Scholar] [CrossRef]
Publisher’s Note: MDPI stays neutral with regard to jurisdictional claims in published maps and institutional affiliations. |
© 2021 by the authors. Licensee MDPI, Basel, Switzerland. This article is an open access article distributed under the terms and conditions of the Creative Commons Attribution (CC BY) license (https://creativecommons.org/licenses/by/4.0/).