Abstract
In this work, we systematically analyze the impact of three kinds of Mach-Zehnder modulator (MZM) imbalances, including bias deviation, amplitude mismatch, and differential time skew in intensity-modulation direct-detection (IM-DD) links. It is shown that, for power fading limited transmission, the imbalances can be utilized as advantages rather than impairments. Specifically, the bias deviation with single-arm driven mode and amplitude mismatch with differential driven mode can increase the available bandwidth by shifting the frequency of fading notches. Meanwhile, time skew provides another way to avoid fading by shaping the double sideband (DSB) signal into a vestigial sideband (VSB) with an asymmetrical transfer function. In the transmission experiment, 34 Gbaud Nyquist 6/8-ary pulse amplitude modulation (PAM-6/8) signals are used for investigation in a 20 km dispersion-uncompensated standard single-mode fiber (SSMF) link. With the help of a Volterra nonlinear equalizer, all three kinds of imbalances can achieve bit-error rates (BERs) below the 7% and 20% hard-decision forward error correction (HD-FEC) thresholds for PAM-6 and PAM-8 signals, respectively. The received power sensitivity is also compared at the back-to-back (BTB) case and after fiber transmission. Both numerical simulation and experimental demonstration confirm that the dispersion-induced power fading can be effectively suppressed with bias, amplitude, or skew imbalance, providing a feasible solution for transmission distance extension of C-band DD links.
1. Introduction
Driven by the emerging broadband services, such as cloud computing, augmented/virtual reality (AR/VR), and high-definition videos, in 5 G Era, the capacity of data center interconnects (DCI), and other short-reach applications are looking for evolutions to accommodate the Internet traffic. Since the end of last century, intensity modulation with direct detection (IM-DD) has been widely used, owing to its simplicity, low cost, and small footprint [1,2,3]. For intra-DCI applications up to 2 km, 400-gigabit Ethernet (GbE) has been standardized in the IEEE Standard 802.3bs-2017 [4], in which 4 lanes × 100 G or 8 lanes × 50 G are implemented based on 4-ary pulse amplitude modulation (PAM-4). Meanwhile, the rising of edge computing and a large-scale data center also put forward requirements on inter-DCI links with longer transmission distance of tens of kilometers. As a consequence, fiber dispersion has become an important channel impairment [5]. For coherent detection systems, the complex optical field can be linearly obtained with dispersion compensated by digital equalizers [6,7]. However, the hardware complexity and cost of coherent receivers are still practical issues for such a high-density scenario. On the other hand, since the optical-to-electrical conversion in photodiode (PD) follows square-law detection, the power fading effect would thus limit the bandwidth-distance product of DD systems by introducing notches in the signal spectrum [8]. Therefore, it is worth studying the methods of suppressing the power fading and extending the reach of DD optical links.
In recent years, extensive efforts have been undertaken to cope with power fading. The first approach is to perform optical dispersion compensation. For passive optical network (PON) and mobile fronthaul (MFH) scenarios, O-band transmission is still preferred [9]. In Reference [10], 100 Gb/s/λ PON downstream is demonstrated with a 29 dB power budget by using a 10 G-class directly-modulated laser (DML) and a semiconductor optical amplifier (SOA). However, the transmission distance is limited by the fiber loss, and the capacity scalability is restricted by the uneven gain characterization of the optical amplifier and dispersion slope in the O-band. An alternative choice is to employ an optical approach, such as a dispersion-compensating fiber (DCF) [11] and a tunable dispersion compensation module [12] with C-band transmission. By matching the accumulated dispersion values between DCF and the transmission fiber link, the first 400 G real-time inter-DCI is reported based on 8 × 50 Gb/s PAM-4 [11]. Secondly, vestigial sideband (VSB) or single sideband (SSB) modulation can overcome power fading by avoiding the superposition of two dispersed sidebands. In Reference [13], 100 Gb/s VSB PAM-4 is successfully delivered over 45 km SSMF with an optical band-pass filter (OBPF). However, precise wavelength control is needed to align with the optical filter. For SSB signaling, digital/analog Hilbert transform [14,15,16,17], virtual carrier [18], and optical carrier [19] based schemes have been fully investigated, at the cost of doubled digital-to-analog convertors (DACs) or additional electrical components. Thirdly, as the frequency nulls cannot be efficiently mitigated by linear equalizers, transmitter-side Tomlinson–Harashima precoding (THP) [20,21] and receiver-side decision feedback equalizer (DFE) [22,23] are proposed. The former algorithm requires channel information through feedback, while the latter suffers from error propagation. Moreover, dispersion pre-compensation [24,25] can be performed by the inverse dispersion transfer function, if complex-valued modulation is allowed. In addition, frequency nulls can be moved or avoided with more complicated transmitter structures, such as parallel IM/phase modulation (PM) [26], dual-parallel MZM (DP-MZM) [27], and polarization modulation (PolM) [28]. Going back to the hardware complexity constraint of conventional IM-DD links, 10 km SSMF transmission of 100 G PAM-6/8 signals are achieved with the help of pre-chirping by operating DDMZM at single-arm driven mode [29]. In Reference [30], a differential time skew-based VSB scheme is proposed, which shapes the signal through an inherent asymmetric transfer function without an optical filter. These works offer possibilities to utilize imbalances for combating power fading.
In this work, by extending our recent work in Reference [31], we provide a comprehensive investigation of the influence of three kinds of MZM imbalances, including bias deviation, amplitude mismatch, and differential time skew in short-reach DD systems at C-band. The theoretical transfer function considering fiber dispersion and PD detection in the presence of the above imbalances are first derived, respectively. Transmission experiments are carried out by using 34 Gbaud Nyquist PAM-6/8 signals over a dispersion-uncompensated 20 km SSMF link at C-band. After applying Volterra nonlinear equalizer (VNE), the bit error rates (BERs) of PAM-6 and PAM-8 signals achieve the 7% and 20% hard-decision forward error correction (HD-FEC) thresholds of 4.5 × 10⁻³ and 1.5 × 10⁻² after fiber transmission, respectively [32]. In addition, the received optical power (ROP) sensitivities at back-to-back (BTB) and after transmission are measured and compared with respect to bias, amplitude mismatch, and time skew, respectively.
2. Principle
2.1. Power Fading with Differential Driven Mode
We first start from the conventional IM transmitter operating at differential driven mode, as shown in Figure 1a. For the sake of simplicity, we use to represent the electrical signal normalized by , then the output optical field of MZM is
where represents the bias induced constant phase shift and is tge real-valued optical carrier. is utilized for first-order approximation throughout Section 2. After fiber transmission and square-law detection of PD, the output photocurrent can be calculated as
where is the impulse response of fiber dispersion in the time domain and the conjugate symmetry of real-valued signal is employed. To focus on the impact of dispersion on linear terms, the second-order signal-signal beating interference (SSBI) is ignored in Equation (2). With the help of Fourier transform, the convolution in the time domain can be turned into multiplication in the frequency domain.
were is the frequency domain transfer function of dispersion [6], which is a pure phase distortion. Finally, the overall transfer function is obtained as

Figure 1.
Transmitter configuration of (a) standard differential driven mode, (b) single-arm driven mode, (c) differential driven mode with amplitude mismatch, and (d) differential driven mode with time skew.
According to Equation (4), the phase to amplitude conversion occurs after the conjugated superposition and those frequencies satisfying would suffer from power fading [8]. Moreover, it should be noted that the frequency notches are independent of bias in this case.
2.2. Bias Deviation with Single-Arm Driven Mode
We then investigated the impact of bias deviation in the single-arm driven mode, as shown in Figure 1b. The modulated optical field is modified as
At the receiver, the photocurrent can be modified accordingly as
Again, we transformed into the frequency domain, as in Equation (7), for a better understanding.
In this case, the overall transfer function becomes dependent with the constant phase shift, indicating that the available bandwidth can be shifted as the bias deviates. Typically, when the MZM is biased at the quadrature point of , the first fading frequency is increased to , which is larger than with differential driven mode. However, biasing at the other quadrature point of would lead to smaller first fading frequency of . Furthermore, for lower-arm single-driven mode, the transfer function can be easily modified as
2.3. Amplitude Mismatch in Differential Driven Mode
Similarly, as shown in Figure 1c, the impact of amplitidue mismatch in the differential-driven mode can be taken into consideration. Equation (9) gives the modulated optical field .
were is defined as the amplitude ratio between the differential outputs. The corresponding photocurrent after PD detection is derived in Equation (10).
In this case, the overall transfer function can be acquired as
One can find that the overall transfer function is the combination of two terms. If , Equation (11) would return to Equation (4) as the differential driven mode, while Equation (11) becomes Equation (7) as the upper-arm single driven mode if is satisfied. In addition, when , intensity modulation is gradually transformed towards phase modulation, which in fact changes the hardward configuration rather than using the negative output, as in Figure 1c. Nevertheless, we still considered it to be in the class of amplitude mismatch due to similar mathematical form.
2.4. Time Skew in Differential Driven Mode
Finally, we modeled the influence of time skew in differential-driven mode. The modulated optical field is
were denotes the time skew between the differential outputs. Based on Equation (13), the optical signal is actually VSB-shaped in the frequency domain, making it more tolerant to power fading.
Here, the relationship is utilized. Following the same process, the receiver-side overal transfer function can be further deduced. After fiber transmission, the received photocurrent can be obtained as
Since is a real-valued signal, the overall frequency response can be acquired as
Different from Equation (11), the two terms are combined with coeffient dependent on . Therefore, power fading for most frequency components can be succesfully suppressed with the appropriate value of time skew.
2.5. Perspective of Chirp
The mechanism of MZM imbalances can be also understood from the perspective of chirp α [33], which is defined as
where θ and E are the phase and amplitude of the output optical signal, respectively. In general, negative chirp can benefit transmission with positive dispersion values, such as in G.652 fiber, while positive chirp will degrade the transmission.
For standard differential driven mode, chirp-free is always satisfied since θ = 0 is ensured according to Equation (1). It reveals that the fading nulls cannot be changed through bias adjustment. For single-arm driven mode, the chirp α1 can be calculated by substituting Equation (5) into Equation (16).
We can see that the chirp varies with bias voltage-induced constant phase shift φ, making it possible to adjust the available transmission bandwidth. Meanwhile, the chirp α2 of amplitude mismatch in differential driven mode is shown in Equation (18).
It indicates that the amplitude mismatch applies an additional multiplication factor (1 − k)/(1 + k) on the original chirp. If k < 0, the MZM chirp is enhanced by such a factor; otherwise, the chirp is suppressed when k > 0.
Differently, according to Equation (13), time skew actually produces an asymmetric transfer function. For SSB signals, π/2 phase shifts are always guaranteed for the two driving waveforms over the entire signal bandwidth. On the contrary, a time delay can only achieve π/2 phase shifts at a certain frequency. Hence, filter-free VSB signal is generated in a cost-effective manner.
3. Numerical Visualization
3.1. Bias Deviation with Single-Arm Driven Mode
In this subsection, we numerically calculate the transfer functions of the single-arm driven mode, as shown in Figure 2a–d. The fiber length is set as 20 km, and the dispersion factor is 16 ps/nm/km throughout Section 3. Note that in Section 3, the factor of 2 in Equations (4), (7), (11) and (15) is niglected for normalization. The dashed gray curve represents the transfer function with differential driven mode, which is employed as a reference. We found that the first fading frequency was 14.0 GHz for conventional IM-DD transmission. Thanks to the upper-arm single driven mode with bias around , the first fading frequency increased to ~17.1 GHz, as in Figure 2a. Additionally, the available transmission bandwidth slightly enhanced by reducing the constant phase of bias. However, it should be noted that the frequency components near zero were suppressed as the fading notch shifted toward a higher frequency. Unfortunately, when the bias was switched to , as in Figure 2b, the frequency of the first notch was 9.9 GHz, which was smaller than the differential driven mode. In addition, for lower-arm driven mode, as in Figure 2c,d, the performance was exactly the opposite. To be specific, the fading frequency with upper-arm driven biasing at was equivalent with lower-arm driven biasing at . Meanwhile, the frequency of notch moved toward, rather than away from, zero, as the increasing of bias induced the constant phase.
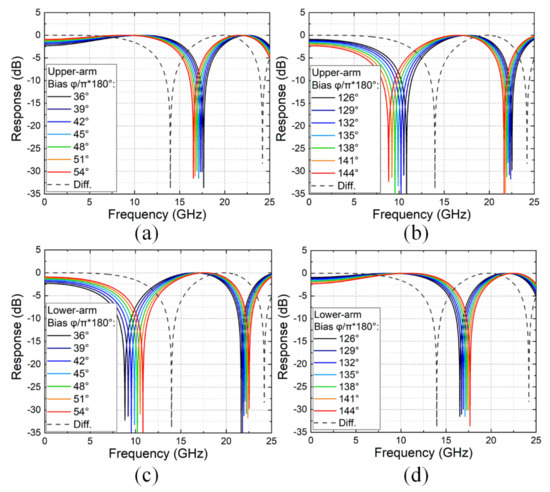
Figure 2.
Calculated transfer function of (a) upper-arm single driven mode with bias around π/4, (b) upper-arm single driven mode with bias around 3π/4, (c) lower-arm single driven mode with bias around π/4, and (d) lower-arm single driven mode with bias around 3π/4. Diff.: standard differential mode.
3.2. Amplitude Mismatch with Differential Driven Mode
Figure 3a plots the transfer function of differential driven mode versus amplitude mismatch ratio k. The bias phase was fixed at the quadrature point of . Here, k = 100%, 0%, and −100% correspond to the special cases of pure IM, IM with single-arm driven mode, and pure phase modulation, respectively. We found that the fading frequency gradually increased from 14.0 GHz to 17.1 GHz with k = 0%, and finally got to 19.8 GHz with k = −100%. Compared to Figure 2a, amplitude mismatch had a wider tunable frequency range than bias deviation in single-arm driven mode. Figure 3b shows the calculated transfer function versus bias induced constant phase at k = −30%, 0%, and 30%, respectively. It can be confirmed that, when k < 0 (solid line), the fading frequency shifting enhanced compared with the single-arm driven mode (dashed line) under the same bias phase, while k > 0 (dotted line) lead to suppress the frequency shifting. In other words, to achieve the target transmission bandwidth, amplitude mismatch was more effective to be exploited, leaving the bias deviates less away from the linear modulation region.
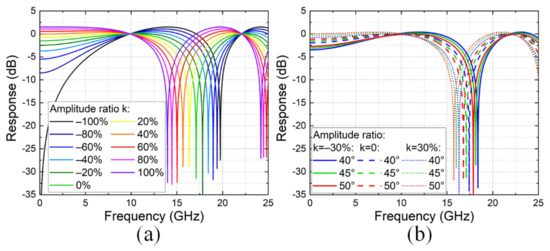
Figure 3.
(a) Calculated transfer function of differential driven mode with various amplitude ratios k. (b) Calculated transfer function versus different bias phases and amplitude ratios.
3.3. Time Skew with Differential Driven Mode
Figure 4a,b illustrates the overall transfer function in the presence of positive and negative differential time skews with differential driven mode, respectively. The bias was still at . Note that 0 ps skew (black curve) equaled the case of conventional IM-DD, in which power fading at 14.0 GHz can be observed. As the differential time skew grew from 0 ps to 16 ps (green curve), the frequency response gradually became smoothed. However, when we continuously increased the time skew larger than 20 ps, a new frequency notch appeared around 19.8 GHz. Nevertheless, time skew was much more powerful than the previous two imbalances, since it could mostly compensate for the power fading, rather than moving, the nulls. In addition, by comparing Figure 2a with Figure 2b, it can be concluded that the same transfer function can be realized with either positive or negative skew values. Therefore, it would be convenient to just focus on the abosulte values of time skew in practical implementations.
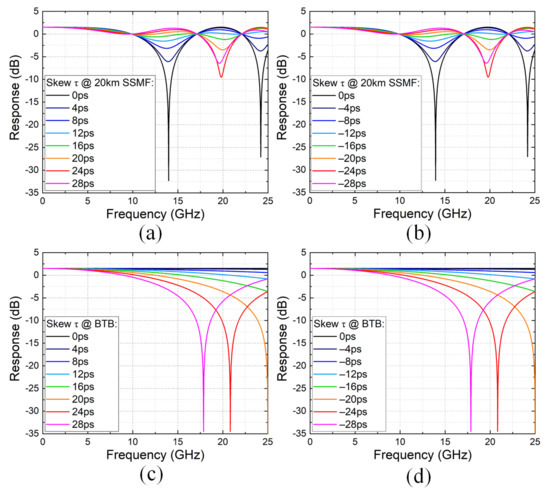
Figure 4.
Calculated transfer function of differential driven mode with (a) positive and (b) negative skew values τ after 20 km SSMF transmission and with (c) positive and (d) negative skew values τ at BTB.
Figure 4c,d shows the transfer function at BTB with positive and negative skew values. Unlike bias deviation and amplitude mismatch, time skew results in a frequency-dependent tranfer function, even at BTB. Due to the partial response-like inter-symbol interference (ISI) in the time domain, the bandwidth tended to decrease as the skew increased.
4. Experimental Setup and DSP Stack
4.1. Experimental Setup
Figure 5a shows the experimental setup. At the transmitter, a continuous wave light was generated by an external cavity laser (ECL) at 1550.2 nm with 15 dBm optical power. The light was then fed into DDMZM (Fujistu FTM7937) with 25 GHz bandwidth. Two channels from the arbitrary waveform generator (AWG, Keysight M8195A) were used to emulate the imbalances of MZM. The sampling rate and bandwidth of AWG were 64 GSa/s and 25 GHz, respectively. For differential driven mode, the peak-to-peak voltage (Vpp) was typically set as 250 mV. For fair comparison, the sum of the Vpp of two channels were kept the same with single-arm driven mode in this experiment. Afterwards, the output waveforms were amplified by a dual-input-dual-output electrical amplifier (EA, CENTELLAX OA4SMM4). The amplitude ratio or time skew were set through the software. The inset showed the measured optical spectrum of 34 Gbaud Nyquist PAM-6 signals at 0.02 nm resolution. With the help of digital Nyquist shaping, the rectangular spectrum could be observed with symmetric double sidebands. The signal occupied approximately 0.29 nm optical bandwidth, which was equivalent to ~36 GHz, including the RRC roll-off. The transmitted fiber link was 20 km SSMF without optical dispersion compensation.

Figure 5.
(a) Experimental setup. ECL: external cavity laser; AWG: arbitrary waveform generator; EA: electrical amplifier; SSMF: standard single-mode fiber; EDFA: erbium-doped fiber amplifier; VOA: variable optical attenuator; PD: photodiode; DSO: digital storage oscilloscope; Tx: transmitter; Rx: receiver. (b) transmitter- and (c) receiver-side DSP stacks. RRC: root raised cosine; FFE: feed-forward equalizer; VNE: Volterra nonlinear equalizer.
At the receiver, the erbium-doped fiber amplifier (EDFA) was employed only to compensate for the initial loss of the following attenuator. The noise figure and output power of the EDFA were 5.5~6.0 dB and 2 dBm. The optical-to-electrical conversion was realized by a PD (Picometrix PT-40A) with 40 GHz bandwidth, which was integrated with a trans-impedance amplifier (TIA). Finally, a real-time digital storage oscilloscope (DSO, Lecroy 845Zi-A), operating at 40 GSa/s, was utilized to capture the received waveform for offline processing later.
4.2. DSP Stack
Figure 5b,c displays the transmitter- and receiver-side DSP stacks, respectively. At the transmitter, 40,000 PAM-6/8 symbols were mapped from a pseudo random binary sequence (PRBS) as payload. A 2048-symbol training sequence was then added as a preamble, leading to 4.9% redundancy from the frame structure. After 2-times up-sampling, root raised cosine (RRC) filter with 0.05 roll-off was convoluted with the data sequence in order to restrict the signal spectrum into a rectangular shape. Before sending to the AWG, the signal was resampled to 34 Gbaud to match the sampling rate. No pre-equalization or pre-CD compensation was conducted.
At the receiver, the stored waveform was resampled from 40 GSa/s to 68 GSa/s, which equaled 2 samples per symbol (SPSs). The first 128 symbols from the training sequence were used as a synchronization sequence, and synchronization was performed by calculating the cross-correction between transmitted and received sequences. The taps of the time-domain T/2-spaced finite impulse response (FIR) filter was updated based on the training sequence by the recursive least square (RLS) algorithm. Here, linear the feed forward equalizer (FFE) and Volterra nonlinear equalizer (VNE), up to the third-order, were employed for comparison. The memory length for first-, second-, and third-order kernels were set as 73, 29, and 5, respectively. Finally, BER was obtained after symbol decision and de-mapping with ~5 × 105 bit samples.
5. Experimental Results and Discussion
5.1. Transmission Performance with Single-Arm Driven Mode
Figure 6a,b displays the received signal spectra with differential driven mode and single-arm driven mode after 20 km SSMF transmission, respectively. Note that the signal spectra in Figure 6 were normalized to keep the scale consistent with theoretical curves in Figure 2 as a validation. The normalization operation can also provide a fair comparison among different bias voltages. As shown in Figure 6a, the signal spectrum at BTB (dashed black curve) was plotted as reference. One can observe that, after transmission, the signal spectra fell around 14 GHz, resulting in severe ISI. Almost the same spectra were obtained for all the bias voltage, varying from 4.0 V to 5.2 V, which fits well with Equation (4). On the other hand, the spectra were quite different with single-arm driven mode. Note that low-arm single driven mode with bias around is utilized in Figure 6b. Similar to Figure 2d, larger bias voltage leads to a larger bandwidth at the cost of suppressing the frequency components around zero. By using single-arm driven mode, the 3-dB bandwidth achieved larger than 16 GHz, which was closer to the Nyquist bandwidth of the 34 Gbaud signal.
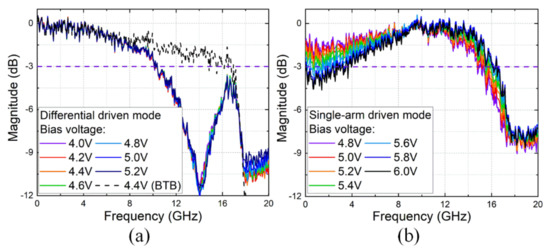
Figure 6.
Received signal spectra versus bias voltage with (a) differential driven mode and (b) single-arm driven mode after 20 km SSMF transmission.
We then quantitatively investigated the BER performance of 34 Gbaud PAM-6 and PAM-8 signals after transmission as a function of bias voltage, as in Figure 7a,b, respectively. For differential driven mode, the BERs of PAM-6/8 deteriorated to larger than 0.1, mainly due to the frequency null inside signal bandwidth. Even though VNE was applied, the BERs could hardly be brought down to below 0.1. It can be explained that the structures of both FFE and VNE were only capable of addressing frequency poles, rather than zeros. For single-arm driven mode, the BERs of PAM-6 and PAM-8 were successfully reduced to 2.78 × 10⁻² and 6.08 × 10⁻² with FFE only, at the optimal bias voltage of 5.7 V. Further improvement can be obtained by applying VNE for SSBI mitigation. In this case, the BERs of PAM-6 and PAM-8 were 1.41 × 10⁻³ and 1.37 × 10⁻², which were lower than the 7% and 20% HD-FEC thresholds, respectively. The optimal bias voltage with VNE was smaller than with FFE, because a higher carrier component was needed to suppress the influence of SSBI for FFE.
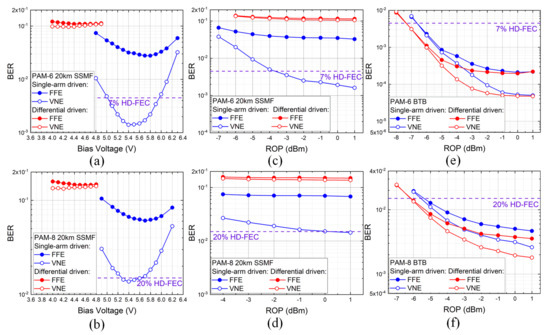
Figure 7.
Measured BER versus bias voltage for (a) PAM-6 and (b) PAM-8 signals after 20 km SSMF transmission with differential and single-arm driven mode. Measured ROP sensitivities of (c) PAM-6 and (d) PAM-8 signals after 20 km SSMF transmission and (e) PAM-6 and (f) PAM-8 signals at BTB, respectively.
Figure 7c,d depicts the ROP sensitivities of PAM-6 and PAM-8 signals after 20 km SSMF transmission, respectively. The optimized bias voltages of 4.3 V and 5.4 V were chosen for differential and single-arm driven mode, respectively. At 7% and 20% HD-FEC thresholds, the ROP sensitivities were −3.7 dBm and 0.2 dBm for PAM-6 and PAM-8 signals. We also measured the ROP penalty of utilizing the single-arm driven mode at the BTB scenario, as in Figure 7e,f. Since bias voltage can be easily adjusted in practical implementation, the curves were tested under optimal voltage of 4.3 V, which was approximately the quadrature point. When the ROP was larger than −1 dBm, the error floor could be observed, mainly due to the quantization noise of DAC. At the 7% and 20% HD-FEC thresholds, there were 0.7 dB and 0.6 dB penalties for PAM-6 and PAM-8 signals. Such a penalty can be attributed to the common mode noise elimination with differential driven mode.
5.2. Amplitude Mismatch with Differential Driven Mode
Figure 8a shows the received signal spectra as a function of amplitude mismatch ratio after 20 km SSMF transmission. The bias voltage was fixed as 5.1 V. Here, amplitude ratio 0% (black curve) was equivalent to single-arm driven mode. As the amplitude ratio got smaller, the low-frequency region became lower, while the high-frequency region was slightly lifted. The tendency was similar to numerical results in Figure 3a. On the other hand, if the amplitude ratio was fixed at −15%, changing the bias voltage could also enlarge the bandwidth, as shown in Figure 3b. In comparison, amplitude ratio was more effective in terms of the spectrum.
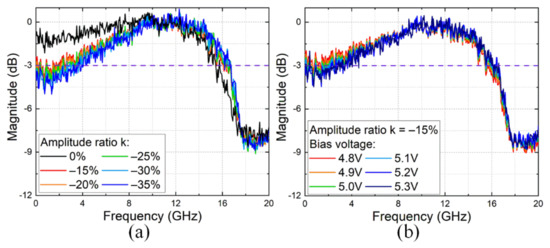
Figure 8.
(a) Received signal spectra versus amplitude ratio with 5.1 V bias voltage after 20 km SSMF transmission. (b) Received signal spectra versus bias voltage with amplitude ratio of −15% after 20 km SSMF transmission.
As shown in Figure 9a,b, the bias voltage and amplitude ratio were jointly optimized for the BER of 34Gbaud PAM-6/8 signals after 20 km transmission, respectively. The BERs were obtained with VNE. It should be noted that the amplitude between −15% and 0% was not swept, owing to the 75 mV minimum output limitation of the AWG. As mentioned in Section 3.2, a negative amplitude ratio would enhance the performance of fading frequency shifting, resulting in a smaller optimal bias voltage. Furthermore, the performance of 0% amplitude ratio was mainly limited by the high-frequency falling, while the performance of the −35% amplitude ratio was degraded due to the low-frequency suppression. As a compromise, the −15% amplitude ratio exhibited the best performance, and the BERs were further reduced from 1.41 × 10⁻³ and 1.37 × 10⁻² to 5.87 × 10⁻⁴ and 8.84 × 10⁻³ compared with single-arm driven mode. Therefore, the amplitude ratio was kept as −15% in Figure 9c–f.
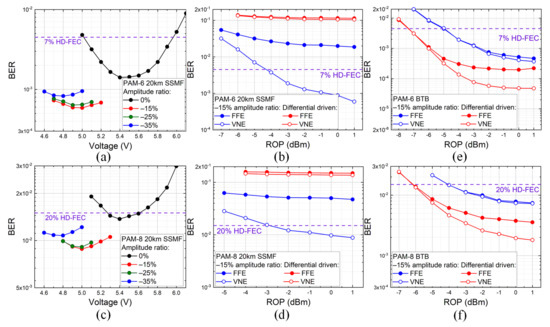
Figure 9.
Measured BER versus amplitude ratio and bias voltage for (a) PAM-6 and (b) PAM-8 signals after 20 km SSMF transmission. Measured ROP sensitivities with −15% amplitude ratio for (c) PAM-6 and (d) PAM-8 signals after 20 km SSMF transmission and for (e) PAM-6 and (f) PAM-8 signals at BTB, respectively.
Figure 9c,d shows the ROP sensitivities of PAM-6 and PAM-8 signals after 20 km SSMF transmission, respectively. The ROP sensitivities could be improved to −4.3 dBm and −2.9 dBm at the 7% and 20% HD-FEC thresholds for PAM-6 and PAM-8 signals. Moreover, the ROP penalty at BTB were measured in Figure 9e,f. At 7% and 20% HD-FEC thresholds, there were 2.2 dB and 2.1 dB penalties for PAM-6 and PAM-8 signals, which was much larger than the single-arm driven mode. The reason is that part of amplitude modulation would become phase modulation when k < 0 and square-law detection at BTB loses the phase information.
5.3. Time Skew with Differential Driven Mode
Finally, the impact of time skew was experimentally tested. Figure 10a shows the received signal spectra with different skew values at the BTB case. Similar to Figure 4c, spectral narrowing was introduced by time skew. Differently, as shown in Figure 10b, time skew was able to confront with power fading after 20 km SSMF transmission. A sharp depression inside the spectrum could be observed with 0 ps skew (black curve). The fading frequency components could be gradually lifted as the skew value increased.
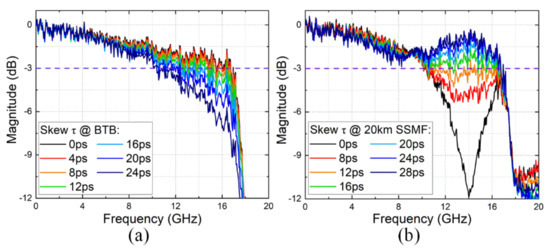
Figure 10.
Received signal spectra versus time skew (a) at BTB and (b) after 20 km SSMF transmission.
Figure 11a,b shows the measured BERs as a function of time skew for 34 Gbaud PAM-6/8 formats, both at BTB and after 20 km SSMF transmission. For the BTB case, the larger skew values lead to the rising of BER, which was caused by more serious ISI in the time domain or low pass filtering in the frequency domain. For 20 km SSMF transmission, the BERs could be brought down quickly as the skew increased and then reached an error floor when the skew was larger than 20 ps. The lowest BERs were 2.43 × 10⁻⁴ and 5.39 × 10⁻³ with 26 ps skew for PAM-6 and PAM-8 signals, respectively. Figure 11c–f measures the ROP sensitivity for PAM-6/8 signals after 20 km SSMF transmission and at BTB, respectively. The skew was controlled as 20 ps considering both BTB and transmission performance, suitable for practical implementation with a fixed delay line. After 20 km SSMF transmission, the ROP sensitivities were promoted to −5.1 dBm and −3.9 dBm at the 7% and 20% HD-FEC thresholds, which was the best result among three imbalances. For the BTB case, the penalties were 1.3 dB and 1.2 dB after introducing time skew for PAM-6 and PAM-8 signals. It can be explained as the low pass filtering effect.
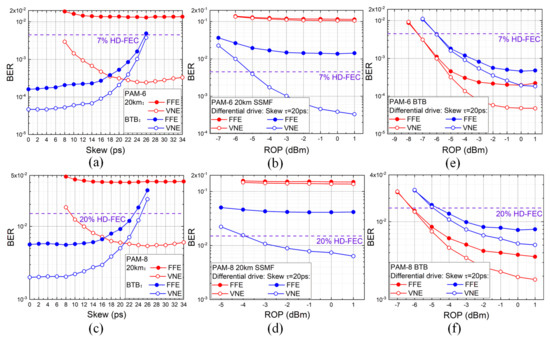
Figure 11.
Measured BER versus time skew for (a) PAM-6 and (b) PAM-8 signals after 20 km SSMF transmission with differential driven mode. Measured ROP sensitivities with 20 ps for (c) PAM-6 and (d) PAM-8 signals after 20 km SSMF transmission and for (e) PAM-6 and (f) PAM-8 signals at BTB, respectively.
5.4. Eye-Diagrams
Figure 12 displays the typical eye-diagrams and amplitude histograms of PAM-6/8 signals with FFE/VNE at BTB and after 20 km SSMF transmission operating at different modes, respectively. The ROP was fixed at 1 dBm. For 20 km transmission scenario, the eyes in the first line could hardly be recognized (dashed circle), which suffered severe power fading with differential driven mode. Meanwhile, the eyes with FFE in the second, third, and fourth lines were faintly separated and became quite clear after applying VNE for nonlinear SSBI compensation. According to the amplitude histograms of PAM-8 signals, it can be confirmed that time skew had the best performance and amplitude mismatch was better than bias deviation after transmission. On the other hand, for the BTB scenario, the first line exhibited the clearest eyes with highest peaks in amplitude histograms. The eyes in the third lines had the lowest peak probability. Therefore, amplitude mismatch induced the largest penalty at BTB, while bias deviation with single-arm driven mode had the smallest penalty compared to differential driven mode. Moreover, the similar results of PAM-6/8 signals indicated that the influence of imbalances indeed acted as a frequency transfer function, which holds for different modulation formats.

Figure 12.
Typical eye-diagrams and amplitude histograms of PAM-6/8 signals with FFE/VNE at BTB and after 20 km SSMF transmission operating at different modes, respectively. w/diff., conventional IM with differential driven mode; w/bias, with bias deviation in single-arm driven mode; w/amp., with amplitude mismatch in differential driven mode; w/skew, with time skew in differential driven mode.
5.5. Impact of Transmission Distance
The above comparisons focus on 20 km SSMF transmission. For longer distances, the basic limitation can be still understood from channel response in the frequency domain. Figure 13a–d depicts the overall transfer function after 20/40/60/80 km SSMF transmission. Conventional IM with differential driven mode (black curve) is shown as benchmark. We found that, with the help of bias deviation (blue curve) and amplitude mismatch (green curve), the 3 dB bandwidth could be extended by ~35%. However, since the frequency nulls were not cancelled, the available transmission bandwidth inevitably reduced inversely proportional to the square of fiber length. Fortunately, if time skew is adopted, the 3 dB bandwidth is kept around 20 GHz, showing much stronger robustness against power fading. A smoother response can be obtained by selecting the appropriate value of skew.
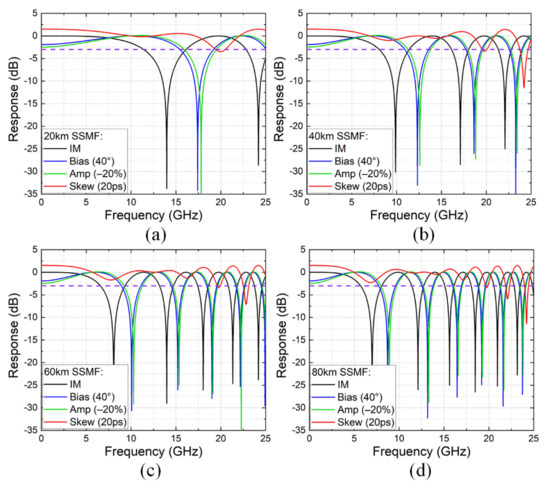
Figure 13.
Calculated transfer function operating at different modes after (a) 20 km, (b) 40 km, (c) 60 km, and (d) 80 km SSMF transmission, respectively. IM: conventional IM with differential driven mode; Bias (40°), with 40° bias phase in upper-arm single driven mode; Amp (−20%), with −20% amplitude mismatch in differential driven mode; Skew (20 ps) with 20 ps time skew in differential driven mode.
5.6. Comparison of Preivous Work
Key parameters of recent reported works on short-reach DD links are summarized in Table 1. Although the capacity and reach can be further improved using complex-valued modulation, the hardware complexity of transmitter was almost doubled owing to the IQ modulator and another DAC, which is not suitable for such a cost-sensitive scenario. Meanwhile, the transmitter structures proposed in References [26,27] are also complicated, and the subcarrier allocation algorithm was designed only for multi-carrier modulation, such as the orthogonal frequency division multiplexing (OFDM) signal, which is not compatible with PAM. The main contribution of our work is to offer a cost-effective solution employing imbalanced MZM with single DAC. The hardware complexity is almost the same as standard IM-DD configuration. Another advantage is that all three imbalances are compatible with various modulation schemes, including PAM, carrier-less amplitude and phase modulation (CAP), subcarrier modulation (SCM), and discrete multi-tone (DMT). Moreover, as mentioned in Section 5.5, although 20 km was chosen for fair comparison, the differential skew scheme has the potential for longer transmission, up to 80 km.

Table 1.
Comparison of DD transmission experiments.
6. Conclusions
In conclusion, we systematically investigated the impact of bias deviation, amplitude mismatch, and time skew for MZM-based short-reach DD links. The overall transfer function, including fiber dispersion and PD detection, were theoretically obtained and validated numerically. Specifically, bias deviation with single-arm driven mode and amplitude mismatch with differential driven mode can shift the frequency of fading notches, while time skew is capable of filling up the frequency nulls. In the experiment, 34 Gbaud Nyquist PAM-6/8 signals reached the 7% and 20% HD-FEC thresholds after 20 km SSMF transmission, after introducing one of the imbalances combined with VNE. For fading-dominated fiber transmission, the ROP sensitivity from best to the worse was sorted as: time skew, amplitude mismatch, and bias deviation. On the other hand, for the BTB case, the imbalance-induced penalty from the least to the largest could be sorted as: bias deviation, time skew, and amplitude mismatch. Both numerical and experimental results confirm that the dispersion induced power fading can be effectively suppressed with bias, amplitude, or skew imbalances, providing a valuable reference for the transmitter design in C-band short-reach optical transmission systems.
Author Contributions
Conceptualization, Y.Z. and W.H.; methodology, Y.Z.; software, Y.Z.; validation, Y.Z.; formal analysis, Y.Z.; investigation, Y.Z., X.M., Q.W. and L.Y.; resources, Y.Z.; data curation, Y.Z.; writing—original draft preparation, Y.Z.; writing—review and editing, Y.Z., X.M., Q.W., L.Y. and W.H.; visualization, Y.Z.; supervision, W.H.; project administration, Y.Z. and W.H.; funding acquisition, Y.Z. and W.H. All authors have read and agreed to the published version of the manuscript.
Funding
National Natural Science Foundation of China (62001287); China Postdoctoral Science Foundation (2021M692098); National Key R&D Program of China (2018YFB1800904).
Data Availability Statement
All data needed to evaluate the conclusions are presented in the paper. Additional data related to this paper may be requested from the authors.
Conflicts of Interest
The authors declare no conflict of interest.
References
- Zhong, K.; Zhou, X.; Huo, J.; Yu, C.; Lu, C.; Lau, A.P.T. Digital Signal Processing for Short-Reach Optical Communications: A Review of Current Technologies and Future Trends. IEEE/OSA J. Light. Technol. 2018, 36, 377–400. [Google Scholar] [CrossRef]
- Liu, G.N.; Zhang, L.; Zuo, T.; Zhang, Q. IM/DD Transmission Techniques for Emerging 5G Fronthaul, DCI, and Metro Applications. IEEE/OSA J. Light. Technol. 2018, 36, 560–567. [Google Scholar] [CrossRef]
- Chagnon, M. Optical Communications for Short Reach. IEEE/OSA J. Light. Technol. 2019, 37, 1779–1797. [Google Scholar] [CrossRef]
- IEEE P802.3bs 200 Gb/s and 400 Gb/s Ethernet Task Force. 2018. Available online: http://www.ieee802.org/3/bs/ (accessed on 9 October 2018).
- Agrawal, G. Fiber-Optic Communication Systems, 4th ed.; Wiley: Hoboken, NJ, USA, 2010. [Google Scholar]
- Savory, S.J. Digital Coherent Optical Receivers: Algorithms and Subsystems. IEEE J. Sel. Top. Quantum Electron. 2010, 16, 1164–1179. [Google Scholar] [CrossRef]
- Kikuchi, K. Fundamentals of Coherent Optical Fiber Communications. IEEE/OSA J. Light. Technol. 2016, 34, 157–179. [Google Scholar] [CrossRef]
- Che, D.; Hu, Q.; Shieh, W. Linearization of Direct Detection Optical Channels Using Self-Coherent Subsystems. IEEE/OSA J. Light. Technol. 2016, 34, 516–524. [Google Scholar] [CrossRef]
- Wey, J.S.; Zhang, J. Passive Optical Networks for 5G Transport: Technology and Standards. IEEE/OSA J. Light. Technol. 2019, 37, 2830–2837. [Google Scholar] [CrossRef]
- Zhang, J.; Yu, J.; Wey, J.S.; Li, X.; Zhao, L.; Wang, K.; Kong, M.; Zhou, W.; Xiao, J.; Xin, X.; et al. SOA Pre-Amplified 100 Gb/s/λ PAM-4 TDM-PON Downstream Transmission Using 10 Gbps O-Band Transmitters. IEEE/OSA J. Light. Technol. 2020, 38, 185–193. [Google Scholar] [CrossRef]
- Eiselt, N.; Wei, J.; Griesser, H.; Dochhan, A.; Eiselt, M.; Elbers, J.-P.; Olmos, J.J.V.; Monroy, I.T. First real-time 400G PAM-4 demonstration for inter-data center transmission over 100 km of SSMF at 1550 nm. In Proceedings of the 2016 Optical Fiber Communication Conference (OFC), Anaheim, CA, USA, 20–24 March 2016; pp. 1–3. [Google Scholar]
- Ilgaz, M.; Baliz, K.; Batagelj, B. A Flexible Approach to Combating Chromatic Dispersion in a Centralized 5G Network. Opto-Electron. Rev. 2020, 38, 35–42. [Google Scholar]
- Zhang, J.; Yu, J.; Li, X.; Wei, Y.; Wang, K.; Zhao, L.; Zhou, W.; Kong, M.; Pan, X.; Liu, B.; et al. 100 Gbit/s VSB-PAM-n IM/DD transmission system based on 10 GHz DML with optical filtering and joint nonlinear equalization. Opt. Express 2019, 27, 6098–6105. [Google Scholar] [CrossRef]
- Loayssa, A.; Benito, D.; Garde, M. Single-sideband suppressed-carrier modulation using a single-electrode electrooptic modulator. IEEE Photon. Technol. Lett. 2001, 13, 869–871. [Google Scholar] [CrossRef]
- Li, Z.; Erkılınç, M.S.; Shi, K.; Sillekens, E.; Galdino, L.; Thomsen, B.C.; Bayvel, P.; Killey, R.I. SSBI Mitigation and the Kramers–Kronig Scheme in Single-Sideband Direct-Detection Transmission with Receiver-Based Electronic Dispersion Compensation. IEEE/OSA J. Light. Technol. 2017, 35, 1887–1893. [Google Scholar] [CrossRef] [Green Version]
- Zhang, L.; Zuo, T.; Mao, Y.; Zhang, Q.; Zhou, E.; Liu, G.N.; Xu, X. Beyond 100-Gb/s Transmission Over 80-km SMF Using Direct-Detection SSB-DMT at C-Band. IEEE/OSA J. Light. Technol. 2016, 34, 723–729. [Google Scholar] [CrossRef]
- Li, X.; Xing, Z.; Alam, M.; Pasandi, M.; O’Sullivan, M.; Plant, D.V. Demonstration of C-Band Amplifier-Free 100 Gb/s/λ Direct-Detection Links Beyond 40-km SMF Using a High-Power SSB Transmitter. IEEE/OSA J. Light. Technol. 2020, 38, 6170–6177. [Google Scholar] [CrossRef]
- Le, S.T.; Schuh, K.; Chagnon, M.; Buchali, F.; Dischler, R.; Aref, V.; Buelow, H.; Engenhardt, K.M. 1.72Tb/s virtual-carrier assisted direct-detection transmission over 200km. IEEE/OSA J. Light. Technol. 2018, 36, 1347–1353. [Google Scholar] [CrossRef]
- Zhu, Y.; Zou, K.; Chen, Z.; Zhang, F. 224 Gb/s Optical Carrier-Assisted Nyquist 16-QAM Half-Cycle Single-Sideband Direct Detection Transmission over 160 km SSMF. IEEE/OSA J. Light. Technol. 2017, 35, 1557–1565. [Google Scholar] [CrossRef]
- Rath, R.; Clausen, D.; Ohlendorf, S.; Pachnicke, S.; Rosenkranz, W. Tomlinson–Harashima Precoding for Dispersion Uncompensated PAM-4 Transmission with Direct-Detection. IEEE/OSA J. Light. Technol. 2017, 35, 3909–3917. [Google Scholar] [CrossRef]
- Hu, Q.; Schuh, K.; Chagnon, M.; Buchali, F.; Le, S.T.; Bülow, H. 50 Gb/s PAM-4 Transmission over 80-km SSMF without dispersion compensation. In Proceedings of the 2018 European Conference on Optical Communication (ECOC), Roma, Italy, 23–27 September 2018; pp. 1–3. [Google Scholar]
- Wang, H.; Zhou, J.; Guo, D.; Feng, Y.; Liu, W.; Yu, C.; Li, Z. Adaptive Channel-Matched Detection for C-Band 64-Gbit/s Optical OOK System Over 100-km Dispersion-Uncompensated Link. IEEE/OSA J. Light. Technol. 2020, 38, 5048–5055. [Google Scholar] [CrossRef]
- Tang, X.; Qiao, Y.; Chen, Y.-W.; Lu, Y.; Chang, G.-K. Digital Pre- and Post-Equalization for C-Band 112-Gb/s PAM4 Short-Reach Transport Systems. IEEE/OSA J. Light. Technol. 2020, 38, 4683–4690. [Google Scholar] [CrossRef]
- Lebedev, A.; Vegas Olmos, J.J.; Iglesias, M.; Forchhammer, S.; Monroy, I.T. A novel method for combating dispersion induced power fading in dispersion compensating fiber. Opt. Express 2013, 21, 13617–13625. [Google Scholar] [CrossRef] [Green Version]
- Zhang, Q.; Stojanovic, N.; Xie, C.; Prodaniuc, C.; Laskowski, P. Transmission of single lane 128 Gbit/s PAM-4 signals over an 80 km SSMF link, enabled by DDMZM aided dispersion pre-compensation. Opt. Express 2016, 24, 24580–24591. [Google Scholar] [CrossRef] [PubMed]
- Ishimura, S.; Bekkali, A.; Tanaka, K.; Nishimura, K.; Suzuki, M. 1.032-Tb/s CPRI-Equivalent Rate IF-Over-Fiber Transmission Using a Parallel IM/PM Transmitter for High-Capacity Mobile Fronthaul Links. IEEE/OSA J. Light. Technol. 2018, 36, 1478–1484. [Google Scholar] [CrossRef]
- Bekkali, A.; Ishimura, S.; Tanaka, K.; Nishimura, K.; Suzuki, M. Multi-IF-Over-Fiber System with Adaptive Frequency Transmit Diversity for High Capacity Mobile Fronthaul. IEEE/OSA J. Light. Technol. 2019, 37, 4957–4966. [Google Scholar] [CrossRef]
- Liu, S.; Peng, P.-C.; Huang, L.; Hsu, C.-W.; Tian, H.; Chang, G.-K. Bandwidth-Enhanced PAM-4 Transmissions Using Polarization Modulation and Direct Detection with a Tunable Frequency Range. IEEE/OSA J. Light. Technol. 2019, 37, 1014–1022. [Google Scholar] [CrossRef]
- Zou, D.; Li, F.; Li, Z.; Wang, W.; Sui, Q.; Cao, Z.; Li, Z. 100G PAM-6 and PAM-8 Signal Transmission Enabled by Pre-Chirping for 10-km Intra-DCI Utilizing MZM in C-band. IEEE/OSA J. Light. Technol. 2020, 38, 3445–3453. [Google Scholar] [CrossRef]
- Zhu, Y.; Li, L.; Miao, X.; Hu, W. Time skew enabled vestigial sideband modulation for dispersion-tolerant direct–detection transmission. Opt. Lett. 2020, 45, 6138–6141. [Google Scholar] [CrossRef]
- Zhu, Y.; Li, L.; Miao, X.; Wu, Q.; Yin, L.; Hu, W. 100G PAM-8 transmission with direct detection utilizing imbalanced mach-Zehnder modulator for power fading suppression. In Proceedings of the 2021 19th International Conference on Optical Communications and Networks (ICOCN), Qufu, China, 23–27 August 2021; pp. 1–3. [Google Scholar]
- Zhang, L.M.; Kschischang, F.R. Staircase codes with 6% to 33% overhead. IEEE/OSA J. Light. Technol. 2014, 32, 1999–2002. [Google Scholar] [CrossRef] [Green Version]
- Smith, G.H.; Novak, D.; Ahmed, Z. Overcoming Chromatic-Dispersion Effects in Fiber-Wireless Systems Incorporating External Modulators. IEEE Trans. Microwave Theory Tech. 1997, 45, 1410–1415. [Google Scholar] [CrossRef]
Publisher’s Note: MDPI stays neutral with regard to jurisdictional claims in published maps and institutional affiliations. |
© 2021 by the authors. Licensee MDPI, Basel, Switzerland. This article is an open access article distributed under the terms and conditions of the Creative Commons Attribution (CC BY) license (https://creativecommons.org/licenses/by/4.0/).