1. Introduction
There is overwhelming scientific evidence that human activity is the biggest contributor to climate change through greenhouse gas (GHG) emissions. The production and utilization of fossil-based energy sources are the largest contributors to anthropogenic GHG emissions [
1]. The Intergovernmental Panel on Climate Change (IPCC) suggested limiting global warming to 1.5 °C above preindustrial levels [
2], requiring the development and deployment of cleaner energy technologies. These clean technologies should provide significant GHG reductions with a large potential market capture. Currently, transport, industrial activities, and building are the largest economic sectors driving fossil energy demand. The information and communication technology (ICT) sector is receiving relatively little attention. Recent reports showed that in the worst-case scenario, this sector could become a dominant energy user, potentially consuming as much as half of global electricity in 2030 [
3]. Another report indicated that the overall carbon footprint of the ICT sector is expected to increase significantly [
4].
The deployment of 5G networks and the prevalence of Internet of Things (IoT) devices will continue to drive the fast growth of energy demand in the ICT sector. Energy demand for IoT devices is expected to increase by a factor of 17 between 2016 and 2025 [
4]. This will add additional pressure to current commitments to reduce GHG emissions, particularly if there is no significant reduction in other sectors. Indeed, a growing global economy and increasing energy demand, combined with a lack of cost-competitive, large-scale renewable power generation, has led to increasing emissions [
5]. Even with increasing renewable energy, demand for coal and natural gas will continue to grow due to increasing global electricity demand. Improved efficiency at the device level (TV monitors, smartphones, computers, tablets, and modems) has led to reduced unit electricity consumption (J/bit), but overall consumption is increasing due to the growing demand from additional features and services. Electricity demand from different network layers is also expected to increase. For example, electricity demand for Wi-Fi networks is anticipated to grow from today’s 250 TWh to 4500 TWh in 2030 [
3]. This 20-fold increase in demand within a decade could not be compensated for just by the gain of efficiency. To provide perspective and significance to this challenge, Canada produced 652.3 TWh of electricity in 2017, representing 3% of global electricity production [
6].
Andrae and Edler [
3] developed three case scenarios for overall energy demand from the ICT sector. In these three different scenarios devices, communication networks, and data center consumption are considered. These scenarios include annual numbers of sold devices, data traffic, and electricity intensities. The ICT sector is expected to be responsible for up to 51% of the total world power demand. This could lead to higher consumption of fossil fuels, as this is the only scalable, cost-effective, and ready-to-deploy source of electricity. The deployment of carbon-neutral 5G networks [
7] will thus require the development of scalable clean electricity sources that are easy to integrate within telecommunication networks.
There are numerous potential software and hardware solutions to address increasing GHG emissions within the ICT sector. Energy consumption per bit transferred through wireless networks has been reduced using new antenna technology known as massive multiple-input multiple-output (MIMO) [
8]. The deployment a 5G networks will probably not proceed on a linear basis. For example, standby mode was not built in 4G networks, which leads to energy waste when base stations (BSs) are not all needed during off-peak demand [
9]. Thus, it is quite difficult to accurately forecast GHG emissions, as heterogeneous network architectures are expanding, and overall energy demand is increasing. Relying simply on large-scale production units to reduce the carbon footprint of the ICT sector is not the right strategy. The integration of clean and decentralized energy solutions within wireless networks during the planning stage is a better option. However, the advantages of these solutions are difficult to quantify. Furthermore, optimizing the production and use of electricity requires integrated assessment tools for reducing net cost and GHG emissions.
Numerous accounting tools have been developed for specific sectors with significant differences in terms of system boundaries and granularity. System boundary definition may lead to truncations that could impact economic viability when using different carbon credit markets. A top-down approach is often used, but it limits considerations related to the impact of local factors and understanding the link with specific technological characteristics. This leads to significant uncertainty in the long-term overall forecasting and identification of major technological gaps. This truncation often leads to significant errors [
10] and increases uncertainty in the overall long-term forecasting and identification of key technology gaps. As such, there is a need to develop a GHG forecasting framework validated through case studies. The choice of case studies is critical when developing and validating any GHG accounting methodology. The case study should be well defined and specific but easily reproduced elsewhere for potential deployment.
According to the CISCO global index report, Wi-Fi represents around half of data traffic. With increasing mobile data demand, Wi-Fi hotspot use is expected to grow fourfold from 2018 to 2023 [
11]. Globally, there will be nearly 628 million public Wi-Fi hotspots by 2023, up from 169 million hotspots in 2018 [
12]. Green energy sources powering Wi-Fi access points are thus critical. Recent publications demonstrated the potential of solar energy as the main energy source to power satellite internet access points [
13] and base stations [
14,
15]. To the best of our knowledge, there is no peer-reviewed publication on the optimization of community solar Wi-Fi systems, including detailed GHG estimation. Developing countries are seeing an explosion in the use of wireless networks [
16], often powered by fossil sources. Like most African countries, Algeria has seen an increase in cell phone usage by 18% from 2012 to 2020 [
17]. With more than 1.5 million students over 106 university campuses, students often rely on free Wi-Fi networks to access the internet. The majority of these students have limited internet access at home. The cost structure of a wireless network subscription is often prohibitive. Local authorities are trying to provide free access, albeit with limited strategies for deploying sustainable solutions. In particular, with the dominance of fossil electricity and the abundance of solar energy, photovoltaic-powered wireless networks could provide sustainable deployment of Wi-Fi in most university campuses and other communities.
In this paper, we will describe a new bottom-up GHG calculation framework to account for the deployment of community-based Wi-Fi-powered solar energy. This framework also includes a methodology to estimate energy consumption as a function of the number of Wi-Fi access points using newly developed MATLAB code. We will use a specific case study related to a university campus to assess the GHG reduction mitigation impact if the proposed solar Wi-Fi solution is deployed at the country scale.
2. Materials and Methods
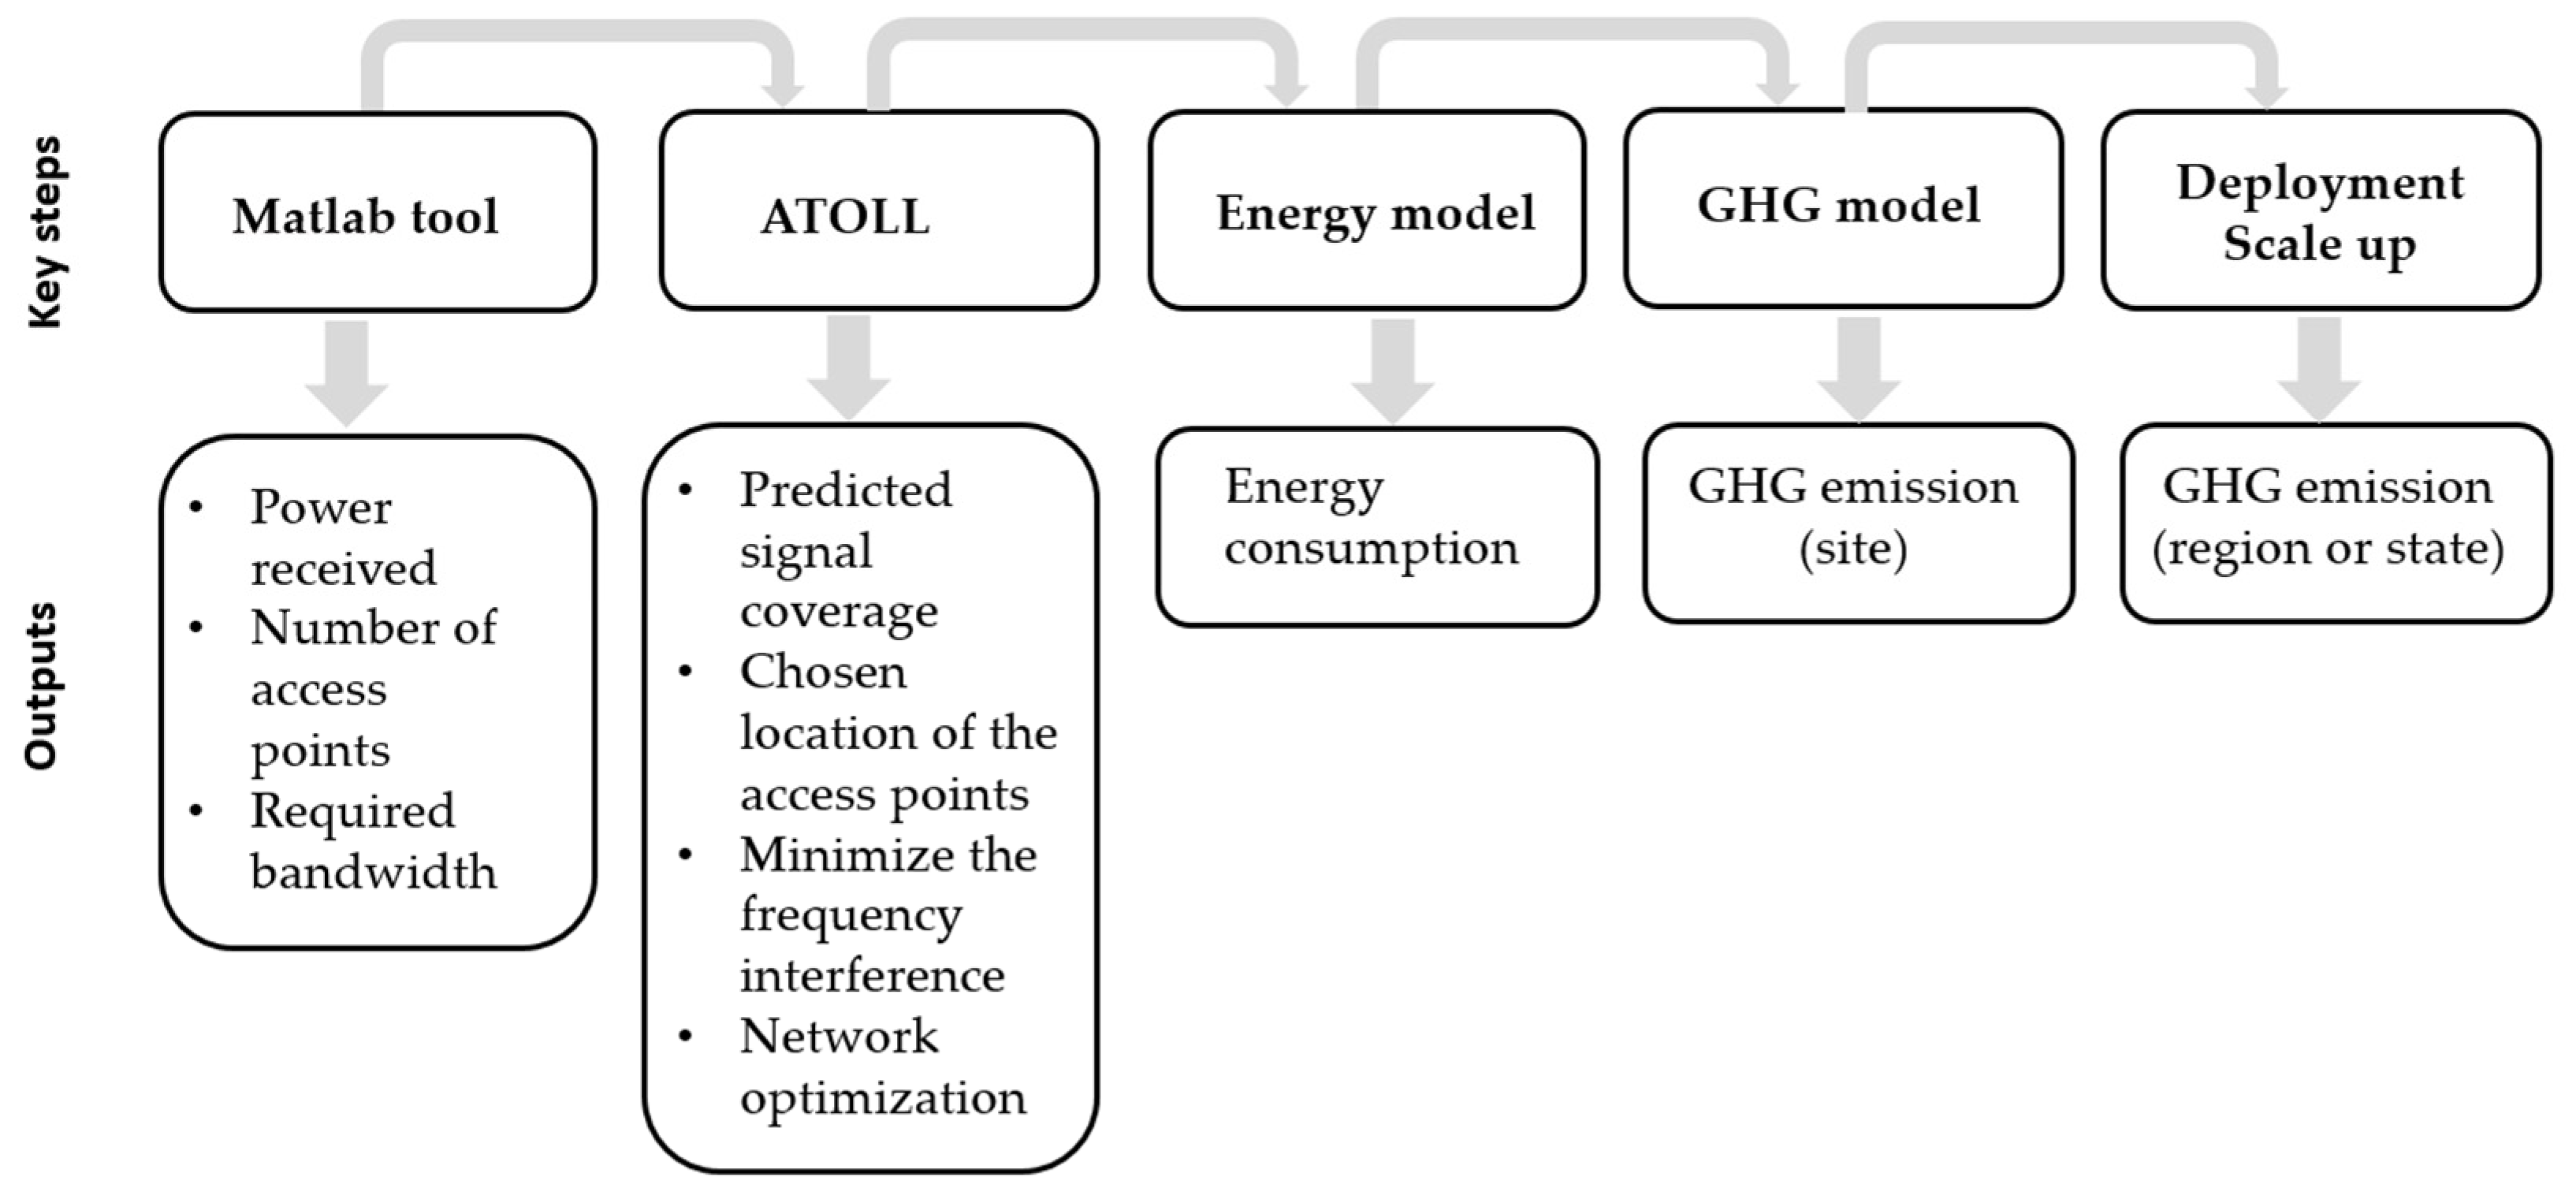
The proposed methodology summarized in
Figure 1 includes 5 key steps. Key outputs for each step are also indicated. Details of each tool are described in more detail in this section.
2.1. System Boundary: Case Study
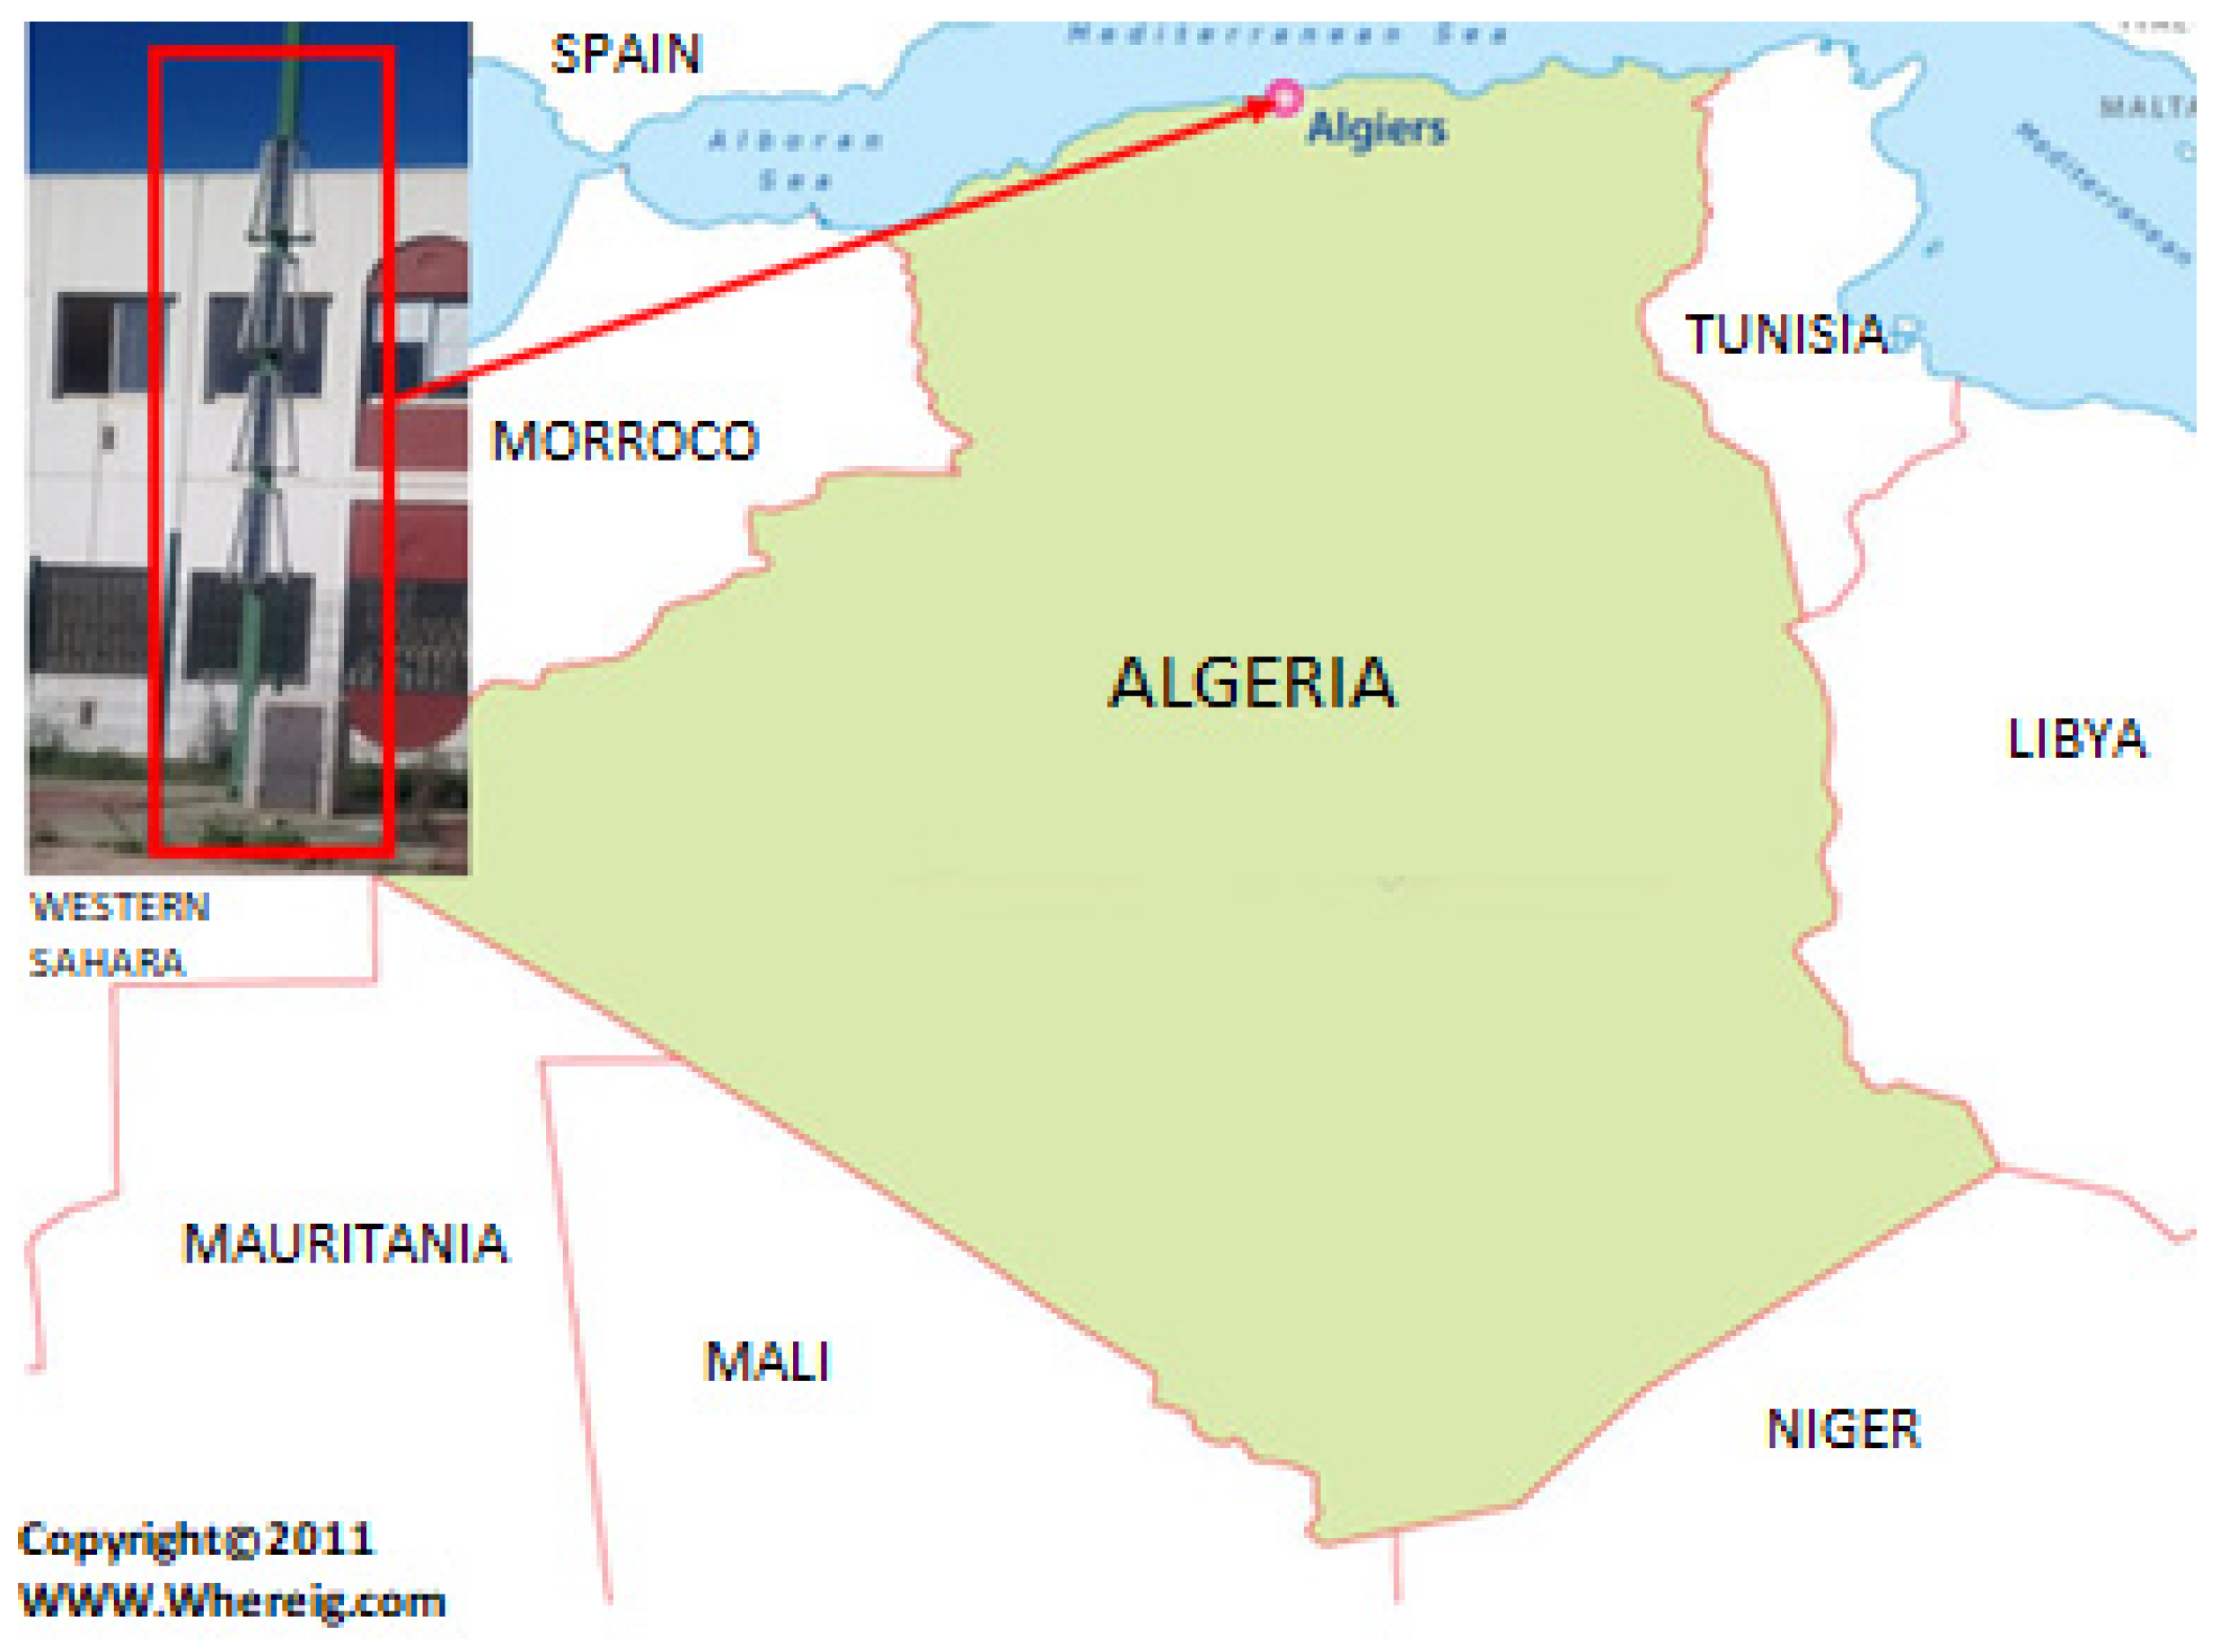
A bottom-up approach is used to assess the potential GHG impact for deploying solar-powered Wi-Fi on university campuses. To develop this methodology, we considered a practical case study. Standalone Wi-Fi (
Figure 2) was sized and built at the National High School of Technology (École National Supérieur de Technologie (ENST)) campus near Algiers (Algeria). Mini-solar modules were installed along the Wi-Fi post. This design provides more flexibility to satisfy variable energy demand.
In this case study, we modeled the signal coverage and energy requirements to cover the whole ENST campus using Wi-Fi technology based on a standalone Wi-Fi-powered post. Each Wi-Fi post will be referred to as a base station (BS) in this paper. Each element of the network is analyzed to estimate the energy consumption of the network. Next, the carbon footprint of electricity consumption has been estimated when using two sources of electricity: fossil energy (baseline) and solar energy. This will help estimate the potential GHG mitigation through the wider deployment of solar-powered Wi-Fi stations.
The sizing and planning of wireless networks are very critical steps. The overall electricity consumption is estimated for the different design scenarios. The resources (bandwidth, frequency, equipment) required to satisfy all potential subscribers within the campus will be first estimated. Solutions to overcoming potential technical constraints during deployment are also provided. Dimensioning a Wi-Fi network is based on two main criteria: coverage and capacity. For this purpose, we developed a user interface using MATLAB, and we optimized this network using the ATOLL telecommunications network simulator. Once we completed system dimensioning, energy consumption was thus estimated, allowing quantification of the carbon footprints.
2.2. Wi-Fi Network Design
In order to design the Wi-Fi network with a graphical interface, we developed a MATLAB code using the Graphical User Interface Development Environment (GUIDE) function, which is based on different graphical objects (functions “handles”, “properties of the objects”, “callbacks”). Below, the key equations used to develop the MATLAB code are described.
2.2.1. Wi-Fi Network Coverage Design
The first step in system dimensioning involves determining the number of BS transmitters required to cover the whole campus. For this, we needed to estimate the maximum path loss following the approach described in [
19]. Then, the link budget was calculated to determine whether the power level received will be sufficient for the link to function correctly and also assess the quality of the signal. This parameter is difficult to assess, as it depends on the user’s needs. Wi-Fi transmitters required for optimal Wi-Fi coverage were installed on solar-powered street lighting poles to minimize cost and GHG impacts.
In order to determine the path loss (PL), different propagation models were considered. The most suitable model for the Wi-Fi network is the Egli model [
19]. The Egli model for median path loss over irregular terrain is
where
: path loss (W);
: gain of base transmitter (dB);
: gain of mobile transmitter (dB);
: height of base station antenna (m);
: height of mobile station antenna (m);
d: link distance (m);
f: frequency (MHz);
: Transmit power (W).
The power components of the link budget related to the transmitter side are critical. This is often represented by the effective isotropic radiated power (EIRP), given by:
where
The power component of the link budget related to the receiver side is represented by the received power (
):
where
In order to properly detect the transmitted signal, the following conditions must be satisfied.
The proposed coverage design of the Wi-Fi-based BS allows us to determine the number of cells to optimize signal coverage. The total number of cells is given by:
where R is the range of each BS.
The number of access points (
) for each cell is determined by the following ratio:
where
The total number of access points (
) in the network will then be:
where
2.2.2. Wi-Fi Network Capacity Design
It is important to estimate the number of users that can be managed by a single access point in order to determine the number of access points within a coverage area.
Determining the type of application (data, voice, video) determines the nature of traffic the network must carry. This ensures that the performance of the network meets the needs of the users.
To determine the total capacity of the system, the maximum individual throughput needed for each service offered must be determined.
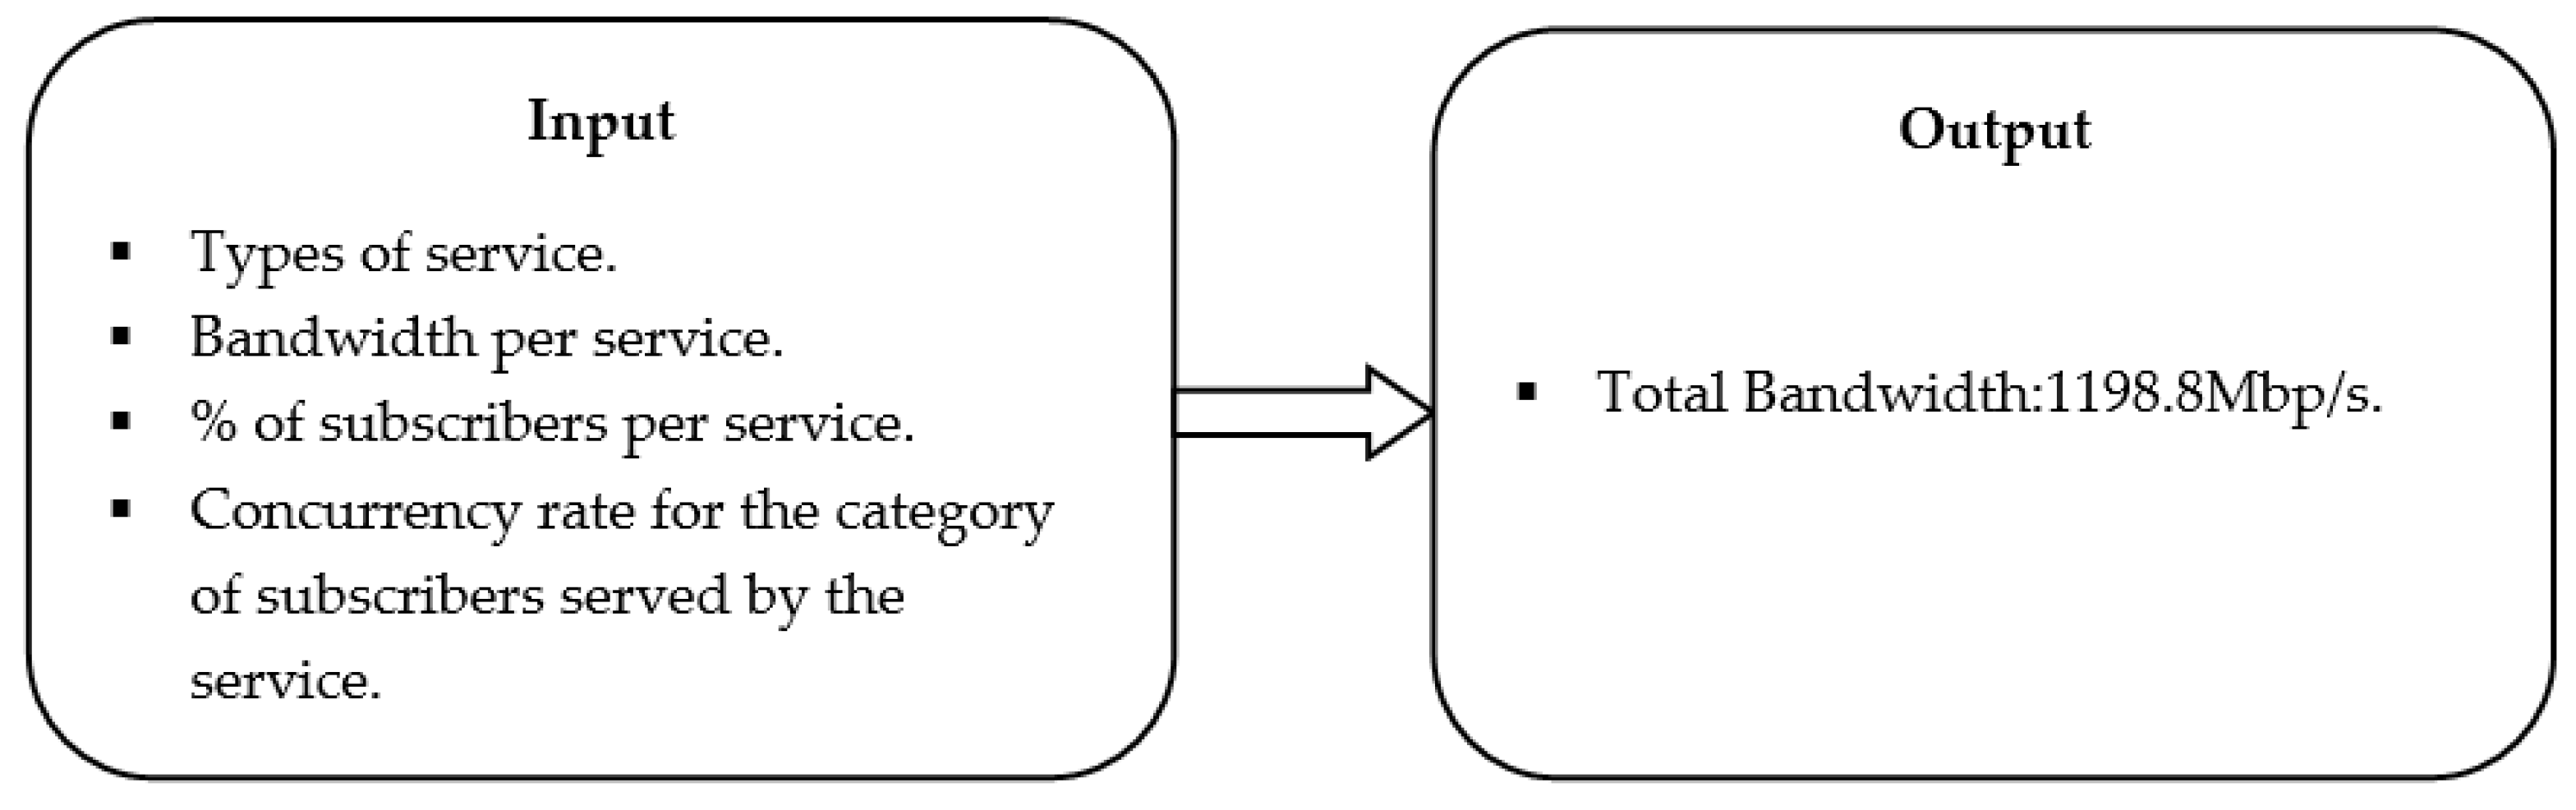
Table 1 provides typical bandwidth values for the main supported services.
In order to support the different services, we need to have sufficient bandwidth within the proposed network. The bandwidth (
) is calculated using the following equation:
where
nj: number of subscribers served by service j;
cj: bandwidth by subscribers for service j;
tj: concurrency rate for the category of subscribers served by the service.
2.3. Planning and Optimization of the Network Using ATOLL
ATOLL software is used for the design and optimization of Wi-Fi networks. It allows optimizing frequency distribution within the outdoor environment to minimize the co-channel interference and to find the optimal location and number of access points. The following steps are considered in planning a wireless network using the ATOLL software [
21]:
Creation of a new project by choosing wireless technology.
The precision of the geographic coordinate format, in our case related to the coordinates of the ENST and the region of Algiers.
Importing maps of the relevant region with terrain features.
Configuring radio frequency bandwidth work parameters.
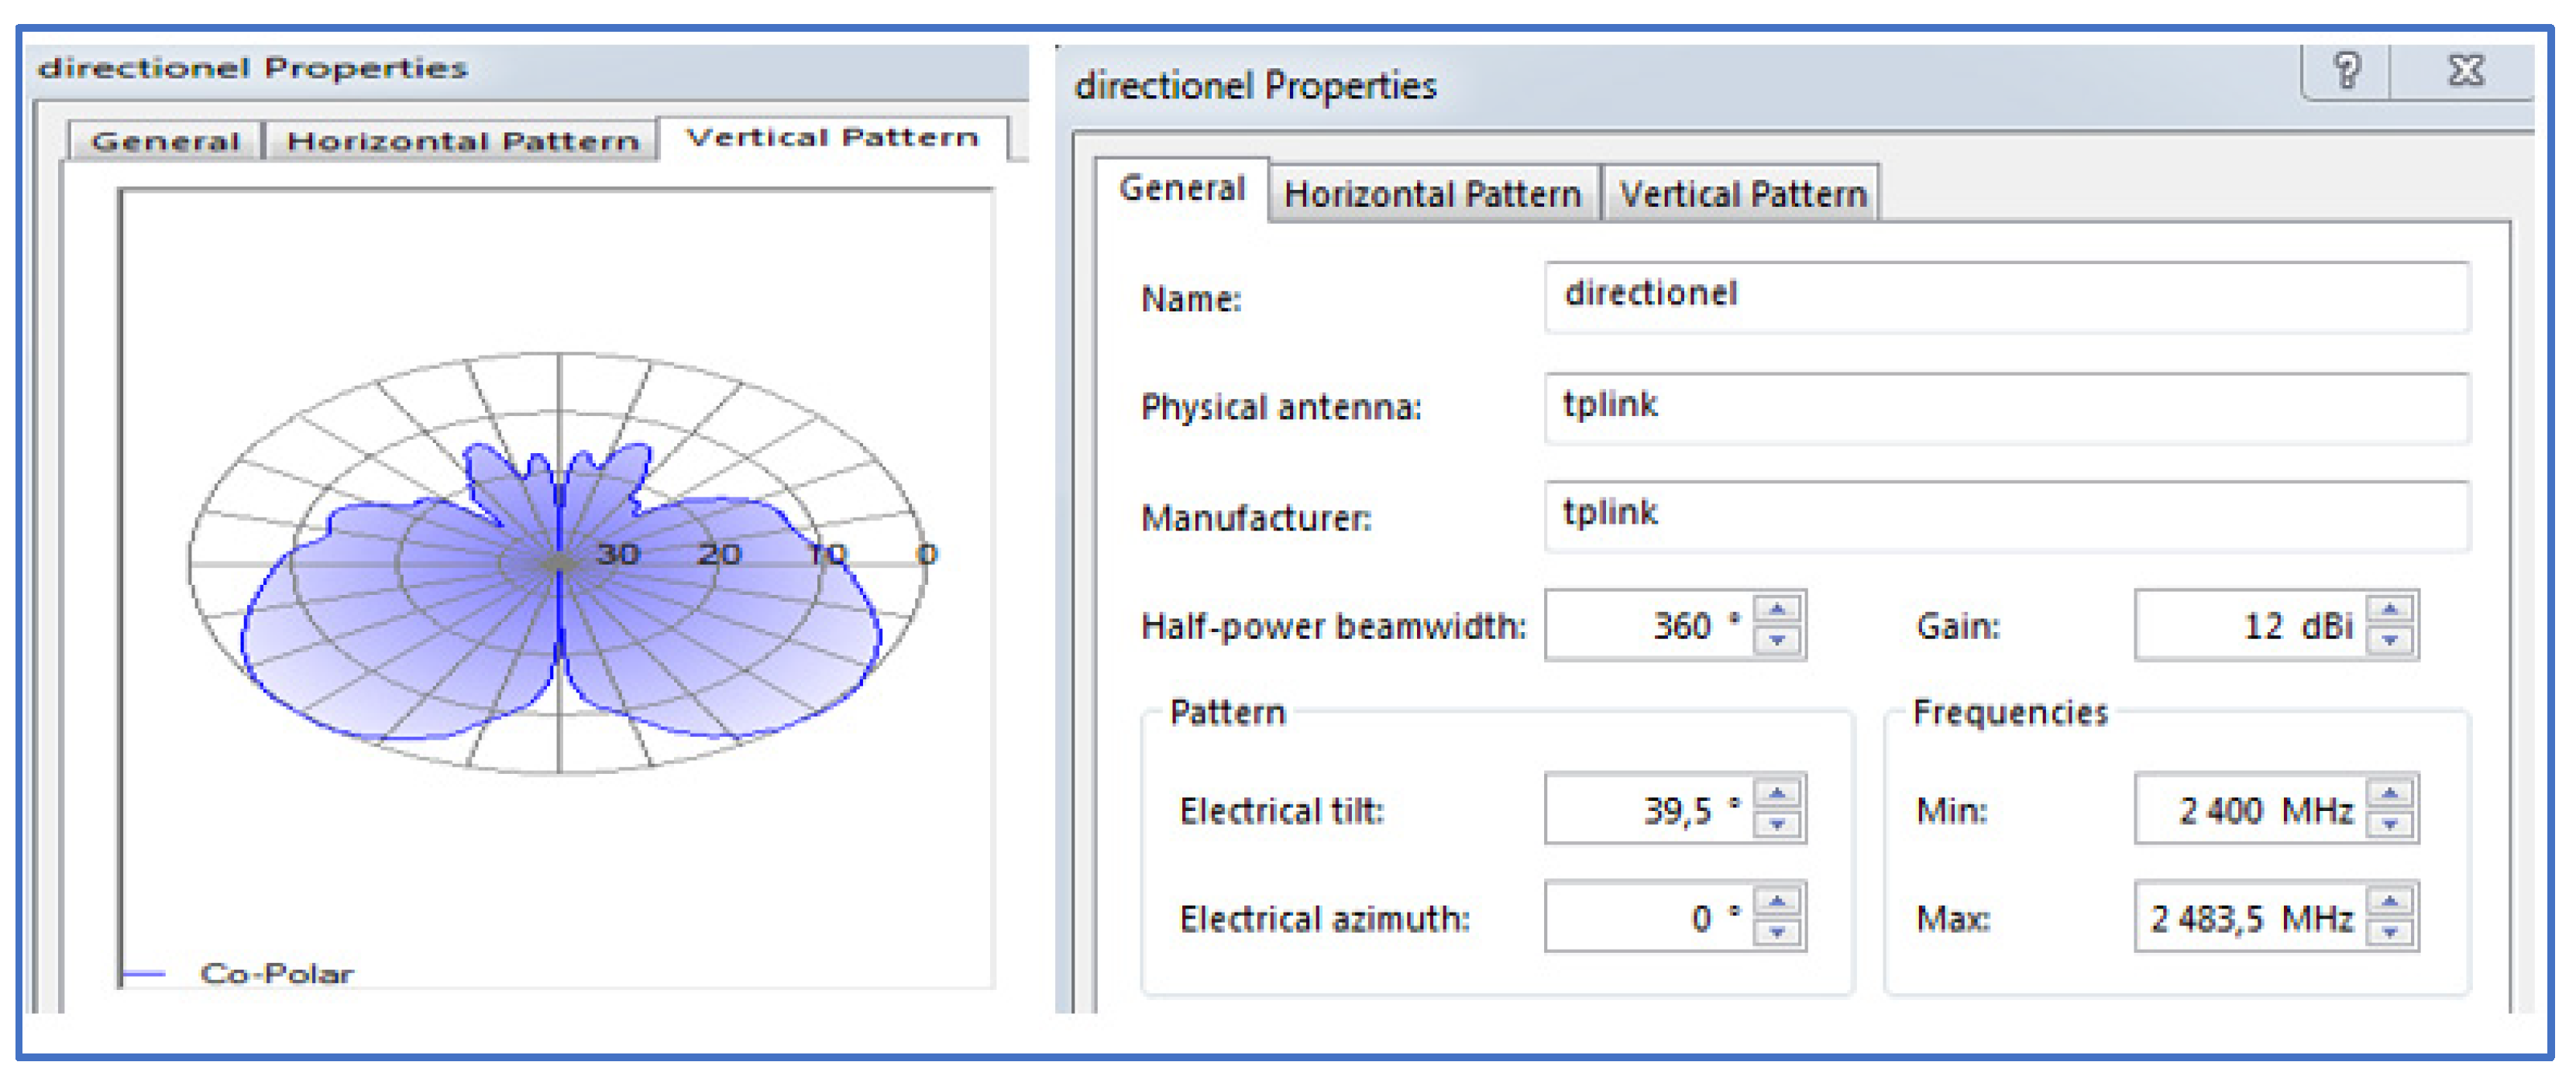
Creation of a new type of antenna by specifying its gain and radiation pattern.
Creation and configuration of sites or cells according to the GPS parameters of the client.
Interference adjustment with the Automatic Frequency Planning (AFP) module.
Optimization with the Automatic Cell Planning (ACP) module.
The ACP module is critical and allows the optimization of networks and automatically calculating the optimal parameters in terms of coverage and quality of the signal. ACP removes unnecessary sites or sectors or chooses from candidate sites that can be added to improve network performance. The ACP module can also adjust the power, tilt, and azimuth of antennas. The optimization process is based on a cost function. The cost decreases when the level of coverage and quality of the signal increase. The iterative algorithm is used for each iteration when one network parameter is changed. Scenarios obtained from the different changes are ranked based on the cost function. When using the ACP, we need to specify the objectives and enable only the parameters that we wish to change during the optimization.
3. Results and Discussion
Using the methodology described above, we will first provide results related to the ENST campus case study. Afterwards, we will estimate the potential GHG mitigation. This approach will be generalized to include any Wi-Fi community using solar energy to replace fossil sources.
3.1. Optimal Coverage
In order to evaluate the Wi-Fi network radio budget in the proposed site, an access point with a consumption of 12 W and high radiation power of 27 dBm was selected. The technical characteristics are shown in
Appendix A (
Table A1). Before the calculation, to find the optimal coverage, characteristics of the equipment were introduced in the simulator including access points, antennas, and cable losses.
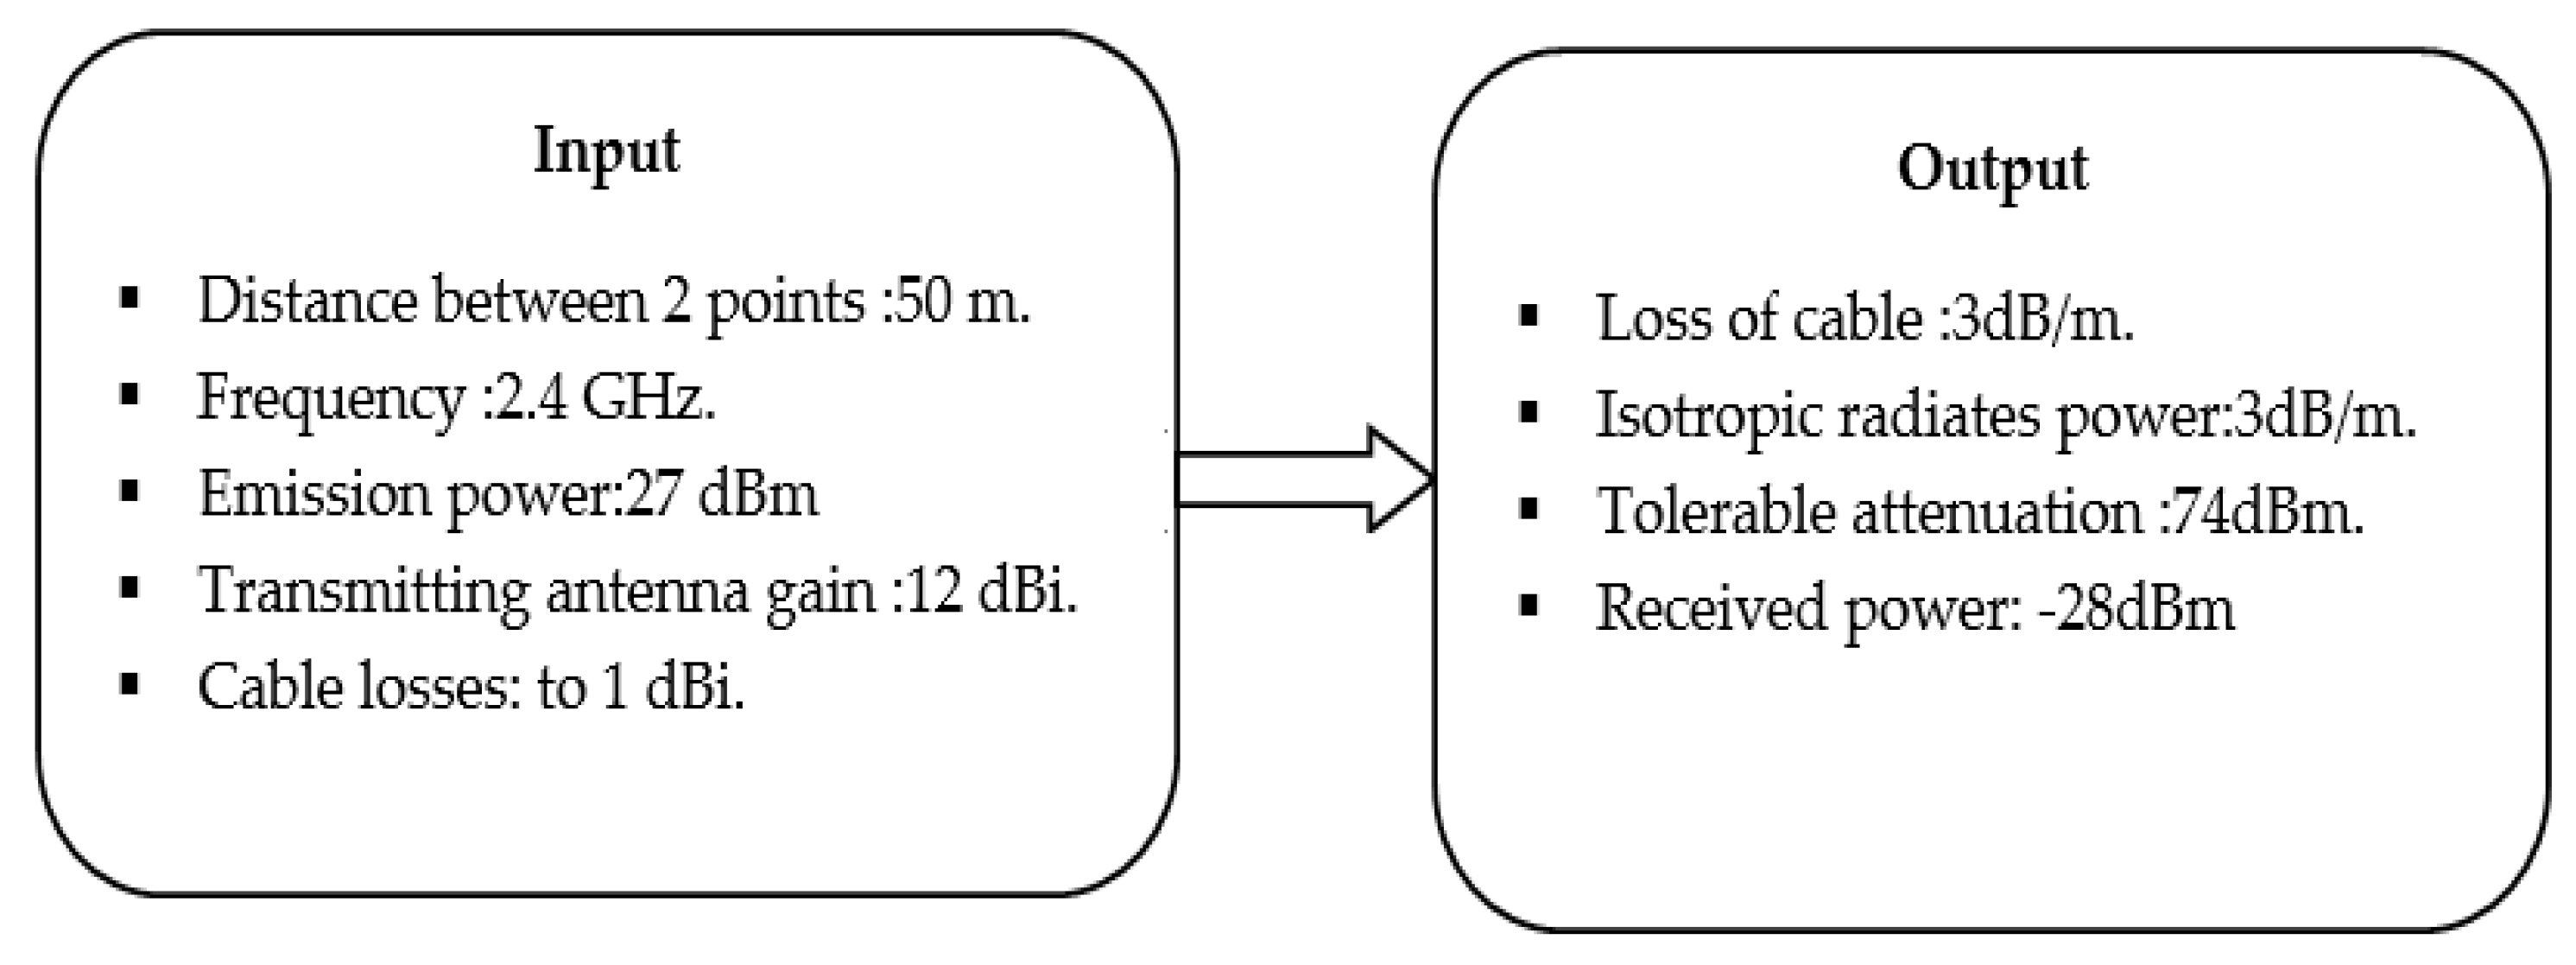
Figure 3 summarizes the input–output data using MATLAB code. If the receiver sensitivity is lower than the received power (−28 dBm), the connection is enabled.
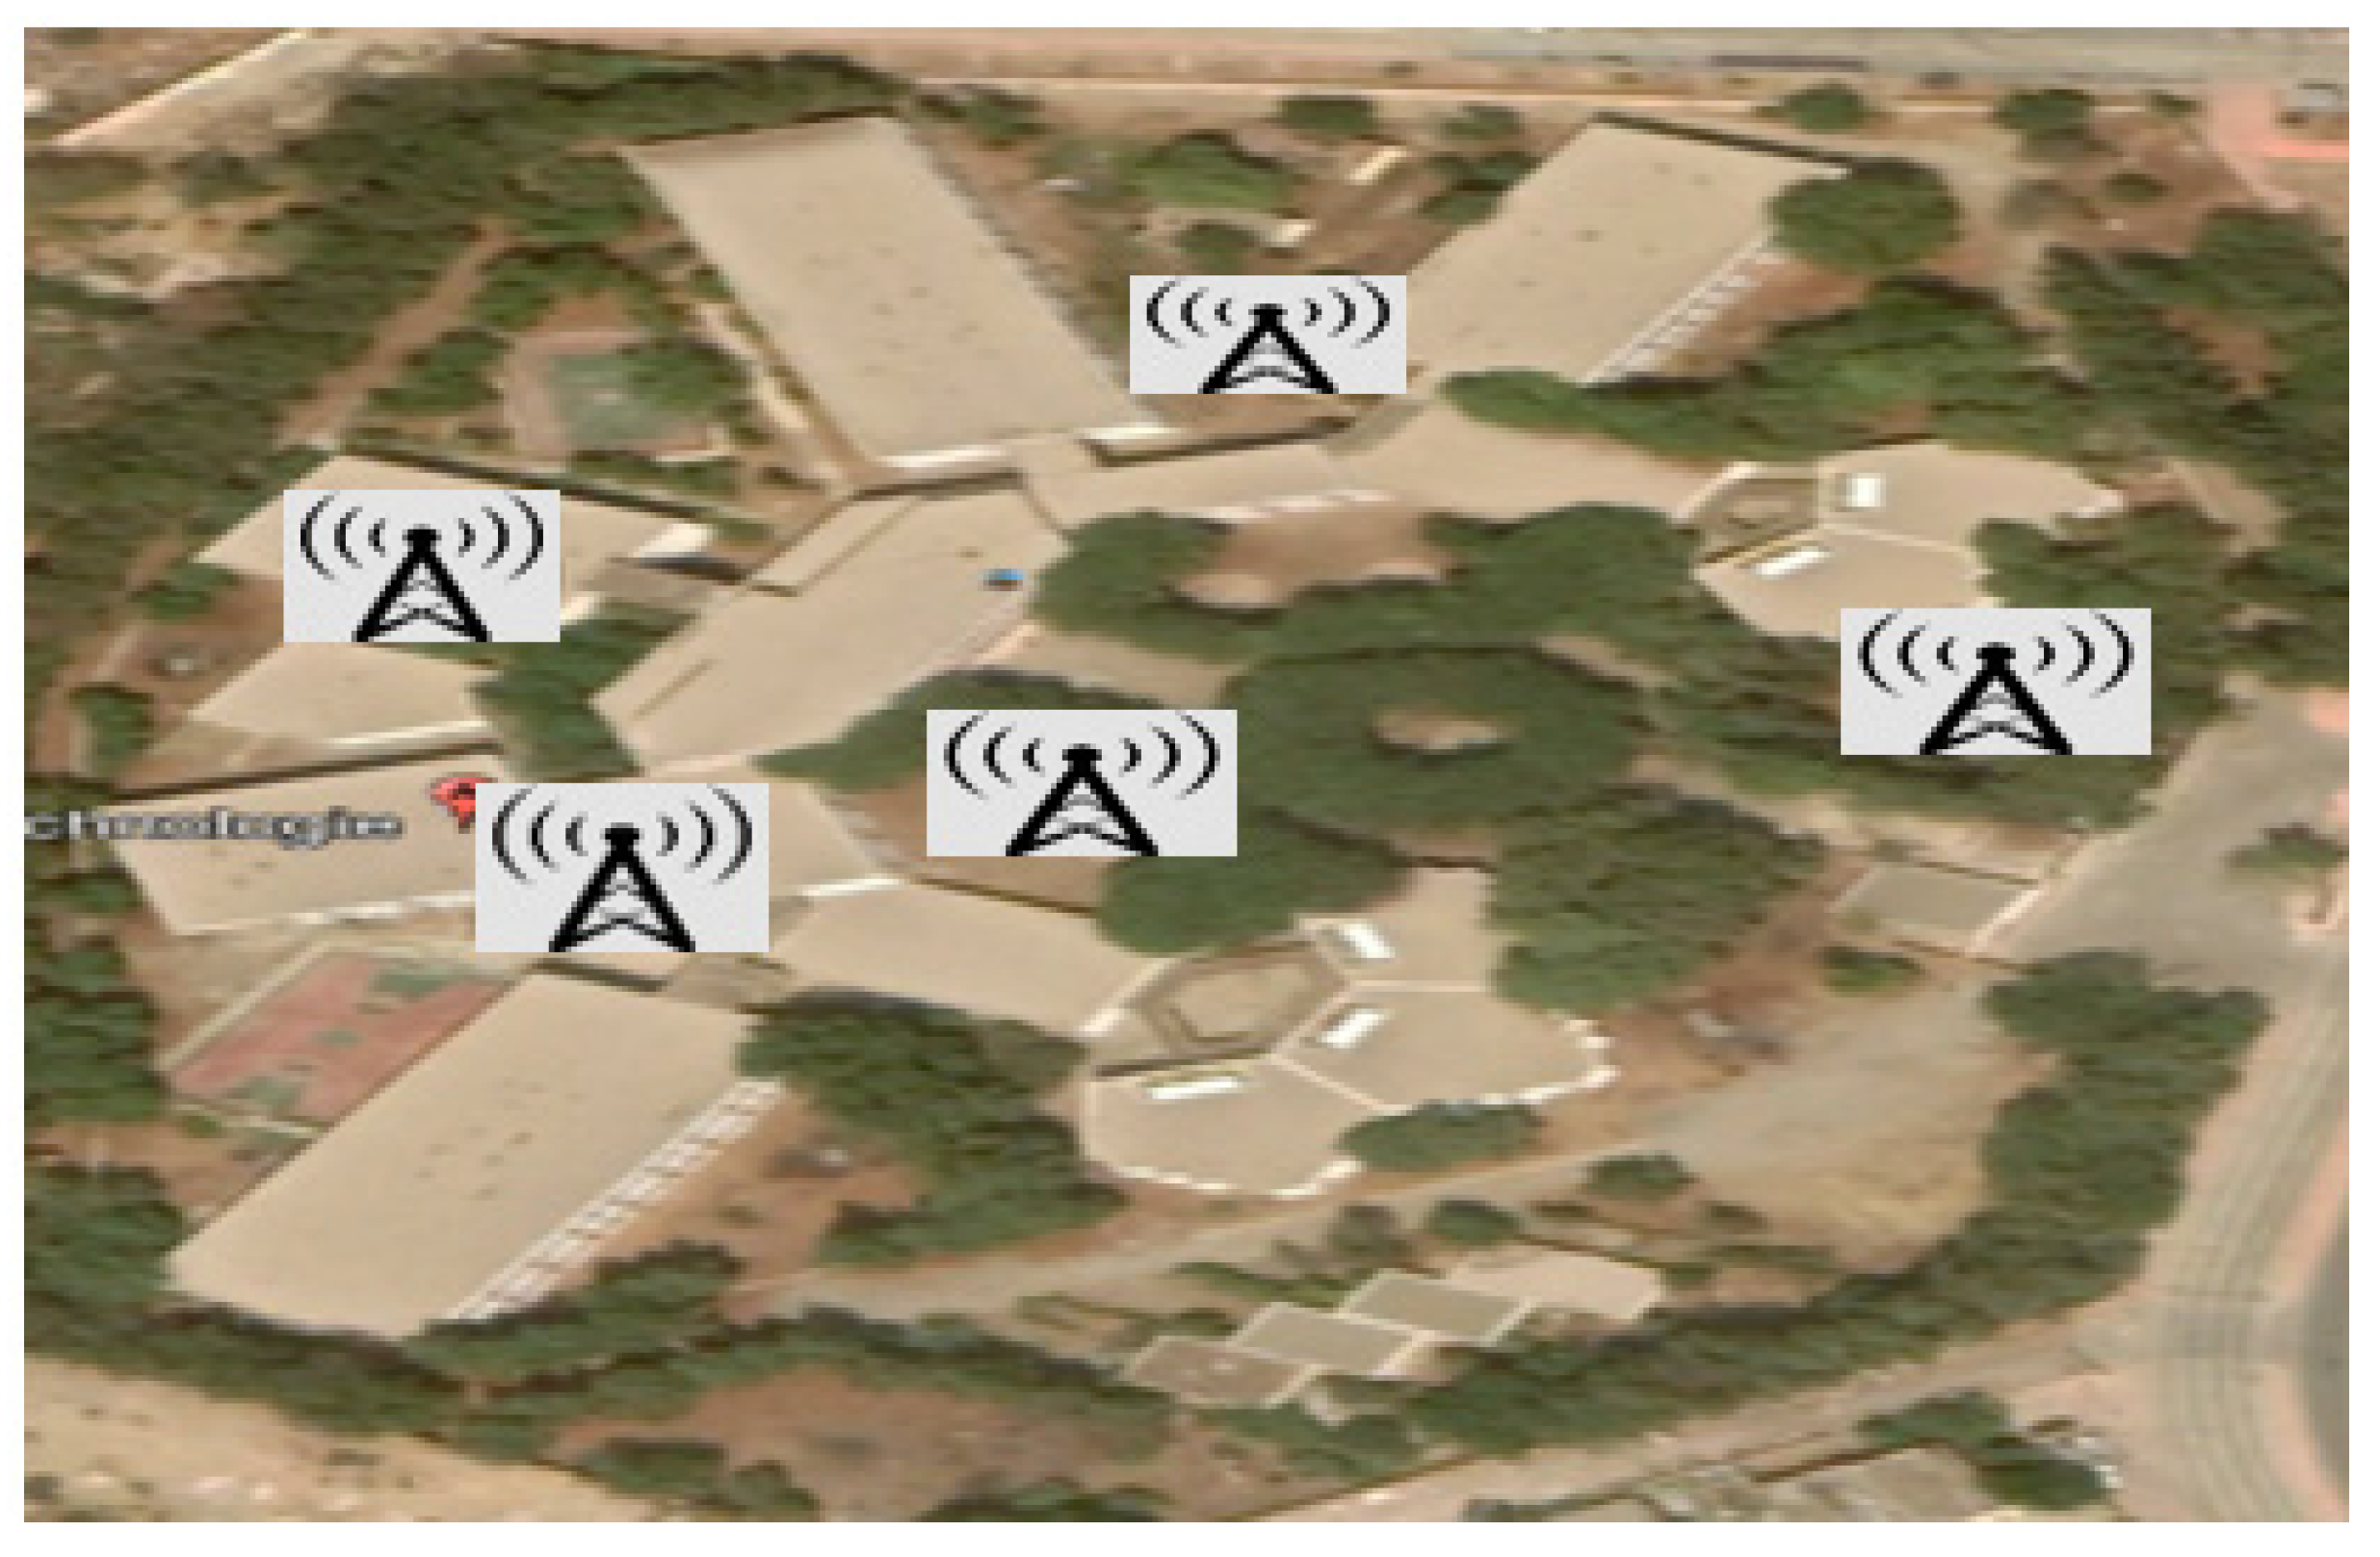
Using the MATLAB code, we estimated that at least five Wi-Fi access points to cover the whole campus are required. The impact of using lower and higher numbers of access points was also assessed.
Figure 4 provides the optimal site for the five Wi-Fi access points.
3.2. Optimal Capacity
First, we needed to calculate the bandwidth necessary to satisfy the demand for network resources in the ENST campus. We created another tool using MATLAB for this task.
Figure 5 summarizes the key inputs and outputs data for the calculation of the necessary bandwidth in the network.
As indicated in
Figure 4, based on input data and information, we estimated that a total bandwidth of 1198.8 Mbp/s for each Wi-Fi cell is required.
3.3. Optimal Network
The ENST campus was used to demonstrate the proposed framework. As the demand for internet signals is significant, the physical position of the Wi-Fi posts is critical. The geographical coordinates of the ENST campus are given in
Table 2.
As a first step, we needed to optimize the geographical positions where the Wi-Fi posts will be installed. For this, we imported a map of the ENST campus from Google Earth into the ATOLL platform. This will help identify access point locations. Signal pathway propagation, cost of renting, and availability of the sites where the equipment will be installed are critical criteria to choose access point sites. In our case, the radio sites were placed from the global positioning system (GPS) coordinates retrieved from the lighting optimization study of the solar streetlights at the ENST campus (
Figure A1 in
Appendix A).
Once the location of the access points and their positions on the geographical map were identified, the frequency distribution for each transmitter on the network and antenna type were selected. During the dimensioning of the previously treated Wi-Fi network, an access point with specific characteristics such as the Wi-Fi compatibility standard, the transmission power, and the working frequency were selected. Afterwards, these parameters were introduced in the simulator code (
Figure A2 in
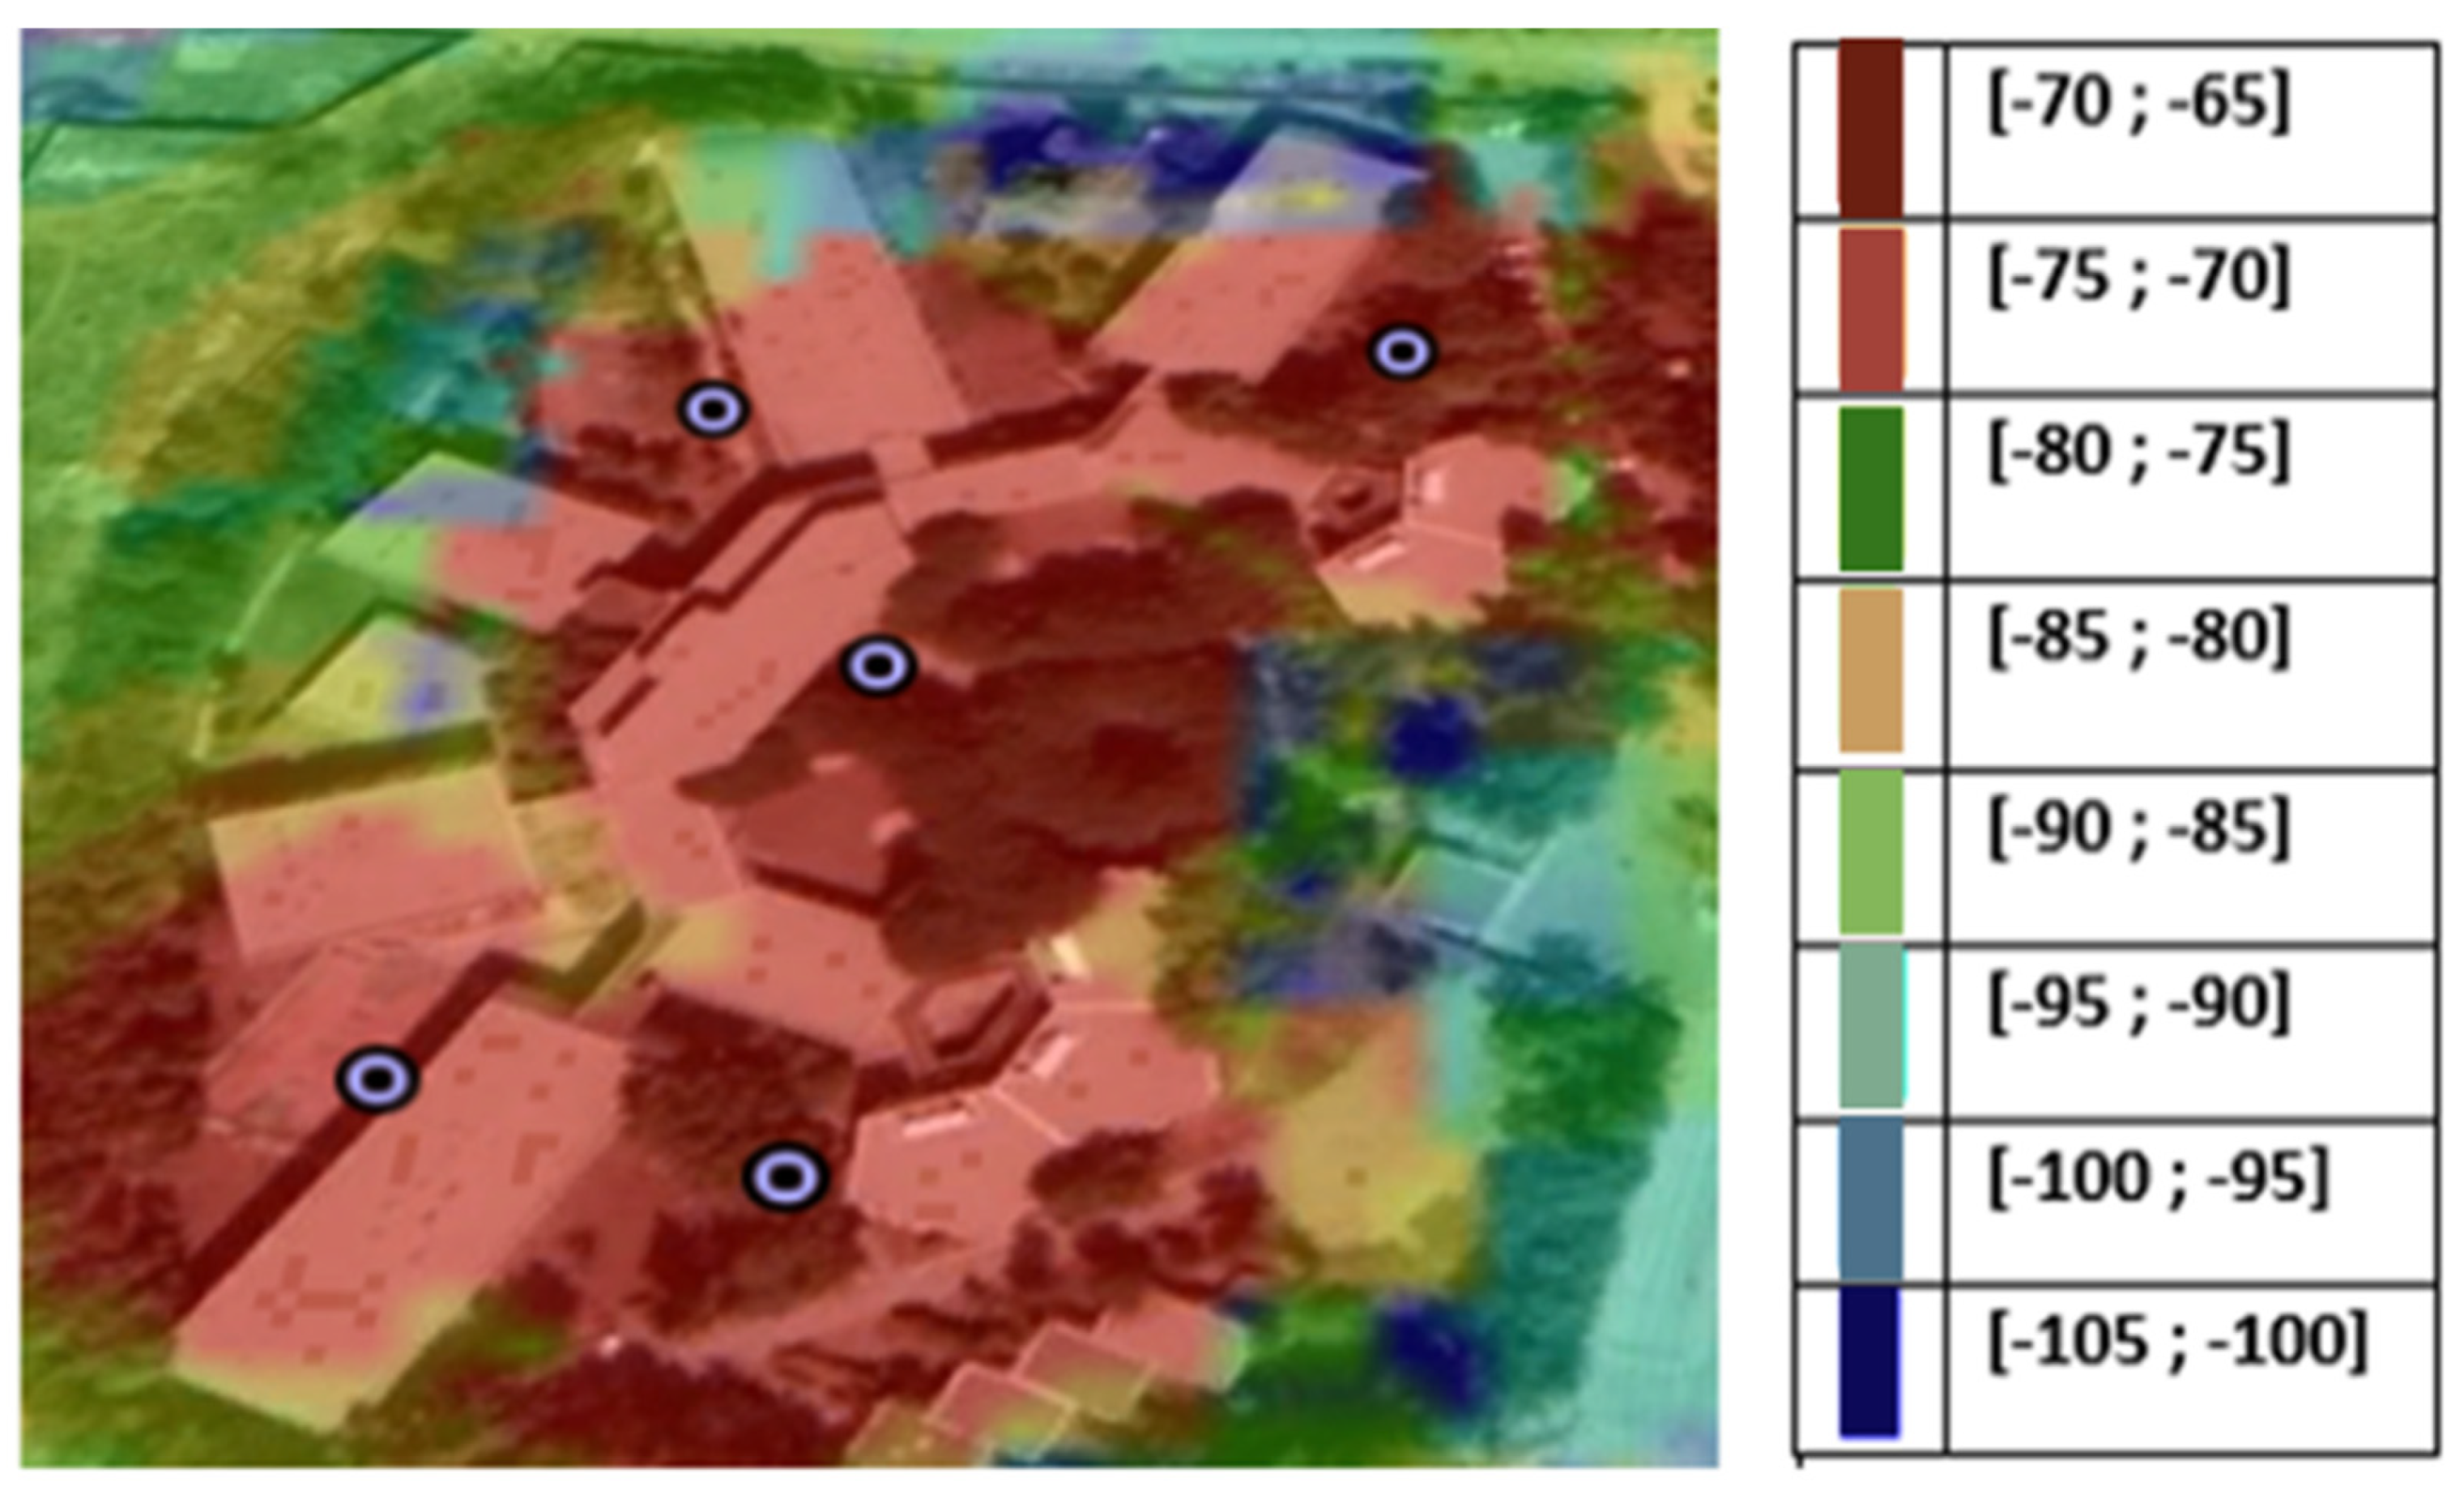
Appendix A). This will help estimate power received by a subscriber at each point. The predicted signal coverage for the ENST campus is shown in
Figure 6. This helps assess whether the chosen locations of the access point are suitable.
To assess Wi-Fi coverage, we identified five classes of signal level quality:
Very good coverage corresponds to a signal level higher than −70 dBm.
Good coverage: corresponds to the signal values between −75 dBm and −80 dBm.
Low coverage: corresponds to signal values between −80 dBm and −85 dBm.
Poor coverage: corresponds to signal values between −85 dBm and −90 dBm.
Very poor coverage corresponds to a signal level below −90 dBm.
It can be noticed that the coverage is almost complete in the selected area and that the signal level varies between −90 dBm and −70 dBm. However, there are areas where the signal level is low, so there is a degradation in the coverage in these areas. This is due to the fact that the ground presents several obstacles in the direction of these locations, as is the case for some areas where the signal level is −105 dBm.
To minimize interference due to the use of adjacent channels and the use of the same channel, the AFP module from ATOLL was used. The AFP module was used to automatically calculate the total cost, which is the interference rate in the implanted network.
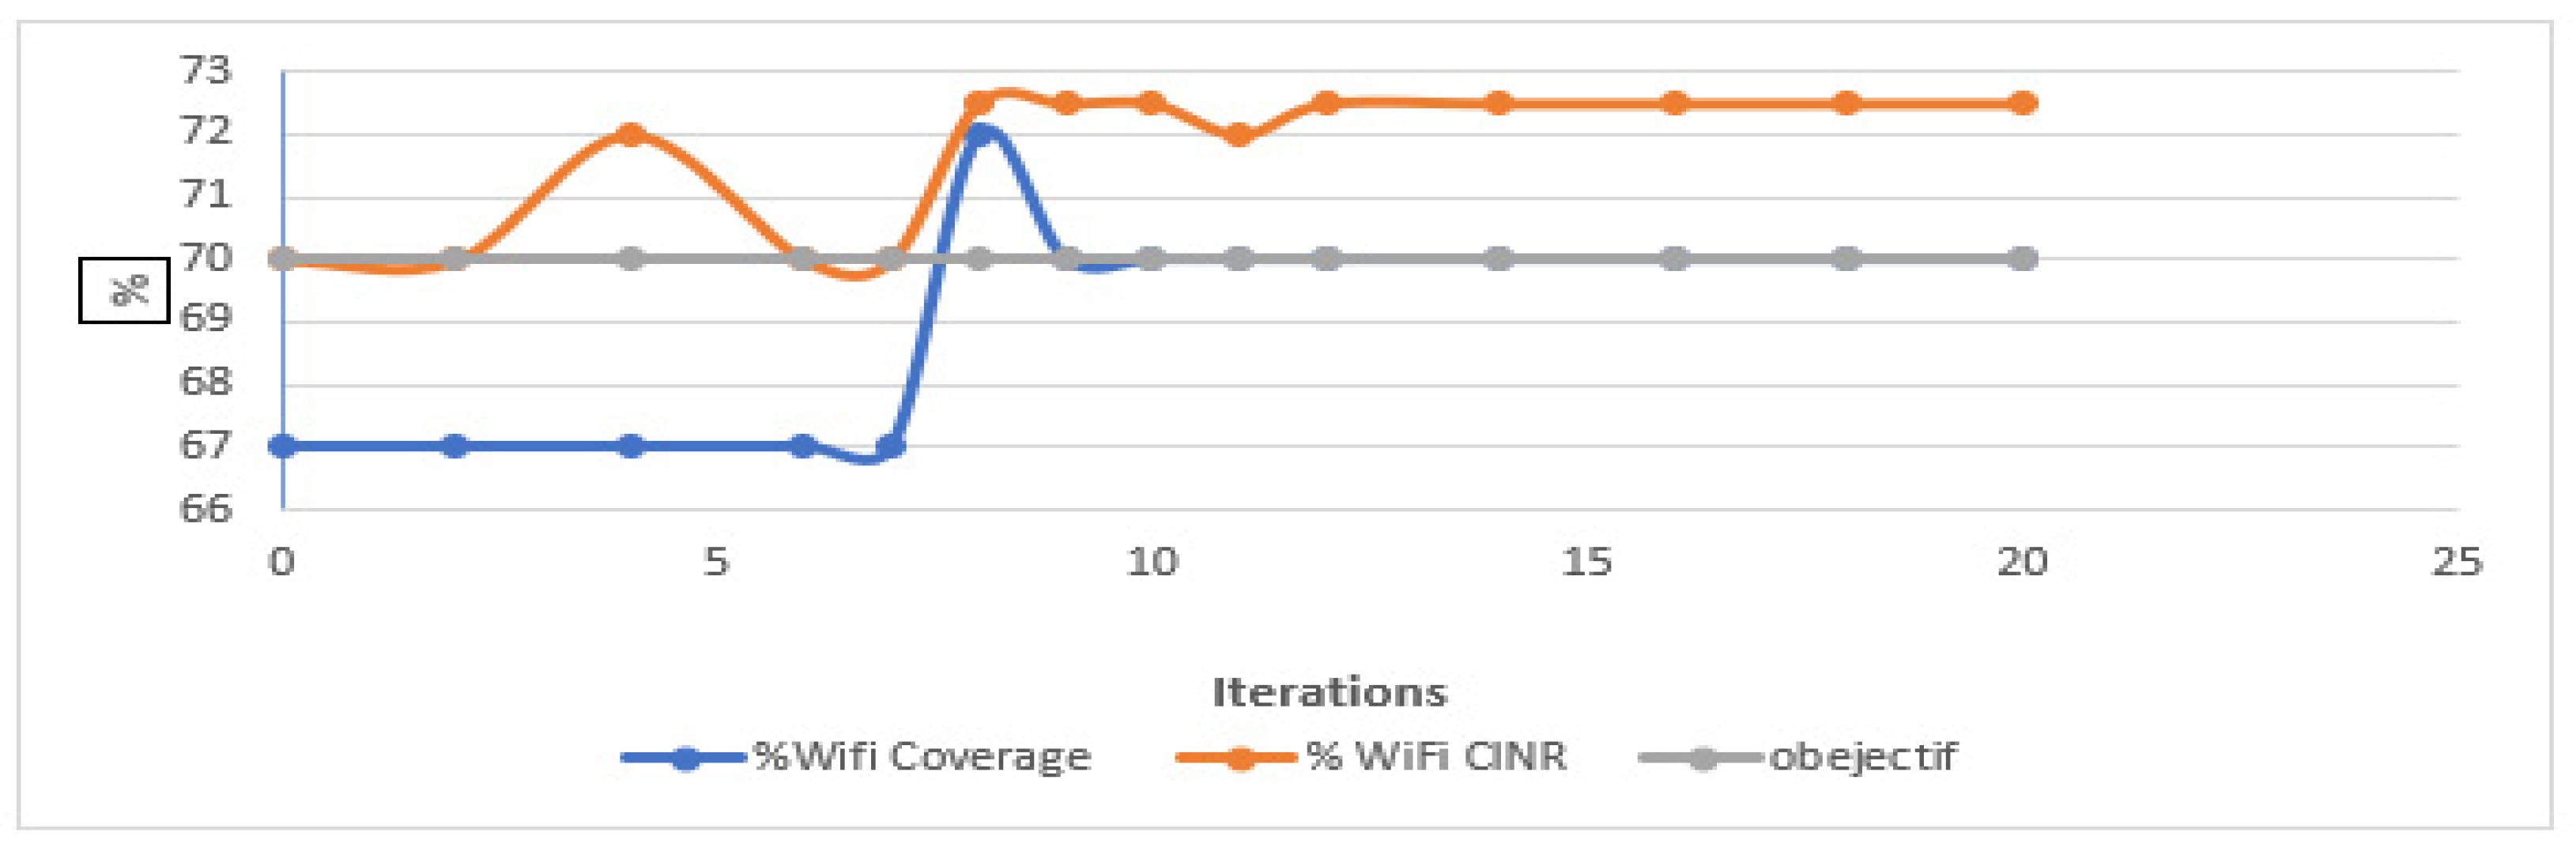
The optimization was performed using the ACP module, which allows the design of networks and automatically calculates the optimal parameters in terms of coverage and quality of the signal. In
Table 3, we can see the proposed increases in signal quality and coverage.
From
Table 3, we notice that there are four modifications: a modification in the transmission power level, a modification of the azimuth level, and the deactivation of the two sites to increase the quality of coverage. After defining the optimization and execution objectives of the ACP module, the following results were obtained (
Figure 7).
Depending on the exact location of Wi-Fi users within the campus, they could connect to different access points providing different levels of signal quality. The transmitter to which the subscriber can connect is classified in descending order according to the quality of the signal that they could obtain.
3.4. Scenario Analysis
ATOLL software suggested that a minimum of five BSs are needed to provide good service coverage throughout the campus. However, we wanted to assess from the point of view of energy consumption how the number of BS will affect energy consumption. This parameter is not considered by the Wi-Fi network software optimizer.
In order to minimize energy consumption and thus GHG emissions, we developed different scenarios in which we changed the number of access points. This will help link the quality of coverage with energy consumption within the Wi-Fi network. Clearly, reducing the number of access points will reduce energy demand.
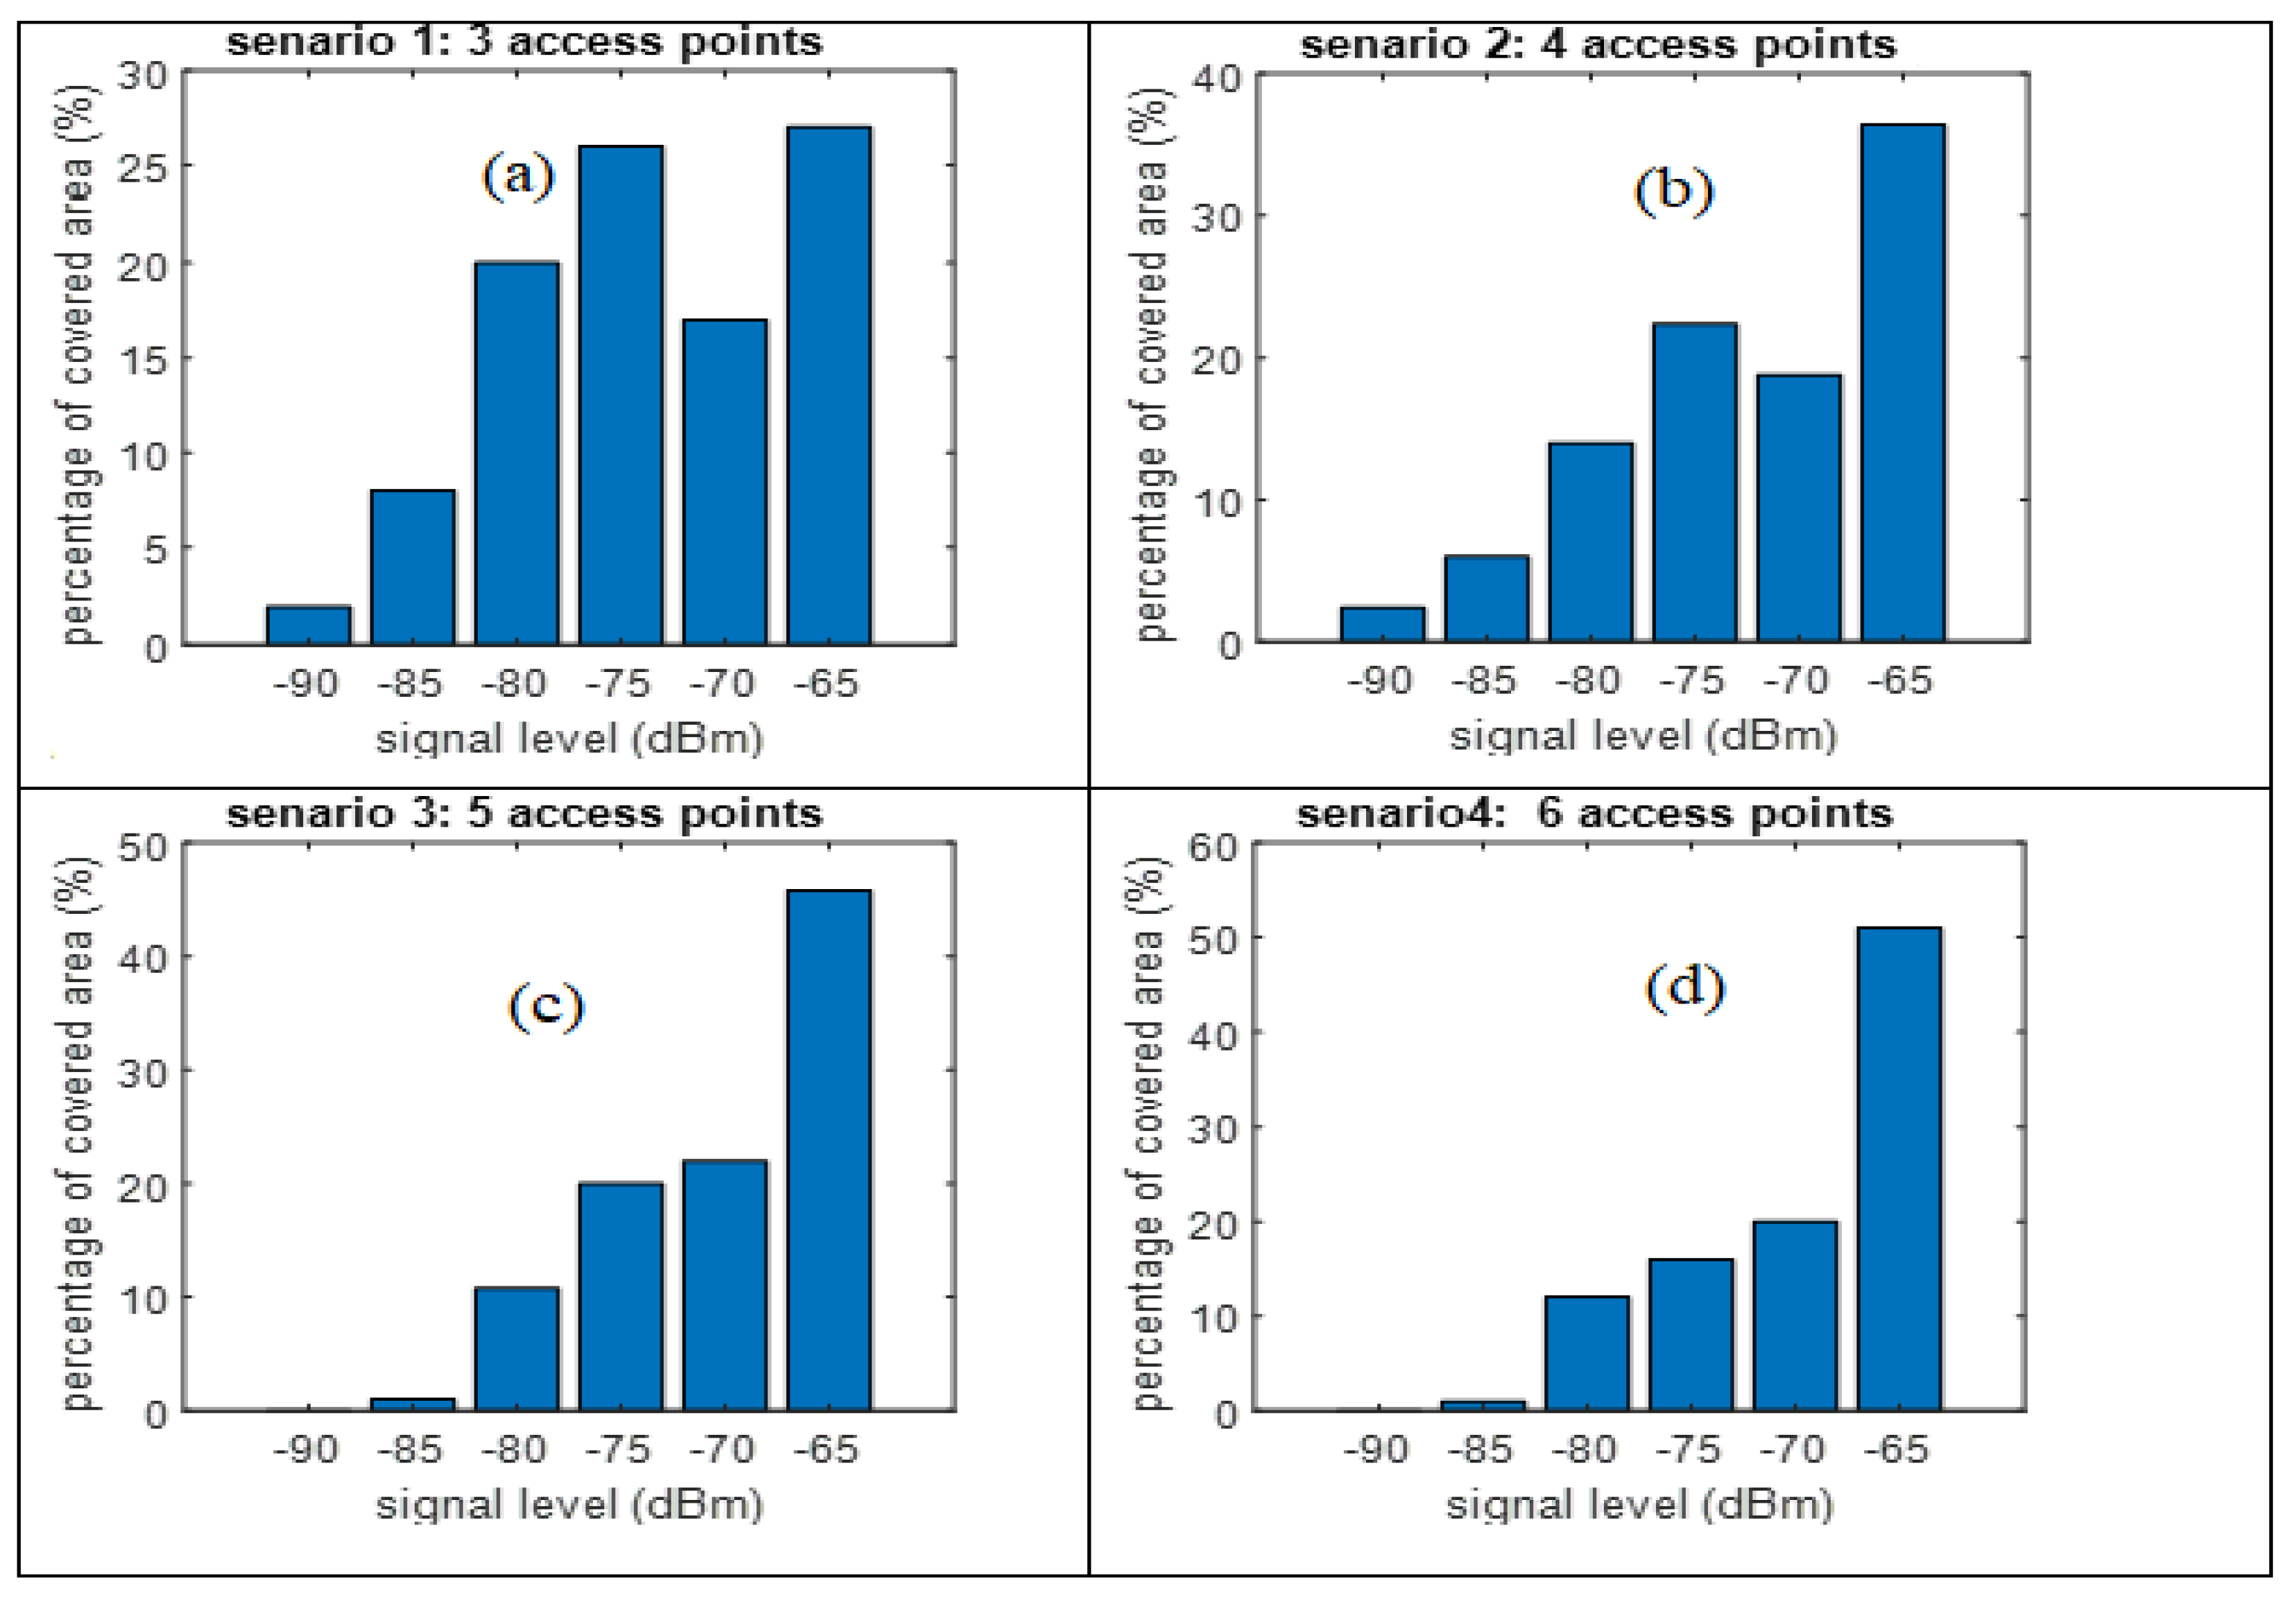
Figure 8 summarizes the percentage of the total campus area covered with different signal levels for different numbers of access points.
To estimate the quantity of CO
2 produced, we have used the following formula:
where
amount of CO2 (g);
: power consumption at each access point (kW);
: electricity intensity (g/kWh);
: duration of AP utilization (h).
Below, CO2 emissions during the use phase are estimated for each scenario.
3.4.1. Scenario 1 (3 Access Points)
With three access points, we were able to cover 27% of the campus with a signal level higher than −70 dBm, and 43% of the surface is covered by a signal level between −80 dBm and −70 dBm (
Figure A3 in
Appendix A).
These three access points consume 360 Wh. Based on an operating duration of 10 h, the energy consumption of electricity produced from fossil energy (natural gas) produces 150 g of CO2. So, if we replace the source of electricity with solar energy, we can reduce the amount of CO2 to 19.8 g.
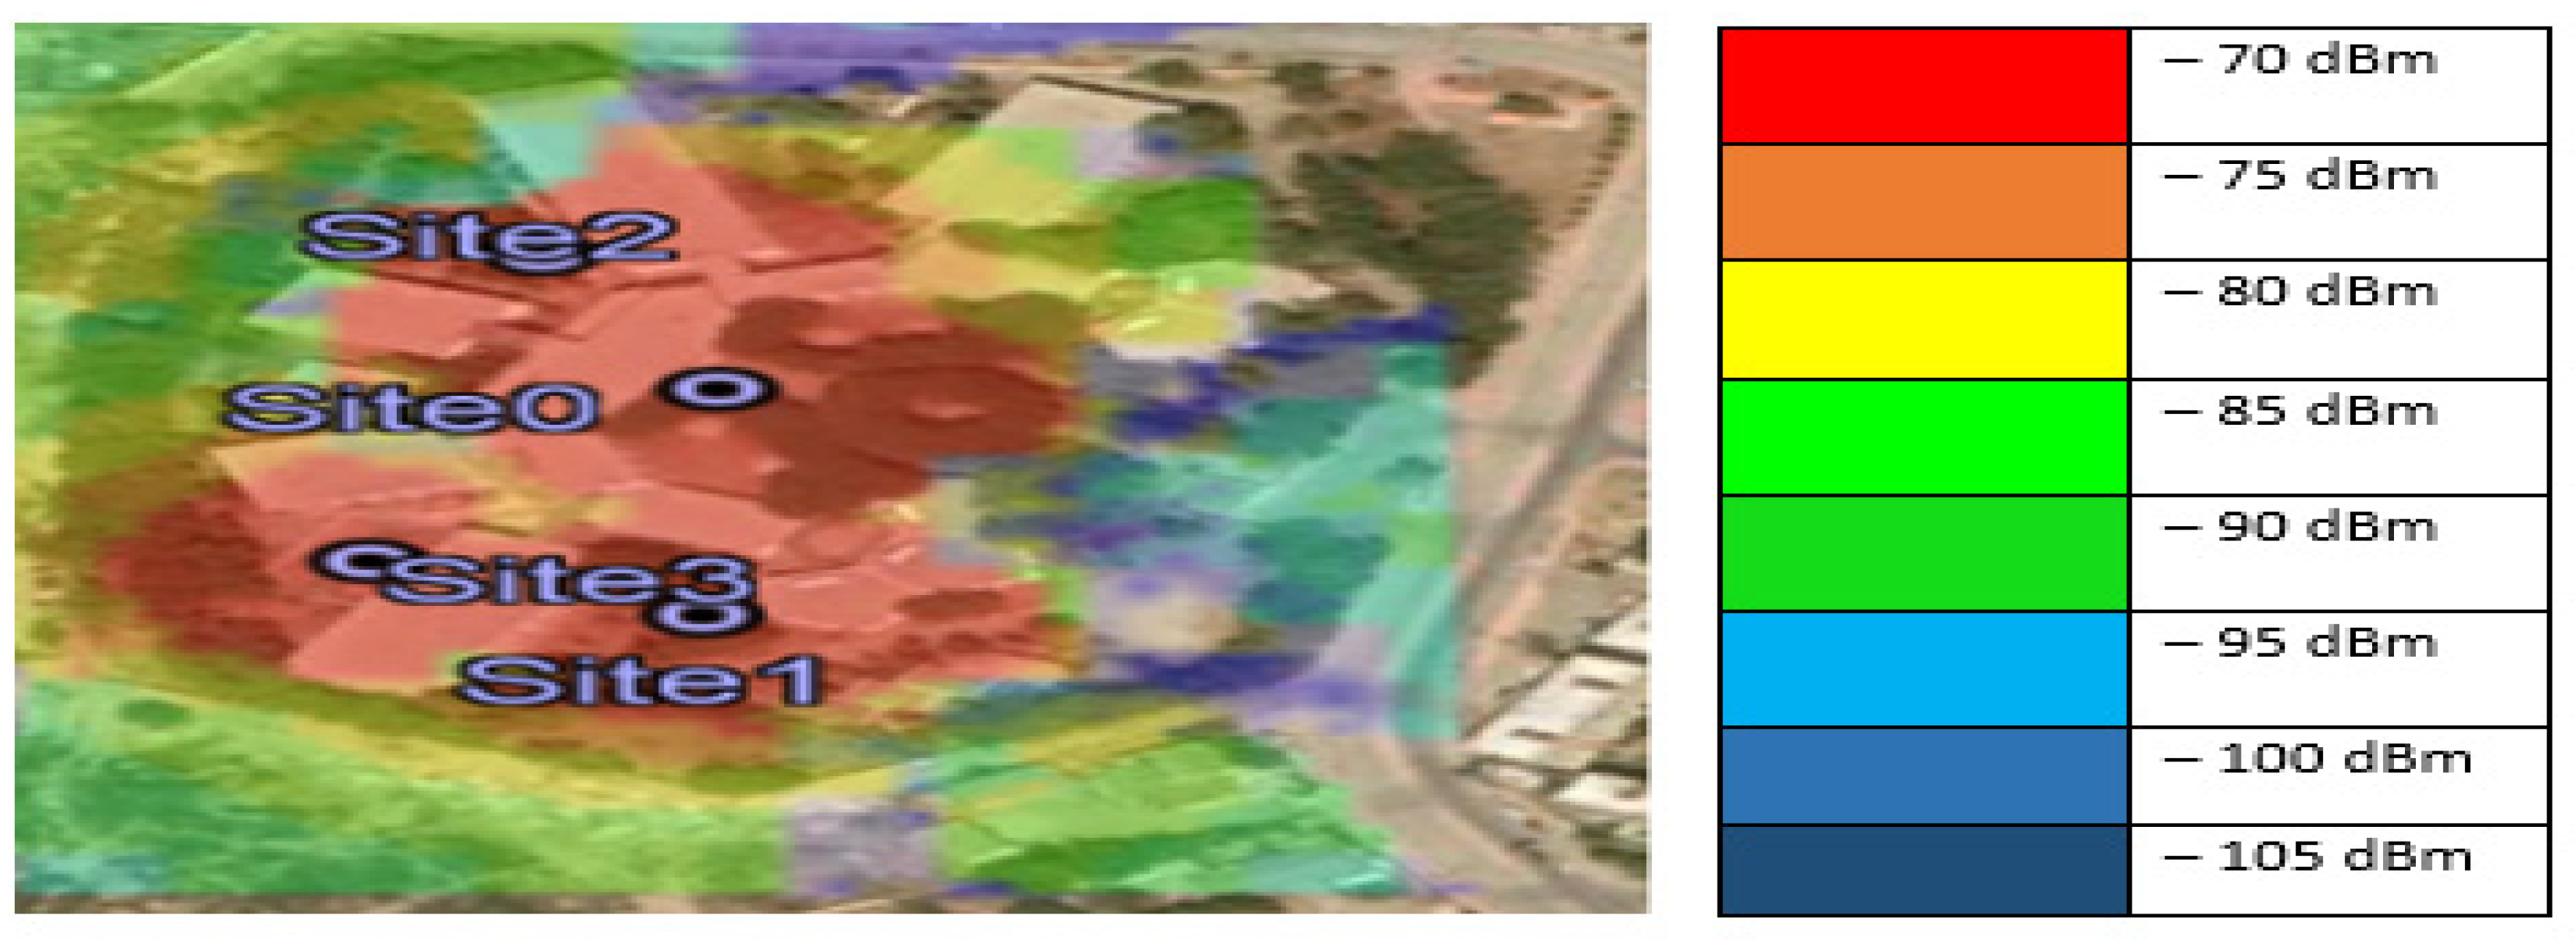
3.4.2. Scenario 2 (4 Access Points)
In the second scenario, we propose to cover the campus with four base stations. We obtained the results shown in
Figure 9, where 36.4% of the campus surface is covered by an excellent level of field greater than −70 dBm, and 45% of the surface is covered by a signal level between −80 dBm and −70 dBm (
Figure A4 in
Appendix A). Four access points are active at a duration of 10 h per day and consume an amount of electricity of 480 Wh. This energy consumption produces 200.64 g of CO
2 if the source of production of the electricity is based on natural gas and 26.4 g of CO
2 if the source of electricity production is solar.
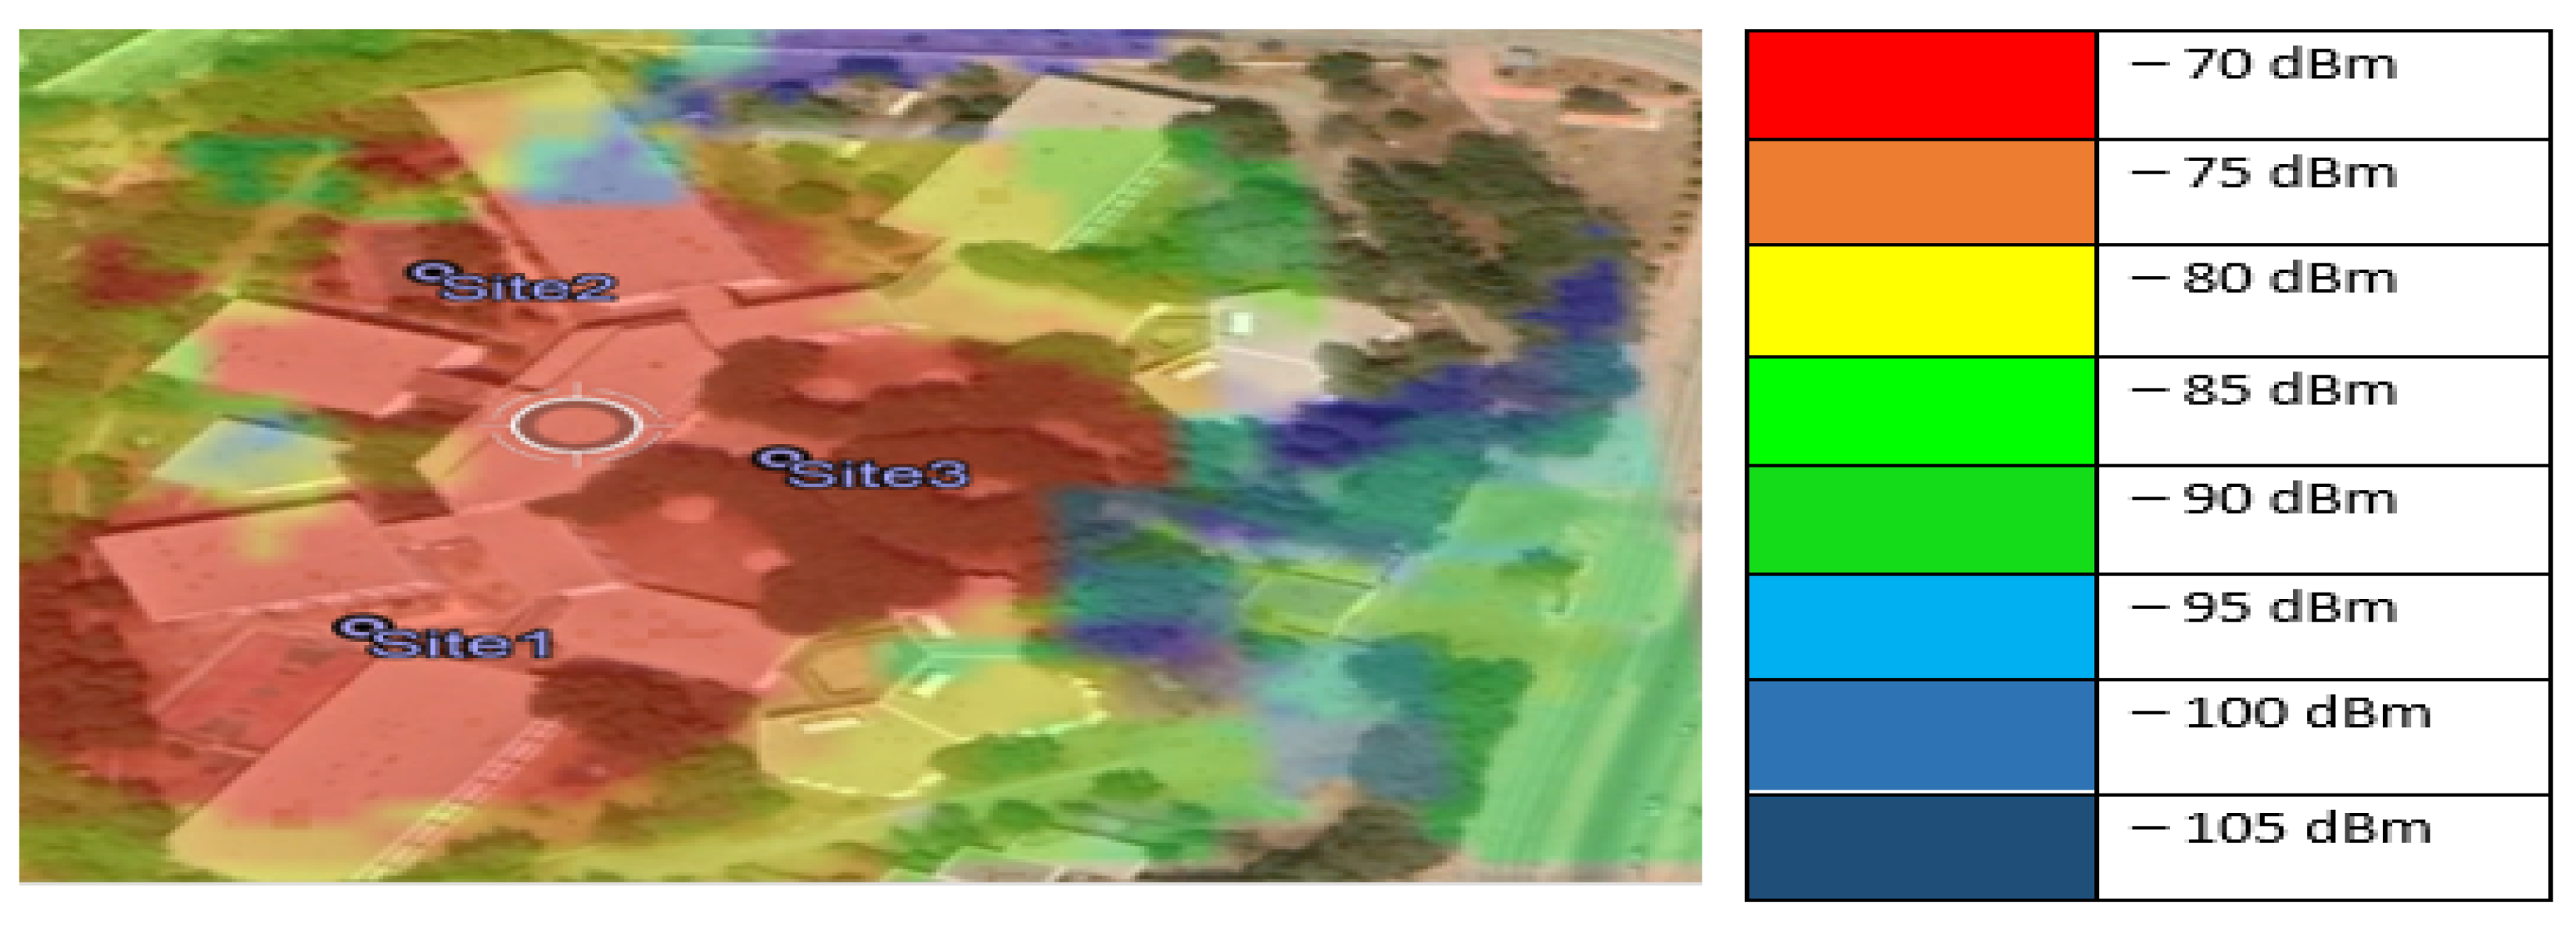
3.4.3. Scenario 3 (5 Access Points)
In this scenario, we managed to cover 47% of the total surface with a field level higher than −70 dBm and 39.6% of the surface with a level of signals between −80 dBm and −70 dBm (
Figure 8c).
The energy consumed by the five access points is equal to 600 Wh during an operating period of 10 per day. The amount of CO
2 resulting from the production of electricity based on natural gas is 250.8 g and 33 g if the electricity is produced from solar energy (
Figure A4).
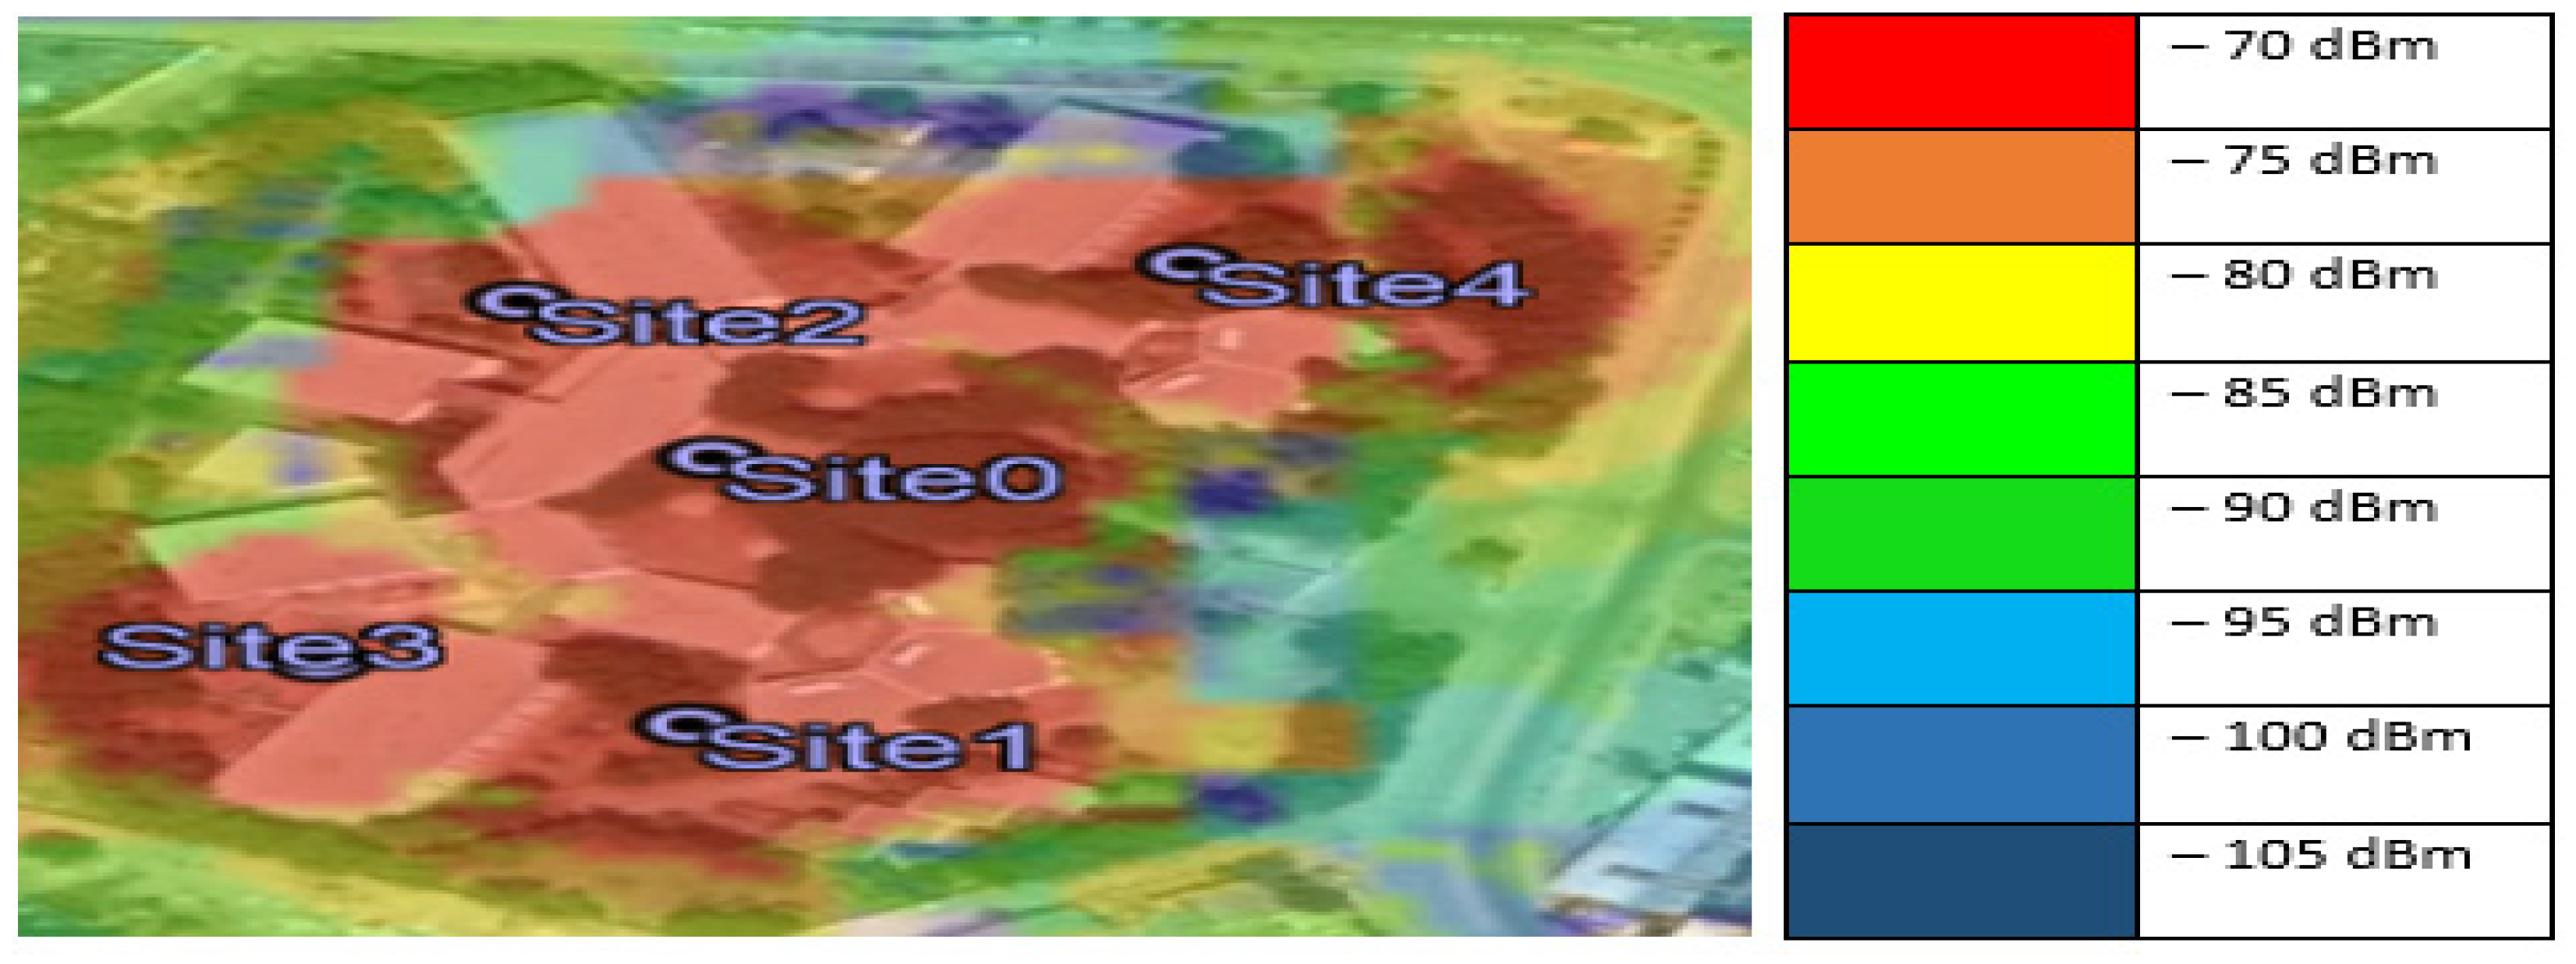
3.4.4. Scenario 4 (6 Access Points)
In this scenario, we obtained the following coverage results (
Figure 8d):
These access points are active for a period of 10 h per day and consume 720 wh. As a result, 418 g of CO
2 in the case where electricity is produced from natural gas and 39.6 g of CO
2 in the case where electricity is produced from solar energy.
Table 4 summarizes the results obtained for the four scenarios.
3.5. GHG Mitigation of Solar-Powered Wi-Fi Deployment at ENST
In this section, we estimate the quantity of CO2 emissions resulting from the energy consumption by the Wi-Fi network. We will use CO2 when actually we refer to CO2-eq, representing the total GHG emission. We will compare the resulting carbon footprint with the quantity of CO2 resulting if we replace the energy supply of this network with a renewable energy source. In the proposed case study, the source of energy is solar electricity. The process of evaluating the total impact is provided below. To estimate the amount of CO2 we followed the following four steps:
Step 1: Identify the source of electricity for the Wi-Fi network supply.
Step 2: Estimate the amount of CO2 resulting from the consumption of electricity produced from a fossil fuel source.
Step 3: Estimate the quantity of CO2 reduction if the energy source is replaced by a renewable source to supply this network.
Step 4: Scale up and generalization
We start by identifying the energy source (the source of electricity production), since the resulting quantity of CO
2 varies from one source to another. In 2015, 98.36% of the electricity produced in Algeria was from natural gas. The carbon intensity of natural gas (NG) based electricity was 418 g of CO
2 per kWh [
22]. In our case, we will consider the scenario with five access points, which works for a duration of 10 h. The five access points consume 600 Wh, so the resulting quantity of CO
2 is 250 g per day and 915.42 kg per year when using NG electricity.
The next step is to estimate the amount of CO
2 if the energy source is replaced by a renewable source to supply this network. Algeria is endowed with one of the highest solar radiations in the world, with more than 2500 h of sunshine on average per year over a very large part of its territory. The energy received daily on a horizontal surface of 1 m
2 is around 5 kWh, which corresponds to 1700 kWh/m
2/year in the north and 2263 kWh/m
2/year in the south of the country [
23]. If we replace the NG electricity supply for the Wi-Fi network with solar energy, CO
2 emissions will be reduced by 217 g per day and 795 kg per year.
3.6. Forecasting the GHG Mitigation Resulting from Wider Solar-Powered Wi-Fi Deployment
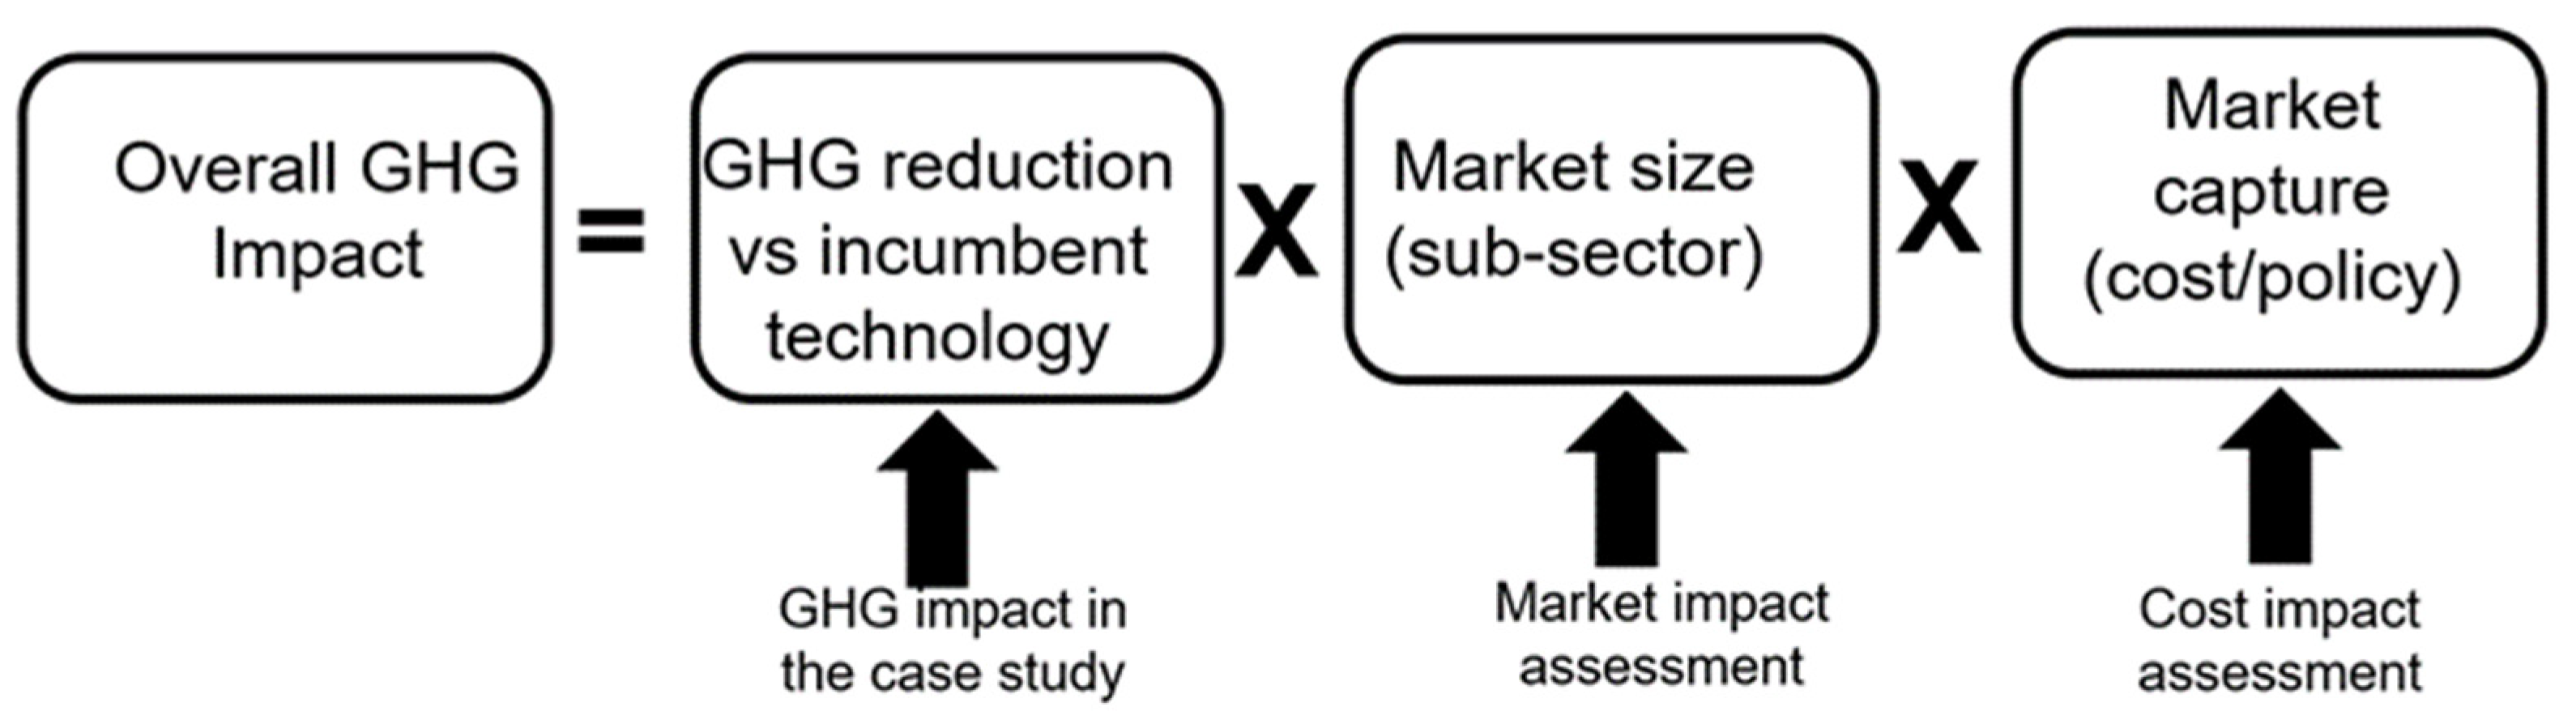
Using the results of this case study, we assessed the impact of wider deployment. We developed a simple forecasting methodology for the potential GHG mitigation if solar-powered Wi-Fi is deployed at the state level. As an example, we will estimate the potential of GHG emission if solar-powered Wi-Fi is deployed throughout all university campuses in the state. For this, we need to quantify three key parameters:
Amount of GHG reduction of new technology vs. incumbent technology. In this case, solar energy is used instead of fossil energy to generate the required electricity to power the Wi-Fi network. This estimation should be performed per access point.
Estimation of the overall market size. This could be represented by the number of access points to cover all university campuses.
The potential market capture of the new technology vs. incumbent technology. Deployment cost is the main factor. Other factors (e.g., complexity of the technology deployment) may also affect this parameter.
The overall methodology to assess potential GHG mitigation when introducing a new technology is provided in
Figure 9.
The first parameter is the focus of this manuscript and has been estimated in the previous paragraph. The second parameter could be obtained using the following equation:
where A is the number of access points in the current case study, S
Country is the total number of students in the country, and S
ENST is the number of students in the current case study.
Finally, market capture is probably the most difficult parameter to estimate. In the absence of a detailed quantification, we will assume an arbitrary number for this parameter. Assuming a market capture of 50%, the overall GHG mitigation through solar-powered Wi-Fi in academic campuses is about 1089 kg per day and 397,485 kg per year. Even if it is relatively small when compared to the total GHG emission in the ICT sector 720 Mt [
24] or in Algeria (170 Mt in 2019) [
25], wider deployment of Wi-Fi in other communities could provide additional opportunities for further GHG reductions. With increasing digitalization in multiple sectors and the wider use of video streaming, we are expecting the potential GHG reduction due to solar Wi-Fi deployment to significantly increase.
Several factors could affect this forecast. We did not account for hourly and seasonal variations of solar irradiation and load. Another critical factor is related to the potential benefit of using excess solar electricity production to address demand within and outside the campus. Indeed, in countries such as Algeria, the grid is under stress, with significant demand for electricity during hot summer days.


