Article

Hardware-in-the-Loop Assessment of a Data-Driven State of Charge Estimation Method for Lithium-Ion Batteries in Hybrid Vehicles

Department of Mechanical and Aerospace Engineering, Politecnico di Torino, 10129 Torino, Italy
*
Author to whom correspondence should be addressed.
Electronics 2021, 10(22), 2828; https://doi.org/10.3390/electronics10222828
Submission received: 23 October 2021 / Revised: 9 November 2021 / Accepted: 11 November 2021 / Published: 18 November 2021
(This article belongs to the Special Issue Novel Battery Management Systems Using AI in Automotive Applications)

Abstract

:
This paper presents the design and hardware-in-the-loop (HIL) experimental validation of a data-driven estimation method for the state of charge (SOC) in the lithium-ion batteries used in hybrid electric vehicles (HEVs). The considered system features a 1.25 kWh 48 V lithium-ion battery that is numerically modeled via an RC equivalent circuit model that can also consider the environmental temperature influence. The proposed estimation technique relies on nonlinear autoregressive with exogenous input (NARX) artificial neural networks (ANNs) that are properly trained with multiple datasets. Those datasets include modeled current and voltage data, both for charge-sustaining and charge-depleting working conditions. The investigated method is then experimentally validated using a Raspberry Pi 4B card-sized board, on which the estimation algorithm is actually deployed, and real-time hardware, on which the battery model is developed, namely a Speedgoat baseline platform. These hardware platforms are used in a hardware-in-the-loop architecture via the UPD communication protocol, allowing the system to be validated in a proper testing environment. The resulting estimation algorithm can estimate the battery SOC in real-time, with 2% accuracy during real-time hardware testing.

1. Introduction

In response to current growing worries about global warming and the increasing scarcity of natural resources, the need for more efficient cars is, thus, strictly linked to even more stringent regulations about fuel economy, emissions, and energy consumption [1]. In the automotive sector, this process has resulted in the creation of incentives to concentrate on novel alternative powertrain technologies [2]. In this framework, batteries have gained wide interest for being crucial to fully electric, hybrid, and plug-in hybrid cars (BEVs, HEVs, PHEVs). Specifically, lithium-ion batteries are mostly used in automotive applications, due to their impressive characteristics, such as high-energy density, low self-discharge rate, rapid charging time, and efficient power output [3,4,5]. Nevertheless, battery performance and health are influenced by charging/discharging cycles and environmental variables, which can all affect the battery dynamics [6].
Since EVs are not ready to be sold on a large scale in the next few years, according to [7], new solutions need to be developed to meet the targets that have been established for emission reduction. Therefore, HEVs are gaining important interest worldwide because they combine an electric energy storage unit, i.e., the battery, with an electric motor and a device that couples the electric and thermal drivelines. As described in [8,9], the combination of the two propulsion systems allows the vehicles to achieve better performance, in terms of both engine usage and fulfillment of the power request. According to the mechanical architecture, most HEVs can be roughly divided into six categories: micro/mild parallel, full parallel, series, combined, power split, and through-the-road (TTR) hybrids [10]. Specifically, in a series HEV, the power sources supply electrical energy to a DC bus. Parallel HEVs can use the internal combustion engine (ICE) or electric machine (EM) alone or together. Regenerative braking uses the EM to charge the battery. Parallel mild HEVs are suitable because they provide a good balance between cost and performance. Complex HEVs combine parallel and series architecture. Except for the motor’s power flow, which is bidirectional in complex hybrids and unidirectional in series–parallel HEVs, they are essentially identical to series-parallel HEVs. Among all these architectures and designs of hybrid powertrains, which are currently under development, a lot of research has been devoted to 48 V batteries, as it can make the electric driveline capable of recovering more energy in short periods of time from braking action, with respect to 12 V layouts, while being easily integrated in the electrical systems of the vehicle, as stated in [7,11].
Despite the advantages of 48 V hybrid architecture, the battery SOC remains a crucial quantity, which can be estimated via the measurement of other battery parameters, such as voltage, current, and temperature. In detail, SOC estimation often relies on the direct measurement of open circuit voltage, internal impedance, or integration of the current over time [12,13]. Under controlled laboratory conditions, these techniques are accurate, although they can be energy consuming and not applicable during the vehicle motion in real-time applications, as stated in [14]. Many approaches have been investigated in the recent literature to overcome those issues, such as model-based, rule-based, and artificial intelligence (AI) methods. The Kalman filter (KF) [15], extended Kalman filter (EKF) [16,17,18,19], unscented Kalman filter (UKF) [20,21], adaptive particle filter (APF) [22], and smooth variable structure filter (SVSF) [23,24] are included in the first category. On the contrary, rule-based algorithms, such as fuzzy logic (FL) [25,26,27], are model-less techniques that are mostly reliant on the expertise of the designer.
In recent research studies, AI-based techniques and, more specifically, the application of ANNs, have gained a great momentum in representing nonlinear dynamics in real-time applications, such as the SOC estimation, as discussed in [28,29]. The ANNs can guarantee online estimation and estimate the SOC using discrete life span of the battery, instead of the whole life span. The impact of the battery temperature effects can also be considered. Nevertheless, the accuracy of an ANN is heavily influenced by the selection of a proper input/output layout and an adequate training dataset. A large amount of data is needed to train the algorithm, and the precision depends on the accuracy of the model applied to experimental datasets. Among all the ANN architectures that are used in the literature for battery SOC estimation [30,31], the NARX model is used in this work, since it has been proven to be accurate and robust in a prior work by the authors [28]. Furthermore, considering a battery working condition at a quasi-constant temperature, the present work investigates two different layouts for the retained NARX ANN: the first one includes only two inputs, i.e., the instantaneous values of current and voltage, whilst the latter includes four inputs, including the averaged quantities of those values, as performed in [32] for a different ANN model.
Out of all the potential estimating methods, this methodology is the most effective at capturing the non-linear connection between various battery parameters, while minimizing the anxiety associated with uncertain EV operating conditions and the complicated electrochemical process of batteries [33,34]. Consequently, it does not require detailed physical knowledge of the battery, and the proposed layout ensures the deployment on a battery management system (BMS), due to the limited number of neurons and layers.
Both the proposed layouts are compared, in terms of estimation accuracy during different maneuvers performed on modeled driving cycles for a 48 V lithium-ion battery pack, namely during charge-sustaining and charge-depleting phases. In detail, the experimental validation is performed in a hardware-in-the-loop (HIL) configuration. To the best of the authors’ knowledge, the real-time assessment of HIL implementation of SOC estimation ANN-based algorithms is limited to simple charge/discharge cycles that are not representative of real driving situations in HEVs [35]. Therefore, the proposed research work aims to demonstrate that the proposed estimation algorithm can provide relevant results within the investigated experimental framework, ensuring that the proposed data-driven algorithm, based on NARX ANNs, can be rapidly deployed, tested, and validated on state-of-the-art hardware platforms.
In detail, the experimental validation process exploited a Raspberry Pi 4B card-sized board, in which the estimation algorithm is actually deployed, and real-time hardware, in which the battery model is developed, namely a Speedgoat baseline platform. These hardware platforms were used in the HIL architecture, via UPD communication protocol, allowing the system to be validated in a proper testing environment. Moreover, the considered battery system is a 1.25 kWh 48 V lithium-ion battery that is numerically modeled via an RC equivalent circuit model, which can also consider the environmental temperature influence.
In summary, the novel contribution of this work is the experimental validation of a data-driven SOC estimation method in a HIL configuration using the NARX ANN architecture. The investigated method is particularly addressed to the 48 V lithium-ion batteries used in actual HEVs. Moreover, the presented algorithm is validated during different real driving cycles and compares two estimation architectures that differ in the set of the retained inputs.
This paper is organized as follows. Section 2 illustrates the considered battery modeling approach, along with the hardware setup that is used for the HIL testing. This section also presents the ANN-based algorithm for SOC estimation in the two different layouts that are evaluated, in terms of accuracy. The used training dataset is finally illustrated. Section 3 presents and discusses the obtained results on the recorded datasets for the proposed HIL architecture. A performance analysis, in terms of estimation accuracy, is then presented. Finally, Section 4 concludes the paper.

2. Methodology

This section introduces the proposed battery modeling approach for the retained 48 V lithium-ion battery pack. Then, the designed experimental layout is presented, illustrating the HIL test architecture setup with both the considered hardware platforms, namely the Speedgoat baseline real-time target machine and a Raspberry Pi 4B card-sized board. The flowchart of the proposed approach is illustrated in Figure 1.
Eventually, the SOC estimation algorithm design and testing procedures are described in a dedicated subsection that illustrates the two considered ANN layouts. Moreover, the training algorithm and datasets are also discussed in this subsection.

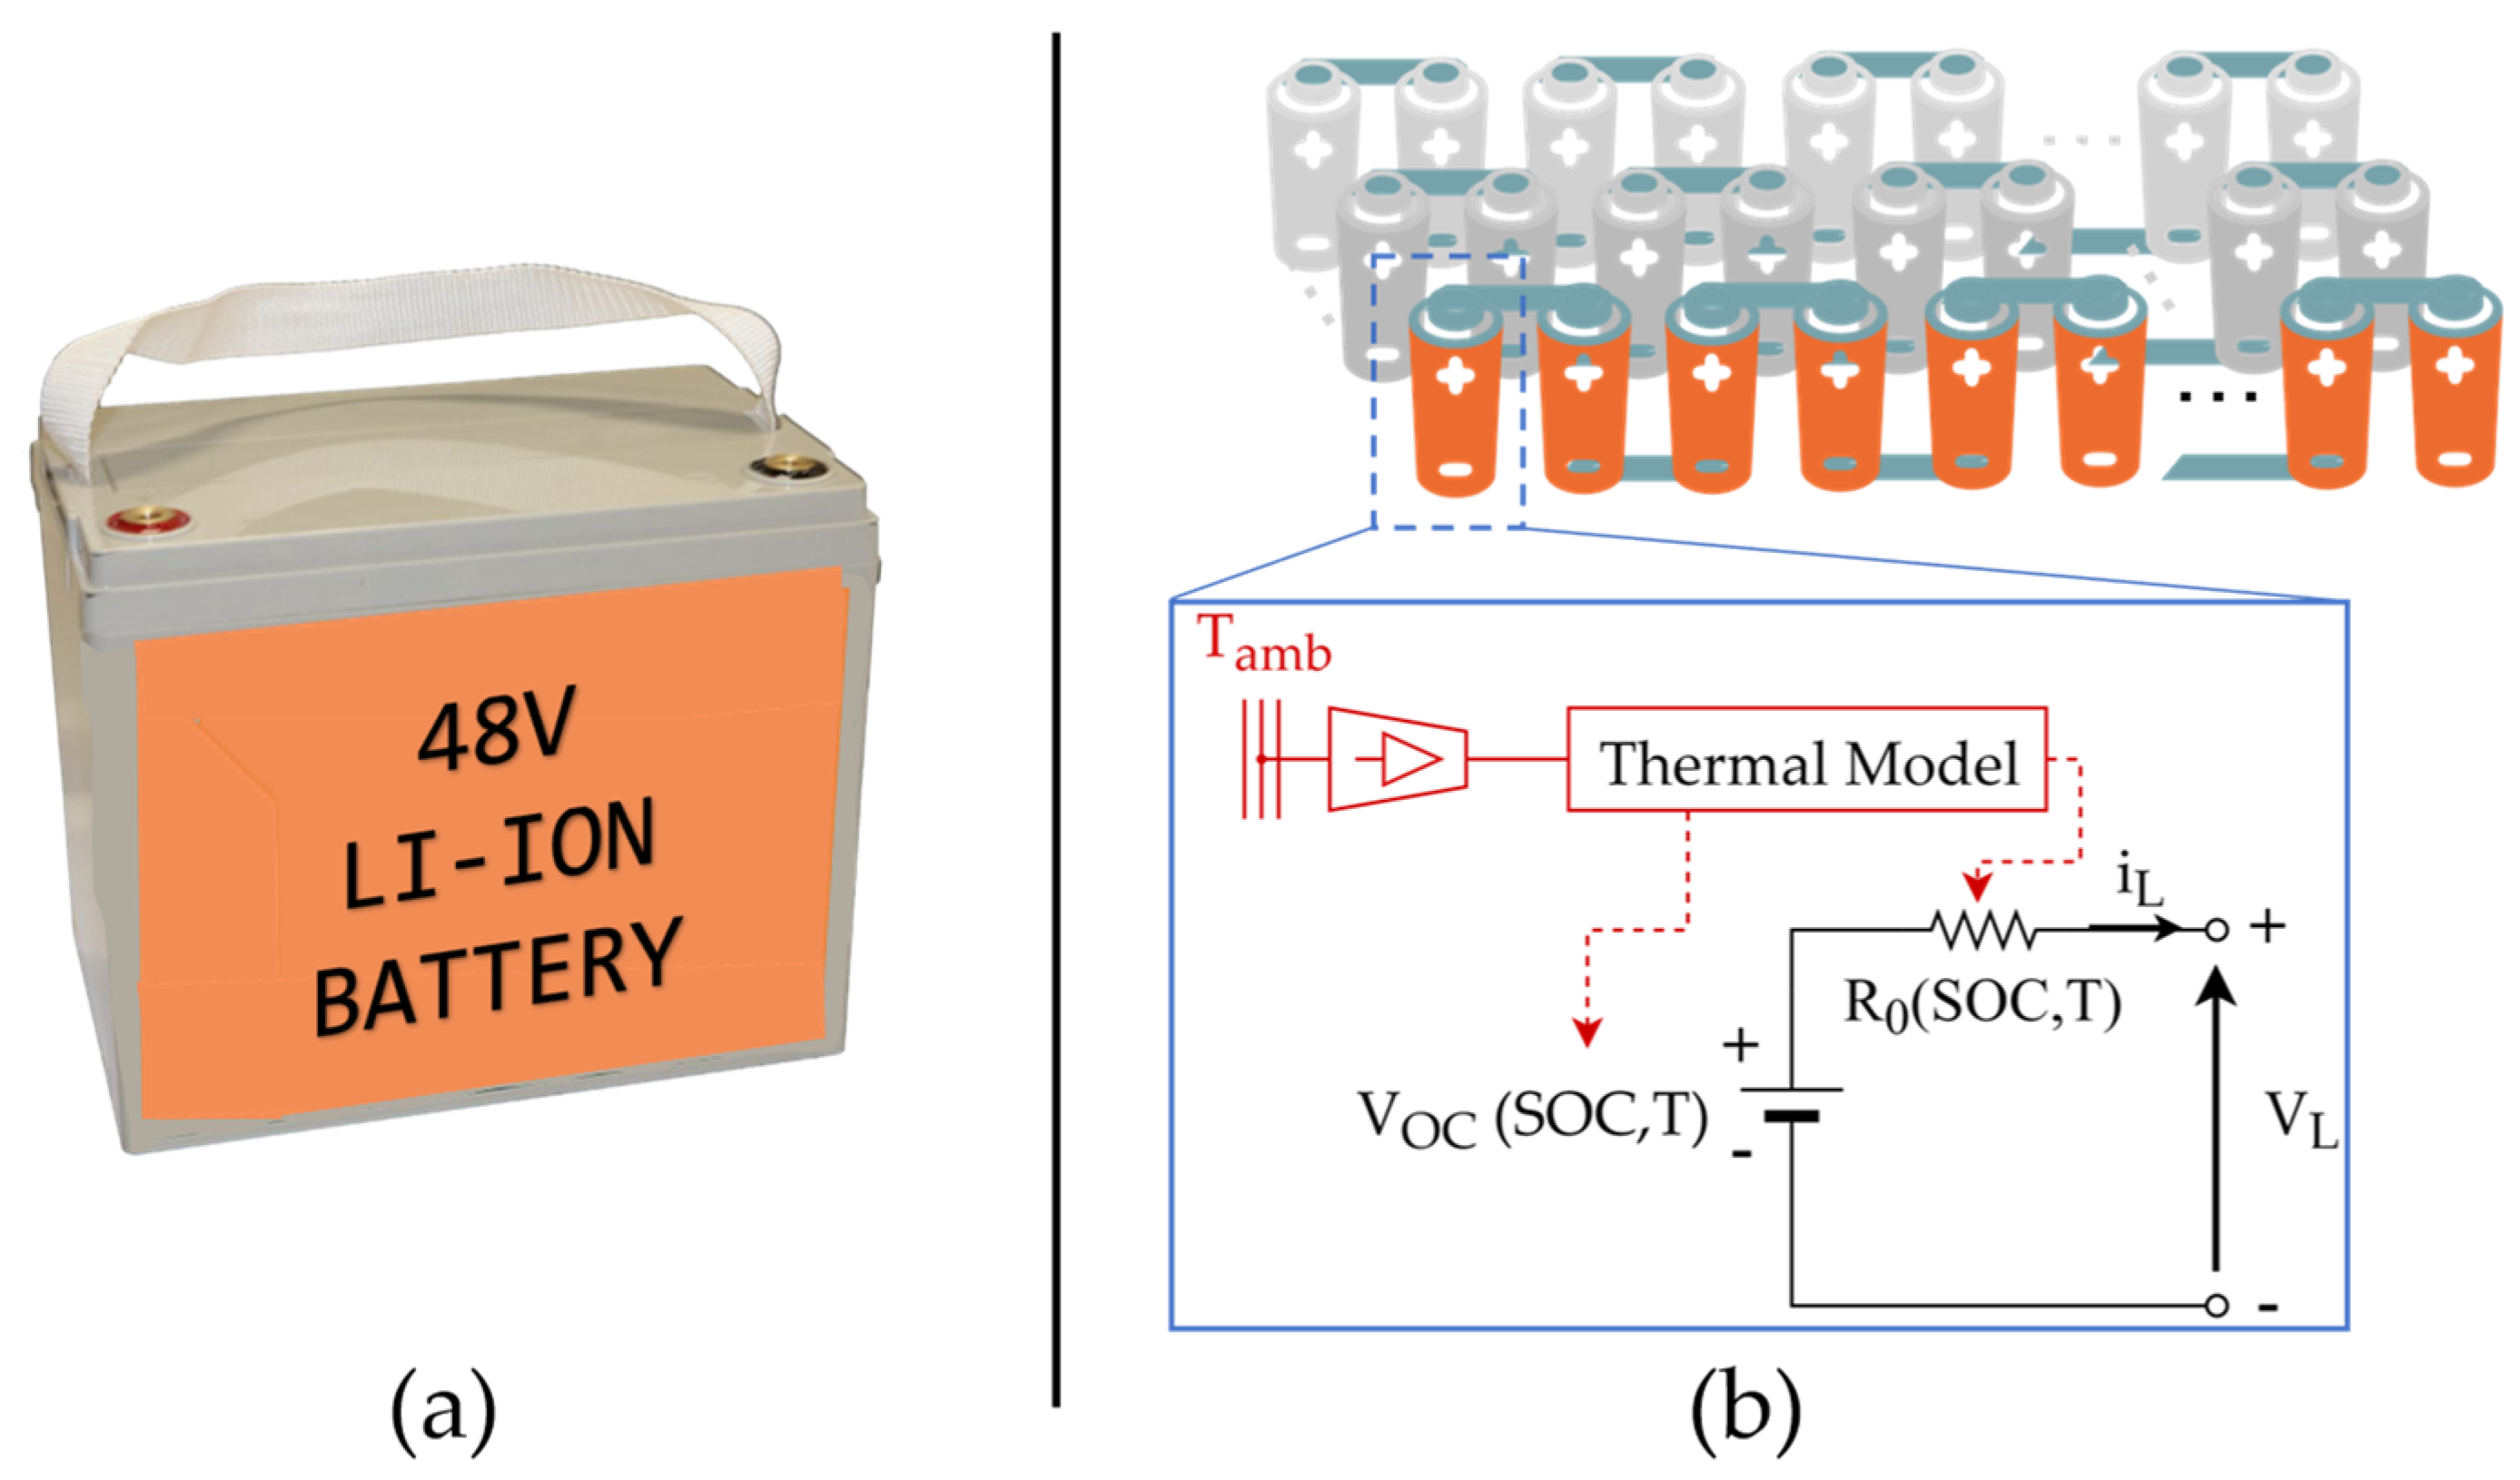
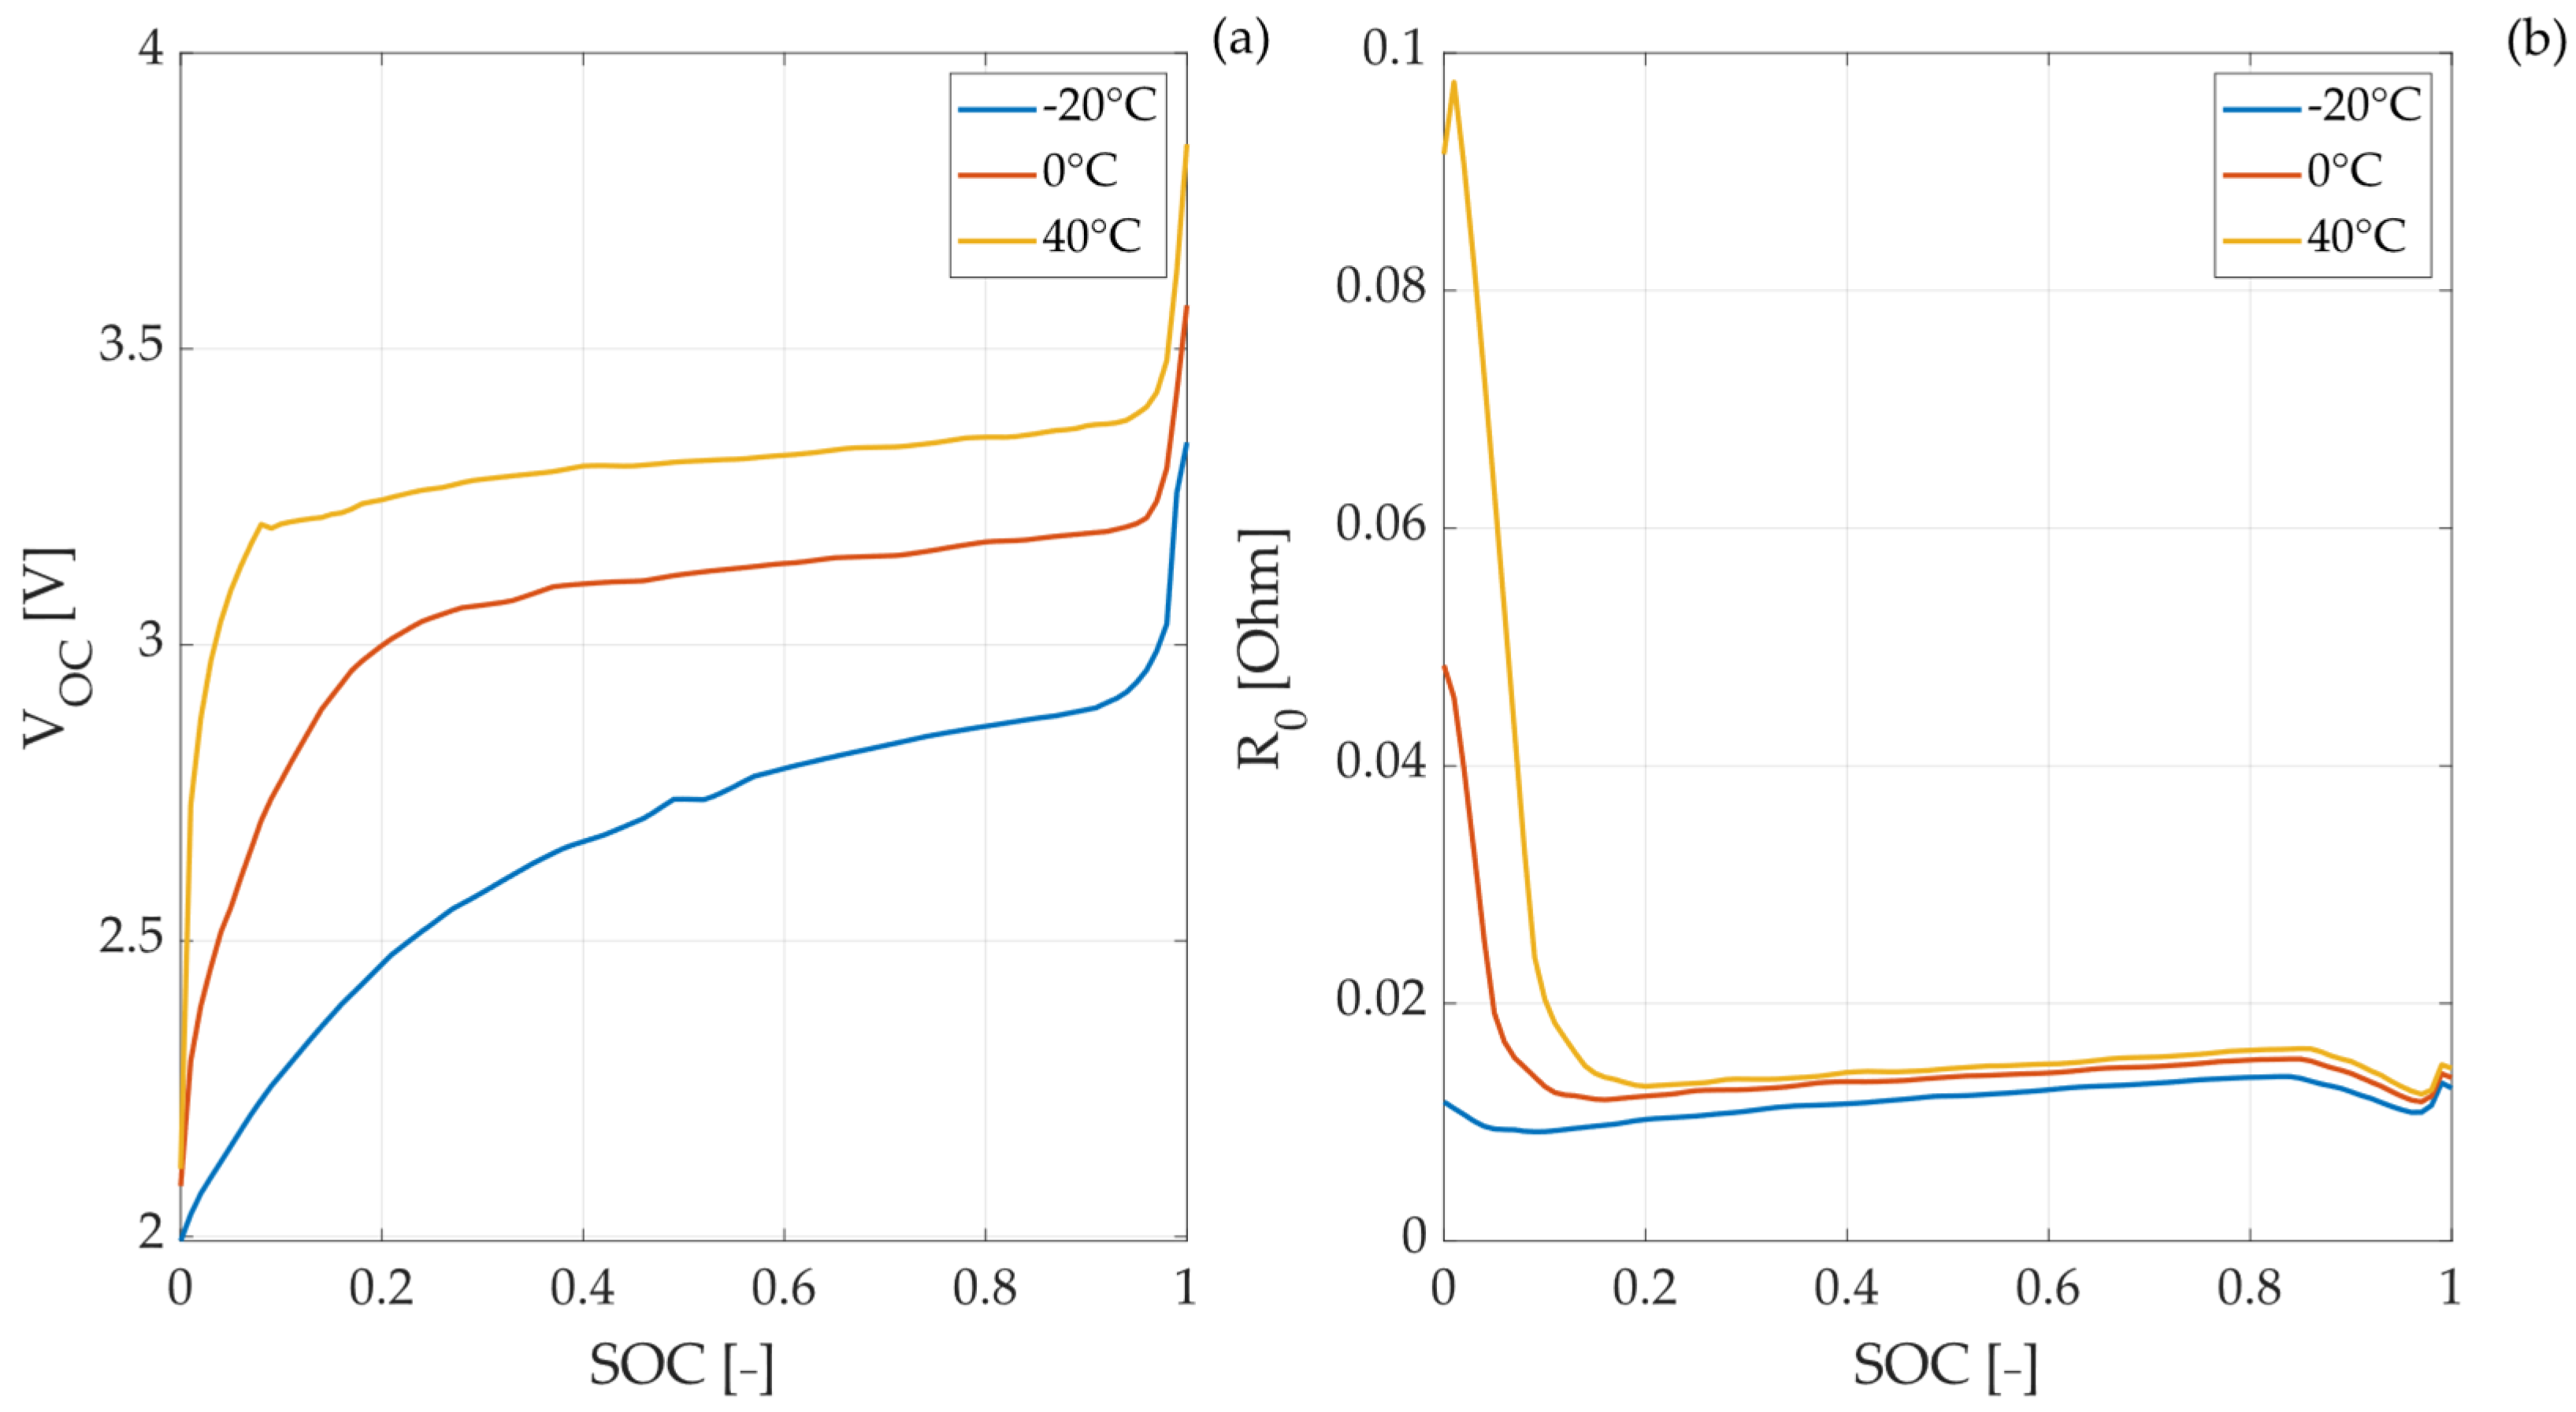
2.1. Battery Modeling
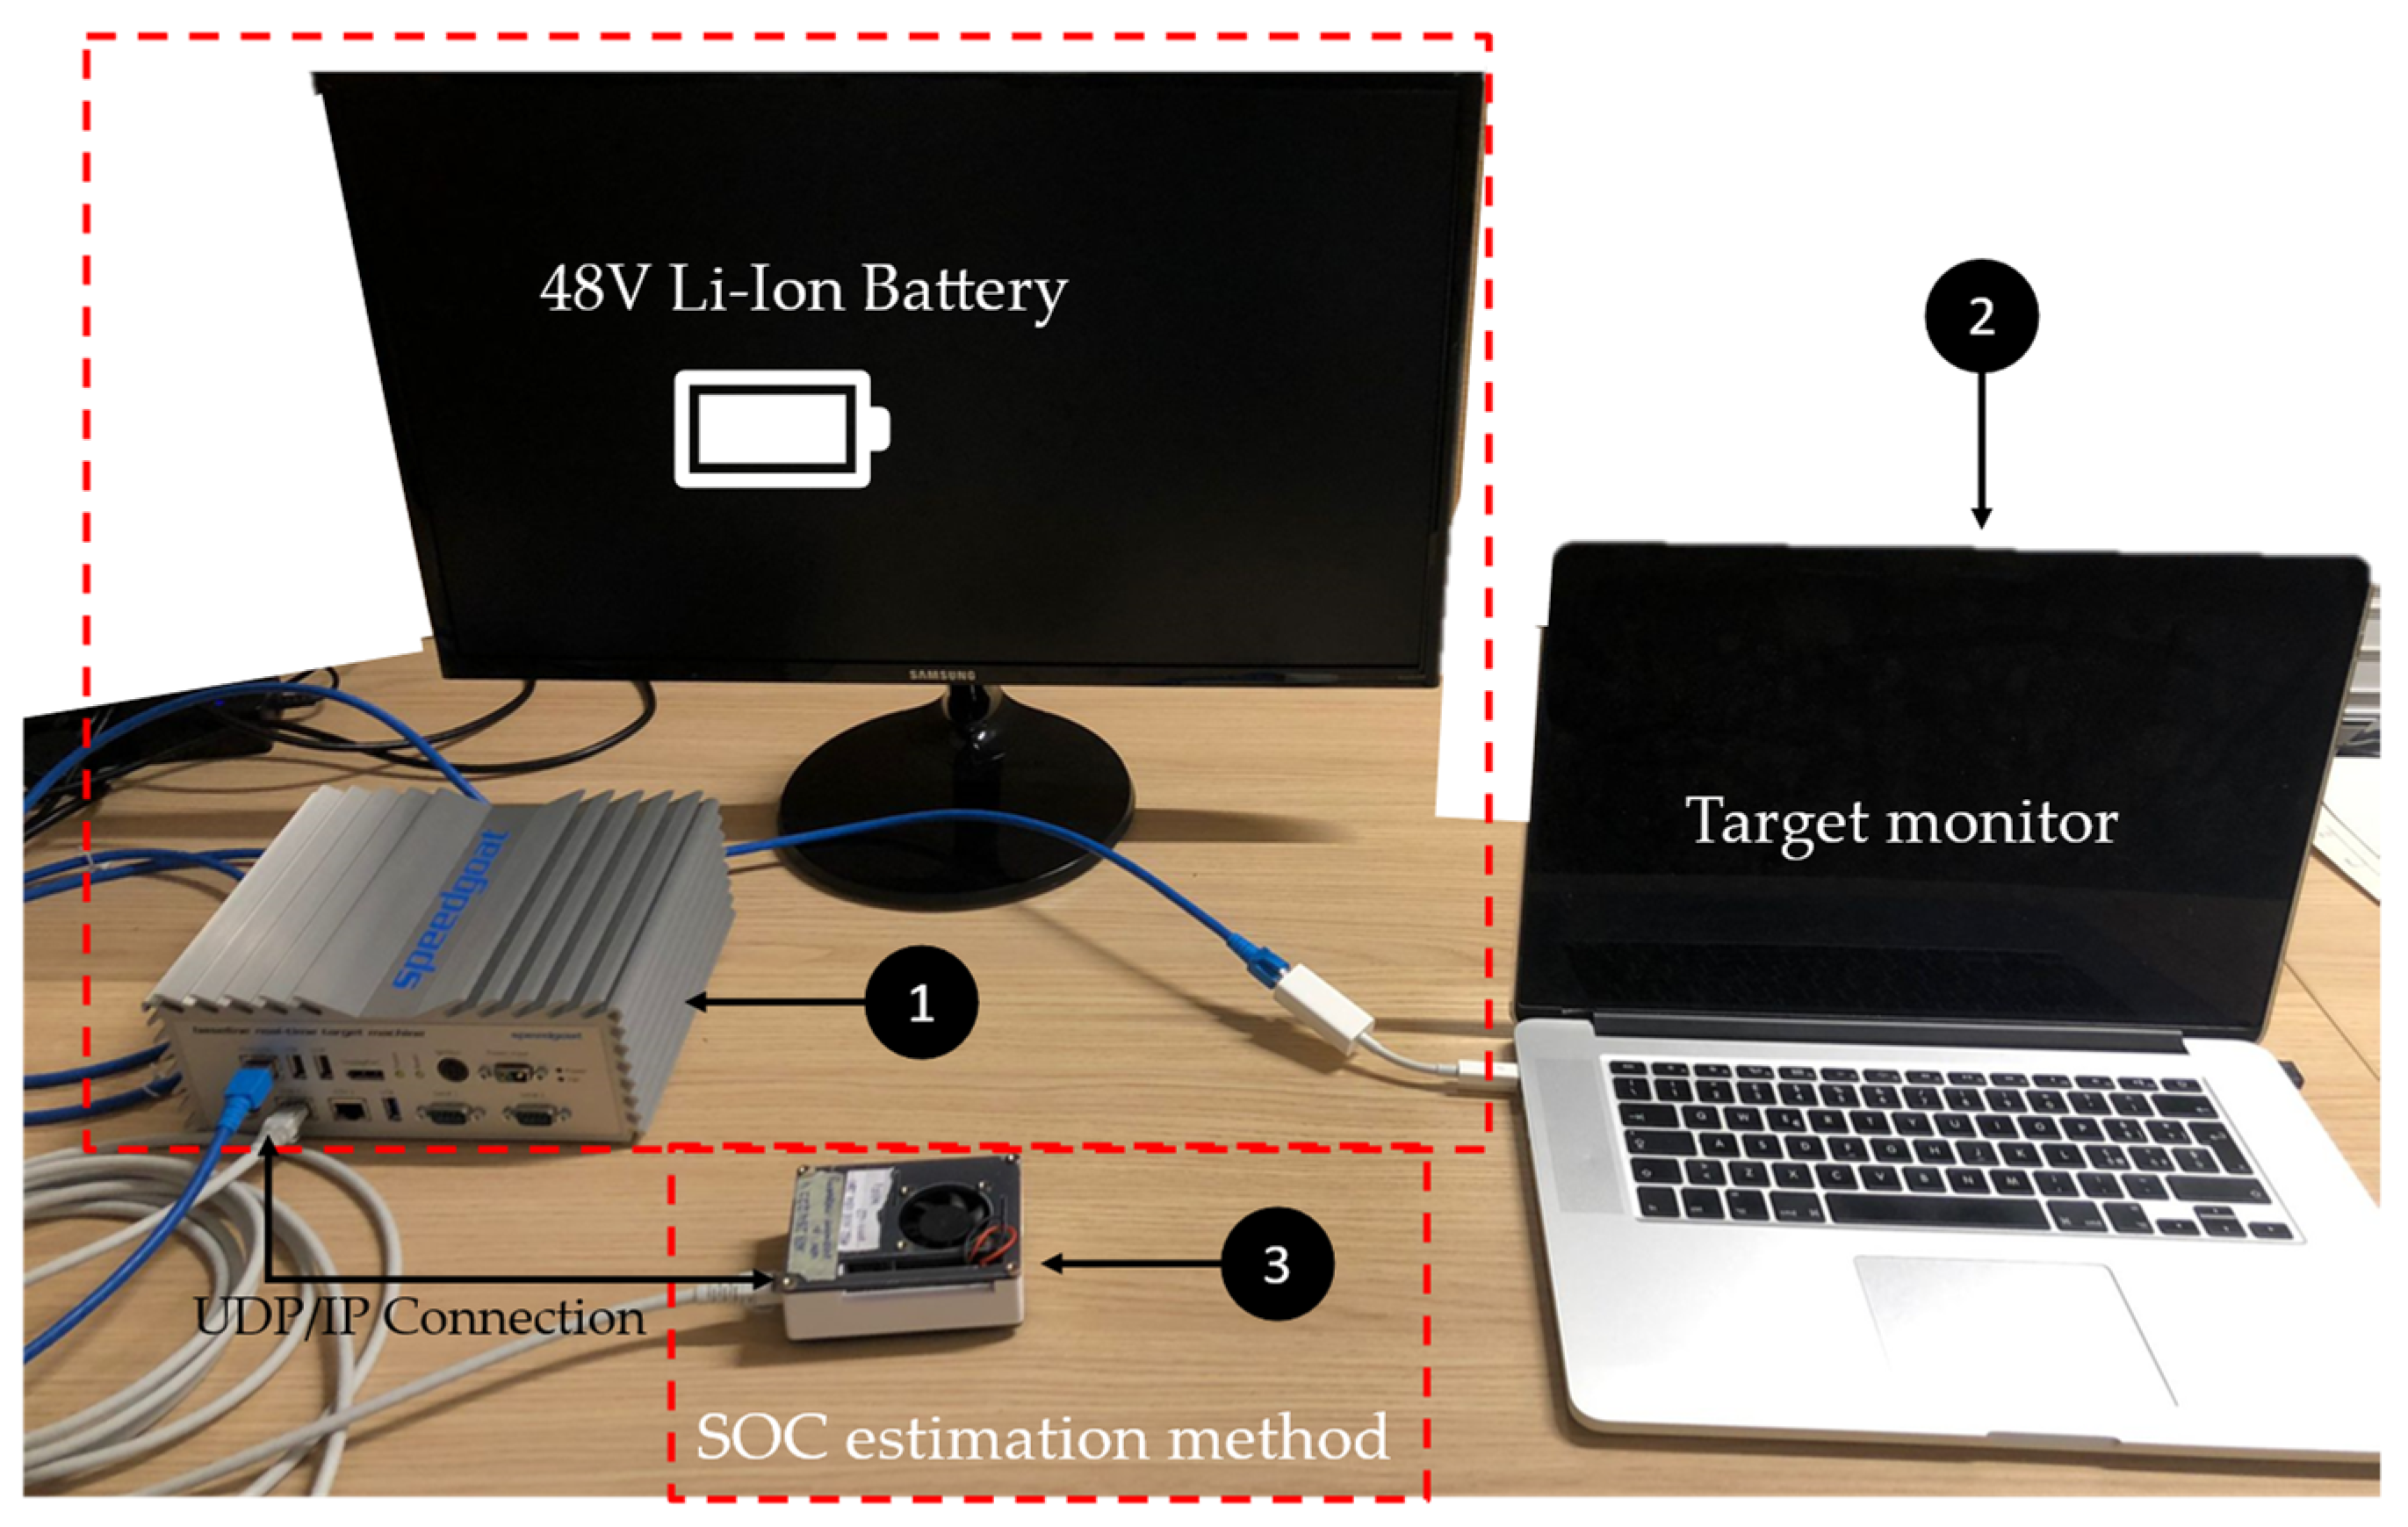
This section aims to present the modeling of the battery pack in the Matlab/Simulink environment. The 48 V lithium-ion battery is modeled via an equivalent circuit model, considering some thermal effects. Many different battery models are investigated in the literature, and they could be distinguished in various categories, namely empirical, equivalent electrical circuit, and electrochemical models [36]. Empirical models provide a straightforward solution for quantitative comparisons of different operating situations, but their precision is low and cannot be utilized for exact performance evaluations. Conversely, mathematical models, based on the internal electrochemical reactions, are very accurate. Still, they require detailed knowledge of the battery chemical processes and can be difficult to deploy on embedded BMS. The usage of equivalent electrical circuit models is the most common technique exploited for simulating a battery’s electrical performance [36,37].
This work considers a 14s11p configuration of cylindrical battery cells to model the entire battery pack. Each battery cell is made up of the series connection of an ideal voltage source, which represents the open-circuit voltage V o c and is controlled by the SOC level, and a resistor R 0 , which represents the internal resistance. The terminal voltage V L could be expressed using Kirchhoff’s voltage law, as follows:
V L = V O C R 0 i L
where V O C and R O C are obtained by interpolation:
V O C = V O C ( S O C , T )
R 0 = R 0 ( S O C , T )
where T is the temperature vector T = [ 20 , 0 , 40 ] °C and SOC is an equally spaced vector between 0 and 1.
Moreover, the thermal behavior of the cell can be modeled by the following equation [32]:
m c p ( d T c e l l ( t ) d t ) = h A ( T a m b T c e l l ( t ) ) + R 0 i L ( t )
where m is the mass of the battery cell [kg], c p is the specific heat capacity [J/molK], h is the horizontal overall heat transfer coefficient [W/ m 2 K], A is the surface area for heat exchange [ m 2 ], T c e l l ( t ) is the variable temperature of the battery cell [K], and T a m b is the ambient temperature [K].
In the Laplace domain, the battery cell temperature varies, according to:
T c e l l ( s ) = R t h P l o s s + T a m b τ t h s + 1
where R t h is the thermal resistance, cell to ambient [K/W], τ t h is the thermal time constant, cell to ambient [s], and P l o s s = R 0 i L 2 is the overall heat generated during the charge or discharge process [V]. Finally, the internal resistance ( R 0 ) depends on the temperature, and the Arrhenius relation is applied to model the dependency:
R 0 ( T ) = R 0 | T a m b + e x p ( α ( 1 T c e l l 1 T a m b ) ) ,   = E R T
where α is the Arrhenius rate constant for the polarization resistance.
The main parameters of the implemented battery model are reported in Table 1, as the equivalent electrical circuit including thermal modelling is represented in Figure 2.
The V O C and R 0 characteristics for the considered battery cell are reported in Figure 3.

2.2. Hardware Setup

Typically, some critical issues arise during the design and real-time implementation of stable, accurate, and robust SOC estimation algorithms, such as hysteresis and the flat aspect of the open-circuit controlled voltage V O C = V O C ( S O C , T ) characteristic curve, lithium-ion battery model, ageing, estimation algorithm selection, and imbalance of the cells. As a result, a HIL validation stage enhances overall software quality and reliability, increases development efficiency, and minimizes systematic software issues.
In this work, HIL is assessed using two different platforms to deploy the battery model and SOC estimation method. Specifically, the battery model is deployed on the considered real-time target machine, while the SOC estimation method is deployed on the retained evaluation board. The current and voltage signals are sent via UDP protocol between the two platforms. In detail, UDP is a packet-based protocol that uses an Ethernet board as a physical layer. This protocol is advantageous for real-time applications because it has a more negligible delay than TCP connections, since it does not retransmit lost packets. The setup of the HIL test, using the Speedgoat real-time target machine and Raspberry Pi 4B, is shown in Figure 4.
The hardware specifications of the Speedgoat baseline real-time target machine and Raspberry Pi 4B are reported in Table 2.

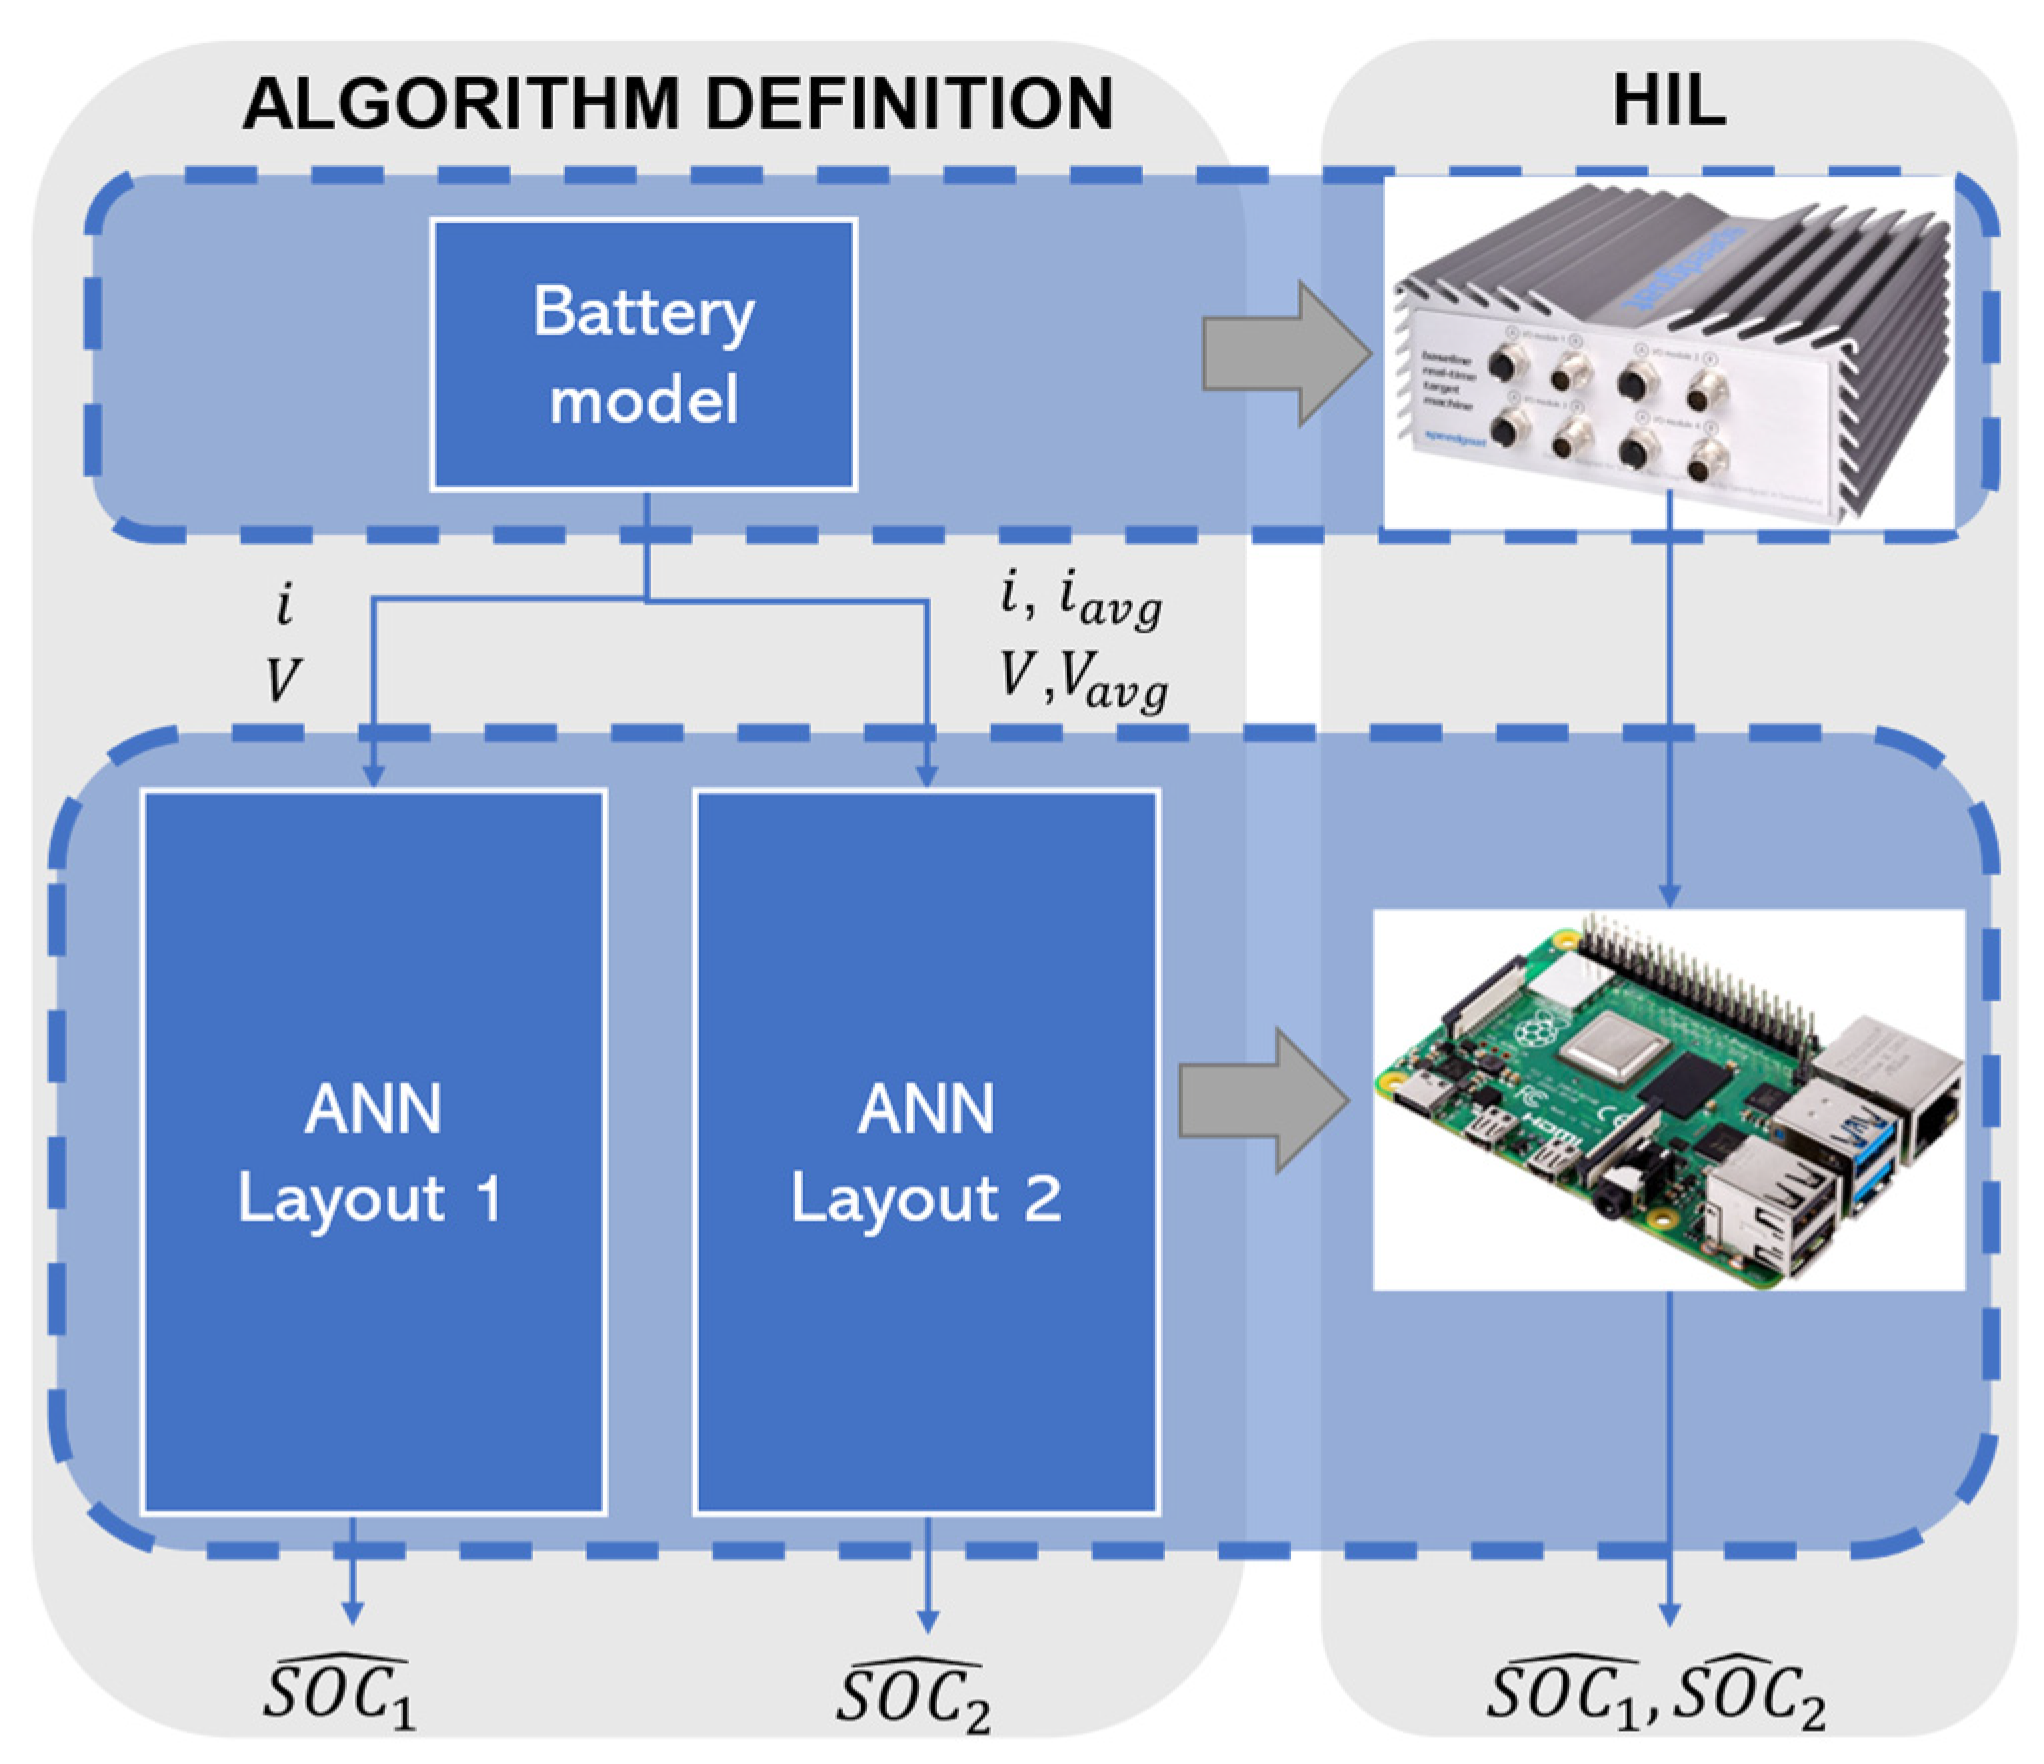
2.3. SOC Estimation Algorithm

In this subsection, the proposed SOC estimation algorithm is discussed. Specifically, the training datasets are illustrated, and the ANN architectures are presented and discussed. In particular, two different layouts are analyzed and compared.
The selected ANN architectures are based on a NARX recurrent neural network (RNN) with a feedback connection that encloses several network layers. Because of its simplicity, and the idea that it will operate more accurately in a battery management system, a NARX RNN was selected for this paper. The mathematical model is the following one:
y ( t ) = f ( y ( t 1 ) , y ( t 2 ) , , y ( t n y ) , x ( t 1 ) , x ( t 2 ) , , x ( t n x ) )
where y ( · ) is the output, x ( · ) are the inputs, and [ n y , n x ] are the output and inputs buffers, respectively. In the considered model, the next value of the dependent output signal y(t) is regressed on previous values of the output signal and prior values of an independent input signal.
Both the NARX RNN layouts are trained considering a fixed number of hidden layers equal to L H = 1 , and the hidden activation function (HAF) is a hyperbolic tangent sigmoid. Moreover, a unique output layer, L O = 1 , is also considered, and the corresponding output activation function (OAF) is a linear function.
The training procedure is based on the static Levenberg–Marquardt (LM) backpropagation algorithm for RNN architectures, which is widely used in literature for curve fitting problems, by means of the nonlinear least squares formulation [38,39,40]. The parameters used in all the training processes are discussed in the following sections.

2.3.1. NARX RNN—Layout 1

The first ANN layout takes, as input, only the current and voltage signals sampled at 10 Hz and returns, at each sample time, the estimated SOC value. The detailed NARX RNN structure is reported in Figure 5, while the parameters used during the training process and chosen for the deployment are presented in Table 3. Specifically, the parameters used in the deployment phase are selected during the training phase, after a necessary trial and error heuristic procedure for the accurate minimization of the estimation error.

2.3.2. NARX RNN—Layout 2

The chosen structure for the second layout is a NARX RNN with four inputs: voltage, current, averaged terminal voltage, and averaged current at each sample time. The averaged values were computed based on the 500 previous one-second time steps. The use of voltage and current averaged values on a moving window is crucial for two main reasons. Firstly, it reduces the effect of possible estimation error in the output that propagates to the input layer, due to the feedback connection, and it also reduces the SOC estimation error, when compared to using only the current and voltage at each time step.
As for layout 1, the detailed NARX RNN structure is reported in Figure 6. The parameters used in all the training and the parameters chosen for the deployment are presented in Table 4. In detail, the parameters used in the deployment phase are selected during the training phase after a necessary trial and error heuristic procedure for accurate minimization of the estimation error.

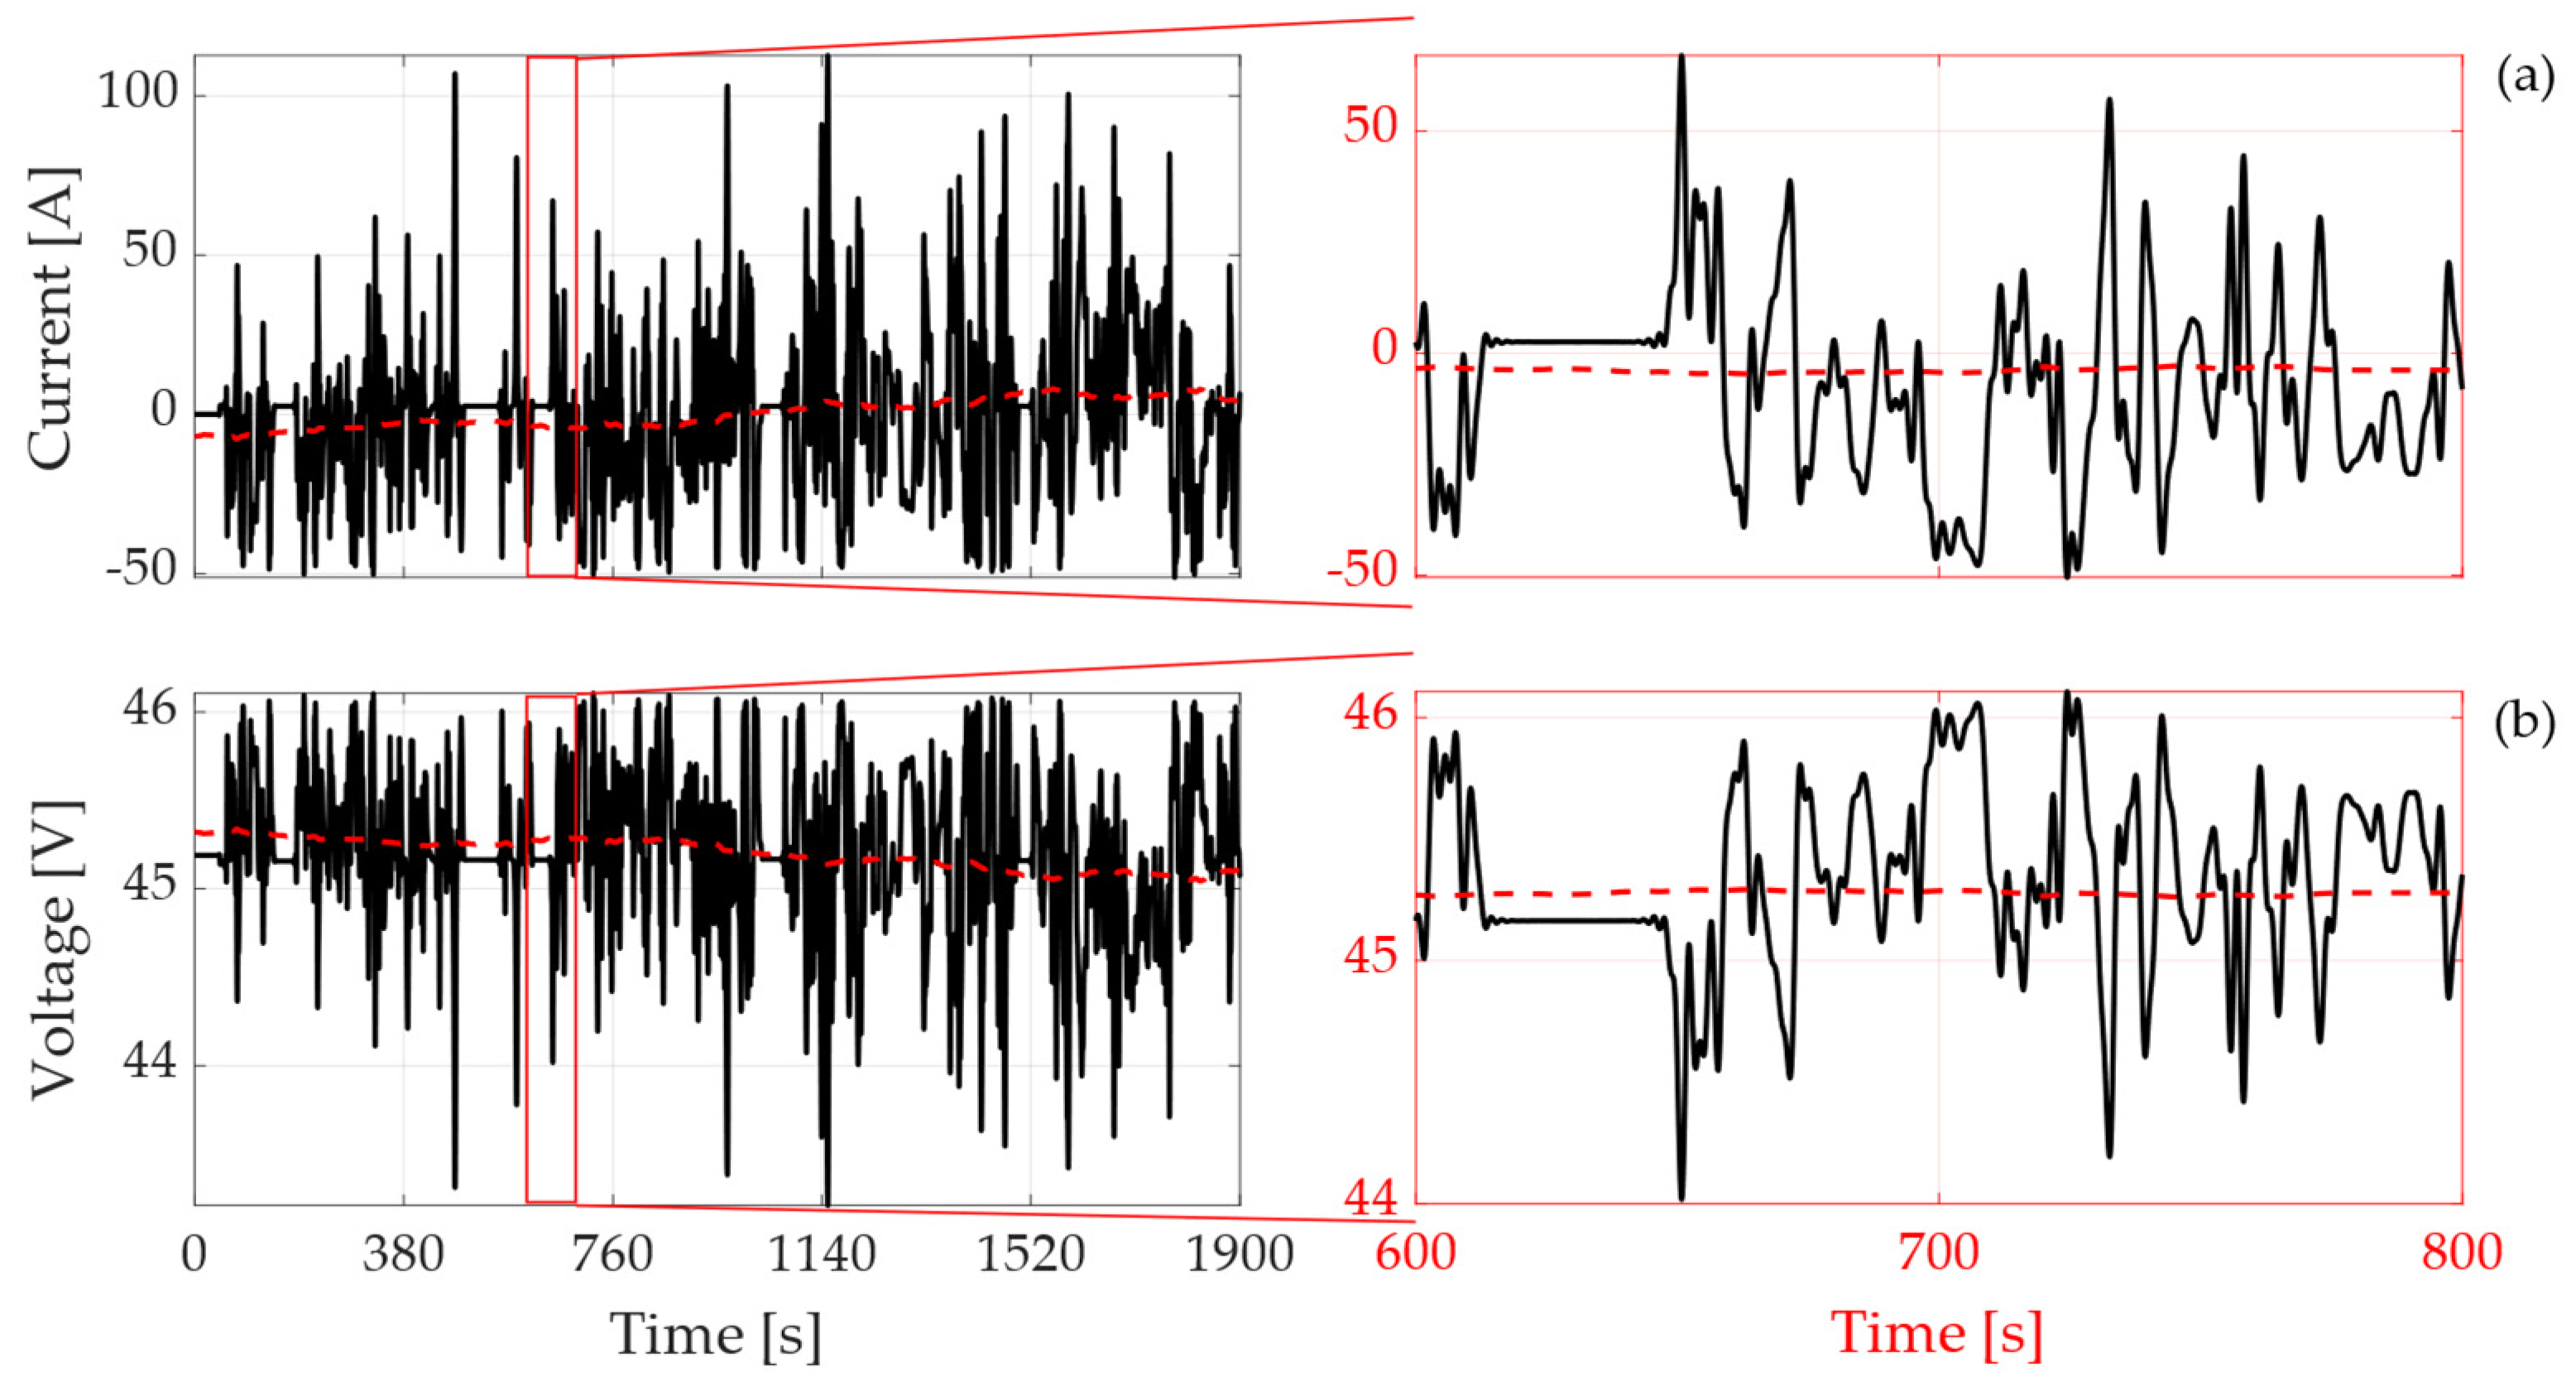
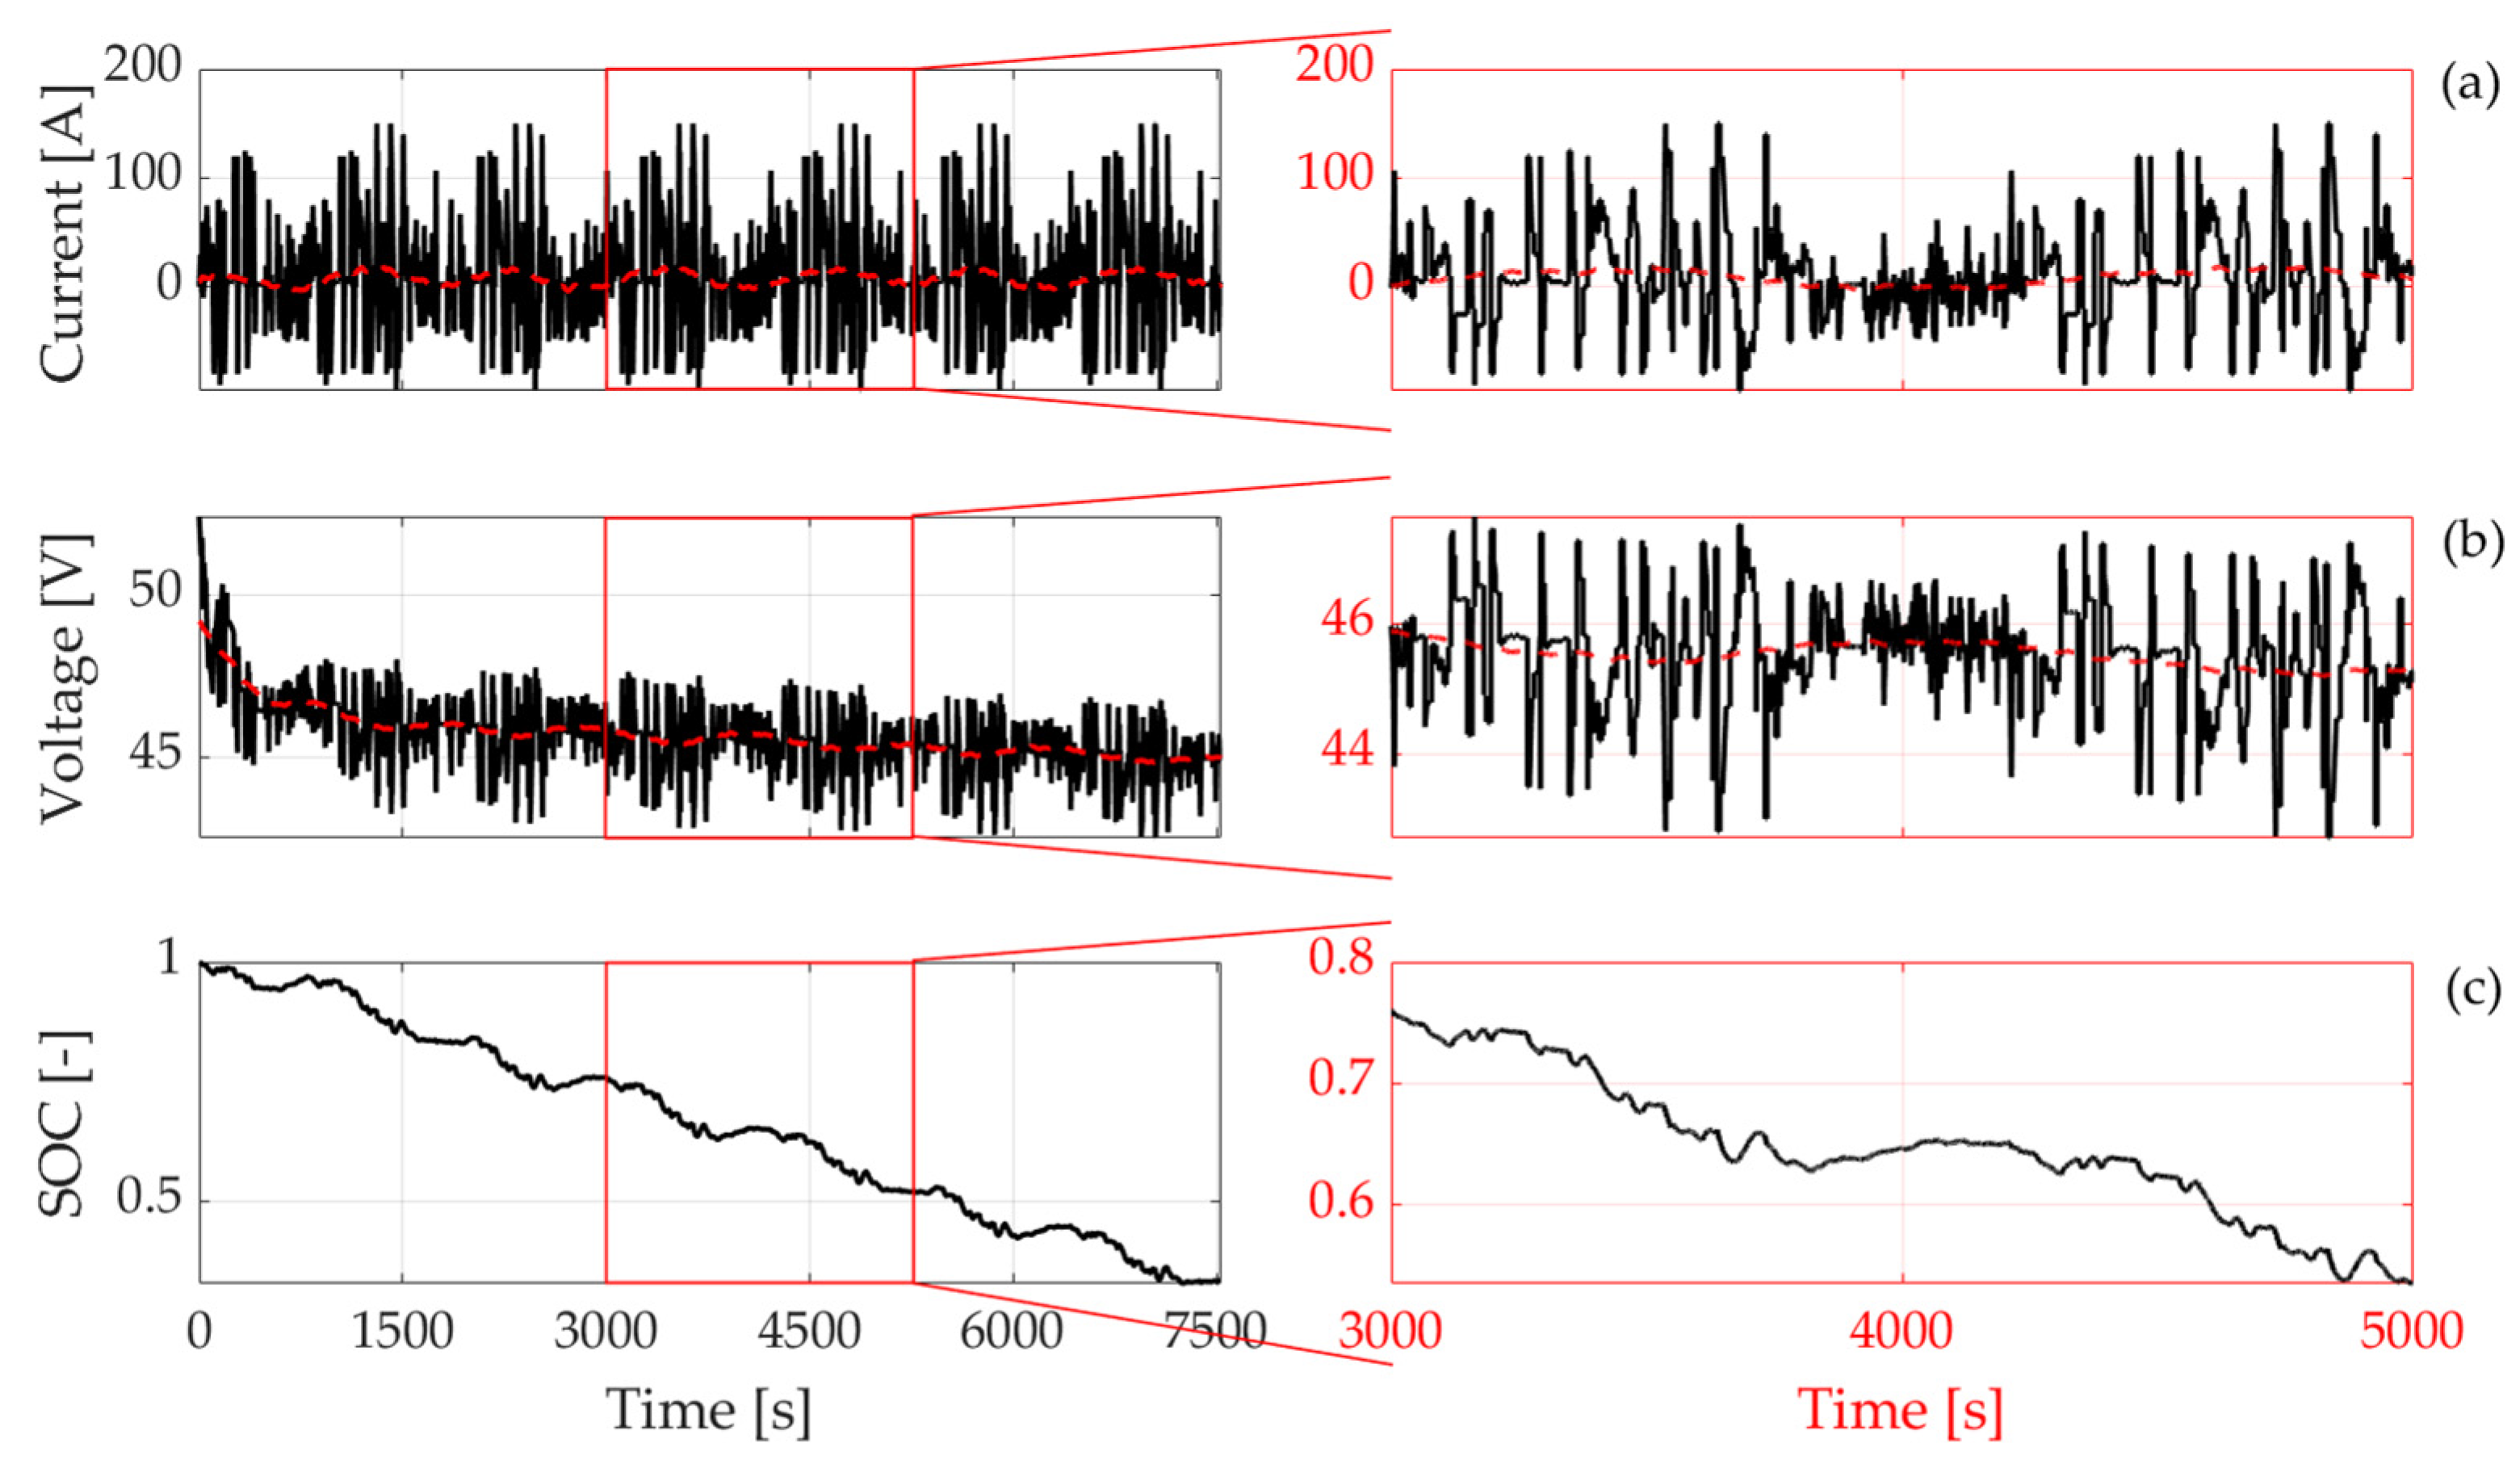
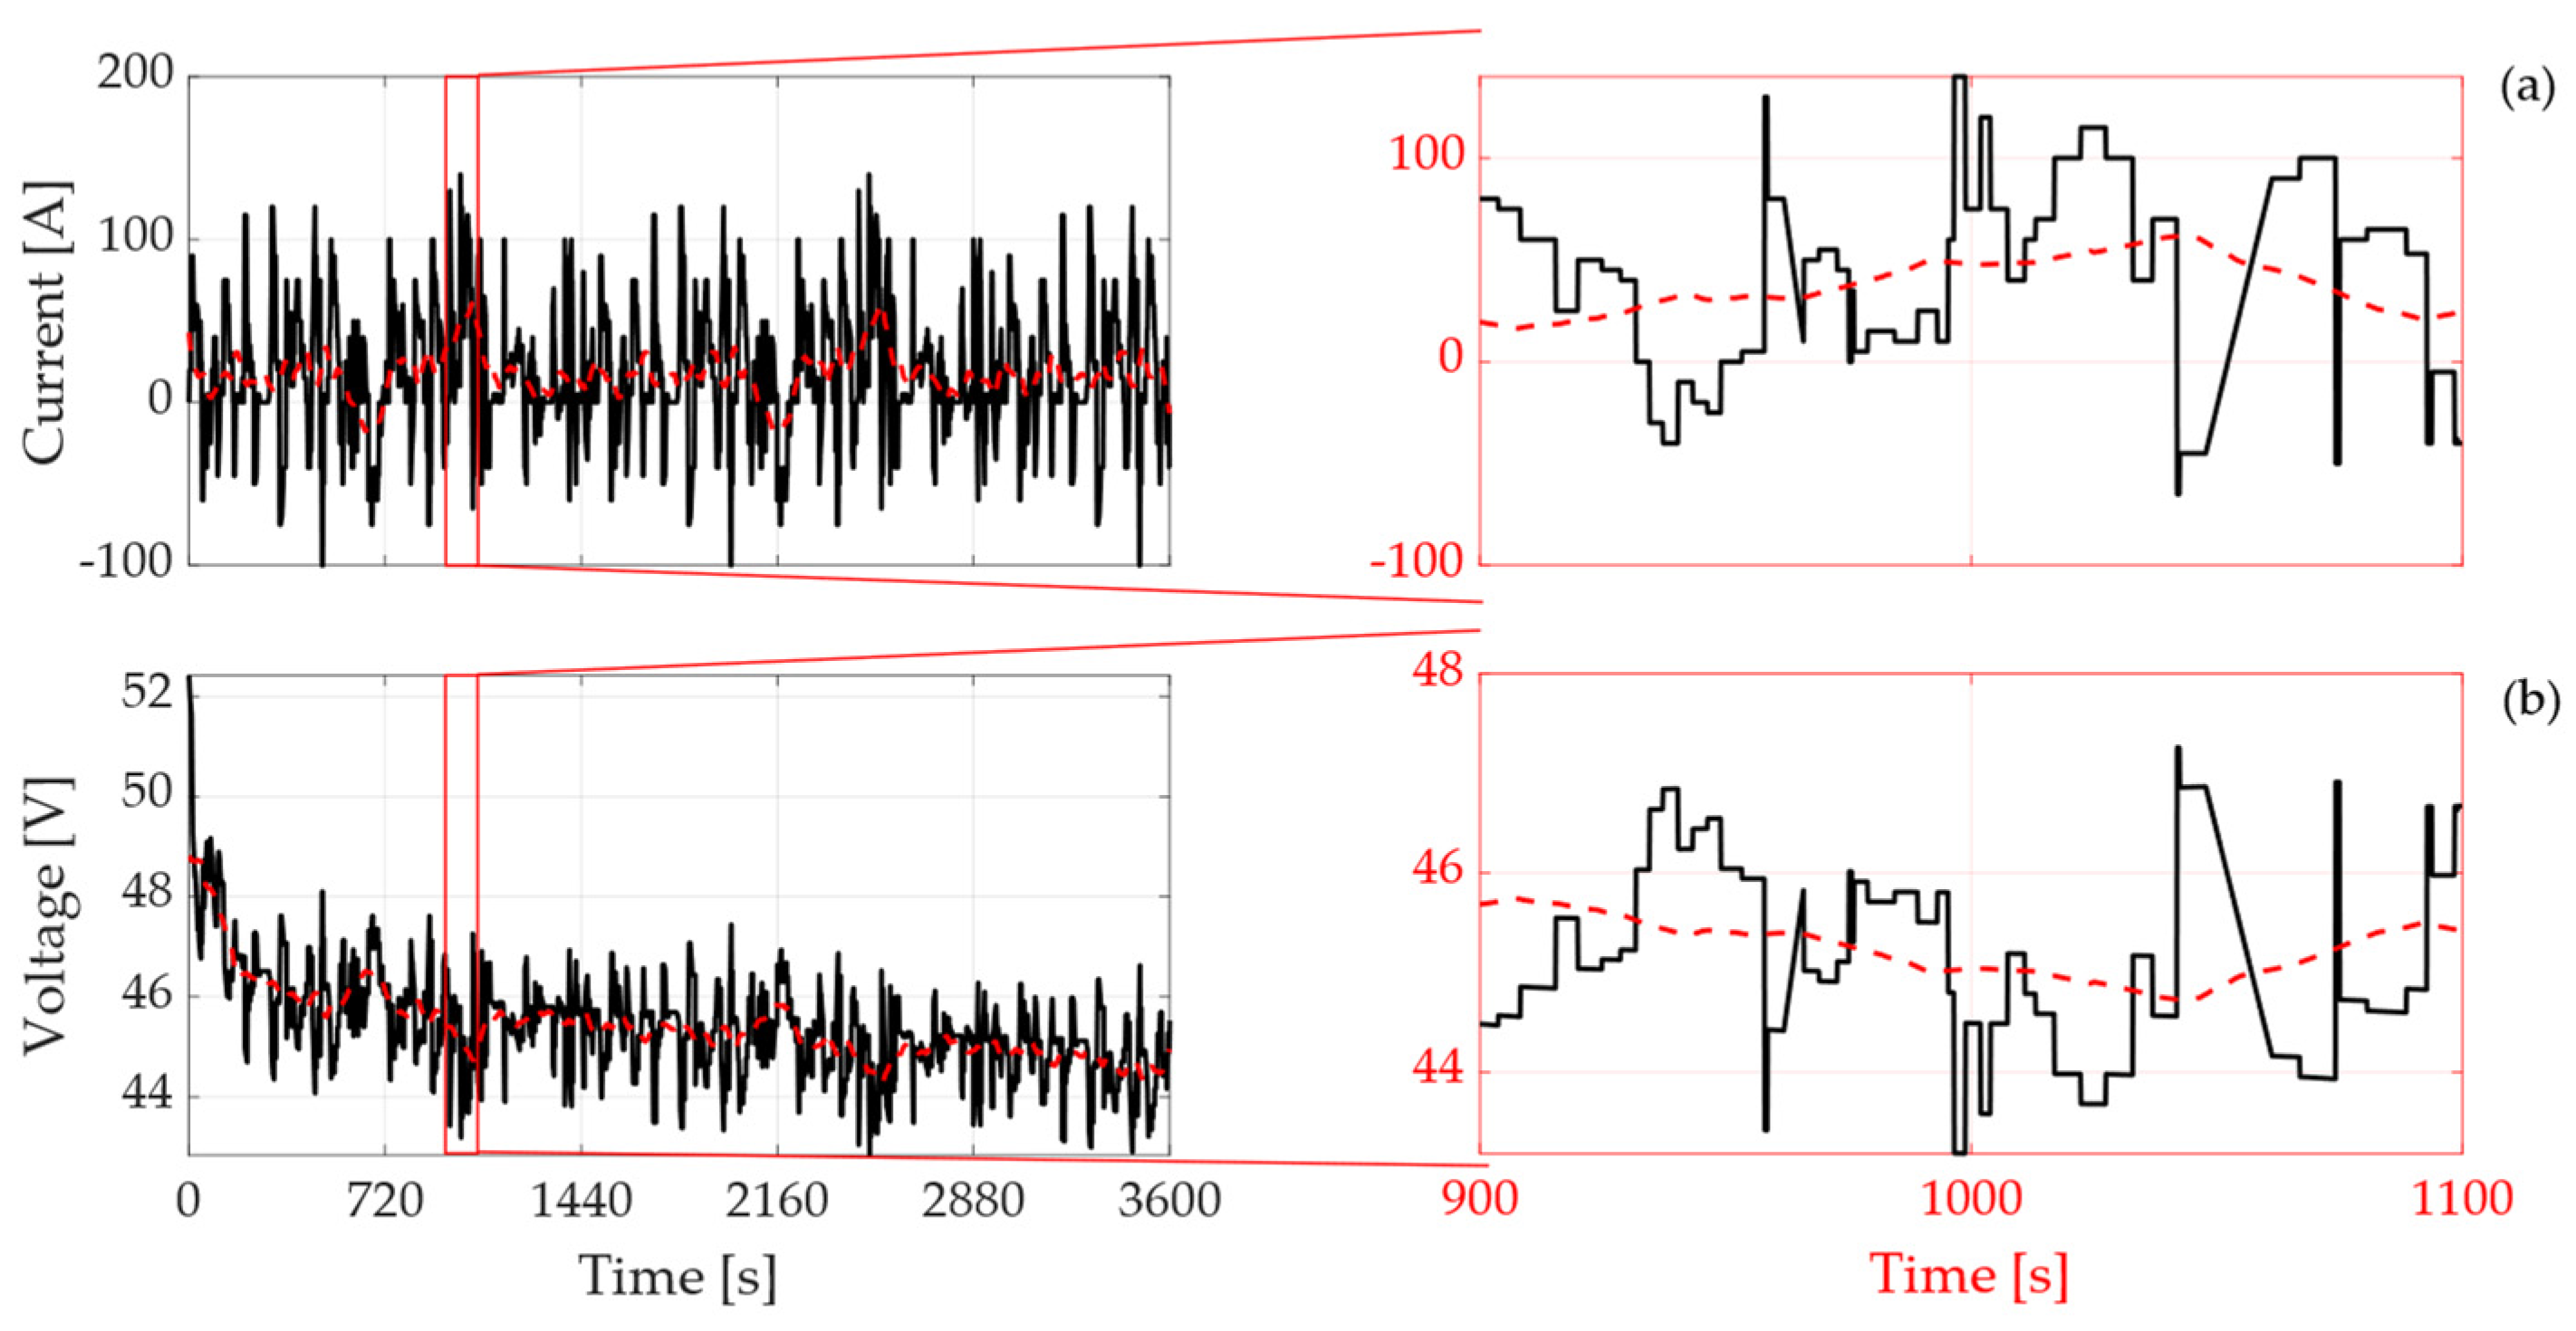
2.4. Training Dataset

When data-driven approaches are considered, the quality of the data used for the training process is strictly linked to the goodness of the resulting RNN. It is straightforward that the training dataset should be, as much as possible, complete and close to the real use-cases.
In this work, the current (subfigure a), voltage (subfigure b), and SOC (subfigure c) profiles of the training dataset are displayed in Figure 7 for the first RNN layout, while Figure 8 illustrate the current and averaged current (subfigure a), voltage and averaged voltage (subfigure b), and SOC (subfigure c) used for the second RNN layout.
The retained datasets are shown for an amount of time equal to 7532 s. Sampling rates of 10 (Hz) are used to sample the modeled data. In this study, each dataset is recorded at a constant temperature of 25 °C, including the datasets under consideration. It is common to divide a training dataset into three parts during the learning phase, in order to assess training performance and avoid overfitting issues [35]. This is done by splitting the training dataset into three parts: training (70% of the full dataset), test (15%), and validation (15%).
Then, the robustness of the actual datasets used for training the retained NARX RNNs is enhanced, including possible errors in signal measurements and, thus, including disturbances in the modeled training data. Specifically, a varying positive/negative additive error is applied to the current signal used in the training dataset, in the range required by the standards for the current probes used in the automotive sector.

3. Results and Discussion

This section presents the results to evaluate the performance of the obtained RNN layouts. The proposed method is tested on charging/discharging profiles aiming to replicate the daily usage of a 48 V lithium-ion battery for HEVs. The testing datasets, namely A and B, include the measurements of current and voltage, recorded at a constant temperature of 25 °C. Specifically, dataset A refers to a charge-depleting application, while dataset B replicates a charge-sustaining mode in HEVs. The current, averaged current (subfigure a), voltage, and averaged voltage (subfigure b) trends for datasets A and B are shown in Figure 9 and Figure 10, respectively. As for the training dataset, the averaged values are computed based on the 500 previous time steps. In detail, a positive current represents the discharging condition that is usual during driving time, while a negative current considers a charging condition during regenerative braking. Specifically, the current values range from −100 A to 100 A, while the voltage is always in between 43 V and 52 V, which is representative of a fully charge/discharge cycle in the retained application.
The following subsections discuss the estimation results, when the two different RNN layouts are applied.

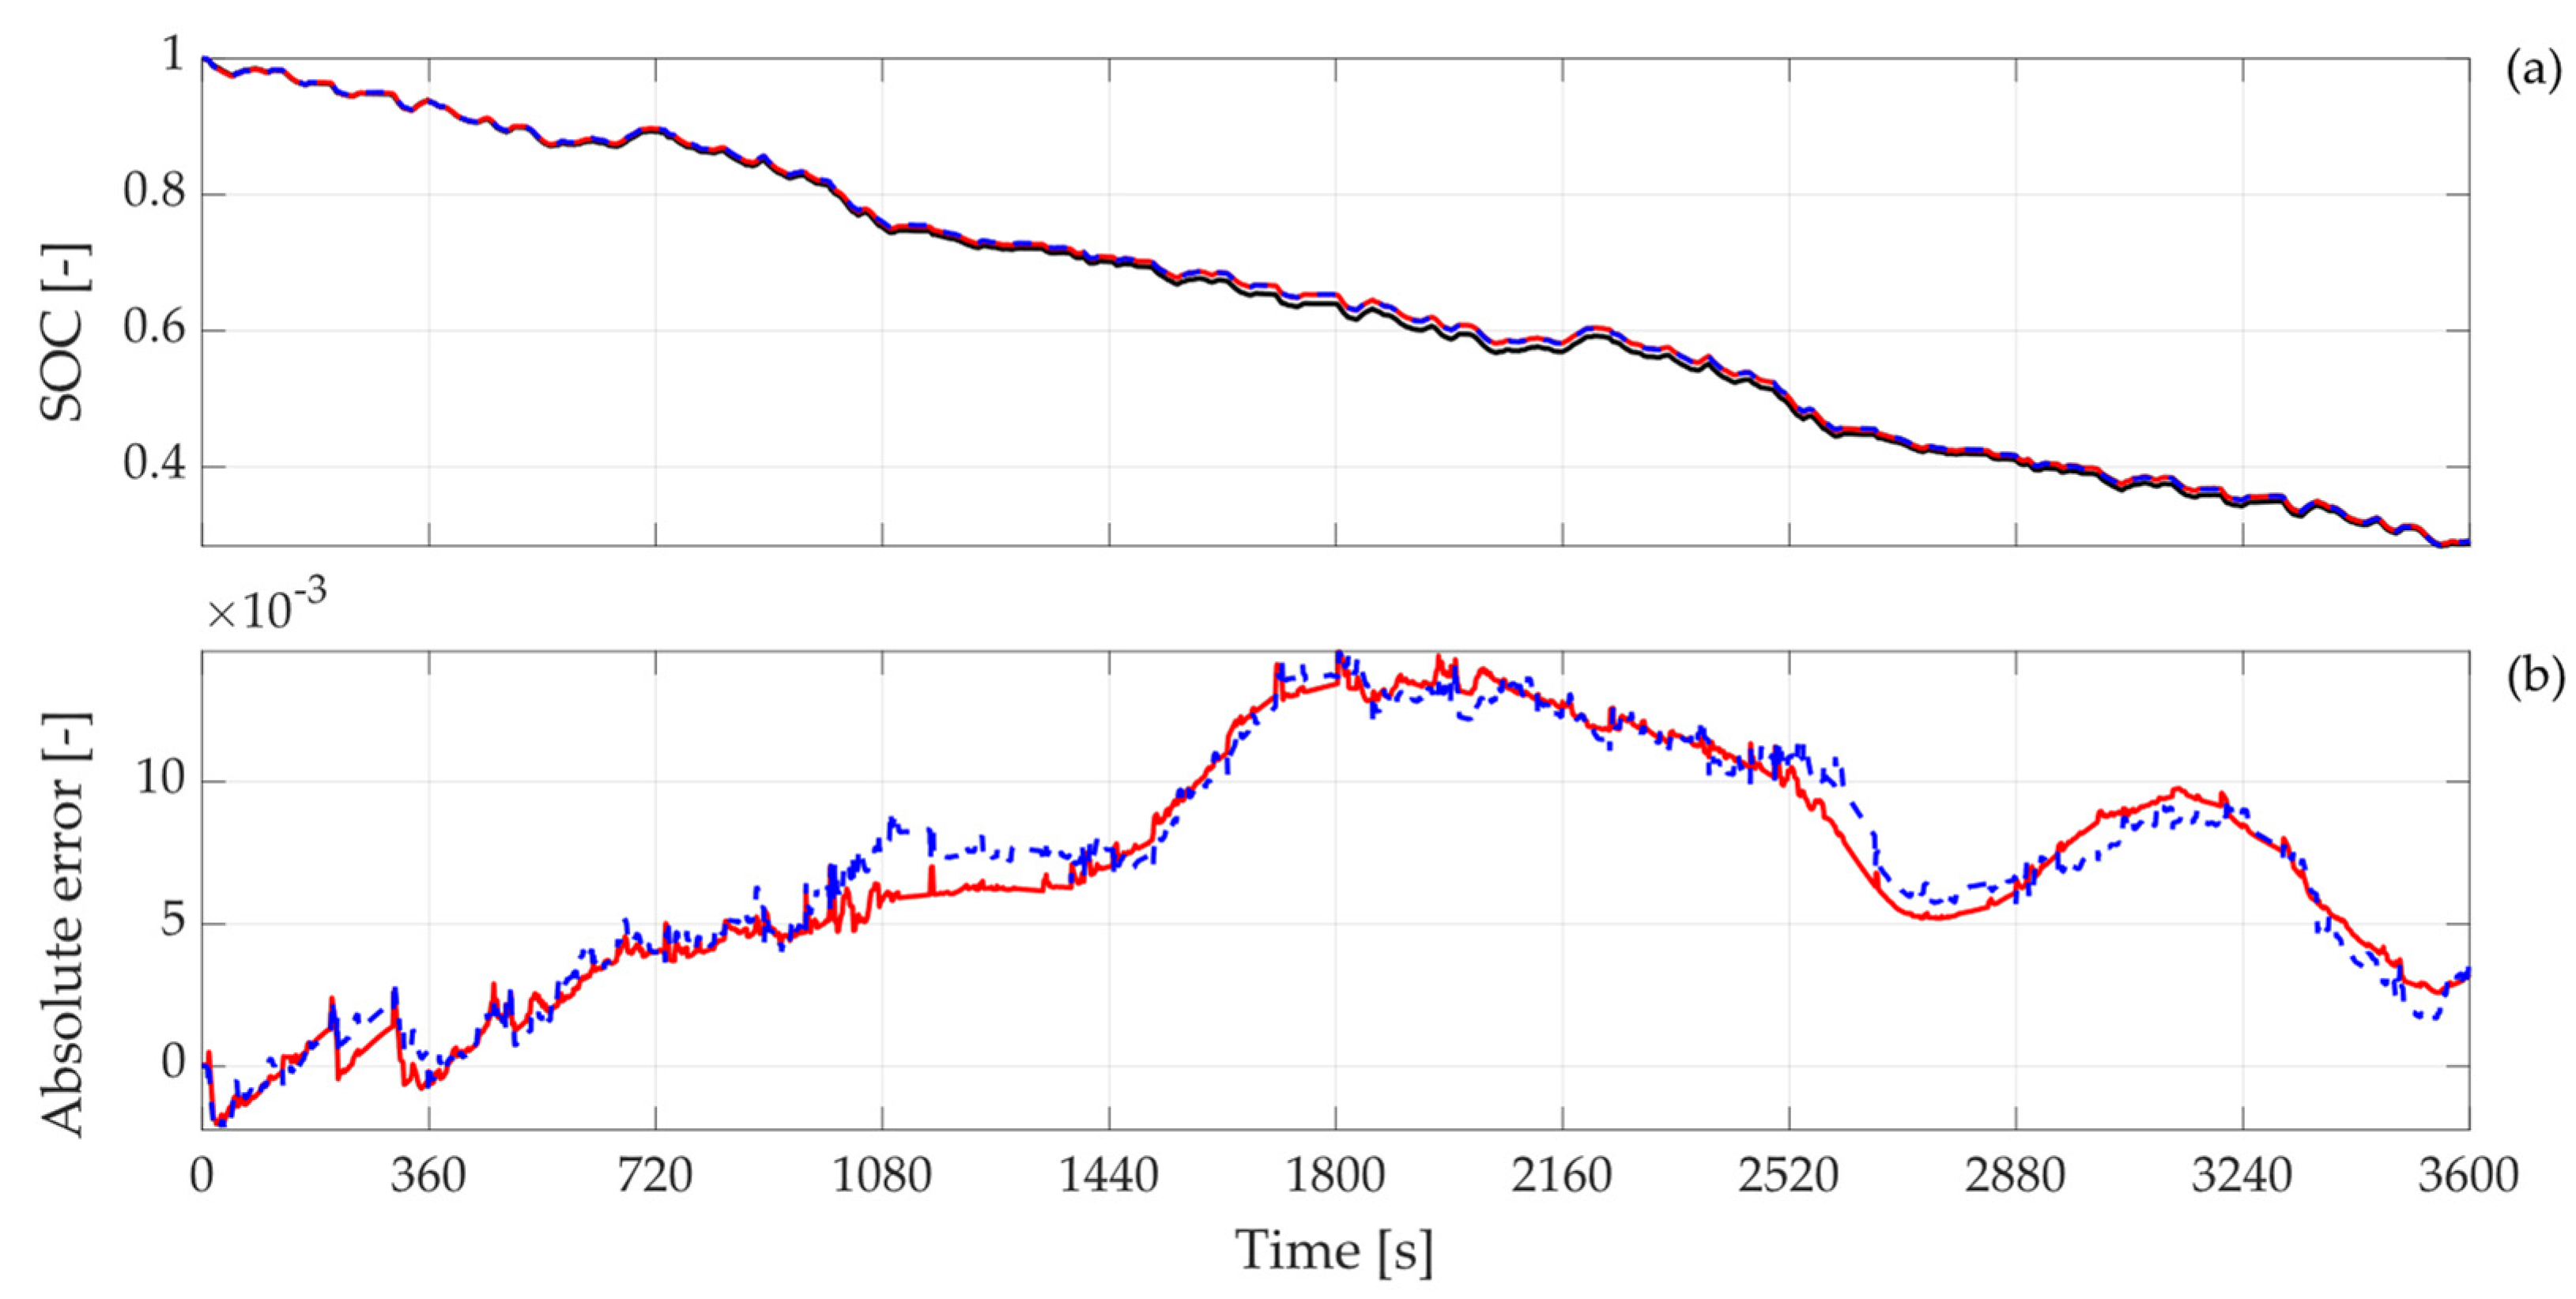
3.1. SOC Estimation Results

Figure 11, Figure 12, Figure 13 and Figure 14 represent the estimation results for the testing datasets A and B, when NARX RNN layouts 1 and 2 were used for the SOC estimation, respectively.
In each figure, subfigures (a) show the reference SOC (solid black line) from the numerical battery model, with respect to the SOC, estimated both by the ANN-based algorithm in a proper MATLAB/Simulink simulation environment (solid red line) and retained HIL configuration (dashed blue line), respectively.
The SOC values range from 1 to 0, where 1 means the battery is totally charged, and 0 indicates the battery is empty. Subfigures (b) show the absolute errors between the reference SOC and the estimated SOC, in both the simulation environment and the HIL configuration.
Figure 11 and Figure 12 refer to the NARX RNN layout 1; thus, the averaged values of current and voltage have not been taken into account. As shown in the figures, the SOC estimation is more accurate when dataset A is considered. Indeed, testing dataset A simulates a use-case similar to the one reported in the training dataset. However, even if the estimation error is bigger for testing dataset B, the estimation errors are generally quite low and always below 2%.
Figure 13 and Figure 14 refer to NARX RNN layout 2, in which the averaged values of current and voltage are two additional inputs for the algorithm. The averaged values are computed over a sliding window of 500 time steps, as performed in the training phase. In contrast to layout 1, the SOC estimation is more accurate, while considering the testing of dataset B. Nevertheless, the estimation errors are generally lower, with respect to the ones recorded for layout 1, as they are always below 1.5%.

3.2. Performance Analysis

The obtained results are evaluated, in terms of mean square prediction error (MSPE) and maximum absolute prediction error (MAPE), which are defined in the following equations, respectively:
M S P E = 1 / N i = 1 N ( y i y ¯ i ) 2
M A P E = m a x ( y y ¯ )
where N is the number of samples, y ¯ the reference output, and y the estimated value. The outcomes of the performed estimation accuracy analysis are reported in Table 5.
In detail, the analysis is performed for both the considered ANN layouts, and it is conducted both for the simulation environment and for the HIL validation. The results highlight that layout 2 is accurate in estimating the SOC in testing datasets A and B. Moreover, focusing on layout 1, which means that the averaged values of the current and voltage are not considered, the estimation accuracy is higher in dataset A, with respect to dataset B. This is because the training dataset is even more similar to the testing dataset A. Therefore, the layout 1 is less responsive to the different dynamics in dataset B, even though the MAPE values are always below 2% in the simulation environment and HIL validation and the MSPE values are quite low, in between 10 5 and 10 4 . Furthermore, layout 2, which also considers the current and voltage average values, shows better performance in MAPE and MSPE for both the testing datasets. The MAPE values are significantly low and, especially in dataset B, they are less than 1%, both in simulation and HIL testing configurations. The computed MSPE values are fairly negligible, as they are between 10 6 and 10 5 .

4. Conclusions

This paper presents the design and HIL assessment of a data-driven method for SOC estimation in lithium-ion batteries. The study was specifically conducted to evaluate the feasibility of the investigated algorithm in an industrial-grade framework, using state-of-the-art, real-time hardware, such as Raspberry Pi 4B and Speedgoat baseline, which have been connected via UDP protocol.
Specifically, the novel contribution of this work is the experimental validation of the proposed estimation method in a HIL configuration. The investigated method is specifically aimed at mild HEVs, and various real-world driving cycles, related to this application, were used to test the retained algorithms.
A lithium-ion battery that is used in real HEVs has been modeled, via an equivalent RC model, considering thermal influence to generate both training and validation datasets. Indeed, the retained ANNs have been trained and tested with driving cycles obtained from HEVs applications, during charge-sustaining and -depleting cycles. In detail, two alternative estimation architectures have been designed and compared during the validation procedure, in terms of estimation performance. Both are based on the NARX model that is implemented via ANNs. In terms of mean percentage error, the resulting estimation algorithm can estimate the battery SOC in real-time with 2% accuracy.
The proposed HIL architecture demonstrated that the estimation algorithm can provide relevant results within the investigated experimental framework, ensuring that the proposed data-driven algorithm, based on NARX ANNs, can be rapidly deployed, tested, and validated on state-of-the-art hardware platforms. This approach could ease the implementation on actual automotive ECUs used in the automotive industry. A further extensive experimental validation phase is needed before generalization of the approach to any automotive ECU, provided that a wide experimental campaign is conducted.

Author Contributions

Conceptualization, S.L., S.F. and A.B.; methodology, S.L., S.F. and A.B.; software, S.L. and S.F.; validation, S.L. and S.F.; investigation, S.L., S.F. and A.B.; writing—original draft preparation, S.L. and S.F.; writing—review and editing, S.L., S.F. and A.B.; supervision, A.B. and A.T.; project administration, A.B. and A.T. All authors have read and agreed to the published version of the manuscript.

Funding

This research received no external funding.

Acknowledgments

This work was developed in the framework of the activities of the Interdepartmental Center for Automotive Research and Sustainable Mobility (CARS) at Politecnico di Torino (www.cars.polito.it, accessed on 7 September 2021).

Conflicts of Interest

The authors declare no conflict of interest.

References

  1. Ehsani, M.; Singh, K.V.; Bansal, H.O.; Mehrjardi, R.T. State of the Art and Trends in Electric and Hybrid Electric Vehicles; IEEE: Piscataway, NJ, USA, 2021; Volume 109, pp. 967–984. [Google Scholar]
  2. Bishop, J.; Martin, N.P.; Boies, A.M. Cost-effectiveness of alternative powertrains for reduced energy use and CO2 emissions in passenger vehicles. Appl. Energy 2014, 124, 44–61. [Google Scholar] [CrossRef]
  3. Anderman, M. Status and Trends in the HEV/PHEC/EV Battery Industry; Rocky Mountain Institute: Snowmass, CO, USA, 2008. [Google Scholar]
  4. Chen, X.; Shen, W.; Vo, T.T.; Cao, Z.; Kapor, A. An Overview of Lithiumion Batteries for Electric Vehicles. In Proceedings of the IEEE IPEC Conference on Power and Energy, Ho Chi Minh City, Vietnam, 12–14 December 2012. [Google Scholar]
  5. Van Mierlo, J.; Berecibar, M.; El Baghdadi, M.; De Cauwer, C.; Messagie, M.; Coosemans, T.; Jacobs, V.; Hegazy, O. Beyond the State of the Art of Electric Vehicles: A Fact-Based Paper of the Current and Prospective Electric Vehicle Technologies. World Electr. Veh. J. 2021, 12, 20. [Google Scholar] [CrossRef]
  6. Bonfitto, A.; Ezemobi, E.; Amati, N.; Feraco, S.; Tonoli, A.; Hegde, S. State of Health Estimation of Lithium Batteries for Automotive Applications with Artificial Neural Networks. In Proceedings of the 2019 AEIT International Conference of Electrical and Electronic Technologies for Automotive (AEIT AUTOMOTIVE), Turin, Italy, 2–4 July 2019; pp. 1–5. [Google Scholar]
  7. Cardoso, D.S.; Fael, P.O.; Espírito-Santo, A. A review of micro and mild hybrid systems. Energy Rep. 2019, 6, 385–390. [Google Scholar] [CrossRef]
  8. Lo, E.W. Review on the configurations of hybrid electric vehicles. In Proceedings of the 2009 3rd International Conference on Power Electronics Systems and Applications (PESA), Hong Kong, 20–22 May 2009; pp. 1–4. [Google Scholar]
  9. Sabri, M.M.; Danapalasingam, K.; Rahmat, M. A review on hybrid electric vehicles architecture and energy management strategies. Renew. Sustain. Energy Rev. 2016, 53, 1433–1442. [Google Scholar] [CrossRef]
  10. Jayakumar, A.; Chalmers, A.; Lie, T.T. Review of prospects for adoption of fuel cell electric vehicles in New Zealand. IET Electr. Syst. Transp. 2017, 7, 259–266. [Google Scholar] [CrossRef]
  11. Lee, S.R.; Choi, B.Y.; Lee, J.Y.; Won, C.Y. 48 V to 12 V soft-switching interleaved buck and boost converter for mild-hybrid vehicle application. In Proceedings of the 2016 19th International Conference on Electrical Machines and Systems (ICEMS), Chiba, Japan, 13–16 November 2016; pp. 1–6. [Google Scholar]
  12. Leksono, E.; Haq, I.N.; Iqbal, M.; Soelami, F.N.; Merthayasa, I. State of Charge (SoC) Estimation on LiFePO4 Battery Module Using Coulomb Counting Methods with Modified Peukert. In Proceedings of the IEEE 2013 Joint International Conference on Rural Information & Communication Technology and Electric-Vehicle Technology, Bandung, Indonesia, 26–28 November 2013. [Google Scholar]
  13. Chang, W.-Y. The State of Charge Estimating Methods for Battery: A Review. ISRN Appl. Math. 2013, 2013, 1–7. [Google Scholar] [CrossRef]
  14. Rivera-Barrera, J.P.; Muñoz-Galeano, N.; Sarmiento-Maldonado, H.O. SoC Estimation for Lithium-ion Batteries: Review and Future Challenges. Electronics 2017, 6, 102. [Google Scholar] [CrossRef] [Green Version]
  15. Wei, Z.; Zhao, J.; Ji, D.; Tseng, K.J. A multi-timescale estimator for battery state of charge and capacity dual estimation based on an online identified model. Appl. Energy 2017, 204, 1264–1274. [Google Scholar] [CrossRef]
  16. Charkhgard, M.; Farrokhi, M. State-of-Charge Estimation for Lithium-Ion Batteries Using Neural Networks and EKF. IEEE Trans. Ind. Electron. 2010, 57, 4178–4187. [Google Scholar] [CrossRef]
  17. Jiang, C.; Taylor, A.; Duan, C.; Bai, K. Extended Kalman Filter based battery state of charge (SOC) estimation for electric vehicles. In Proceedings of the IEEE Transportation Electrification Conference and EXPO (ITEC), Detroit, MI, USA, 16–19 June 2013. [Google Scholar]
  18. Pérez, G.; Garmendia, M.; Reynaud, J.F.; Crego, J.; Viscarret, U. Enhanced closed loop State of Charge estimator for lithium-ion batteries based on Extended Kalman Filter. Appl. Energy 2015, 155, 834–845. [Google Scholar] [CrossRef]
  19. Wang, S.; Fernandez, C.; Shang, L.; Li, Z.; Li, J. Online state of charge estimation for the aerial lithium-ion battery packs based on the improved extended Kalman filter method. J. Energy Storage 2017, 9, 69–83. [Google Scholar] [CrossRef]
  20. He, Z.; Chen, D.; Pan, C.; Chen, L.; Wang, S. State of charge estimation of power Li-ion batteries using a hybrid estimation algo-rithm based on UKF. Electrochim. Acta 2016, 211, 101–109. [Google Scholar]
  21. Yu, Q.; Xiong, R.; Lin, C. Online Estimation of State-of-charge Based on the H infinity and Unscented Kalman Filters for Lithium-Ion Batteries. Energy Procedia 2017, 105, 2791–2796. [Google Scholar] [CrossRef]
  22. Ye, M.; Guo, H.; Xiong, R.; Yang, R. Model-based state-of-charge estimation approach of the Lithium-ion battery using an im-proved adaptive particle filter. Energy Procedia 2016, 103, 394–399. [Google Scholar] [CrossRef]
  23. Kim, T.; Wang, Y.; Sahinoglu, Z.; Wada, T.; Hara, S.; Qiao, W. State of Charge Estimation Based on a Realtime Battery Model and Iterative Smooth Variable Structure Filter. In Proceedings of the IEEE Innovative Smart Grid Technologies—Asia, Kuala Lumpur, Malaysia, 20–23 May 2014. [Google Scholar]
  24. Zou, Z.; Xu, J.; Mi, C.; Cao, B.; Chen, Z. Evaluation of Model Based State of Charge Estimation Methods for Lithium-Ion Batteries. Energies 2014, 7, 5065–5082. [Google Scholar] [CrossRef] [Green Version]
  25. Du, J.; Liu, Z.; Wang, Y.; Wen, C. A Fuzzy Logic-based Model for Li-ion Battery with SOC and Temperature Effect. In Proceedings of the 11th IEEE Conference on Control & Automation (ICCA), Taichung, Taiwan, 18–20 June 2014. [Google Scholar]
  26. Li, I.-H.; Wang, W.-Y.; Su, S.-F.; Lee, Y.-S. A Merged Fuzzy Neural Network and Its Applications in Battery State-of-Charge Estimation. IEEE Trans. Energy Convers. 2007, 22, 697–708. [Google Scholar] [CrossRef]
  27. Lin, F.-J.; Huang, M.-S.; Yeh, P.-Y.; Tsai, H.-C.; Kuan, C.-H. DSP-Based Probabilistic Fuzzy Neural Network Control for Li-Ion Battery Charger. IEEE Trans. Power Electron. 2012, 27, 3782–3794. [Google Scholar] [CrossRef]
  28. Bonfitto, A.; Feraco, S.; Tonoli, A.; Amati, N.; Monti, F. Estimation Accuracy and Computational Cost Analysis of Arti-ficial Neural Networks for State of Charge Estimation in Lithium Batteries. Batteries 2019, 5, 47. [Google Scholar] [CrossRef] [Green Version]
  29. Vidal, C.; Malysz, P.; Kollmeyer, P.; Emadi, A. Machine Learning Applied to Electrified Vehicle Battery State of Charge and State of Health Estimation: State-of-the-Art. IEEE Access 2020, 8, 52796–52814. [Google Scholar] [CrossRef]
  30. Zhang, W.; Li, X.; Ma, H.; Luo, Z.; Li, X. Transfer learning using deep representation regularization in remaining useful life prediction across operating conditions. Reliab. Eng. Syst. Safety 2021, 211, 107556. [Google Scholar] [CrossRef]
  31. Zhang, W.; Li, X.; Li, X. Deep learning-based prognostic approach for lithium-ion batteries with adaptive time-series prediction and on-line validation. Measurement 2020, 164, 108052. [Google Scholar] [CrossRef]
  32. Vidal, C.; Kollmeyer, P.; Naguib, M.; Malysz, P.; Gross, O.; Emadi, A. Robust xev battery state-of-charge estimator design using a feedforward deep neural network. SAE Int. J. Adv. Curr. Pract. Mobil. 2020, 2, 2872–2880. [Google Scholar]
  33. He, W.; Williard, N.; Chen, C.; Pecht, M. State of charge estimation for Li-ion batteries using neural network modeling and unscented Kalman filter-based error cancellation. Int. J. Electr. Power Energy Syst. 2014, 62, 783–791. [Google Scholar] [CrossRef]
  34. Venugopal, P. State-of-Health estimation of li-ion batteries in electric vehicle using IndRNN under variable load condition. Energies 2019, 12, 4338. [Google Scholar] [CrossRef] [Green Version]
  35. Ceven, S.; Bayir, R. Implementation of Hardware-in-the-Loop Based Platform for Real-time Battery State of Charge Estimation on Li-Ion Batteries of Electric Vehicles using Multilayer Perceptron. Int. J. Intell. Syst. Appl. Eng. 2020, 8, 195–205. [Google Scholar] [CrossRef]
  36. Tudoroiu, R.E.; Zaheeruddin, M.; Tudoroiu, N.; Radu, S.M. SOC Estimation of a Rechargeable Li-Ion Battery Used in Fuel-Cell Hybrid Electric Vehicles—Comparative Study of Accuracy and Robustness Performance Based on Statistical Criteria. Part I: Equivalent Models. Batteries 2020, 6, 42. [Google Scholar] [CrossRef]
  37. Huria, T.; Ceraolo, M.; Gazzarri, J.; Jackey, R. High fidelity electrical model with thermal dependence for char-acterization and simulation of high power lithium battery cells. In Proceedings of the 2012 IEEE International Electric Vehicle Conference, Greenville, SC, USA, 4–8 March 2012; pp. 1–8. [Google Scholar]
  38. Levenberg, K. A method for the solution of certain non-linear problems in least squares. Q. Appl. Math. 1944, 2, 164–168. [Google Scholar] [CrossRef] [Green Version]
  39. Marquardt, D.W. An Algorithm for Least-Squares Estimation of Nonlinear Parameters. J. Soc. Ind. Appl. Math. 1963, 11, 431–441. [Google Scholar] [CrossRef]
  40. Tetko, I.V.; Livingstone, D.J.; Luik, A.I. Neural network studies. 1. Comparison of overfitting and overtraining. J. Chem. Inform. Comput. Sci. 1995, 35, 826–833. [Google Scholar] [CrossRef]
Figure 1. Flowchart of the proposed approach for the estimation of the SOC.
Electronics 10 02828 g001
Figure 2. (a) 48 V Battery for the considered HEV; (b) equivalent electrical circuit including thermal modelling.
Electronics 10 02828 g002
Figure 3. Battery cell characteristics: (a) cell open-circuit voltage V O C vs. SOC; (b) internal resistance R 0 vs. SOC.
Electronics 10 02828 g003
Figure 4. HIL test architecture setup, exploiting UDP/IP connection between host PC and real-time target hardware: (1) Speedgoat baseline real-time target hardware machine; (2) target PC monitor; (3) Raspberry Pi 4B board.
Electronics 10 02828 g004
Figure 5. Considered NARX RNN architecture with two inputs.
Electronics 10 02828 g005
Figure 6. Considered recurrent ANN architecture with four inputs.
Electronics 10 02828 g006
Figure 7. Training dataset for NARX RNN—layout 1: (a) current, (b) voltage, (c) SOC.
Electronics 10 02828 g007
Figure 8. Training dataset for NARX RNN—layout 2: (a) current (solid black) and averaged current (dashed red), (b) voltage (solid black) and averaged voltage (dashed red), (c) SOC.
Electronics 10 02828 g008
Figure 9. Testing dataset A: (a) current (solid black) and averaged current (dashed red), (b) voltage (solid black) and averaged voltage (dashed red).
Electronics 10 02828 g009
Figure 10. Testing dataset B: (a) current (solid black) and averaged current (dashed red), (b) voltage (solid black) and averaged voltage (dashed red).
Electronics 10 02828 g010
Figure 11. Results on testing dataset A—NARX RNN layout 1: (a) reference SOC (solid black line) vs. simulation estimated SOC (solid red line), HIL estimated SOC (blue dashed line) (b) simulation absolute error (red solid line), HIL absolute error (blue dashed line).
Electronics 10 02828 g011
Figure 12. Results on testing dataset B—NARX RNN layout 1: (a) reference SOC (solid black line) vs. simulation estimated SOC (solid red line), HIL estimated SOC (blue dashed line) (b) simulation absolute error (red solid line), HIL absolute error (magenta dashed line).
Electronics 10 02828 g012
Figure 13. Results on testing dataset A—NARX RNN layout 2: (a) reference SOC (solid black line) vs. simulation estimated SOC (solid red line), HIL estimated SOC (blue dashed line) (b) absolute simulation error (solid red line), HIL absolute error (blue dashed line).
Electronics 10 02828 g013
Figure 14. Results on testing dataset B—NARX RNN layout 2: (a) reference SOC (solid black line) vs. simulation estimated SOC (solid red line), HIL estimated SOC (blue dashed line) (b) absolute simulation error (solid red line), HIL absolute error (blue dashed line).
Electronics 10 02828 g014
Table 1. Main parameters of the retained battery model.
ParameterSymbolValueUnit
Nominal voltage V N 51.2V
Nominal capacity C N 25Ah
Ambient temperature T a m b 298K
Cell battery massm0.05kg
Specific heat capacity c p 925 J / kgK
Surface area A 15.3 × 10 3 m 2
Thermal time constant τ t h 2000s
Thermal resistance R t h 279K/W
Horizontal heat transfer coefficient h 5 W m 2 · K
Table 2. Hardware technical specifications.
Raspberry Pi 4BSpeedgoat Baseline
CPUBroadcom BCM2711 quad-core
Cortex-A72 64-bit SoC @ 1.5 GHz
Intel Celeron 2 GHz 4 cores
Memory4 GB LPDDR44 GB DDR3
NetworkBluetooth 5.0Gigabit Ethernet 2 (Intel I210)
Gigabit Ethernet
I/OUSB, 40-pin GPIO header4 × mPCIe
OSDebian, Raspberry Pi OSSimulink Real-Time™
Power5 V DC via USB-C connector8–36 VDC Input Range
Table 3. NARX RNN—layout 1: parameters used for training and deployment.
ParameterValue
Training PhaseDeployment Phase
Number of hidden layers1 to 51
Number of neurons/hidden layer1 to 2011
Number of epochs30003000
Mean squared error training goal 9 × 10 15 9 × 10 15
Min. cost function gradient 9 × 10 12 9 × 10 12
Input buffers0 to 100
Output buffers0 to 101
Table 4. RNN—Layout 2: parameter values for training and final deployment.
ParameterValue
Training PhaseDeployment Phase
Number of hidden layers1 to 51
Number of neurons/hidden layer1 to 206
Number of epochs30003000
Mean squared error training goal 9 × 10 15 9 × 10 15
Min. cost function gradient 9 × 10 12 9 × 10 12
Input buffers0 to 100:1
Output buffers0 to 101:2
Table 5. Estimation accuracy analysis, in terms of MSPE and MAPE.
Layout ErrorDataset ADataset B
Layout 1SimulationMSPE 6.51 × 10 5 1.54 × 10 4
MAPE 1.46 × 10 2 1.64 × 10 2
HILMSPE 6.74 × 10 5 1.99 × 10 4
MAPE 1.48 × 10 2 1.81 × 10 2
Layout 2SimulationMSPE 3.74 × 10 5 1.33 × 10 5
MAPE 1.42 × 10 2 0.68 × 10 2
HILMSPE 3.83 × 10 5 1.81 × 10 5
MAPE 1.46 × 10 2 0.77 × 10 2
Publisher’s Note: MDPI stays neutral with regard to jurisdictional claims in published maps and institutional affiliations.

