1. Introduction
Cyberbullying is a critical cybersecurity threat continuously targeting more Internet users–social media users in particular [
1,
2,
3]. Debatably, hostile behavior by one person or group of people, known as bullying, that can be limited to particular scenes or specific times of the day (e.g., school hours) can instead take place anywhere and anytime by electronic means [
4,
5,
6,
7]. At the beginning of the 20th century, cyberbullying was not treated seriously when Internet usage (i.e., social media in particular) was still in its infancy. The idealistic suggestion to treat cyberbullying at that time was “disconnect” or “just turn off the screen”. However, as online hate speech consequences reach predominant levels, these suggestions become inoperative. To avoid cybercrime, it is not enough to only follow the typical recommended cybersecurity standards and rules [
8]. In 2017, 41% of United States citizens personally encountered online harassment, whereas 66% observed online hate speech directed at others. In addition, it has been reported that approximately 50% of young people who use social media platforms are cyberbullied in different forms [
9]. Famous social media sites such as Twitter are not invulnerable to this threat [
10].
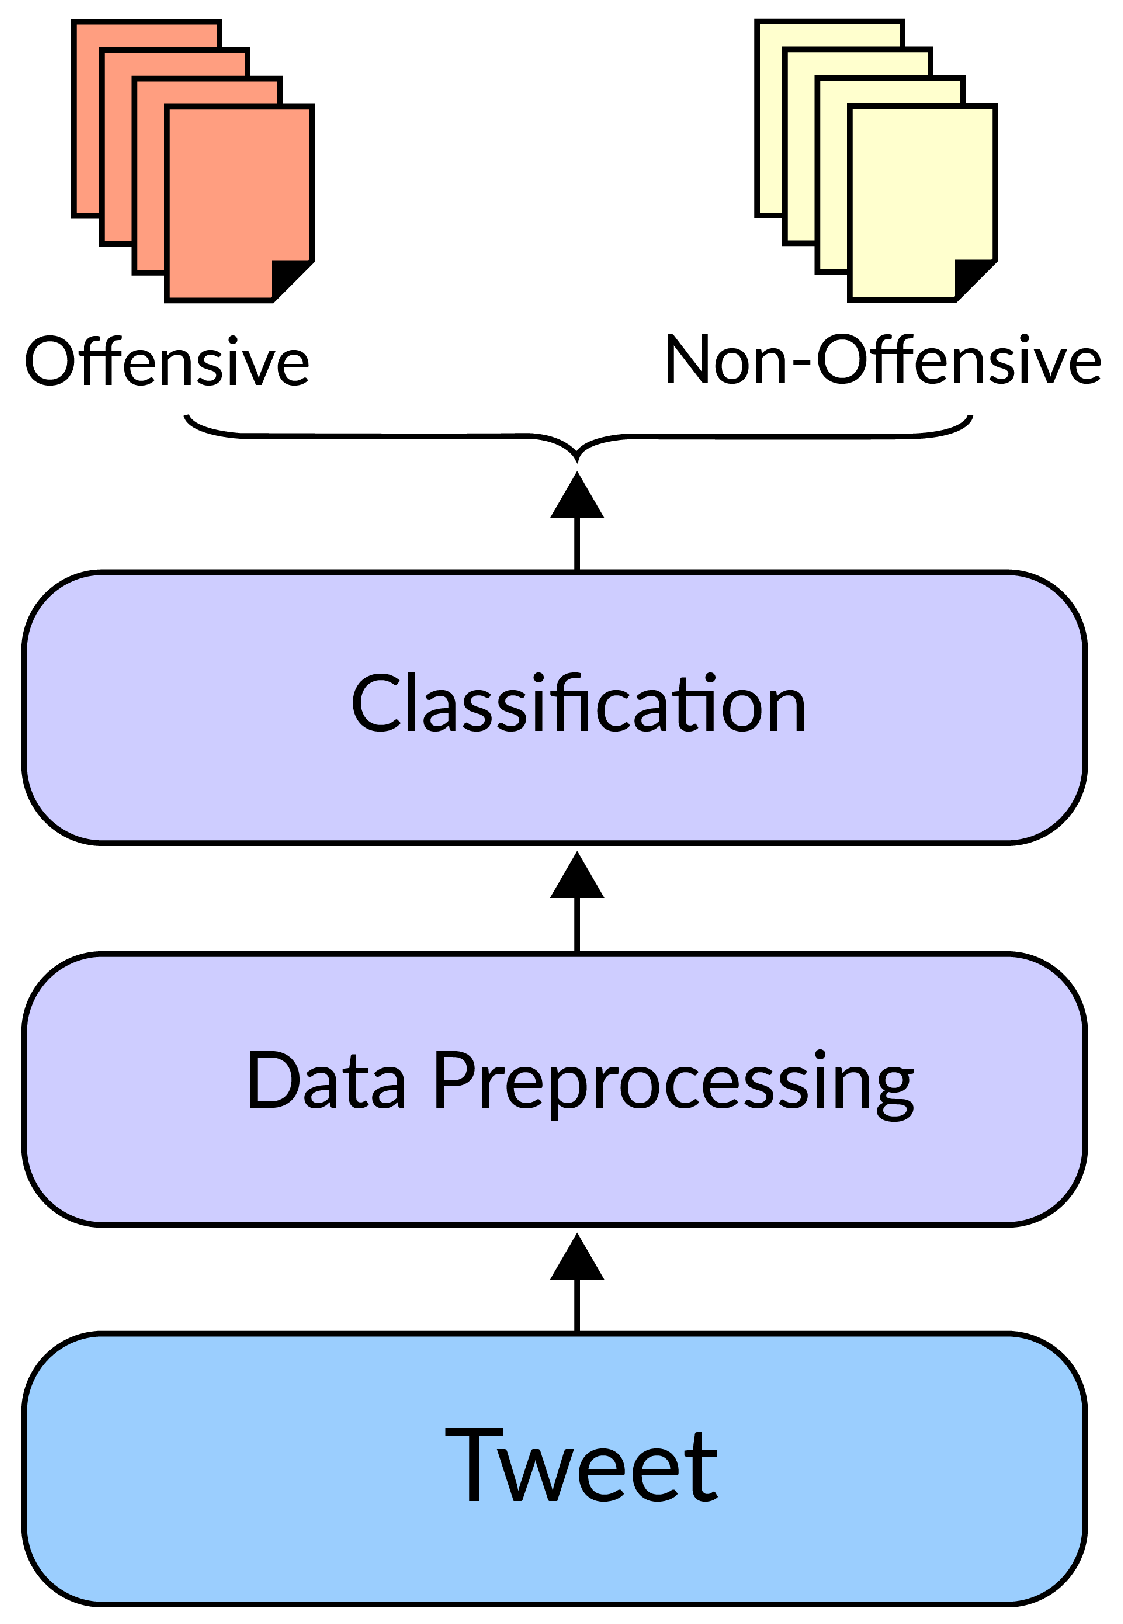
Cyberbullying detection has become an important natural language processing (NLP) topic [
11]. Like other NLP tasks, the aim of cyberbullying detection is to preprocess the text (e.g., a tweet) and extract meaningful information in a way that makes it possible for the machine learning algorithm to understand and classify each text. The traditional strategies for text classification utilize a technique to simplify the representation of text (e.g., bag of words (BoW)) followed by a machine learning classifier (e.g., support vector machine (SVM) or logistic regression (LR)) [
12] as shown in
Figure 1. Although traditional NLP techniques have become highly successful in detecting social media cyberbullying, there are still some challenges that need to be addressed: the short text allowed by social media platforms, imbalance between aggressive and nonaggressive comments, natural language ambiguity, and excessive use of slang [
13].
In the last decade, neural network-based models have achieved superior results on several NLP tasks compared to traditional machine learning techniques. These NLP techniques rely on dense vector representations provided by neural networks and deep learning in particular and the considerable success of word embeddings [
14]. Unlike traditional machine learning algorithm-based approaches that depend heavily on handcrafted features that are considered incomplete and time-consuming, deep learning-based techniques utilize multilevel automatic feature representation to discriminate the input. Recently, neural network models such as multilayer perceptron (MLP), Recurrent neural networks(RNN), and CNN-based models have achieved promising results in various NLP tasks. Xiao and Cho [
15] proposed a distinctive method to classify text as a characterwise approach using a combination of a CNN model and RNN architecture. Another unique method was proposed by Tai et al. to classify text sentence by sentence to learn text semantics utilizing long short-term memory (LSTM) and then use CNN to extract local features from expressions [
16]. Motivated by the considerable success presented by several deep learning architectures in the NLP research area where the task is to classify a lengthy text, we investigate the potential of classifying short text using the idea of the multichannel deep learning model based on three advanced deep learning architectures, namely, bidirectional LSTM (BiLSTM), transformer block, and CNN.
This research paper is organized as follows. In the next
Section 3, a brief survey of the literature is carried out to pinpoint the strengths and weaknesses of cyberbullying detection approaches.
Section 4 presents the combined deep learning method.
Section 5 present the dataset used to evaluate the proposed method.
Section 6 introduces and discusses the results and compares them with closely related approaches.
Section 7 concludes our research paper.
Section 8 discusses future work.
1.1. Research Problem
Automatic detection of cyberbullying utilizing natural language processing (NLP) advanced mechine learning method on Online social networks such as Twitter platform is a necessary and an important. Moreover, the existing dataset that used to train the mechine learning model are limited. Thus, it is very critical to have large dataset that can cover many cyberbullying cases.
1.2. Research Contribution
Our research contribution can be summarized as follow:
2. Background of Deep Learning and Cyberbullying
Deep learning is a new discipline within machine learning field. Deep learning algorithms inspired by the structure and function of the brain are called artificial neural networks. Moreover, deep learning algorithms are trained to extract and understand the meaningful representations from the data itself rather than performing straightforward classic programmed instructions.
Meaningful representation is acquired by composing simple but non-linear modules that each transforms the representation at one level (starting with the raw input data) into a representation at a higher level.
Thus, deep learning algorithms have been shown to be successful at classifying all kinds of data. These algorithms can be classified into three types: Learning that can be supervised, semi-supervised or unsupervised. In this paper, we adapted the supervised learning type where the training data is labeled. Moreover, Deep Learning requires large amounts of data and powerful computation hardware, such as a powerful graphics processing unit (GPU).
On the other hand, cyberbullying on social media is bullying that takes place over digital devices using online social media platforms. It can take on many forms, including personal attacks, harassment, or discriminatory behavior, negative and hateful messages, spreading defamatory information, misrepresenting oneself online, spreading private information, social exclusion, and cyberstalking. Moreover, it is very challenging to deal cyberbullying social media platforms. Thus, deep learning can provide a potential solution to this issue.
3. Related Work
In this section, cyberbullying detection approaches focusing on online social network (OSNs) are reviewed. Dinakar et al. [
20] divided cyberbullying occurrence into various themes, including race, sexuality, culture, and intelligence. Consequently, they utilized some controversial videos from YouTube as a use case to classify the comments posted on them using four different classifiers (Naive Bayes (NB), Rule-based Jrip, Tree-based J48, and SVM). The dataset has around 50,000 comments and divided into 50% training, 30% validation and 20% testing. However, the best accuracy as obtained by Rule-based Jrip has not exceeded 80%. Hee et al. [
21] proposed a technique to detect fine-grained types of cyberbullying, such as insults and threats. The authors utilized cyberbullying content that has linguistic characteristics similar to those found in OSNs; this content (English and Dutch) was extracted from the Ask.fm website. The authors categorized the potential subjects of a cyberbullying conversation into three classes: harasser, victim, and bystander. The bystander class was split into two categories: the bystander who defends the victim, i.e., bystander-defender, and the bystander who encourages the harasser, i.e., bystander-assistant. Then, SVMs were used to differentiate the comments. However, in this paper we will focus on the detection of cyberbullying on Twitter. Detection of bullying words in the tweet contents is more challenging.
Sanchez et al. [
22] were one of the first to propose a method to detect cyberbullying on the Twitter platform. The authors utilized the NB classifier to detect tweets that contained abusive behavior toward a specific gender. However, their method achieved only an accuracy of 70% and the size of the used dataset is relatively small. Moreover, the abusive cases should be generalized and not limited to specific topic so that it cover wide cases of cyberbullying. Saravanarj et al. [
23] suggested general framework to detect rumor, bullying tweets using both NB and RF classifiers and word2vec as a feature representation method. They also suggested that the framework can extract demographics about the abusers, such as name, gender, and age. However, the suggested methods can not give accurate results when compared to more advanced machine learning algorithm such as deep learning. Al-garadi et al. [
24] presented a method that uses various unique features belonging to the Twitter platform, such as activity, network, user, and tweet, as a feature set to detect cyberbullying in Twitter. These features, along with their associated samples, were fed into a machine learning algorithm for classification purposes. The authors investigated four machine learning algorithms, i.e., RF, NB, SVM, and KNN, and found that the RF is the best performing algorithm in terms of the f-measure and area under the receiver operating characteristic curve. The authors used data set contains 10,007 tweets where the number of bullying tweets is only around 599 tweets.
Balakrishnan et al. [
25,
26] utilized the Big Five (e.g., extraversion, specifically, agreeableness, and neuroticism) and Dark Triad (e.g., psychopathy) models to determine the personality of Twitter users and sequentially detect cyberbullying. The objective of the proposed method was to investigate the relationship between cyberbullying and personality traits. The authors categorized the tweets into four categories representing the behavior of the user, namely, bully, spammer, aggressor, and normal. The authors then used the random forest RF ensemble method to classify each tweet into one of the previously mentioned classes. The proposed method using these personality traits achieved good results. However, the dataset contained 5453 tweets, collected using the hashtag (Gamergate), which still relatively small amount. Also, the tweets is narrowed to specific community (using the hashtag (Gamergate)) while it should be more generalized.
Chatzako et al. [
2,
9] analyzed a large number of Twitter comments to recognize abusive behavior characteristics. These tweets were extracted from users who participated in different topics, such as the National Basketball Association (NBA), the Gamergate controversy, and comments on gender pay inequality programs at British Broadcasting Corporation (BBC) stations. The authors investigated several features extracted from Twitter, such as tweets, network-based features, and user attributes. Then, they tried different state-of-the-art classification methods to distinguish user accounts and accomplished an accuracy of 91%.
Gamback et al. [
27] presented a deep learning detection system to identify Twitter cyberbullying comments. This system classified the comments into one of four possible categories: sexism, racism, both (i.e., sexism and racism), and non-offensive comments. For text representations, the authors utilized character four-grams. The authors also used word2vec for semantic analysis. Then, the authors reduced the feature set using one of the capabilities provided by a CNN layer (i.e., maxpooling layer). Consequently, they classified each tweet using a softmax function. The proposed method achieved an F-score of 78.3% when evaluated using 10-fold cross validation. The authers used datasets consist of 6655 tweets.
Sadiq et al. [
12] investigated a neural network model and two deep learning architectures to detect cyberbullying presented on Twitter comments. The investigated neural network approach is known as MLP, and the two deep learning architectures are CNN-LSTM and CNN-BiLSTM. Both of the deep learning approaches achieved promising results of approximately 92% accuracy.
Pradhan et al. [
28] examined the effectiveness of self-attention models (these models achieved state-of-the-art results in various machine translation tasks) in cyberbullying detection. The authors explored the usefulness of a self-attention model known as transformer architecture using three data sources: Formspring, Wikipedia, and Twitter cyberbullying datasets. This architecture replaced the recurrent layers used for encoding and decoding by a multiheaded self-attention layer. The proposed method yielded satisfactory results. Agrawal et al. [
29] presented a framework and proved experimentally that this approach could overcome some existing approach limitations, such as restricting the detection to a specific social media platform, shortening the detection to a single kind of hate speech (i.e., cyberbullying), and depending on handcrafted features that conventional machine learning algorithms have to offer. The authors investigated four deep learning architectures to overcome these limitations, namely, CNN, LSTM, and BiLSTM with an attention layer. The authors also classified hate speech in social media platforms into four categories: bullying, racism, sexism, and attack. They also utilized transfer learning to divert knowledge learned by deep learning on a specific dataset to another similar dataset. The investigated architectures went through extensive experiments on three different datasets: Twitter, Wikipedia, and Formspring. The authors of [
28,
29] used twitter data set which contain around 16 k tweets.
Plaza et al. [
30] proposed an approach to detect cyberbullying in social media that is related to Spanish content. The authors investigated some deep learning techniques to identify Spanish hate speech. In particular, the authors utilized transfer learning to address the limited number of sample problems by pretraining the deep learning models to improve the performance. The authors also compared the performance of pretrained deep learning models such as CNN, LSTM, BiLSTM, bidirectional encoder representations from transformers (BERT), and Enhanced-BERT models with conventional machine learning methods such SVM and LR. The experiments showed that applying pretrained models along with BERT approaches improved the accuracy performance compared to the other deep learning and conventional models. The authors used small dataset of only around 8710 tweets. Summery of the related methods is showing in
Table 1.
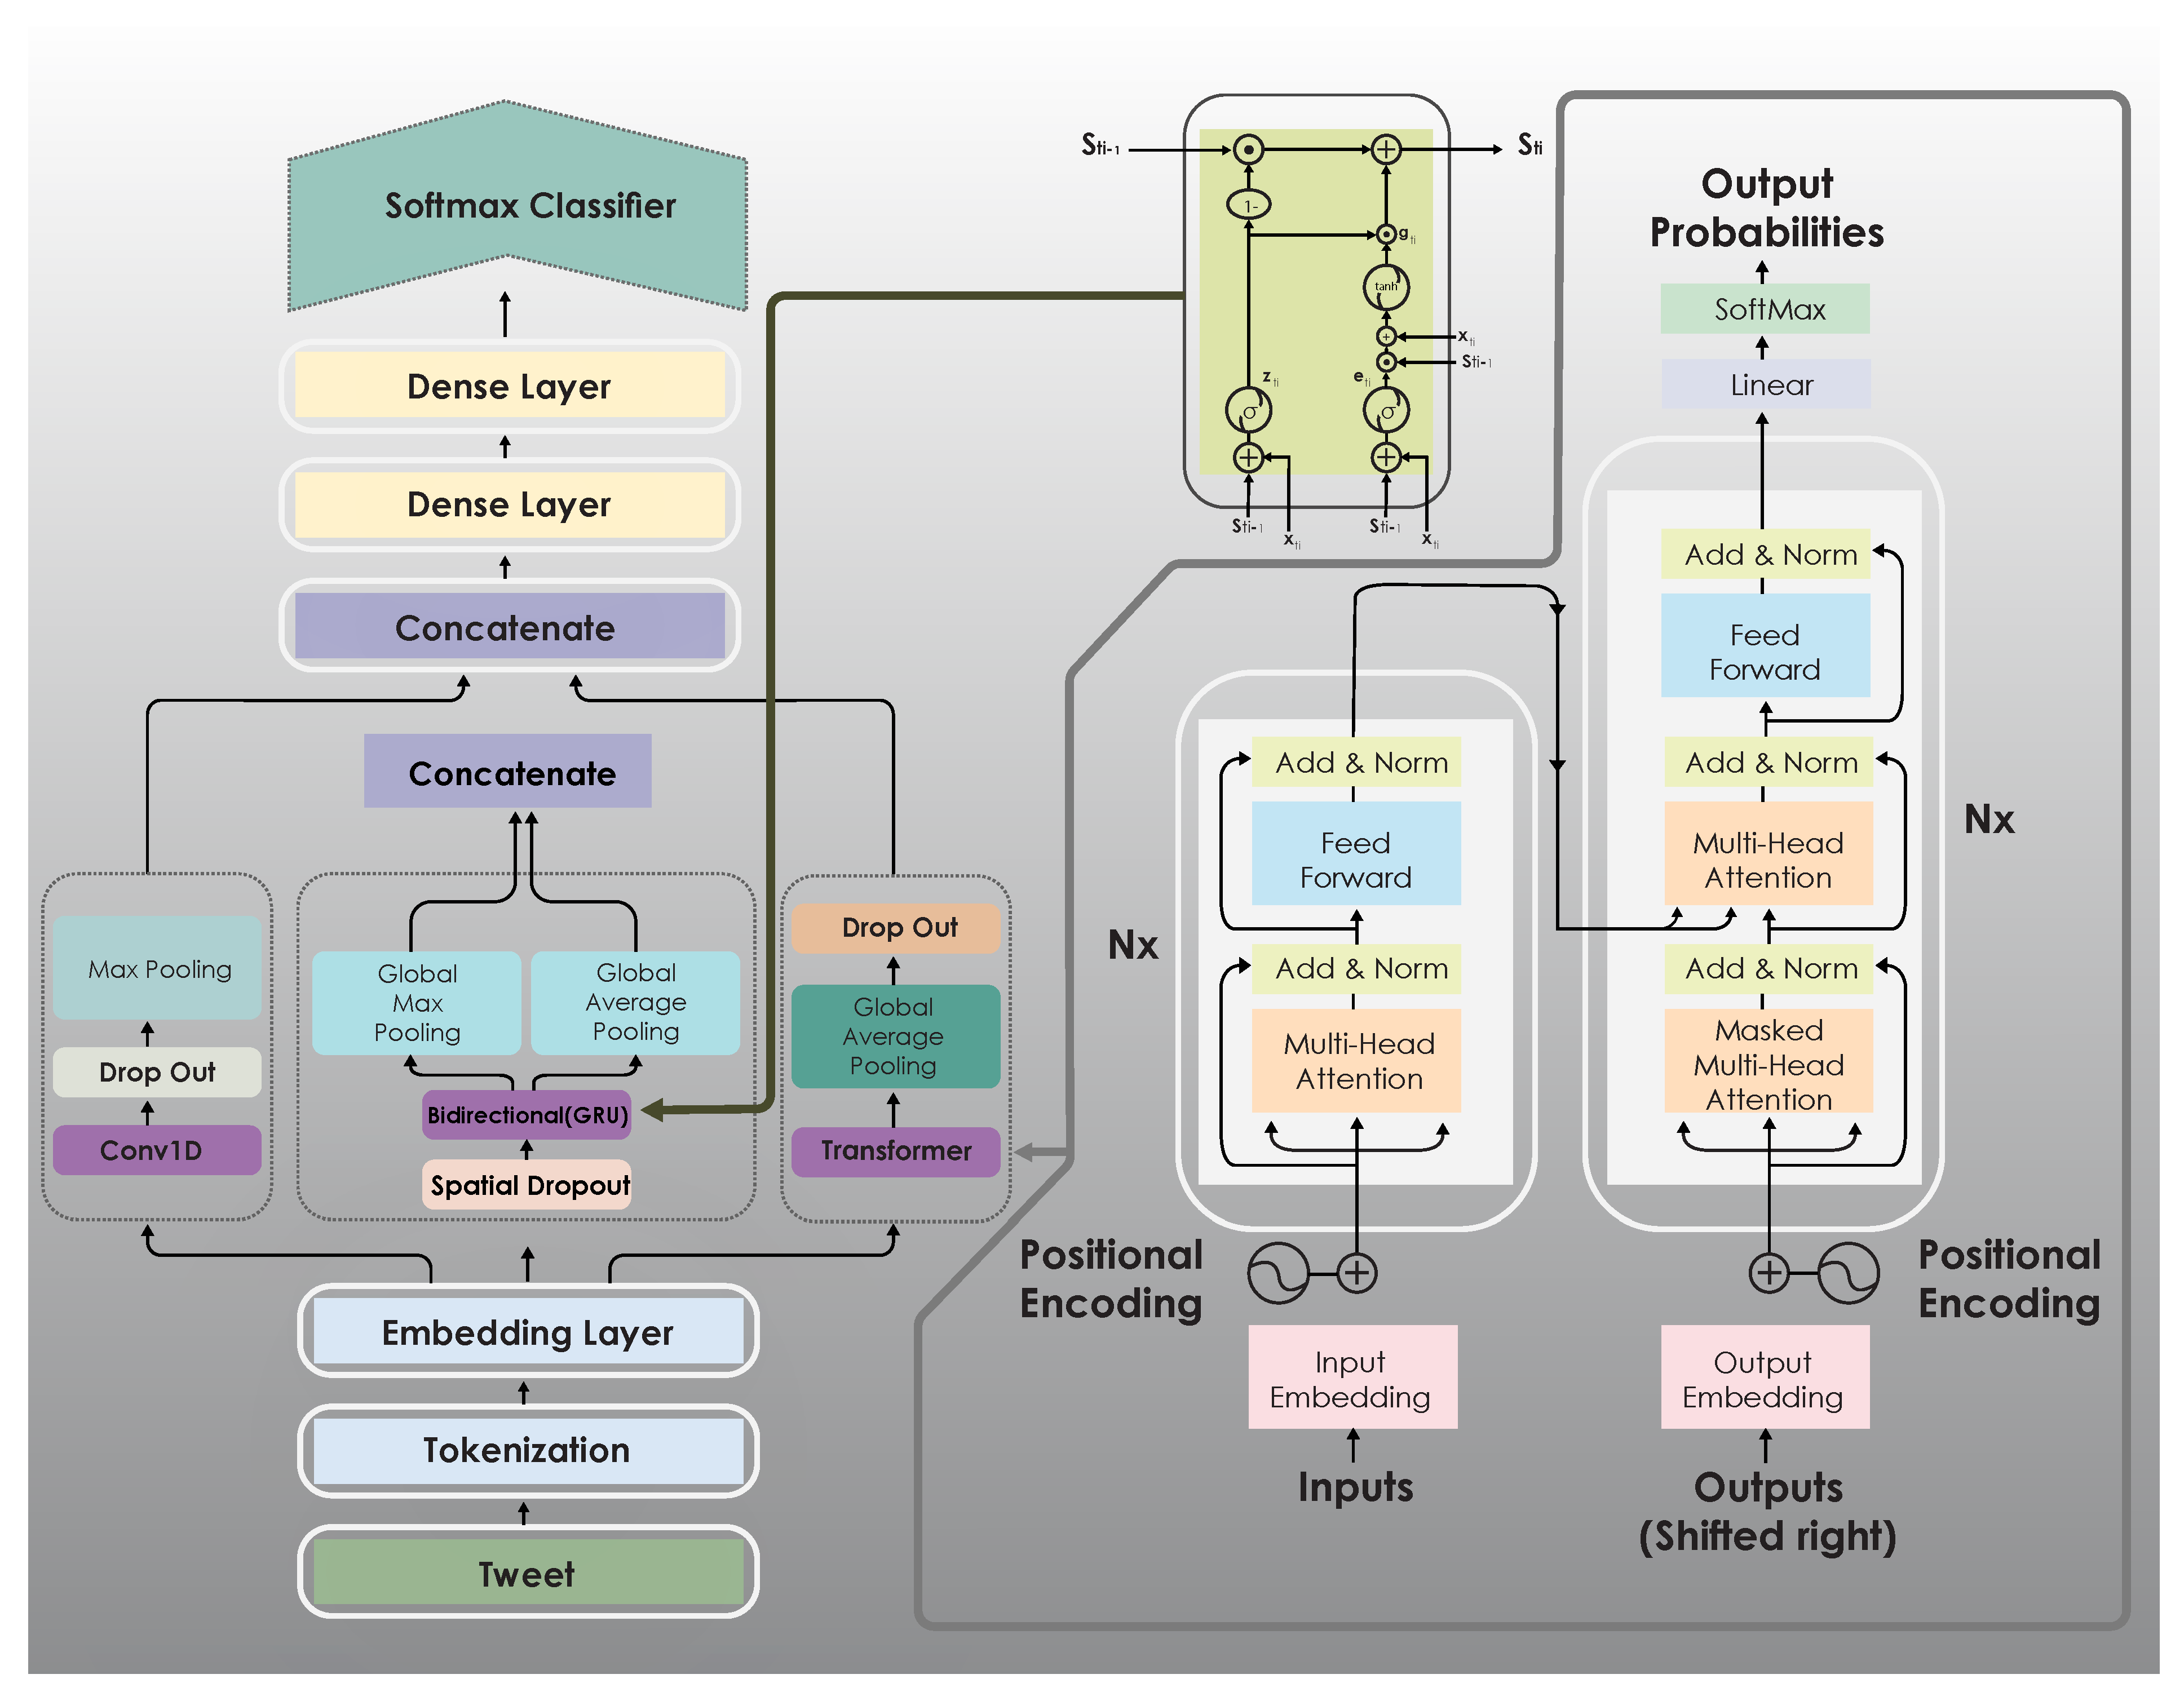
4. Proposed Multichannel Deep Learning Framework
In this work, we used and integrated the idea of the multichannel technique, where three models that contribute to the final prediction given as:
Different from other existing methods, our proposed combined the power of three advanced deep learning model namely: The transformer block, BiGRU, CNN architecture. Thus, it has the ability to extract the meaningful features and can give accurate results. In the following sections, we describe each of them in more detail.
4.1. Transformer Block
The transformer method is one of the advanced deep learning models proposed for NLP applications and particularly for machine translation. It has achieved the state of art on the workshop on statistical machine translation 2014 English-to-French translation task as well as many other tasks. Vaswani et al. [
31]. It highly depends on the idea of stacked attention and the fully connected layers to compute representations of its input and output for both the encoder and decoder. The encoder has encoding layers that process the input, and the decoder has decoding layers that process the output of the encoder.
The architecture of the transformer is shown on the left side of
Figure 2. Unlike RNNs and LSTM, the transformer enables fast computation using parallel computing, which speeds up the training process. The attention mechanism can deal with the limitations of the encoder-decoder model on long sequences and thus speed up the learning process and improve model performance on any prediction problem.
The main building blocks of the transformer are scaled dot-product attention units and multihead attention (MHA). In addition, the model consists of encoder and decoder stacks, embeddings, a fully connected feed-forward network, and softmax. The scaled dot-product in the transformer can be calculated as:
where
a denotes each attention unit,
q is a query,
k is a key,
v is a value,
is softmax, and
is the dimensionality of the key vector.
The attention weights are divided by the square root of the dimension of the key vectors The softmax function in the equation normalizes the weights to a sum of 1. MHA is calculated as in (
2)
where
is calculated as follow:
and
correspond to the weight matrices to be learned.
Although the transformer uses only the attention mechanism without RNN, it is still powerful enough to outperform NLP deep models such as LSTMs and gated recurrent unit (GRUs) on many tasks.
For each token in the transformer block (T-block), we set the embedding size to 40, and we set the number of neurons of the hidden layer inside the transformer to 32.
4.2. Bidirectional Recurrent Neural Networks
In our model, the bidirectional network starts with a spatial dropout layer, which performs dropout on entire feature maps rather than individual elements. Then, the output of this layer is fed to the bidirectional RNN (BiRNN) layer [
32] based on the GRU, which connects two hidden layers (forward and backward) of opposite directions to the same output. After that, the output of the BiRNN layer is fed the global average pooling layer and global maximum pooling layer simultaneously, and the outputs of the two layers are combined to form new input to the next stage, as shown in
Figure 2.
Each input feature map is divided into many windows or partitioned into feature map grids (windows). The average pooling function calculates the average of a window of size
n as follows:
The max-pooling picks the number that has the maximum value from the input window . The intention of both average pooling and max pooling is to reduce the dimensionality of the data without losing essential information.
The function of the single GRU cell, which is explained in [
33,
34], is as follows:
where
is the input to the GRU cell at time
.
,
and
are the weight matrices that receive input
.
,
and
are the weight matrices that receive input from the previous cell state vector.
is a hyperbolic tangent activation function, and is a sigmoid activation function. , , and are the bias units. is the output at time . ⊙ refers to the Hadamard product.
In BiRNNs, each GRN cell calculates the hidden state in the forward direction
and the backward direction
Thus, the BiGRU can take advantage of features in both directions. The following equation explains the idea of BiRNNs.
where ⊕ denotes the elementwise sum for both vectors from both directions left and right.
Figure 2 shows the architecture of the GRU.
4.3. Basic CNN Architecture
We also have a simple CNN, which has one CNN layer. The layer has 32 filters, each with a size of 4, and the activation ReLU is applied. Each filter in CNN takes input
x and convolves
with the filer map
WThen, the bias unit
b adds the feature map
and applies the ReLU activation function, as shown in (
11)
Filters in the CNN layer are randomly initialized at the beginning of the training process using the Glorot normal initializer [
35] After that, the dropout technique is applied at 50%, and the output is fed to the max pooling layer, which has a pool (window) size of 2.
4.4. Multichannel
In this paper, we introduce a multichannel deep learning model that uses three networks, namely, CNN, BiRNN, and a transformer block, to process the input jointly. Our model is shown in
Figure 2. Each network produces output, which is combined and fed to fully connected layers, which are two dense layers. The first dense layer has 60 neurons, and the second has 30 neurons. Then, the output is fed to the softmax classifier. Softmax classifies the input data into one of two classes: cyberbullying or not.
The outputs of the three networks are combined using the concatenate layer. If there are three output vectors
, where the vector
U is as follows
the vector
I is as follows
and the vector
O is as follows
then the concatenate layer would combine them into one vector as follows:
The result V would be as follows:
Dense layer calculates its output
as follows:
where
w is the weights multiplied by the input value and the
b is added after that, the activation function is applied at the end.
In this model, we choose to use a binary cross-entropy loss function since we are dealing with a binary classification problem. The Equation (
14) explains the process of the entropy loss function.
where
c is the index for the classes. We have two classes in this problem.
y is the correct value for class
c,
s is the predicted probability for class
c, and
x is the current input data. Moreover, we use the Adam optimizer to optimize the network. The total number of trainable parameters in our proposed model is 17,868,016.
5. Testing
In this section, we present the dataset used to evaluate the proposed method. Subsequently, we discuss the data preprocessing used to prepare the raw text to be fed into our model. This section concludes with information on the equipment utilized to train our model and validate its effectiveness.
5.1. Dataset
Our data are taken from three sources, [
17,
18,
19], which have been combined to form a dataset of 55,788 tweets. The dataset is divided into two categories: offensive and non-offensive.
Table 2 shows more details about our datasets in which the percentage of offensive samples is 65.8% (i.e., 23,548) and the percentage of the non-offensive samples is 34.2% (i.e., 12,239).
Offensive: tweets that appear to be cyberbullying behavior. Tweets with negative content that have been posted to insult or harm other people.
Non-offensive: tweets that appear to be ordinary (i.e., do not manifest cyberbullying behavior). Tweets with normal content posted with no intent to insult or harm other people.
5.2. Data Preprocessing
Tokenization or (lexical analysis) is the procedure of transforming a sequence of characters into a sequence of tokens. We converted all the collections of text (tweets) to a sequence of tokens. This procedure vectorizes a text collection by turning every text into a sequence of integers. We set the maximum number of words to keep during the tokenization to 80,000 words.
5.3. Equipment and Tools
The proposed method was implemented using the Python programming language. Several Python libraries were utilized for data cleaning, preprocessing, and model implementation. The data were preprocessed using the pandas library [
36]. The deep multichannel model was implemented utilizing the Keras library [
37] and evaluated using the scikit-learn library [
38]. We utilized the tensor processing unit (TPU) provided by Google Colab, which is an open source iPython notebook that runs on the cloud to facilitate collaboration, instead of a graphics processing unit to validate our proposed method. We trained our method using a batch size of 100.
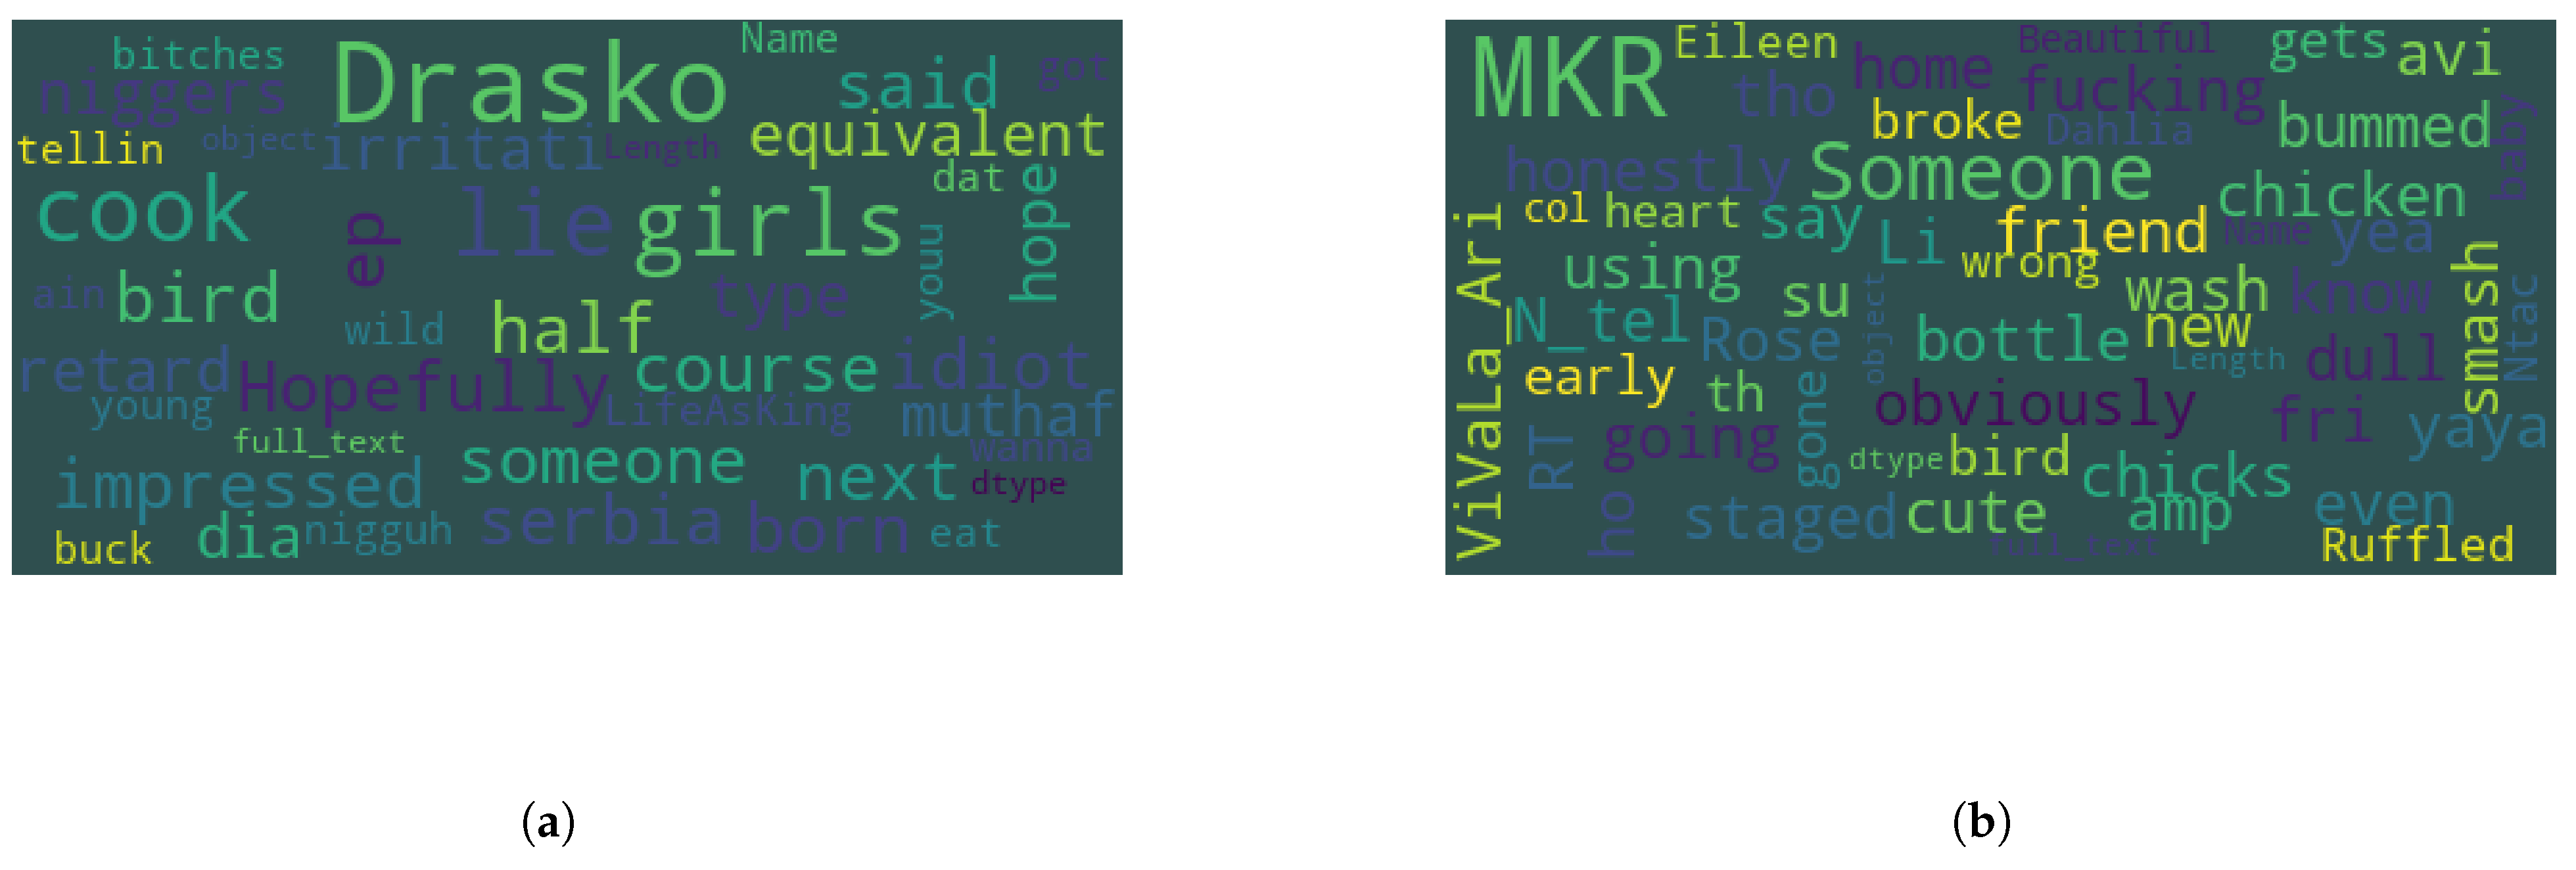
6. Evaluation and Results
To investigate the most frequent words in the dataset, we used a useful visualization technique known as a word cloud(documentation of this technique can be found at
https://amueller.github.io/word_cloud (accessed on 11 March 2021) to illustrate the most frequent words present in encoded text such as tweets.
Figure 3 shows the most frequent words present in the cyberbullying detection dataset. The most frequent words present in the offensive tweets include politicians’ names, county names, disrespectable words, and some normal words. Some of these words are not offensive; however, when they combine with other words in the same sentence, they present an offensive phrase. Most of the frequent words appearing in the non-offensive tweets include normal words except for some outliers that, when combined with other words, have a non-offensive meaning (e.g., f***ing nice).
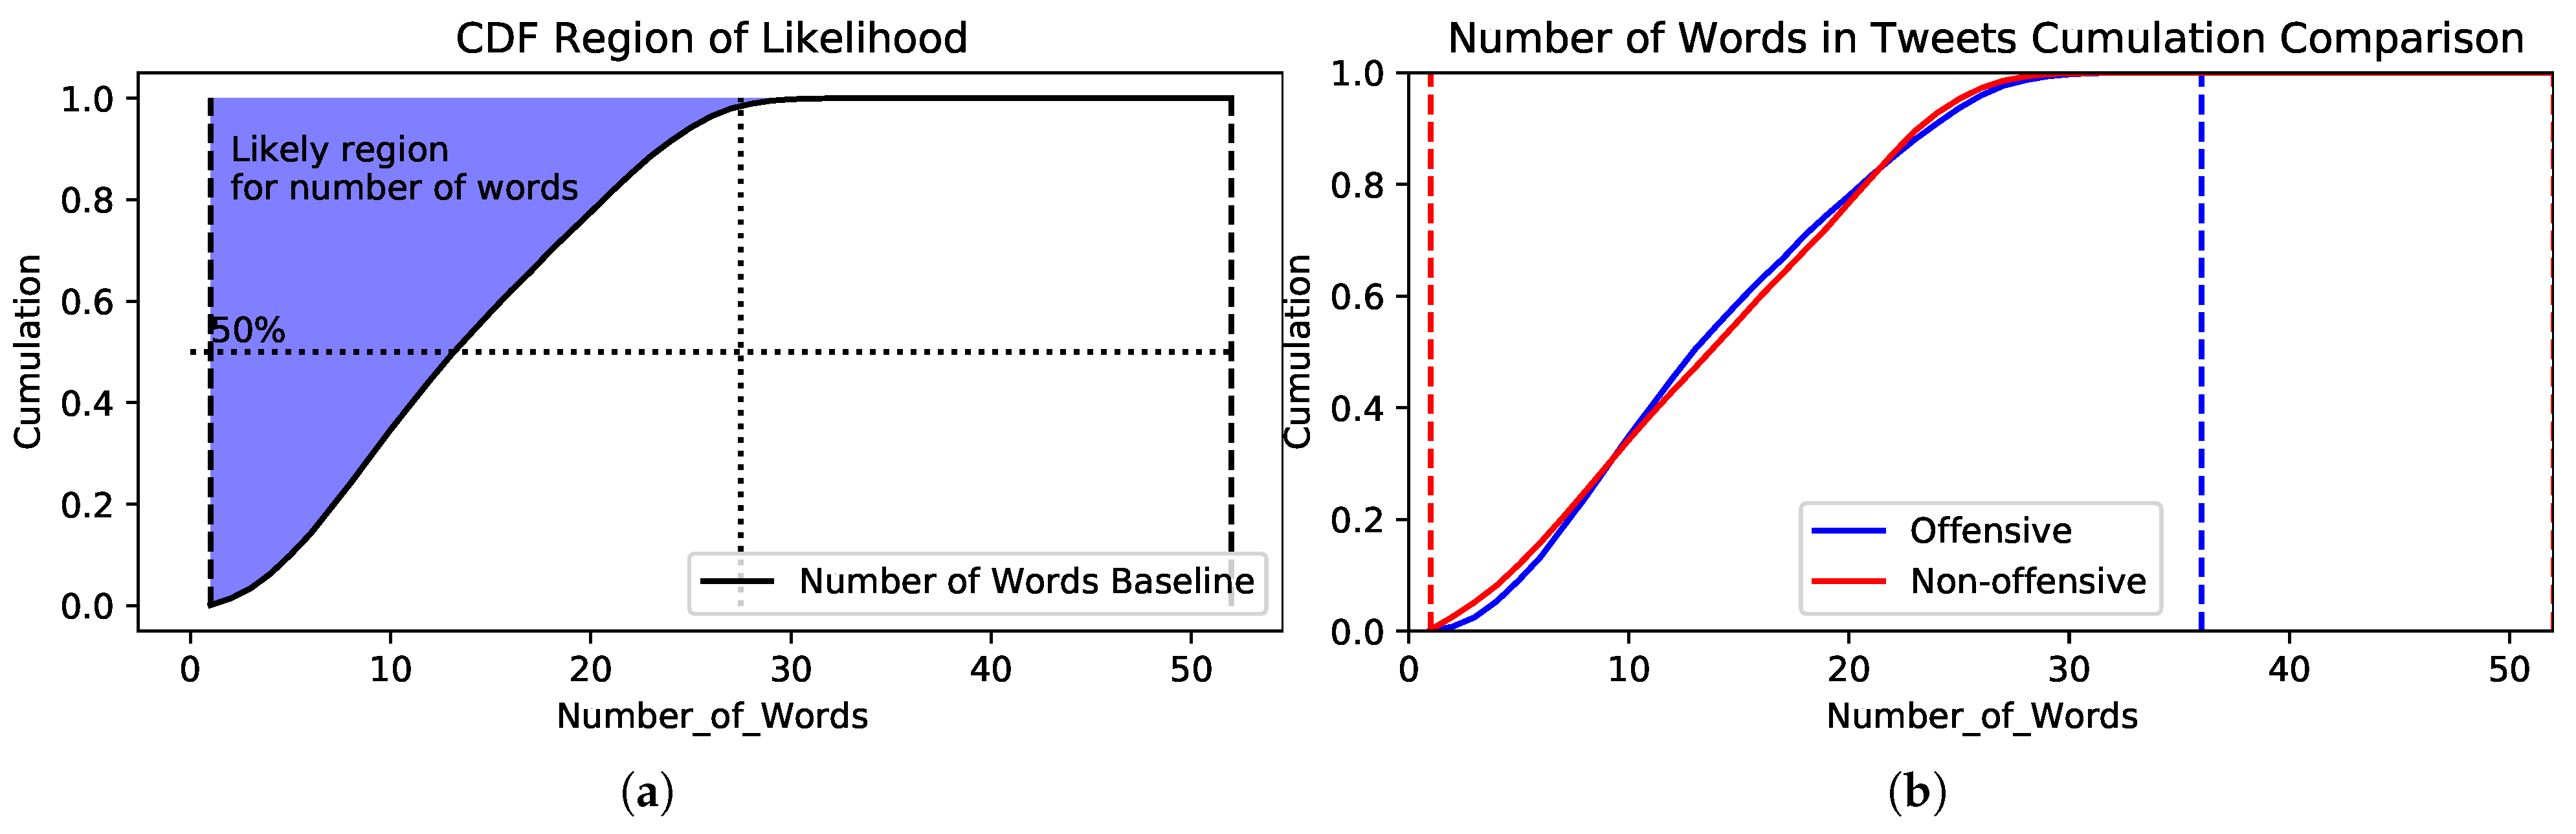
To explore the data and determine the number of words for offensive and non-offensive tweets, we used a technique called cumulative distribution function (a.k.a., cumulative distribution graphs) inspired by the work that is available at the following link:
https://www.kaggle.com/jell9265/streamlined-eda-cumulative-distribution-graphs (accessed on 11 March 2021).
Figure 4a shows the number of words for the two classes, and it is obvious that the majority of tweets have fewer than 20 words. A detailed plot for each class is shown in
Figure 4b.
For both classes, the minimum number of words is one word. The maximum number of words for the offensive class is 37, while the maximum number of words for the non-offensive class is 52 words. Both classes have similar distributions, where the mean number of words is 14. Four evaluation metrics were used to validate our proposed method: precision, F-measure, recall and accuracy. Prior to identifying these four metrics, the four building blocks for these metrics are defined as true positive (TP), true negative (TN), false positive (FP), and false negative (FN). Cyberbullying tweets (i.e., offensive instances) that are correctly classified as offensive are TPs, while ordinary tweets (i.e., non-offensive instances) that are correctly classified as non-offensive TNs. Cyberbullying tweets that are misclassified (i.e., classified as non-offensive) FNs, while non-offensive tweets that are mistakenly classified as offensive instances are FPs.
The accuracy is calculated using the following equation:
where
t is the total population
.
Accuracy measures the correct predictions of both the number of offensive tweets that are correctly classified as offensive (i.e., TP) and the number of non-offensive tweets that are correctly classified as non-offensive (i.e., TN) among the whole testing set.
The precision is presented to measure the number of correctly classified offensive tweets among all the instances in the testing set that are classified as offensive either correctly or mistakenly.
The recall is introduced to measure the number of correctly classified offensive tweets among all the offensive instances in the testing set.
The F-measure or F-score is the harmonic mean of both recall and precision and is calculated as in Equation (
18):
Three sets of experiments are utilized to validate our proposed method in terms of accuracy, as shown in
Table 3.
In the first experiment, the dataset is divided into 75% training and 25% testing. In the second experiment, the dataset is split into halves (i.e., 50% training and 50% testing). In the third experiment, the dataset is divided into 30% training and 70% testing. Then, for 20% training and 80% testing, in the last experiment, the dataset is set to 10% training and 90% testing. The accuracy is 87.99% when we split the dataset into 75% training and 25% testing, 85.36% when we split the dataset into 50% training and 50% testing, 82.78% when we split the dataset into 30% training and 70% testing, 79.75% when we split the dataset into 20% training and 80% testing, and 78.23% when we split the dataset into 10% training and 90% testing. As the number of training samples decreases in the last set of experiments, the performance of our method decreases as well.
To evaluate the performance of the proposed method in terms of accuracy, we compare it with eight well-known machine learning algorithms (i.e., CNN, BiLSTM, transformer, linear SVC, bagging, LR, RF, and ET) that achieved high accuracy in various natural language processing tasks. We used tokenization as a preprocessing step with all of these algorithms. The performance of our proposed method is better than the rest of the algorithms when we divided the data into 75% training and 25% testing, as shown in
Table 4.
The accuracy of our method is 87.99%, which is better than the second-most accurate algorithm (i.e., BiGRU) by approximately half a percent, better than the third- and fourth-most accurate algorithms by approximately one percent, and better than the rest by a good margin.
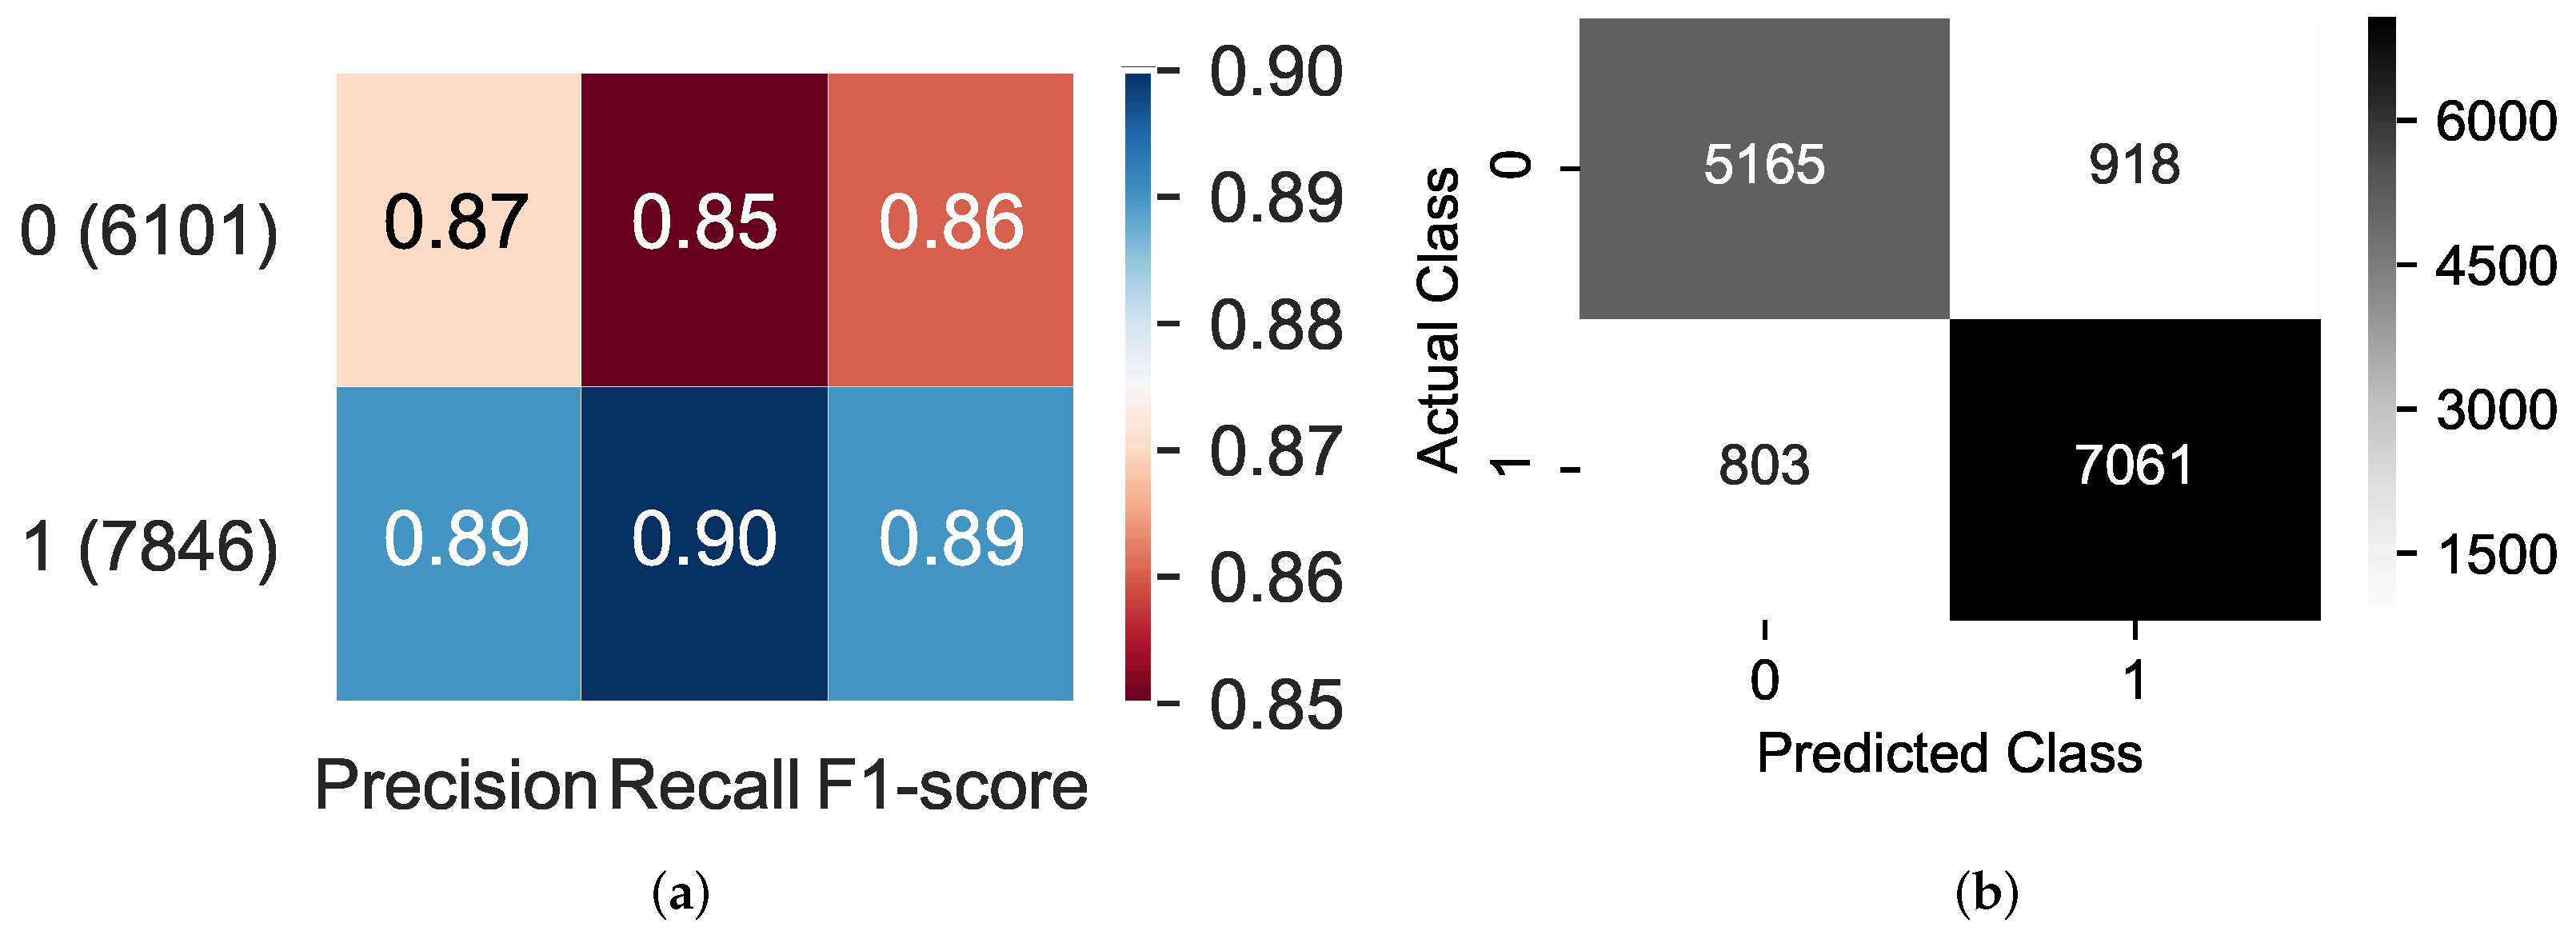
We also evaluated our method using four other metrics (i.e., precision, recall, F1-score, and a confusion matrix). Our proposed method achieved good performance of 87% precision, 85% recall, and 86% F-score when recognizing non-offensive instances, as shown in
Figure 5a. Our method yielded an outstanding performance of 89% precision, 90% recall, and 89% F1-score when recognizing offensive instances.
Figure 5b shows the confusion matrix of our proposed method in which approximately 85% of non-offensive instances are classified correctly (i.e., 5165 out of 6083 samples), while 90% of offensive instances are classified correctly (i.e., 7061 out of 7864 samples).
7. Conclusions
Online social networks have become an important aspect of our daily routines due to the provided ease of social interaction. However, the increase in antisocial behavior such as hate speech, trolling, and cyberbullying in social networks such as Twitter and the consequences that social media users encounter makes cyberbullying detection an important topic to explore. This paper presents a new cyberbullying detection technique using a combination of three deep learning architectures (i.e., a multichannel architecture consisting of BiGRU, a transformer block, and CNN models). The proposed method is evaluated using three famous cyberbullying datasets (i.e., we combined the three datasets to have enough samples to train our model). The experimental results show the significance of this method in classifying short messages (e.g., tweets). The proposed method achieved good results compared to the state-of-the-art methods on the three datasets, achieving an accuracy of approximately 88% when the dataset was split into 75% training and 25% testing.
8. Future Work
In the future, we plan to apply our method to a larger dataset. We believe that by using a larger dataset, the performance of our method can be enhanced. Deep learning algorithms require large data sets in order to in order to perform advantageously. Furthermore, We will try to enlarge the proposed framework by adding many channels. Increasing the number of channels when using a large dataset could improve the performance of the framework. A large dataset can also help to optimize the weights and other parameters of deep and large neural networks. Furthermore, we will also plan to test our proposed framework with tweets in different languages.
Author Contributions
M.A., conceptualization, writing, idea proposal, methodology, software, submission, and results; B.A., data curation, resources, Validation, software, writing, and preparation; A.R., conceptualization, review, editing, and supervision. All authors have read and agreed to the published version of the manuscript.
Funding
This research received no external funding.
Institutional Review Board Statement
Not applicable.
Informed Consent Statement
Not applicable.
Data Availability Statement
The data used in this study are available in [
17,
18,
19].
Acknowledgments
The authors would like to thank the deanship of scientific research at Shaqra University for supporting this work. The authors gratefully acknowledge the support of SNCS Research Center at the University of Tabuk, Saudi Arabia.
Conflicts of Interest
The authors declare no conflict of interest.
References
- Khan, M.U.S.; Abbas, A.; Rehman, A.; Nawaz, R. HateClassify: A service framework for hate speech identification on social media. IEEE Internet Comput. 2020, 25, 40–49. [Google Scholar] [CrossRef]
- Chatzakou, D.; Kourtellis, N.; Blackburn, J.; Cristofaro, E.D.; Stringhini, G.; Vakali, A. Mean birds: Detecting aggression and bullying on twitter. In Proceedings of the 2017 ACM on Web Science Conference, Troy, NY, USA, 25–28 June 2017; pp. 13–22. [Google Scholar]
- Wullach, T.; Adler, A.; Minkov, E.M. Towards hate speech detection at large via deep generative modeling. IEEE Internet Comput. 2020, 25, 48–57. [Google Scholar] [CrossRef]
- Razaque, A.; Fathi, A.; Dipal, H.; Mohamed, B.; Abobakr, A.; Sajal, B. Analysis of Sentimental Behaviour over Social Data Using Machine Learning Algorithms. In International Conference on Industrial, Engineering and Other Applications of Applied Intelligent Systems; Springer: Cham, Switzerland, 2021; pp. 396–412. [Google Scholar]
- Ansary, N.S. Cyberbullying: Concepts, theories, and correlates informing evidence-based best practices for prevention. Aggress. Violent Behav. 2020, 50, 101343. [Google Scholar] [CrossRef]
- Rosa, H.; Pereira, N.; Ribeiro, R.; Ferreira, P.C.; Carvalho, J.P.; Oliveira, S.; Trancoso, I. Automatic cyberbullying detection: A systematic review. Comput. Hum. Behav. 2019, 93, 333–345. [Google Scholar] [CrossRef]
- Cheng, L.; Silva, Y.N.; Hall, D.; Liu, H. Session-based cyberbullying detection: Problems and challenges. IEEE Internet Comput. 2020. [Google Scholar] [CrossRef]
- Razaque, A.; Al Ajlan, A.; Melaoune, N.; Alotaibi, M.; Alotaibi, B.; Dias, I.; Oad, A.; Hariri, S.; Zhao, C. Avoidance of Cybersecurity Threats with the Deployment of a Web-Based Blockchain-Enabled Cybersecurity Awareness System. Appl. Sci. 2021, 11, 7880. [Google Scholar] [CrossRef]
- Chatzakou, D.; Leontiadis, I.; Blackburn, J.; Cristofaro, E.D.; Stringhini, G.; Vakali, A.; Kourtellis, N. Detecting cyberbullying and cyberaggression in social media. ACM Trans. Web 2019, 13, 1–51. [Google Scholar] [CrossRef]
- Rozsa, M. Twitter Trolls Are Now Abusing the Company’s Bottom Line. Available online: https://www.salon.com/2016/10/19/twitter-trolls-are-now-abusing-the-companys-bottom-line/ (accessed on 30 September 2021).
- Jacob, S.S.; Vijayakumar, R. Sentimental analysis over twitter data using clustering based machine learning algorithm. J. Ambient Intell. Human. Comput. 2021, 2, 1–12. [Google Scholar]
- Sadiq, S.; Mehmood, A.; Ullah, S.; Ahmad, M.; Choi, G.S.; On, B.W. Aggression detection through deep neural model on Twitter. Future Gener. Comput. Syst. 2021, 114, 120–129. [Google Scholar] [CrossRef]
- Gencoglu, O. Cyberbullying detection with fairness constraints. IEEE Internet Comput. 2021, 25, 20–29. [Google Scholar] [CrossRef]
- Young, T.; Hazarika, D.; Poria, S.; Cambria, E. Recent trends in deep learning based natural language processing. IEEE Comput. Intell. Mag. 2018, 13, 55–75. [Google Scholar] [CrossRef]
- Xiao, Y.; Cho, K. Efficient character-level document classification by combining convolution and recurrent layers. arXiv 2016, arXiv:1602.00367. [Google Scholar]
- Tai, K.S.; Socher, R.; Manning, C.D. Improved semantic representations from tree-structured long short-term memory networks. arXiv 2015, arXiv:1503.00075. [Google Scholar]
- Davidson, T.; Warmsley, D.; Macy, M.; Weber, I. Automated hate speech detection and the problem of offensive language. arXiv 2017, arXiv:1703.04009. [Google Scholar]
- Waseem, Z.; Hovy, D. Hateful symbols or hateful people? Predictive features for hate speech detection on twitter. In Proceedings of the NAACL Student Research Workshop, San Diego, CA, USA, 12–17 June 2016; pp. 88–93. [Google Scholar]
- DataTurks. Kaggle. Tweets Dataset for Detection of Cyber-Trolls. 2018. Available online: https://www.kaggle.com/dataturks/dataset-for-detection-of-cybertrolls (accessed on 15 January 2021).
- Dinakar, K.; Reichart, R.; Lieberman, H. Modeling the detection of textual cyberbullying. In Proceedings of the Fifth International AAAI Conference on Weblogs and Social Media, Barcelona, Spain, 17–21 July 2011. [Google Scholar]
- Hee, C.V.; Lefever, E.; Verhoeven, B.; Mennes, J.; Desmet, B.; Pauw, G.D.; Hoste, V. Automatic detection and prevention of cyberbullying. In Proceedings of the International Conference on Human and Social Analytics (HUSO 2015), Nice, France, 18–22 July 2015; pp. 13–18. [Google Scholar]
- Sanchez, H.; Kumar, S. Twitter bullying detection. Ser. NSDI 2011, 12, 15. [Google Scholar]
- Saravanaraj, A.; Sheeba, J.I.; Devaneyan, S.P. Automatic detection of cyberbullying from twitter. Int. J. Comput. Sci. Inf. Technol. Secur. 2016, 6, 26–30. [Google Scholar]
- Al-garadi, M.A.; Varathan, K.D.; Ravana, S.D. Cybercrime detection in online communications: The experimental case of cyberbullying detection in the Twitter network. Comput. Hum. Behav. 2016, 63, 433–443. [Google Scholar] [CrossRef]
- Balakrishnan, V.; Khan, S.; Fernandez, T.; Arabnia, H.R. Cyberbullying detection on twitter using Big Five and Dark Triad features. Pers. Individ. Differ. 2019, 141, 252–257. [Google Scholar] [CrossRef]
- Balakrishnan, V.; Khan, S.; Arabnia, H.R. Improving cyberbullying detection using Twitter users psychological features and machine learning. Comput. Secur. 2020, 90, 101710. [Google Scholar] [CrossRef]
- Gamback, B.; Sikdar, U.K. Using convolutional neural networks to classify hate-speech. In Proceedings of the First Workshop on Abusive Language Online, August 2017; Association for Computational Linguistics: Vancouver, BC, Canada; pp. 85–90.
- Pradhan, A.; Yatam, V.M.; Bera, P. Self-attention for cyberbullying detection. In Proceedings of the 2020 International Conference Cyber Situational Awareness, Data Analytics and Assessment (CyberSA), Dublin, Ireland, 15–19 June 2020; pp. 1–6. [Google Scholar]
- Agrawal, S.; Awekar, A. Deep learning for detecting cyberbullying across multiple social media platforms. In European Conference on Information Retrieval; Springer: Cham, Switzerland, 2018; pp. 141–153. [Google Scholar]
- Plaza-del-Arco, F.M.; Molina-Gonzalez, M.D.; Urena-Lopez, L.A.; Martin-Valdivia, M.T. Comparing pre-trained language models for Spanish hate speech detection. Expert Syst. Appl. 2021, 166, 114120. [Google Scholar] [CrossRef]
- Vaswani, A.; Shazeer, N.; Parmar, N.; Uszkoreit, J.; Jones, L.; Gomez, A.N.; Polosukhin, I. Attention is all you need. Adv. Neural Inf. Process. Syst. 2017, 5998–6008. [Google Scholar]
- Chadha, G.S.; Panambilly, A.; Schwung, A.; Ding, S.X. Bidirectional deep recurrent neural networks for process fault classification. ISA Trans. 2020, 106, 330–342. [Google Scholar] [CrossRef] [PubMed]
- Cho, K.; Merriënboer, B.V.; Bahdanau, D.; Bengio, Y. On the properties of neural machine translation: Encoder-decoder approaches. arXiv 2014, arXiv:1409.1259. [Google Scholar]
- Chung, J.; Gulcehre, C.; Cho, K.; Bengio, Y. Empirical evaluation of gated recurrent neural networks on sequence modeling. arXiv 2014, arXiv:1412.3555. [Google Scholar]
- Goodfellow, I.; Bengio, Y.; Courville, A. Deep Learning; MIT Press: Cambridge, MA, USA, 2016. [Google Scholar]
- McKinney, W. Pandas: A foundational Python library for data analysis and statistics. Python High Perform. Sci. Comput. 2011, 14, 1–9. [Google Scholar]
- Chollet, F. Keras: The Python Deep Learning API. GitHub Repository. 2015. Available online: https://github.com/fchollet/keras (accessed on 15 January 2021).
- Pedregosa, F.; Varoquaux, G.; Gramfort, A.; Michel, V.; Thirion, B.; Grisel, O.; Vanderplas, J. Scikit-learn: Machine learning in Python. J. Mach. Learn. Res. 2011, 12, 2825–2830. [Google Scholar]
| Publisher’s Note: MDPI stays neutral with regard to jurisdictional claims in published maps and institutional affiliations. |
© 2021 by the authors. Licensee MDPI, Basel, Switzerland. This article is an open access article distributed under the terms and conditions of the Creative Commons Attribution (CC BY) license (https://creativecommons.org/licenses/by/4.0/).


