Author Contributions
Conceptualization, L.G., N.E.-J. and M.R.D.; methodology, L.G., N.E.-J. and M.R.D.; validation, N.E.-J. and M.R.D.; investigation, L.G., N.E.-J. and M.R.D.; resources, L.G., N.E.-J. and M.R.D.; writing—original draft preparation, L.G., N.E.-J. and M.R.D.; writing—review and editing, N.E.-J. and M.R.D.; visualization, L.G.; supervision, N.E.-J. and M.R.D.; project administration, N.E.-J. and M.R.D.; funding acquisition, M.R.D. All authors have read and agreed to the published version of the manuscript.
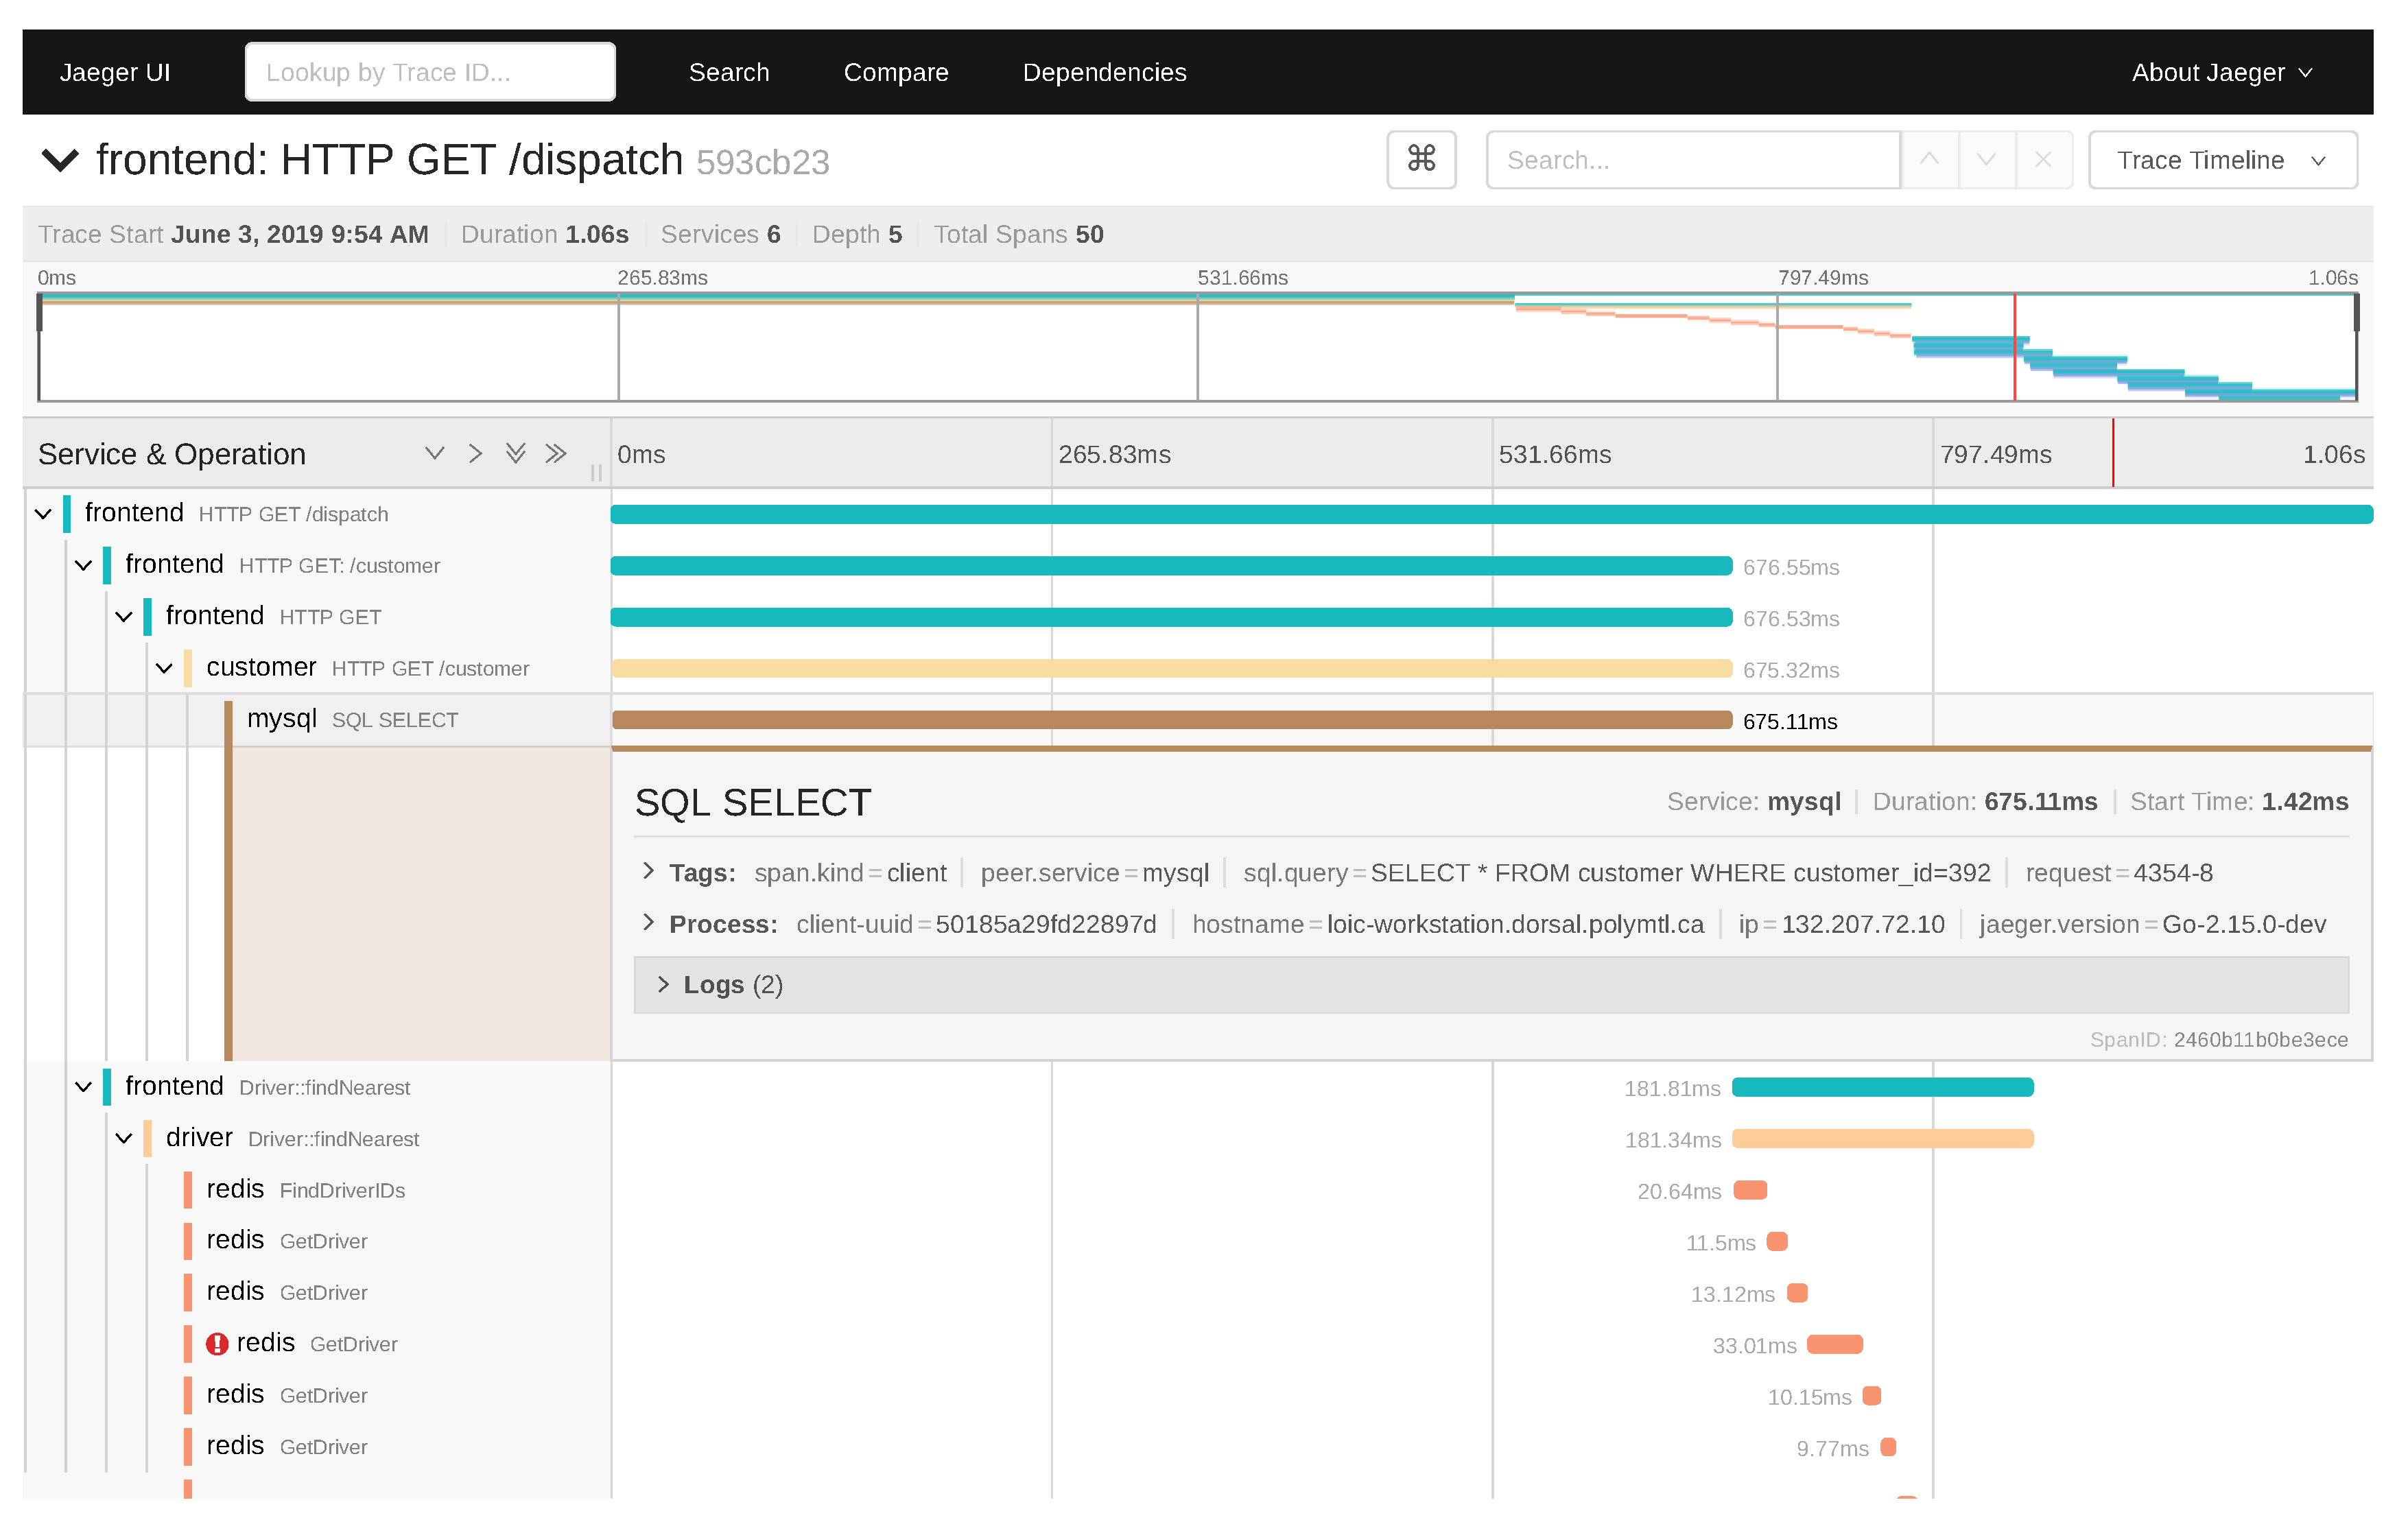
Figure 1.
Sample distributed trace shown by Jaeger. The events corresponding to a user request can be collected and processed by the distributed tracer Jaeger. The view shows the complete flow of subrequests, along with the causal links between them, their duration and their log events.
Figure 1.
Sample distributed trace shown by Jaeger. The events corresponding to a user request can be collected and processed by the distributed tracer Jaeger. The view shows the complete flow of subrequests, along with the causal links between them, their duration and their log events.
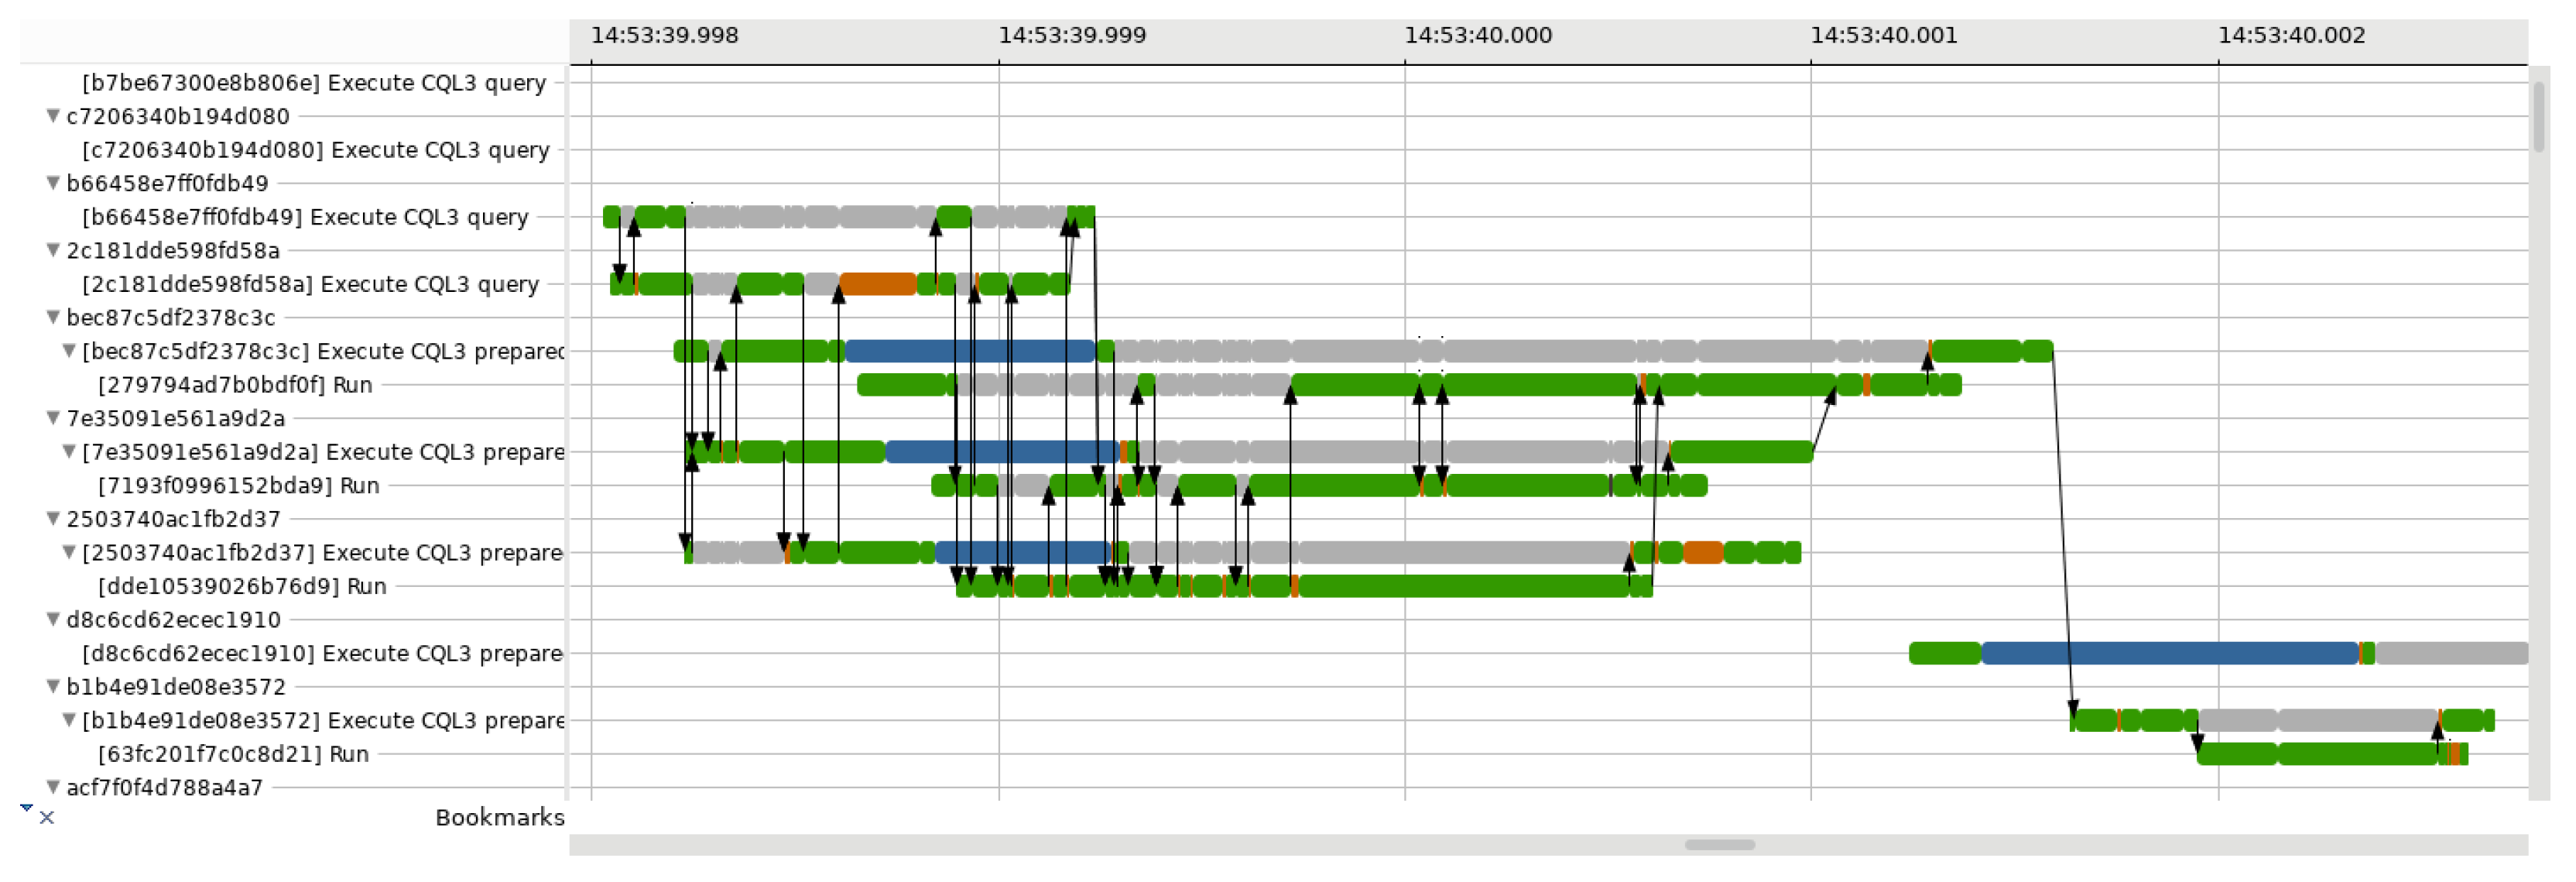
Figure 2.
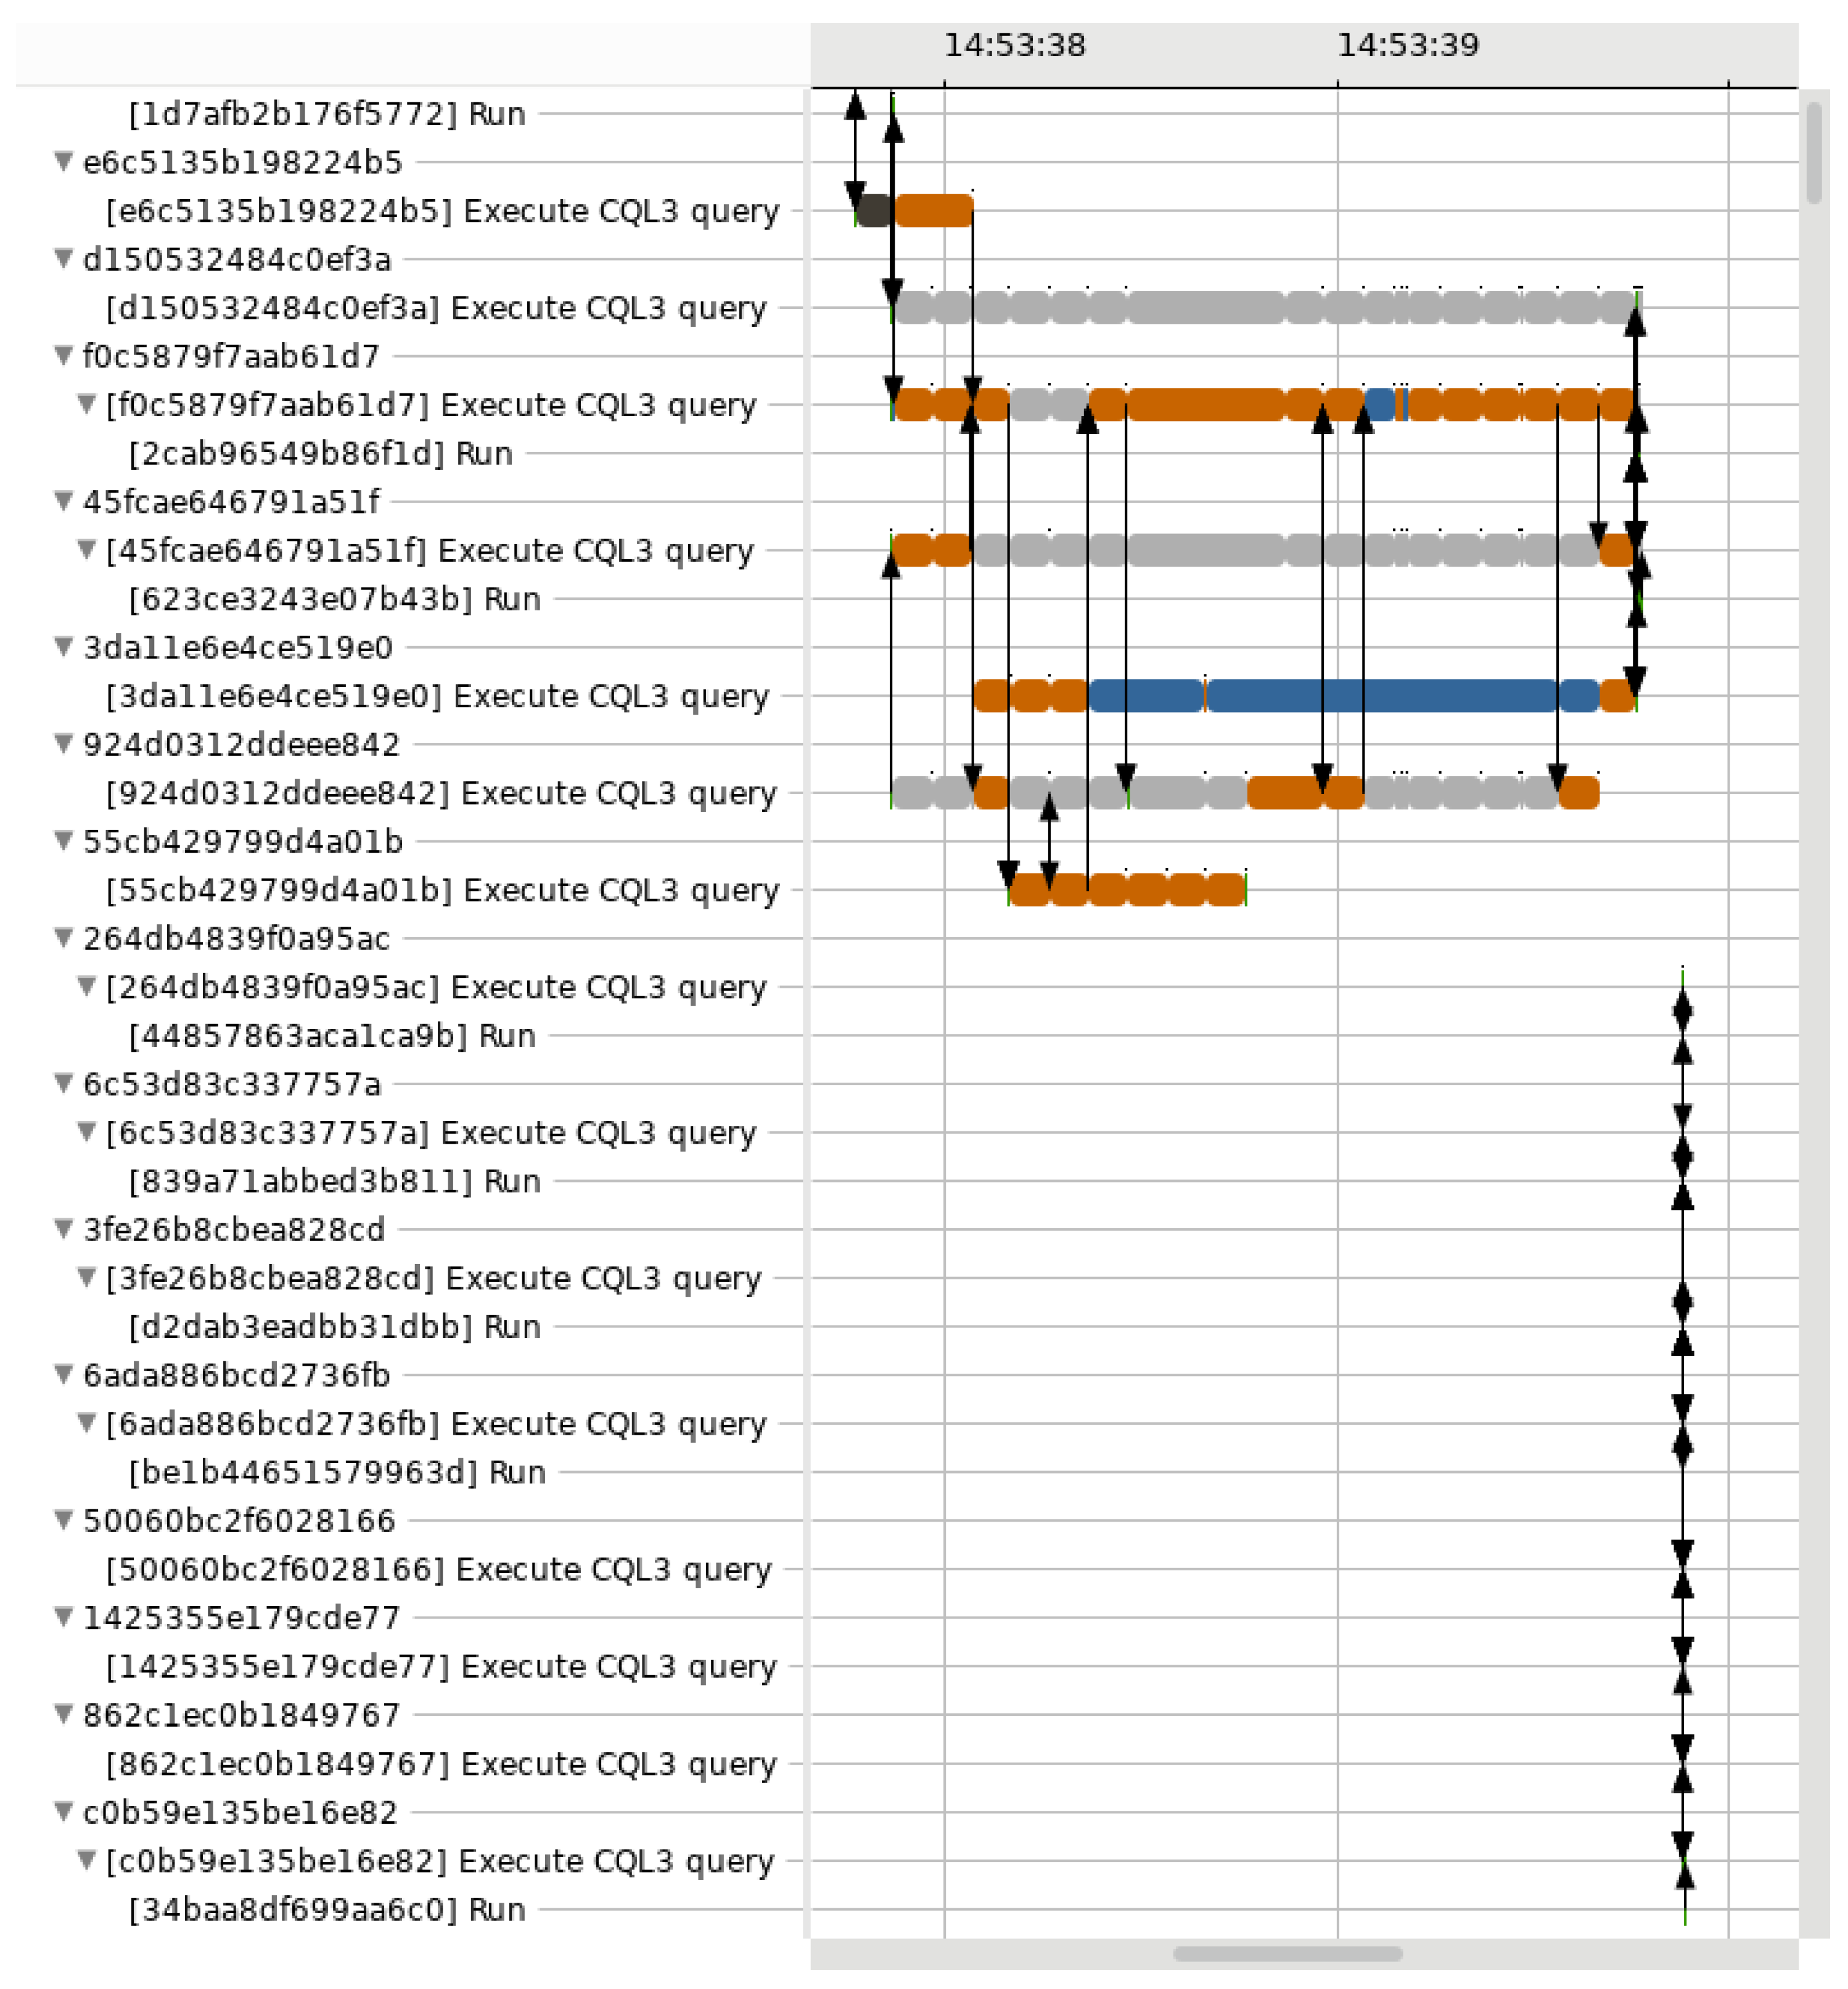
View of our requests critical path analysis in Trace Compass. Each state has a different colour—green for RUNNING, orange for PREEMPTED, grey when blocked by another request, etc.—and the arrows indicate how the different requests intersect in their respective critical path. Instead of showing a single request only, our view includes all the requests that happened in parallel.
Figure 2.
View of our requests critical path analysis in Trace Compass. Each state has a different colour—green for RUNNING, orange for PREEMPTED, grey when blocked by another request, etc.—and the arrows indicate how the different requests intersect in their respective critical path. Instead of showing a single request only, our view includes all the requests that happened in parallel.
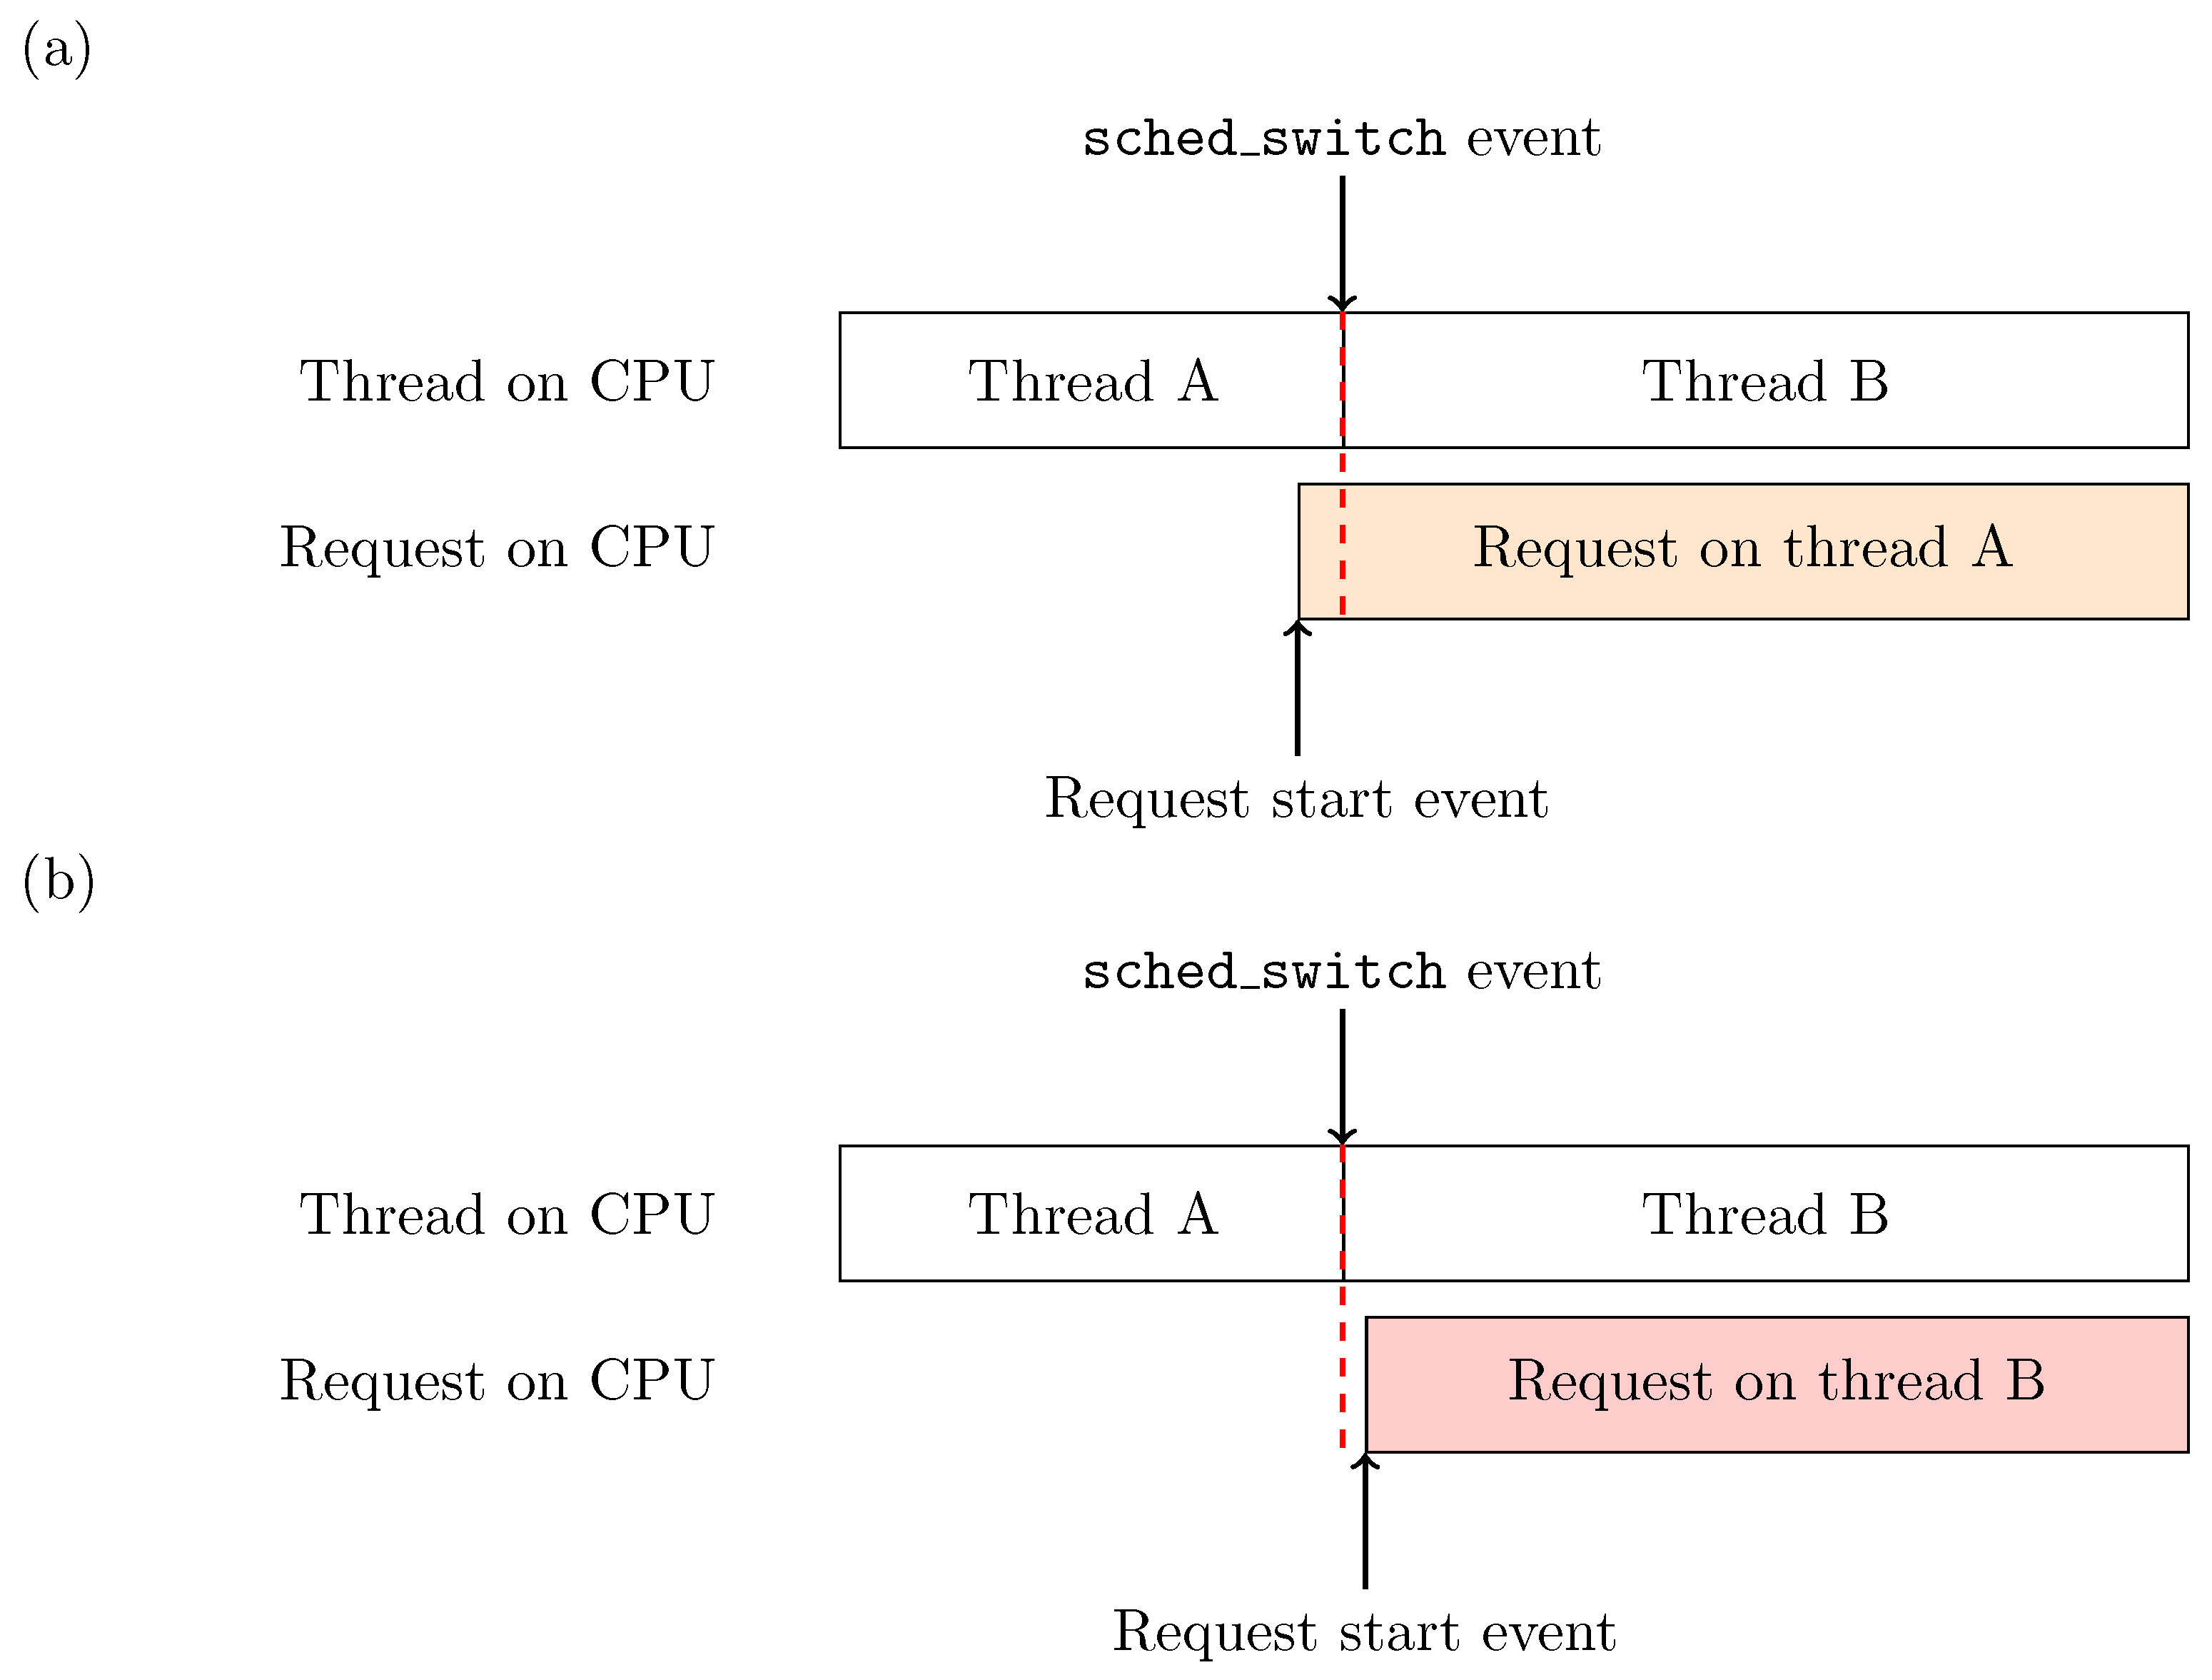
Figure 3.
Impact of the precision of timestamps on trace analysis. The role of an event-driven analysis is to reconstruct the state of a machine at any given time using the sole trace events. Different event sequencing can yield different analysis results. In our case, insufficient precision on the distributed tracing events can impact the analysis depending on whether the request starts (a) right before or (b) right after a scheduling event.
Figure 4.
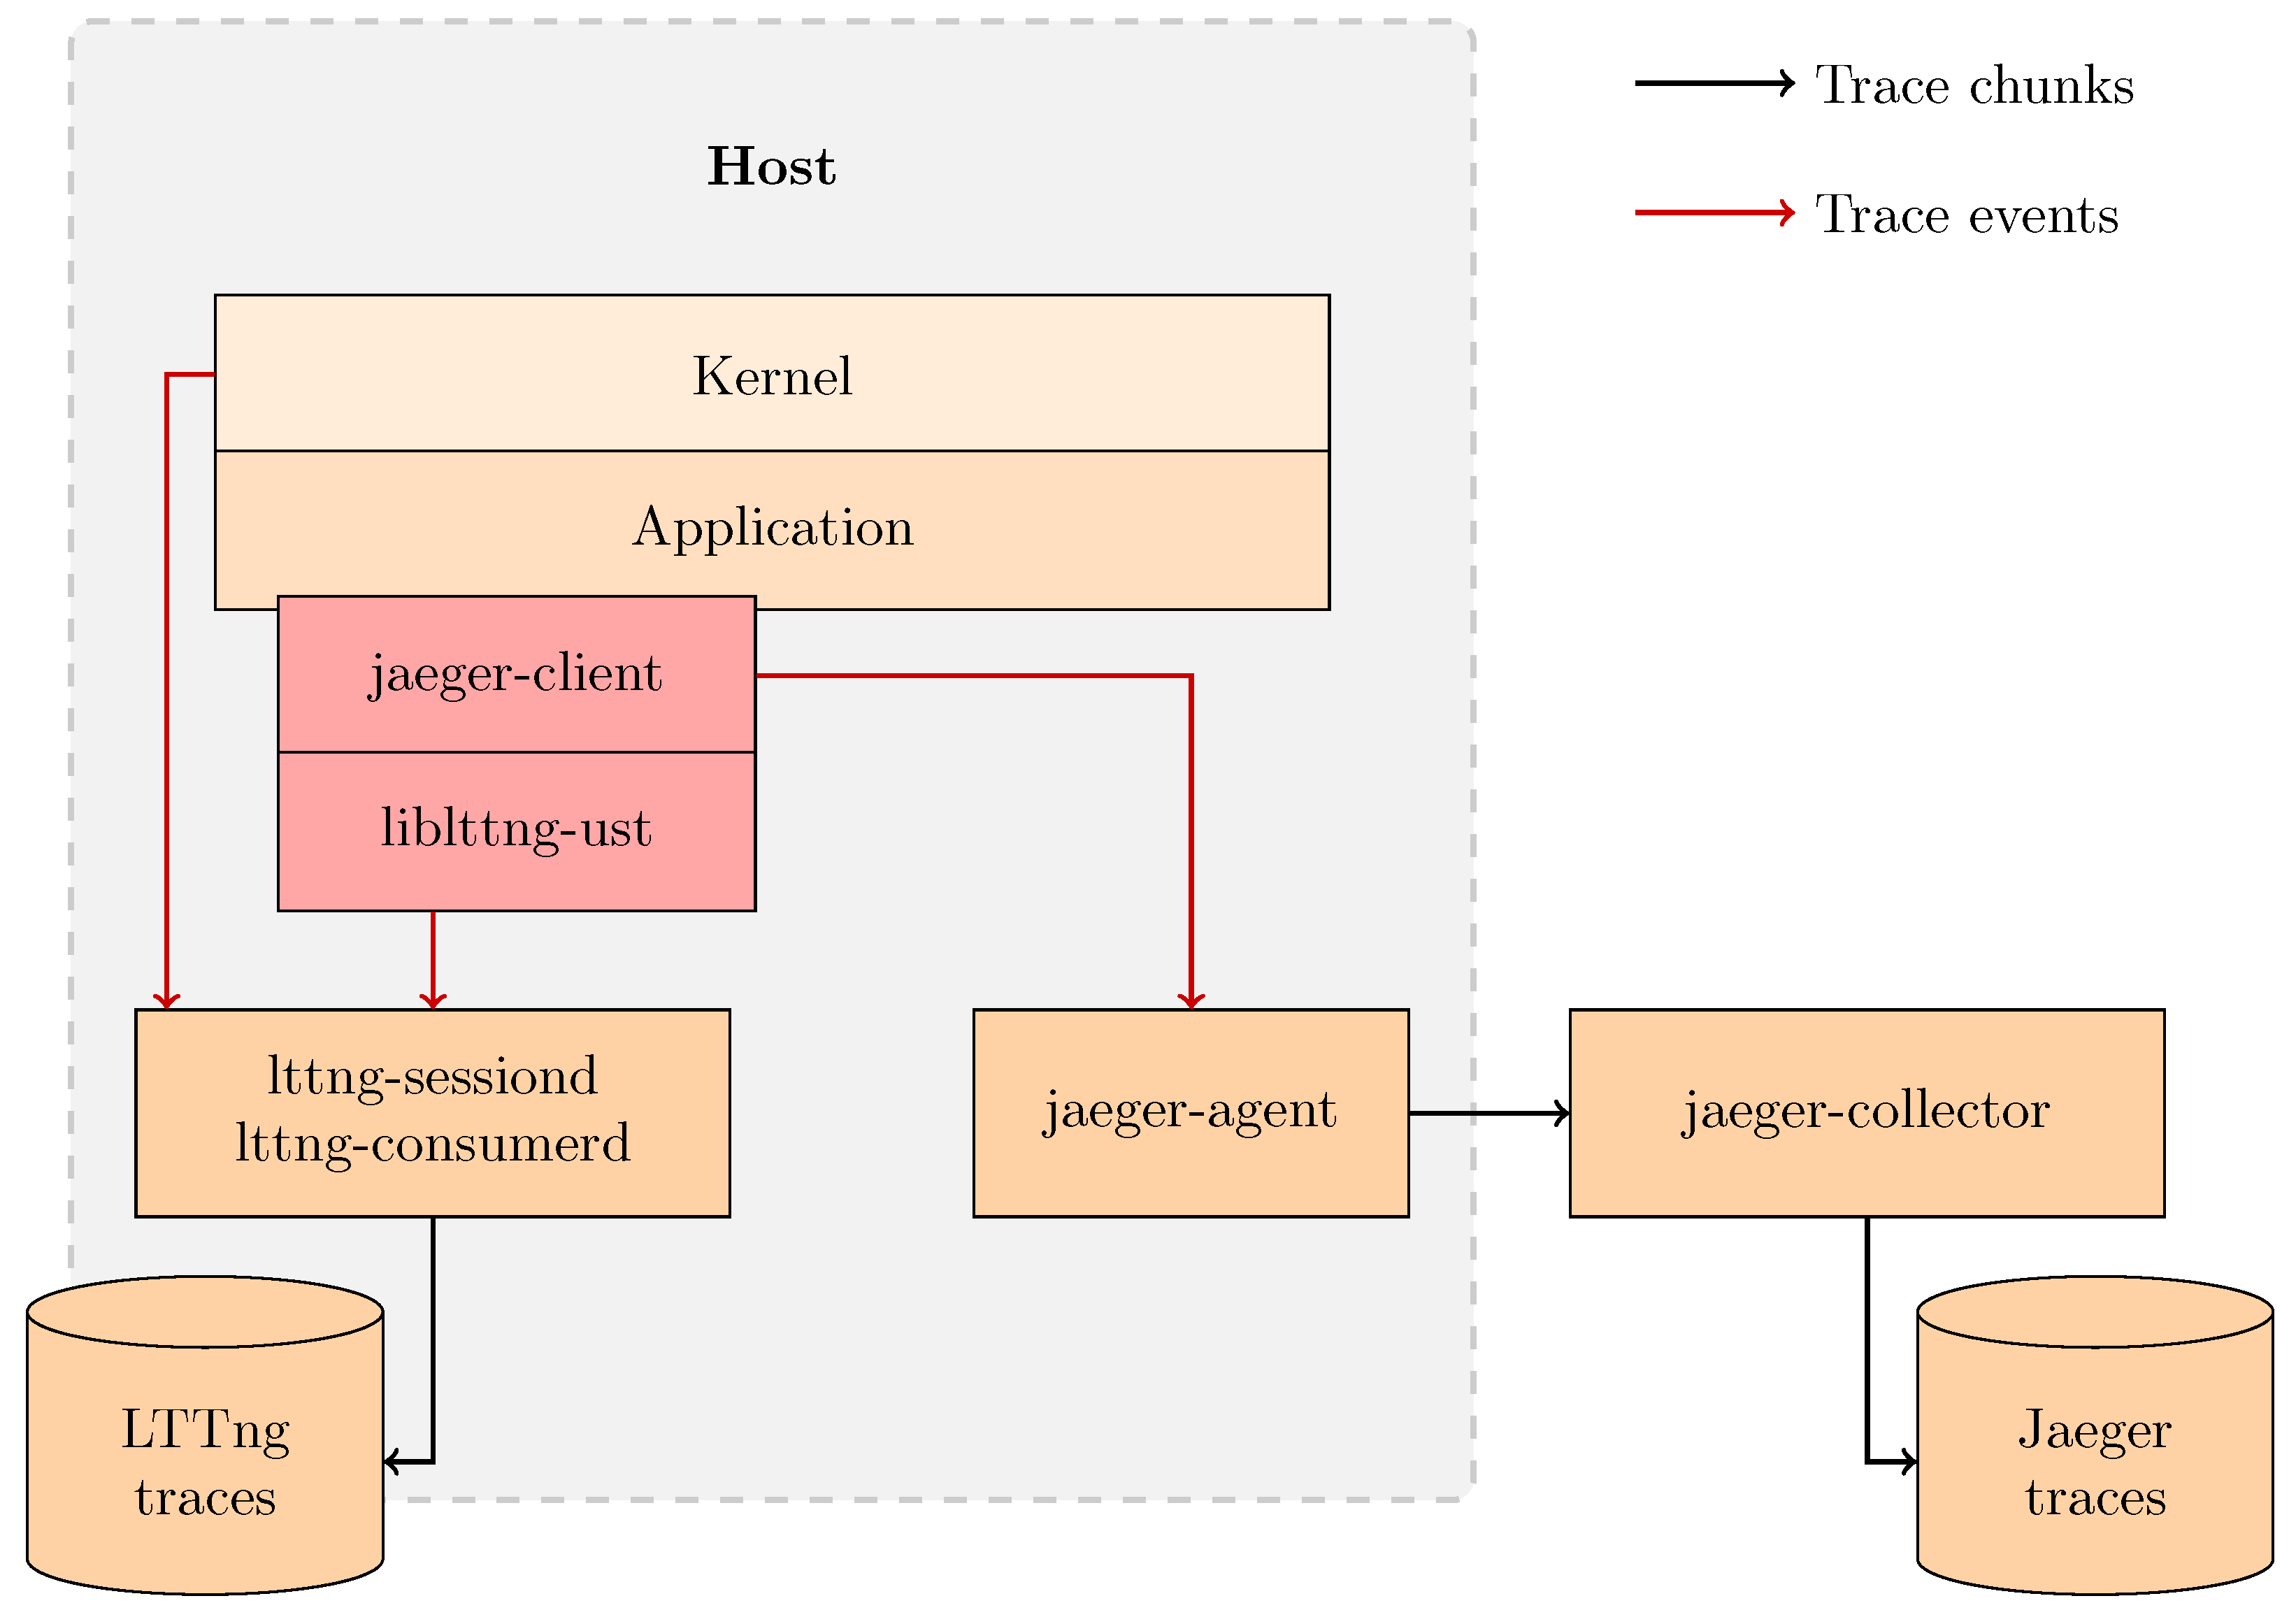
Design of our trace collection solution. Our solution targets a single host and is able to collect kernel traces using LTTng and distributed traces using Jaeger. The in-process Jaeger client is patched to emit LTTng user-space events and has to be compiled against liblttng-ust. The application code is unmodified, but it has to be compiled against the patched Jaeger client.
Figure 4.
Design of our trace collection solution. Our solution targets a single host and is able to collect kernel traces using LTTng and distributed traces using Jaeger. The in-process Jaeger client is patched to emit LTTng user-space events and has to be compiled against liblttng-ust. The application code is unmodified, but it has to be compiled against the patched Jaeger client.
Figure 5.
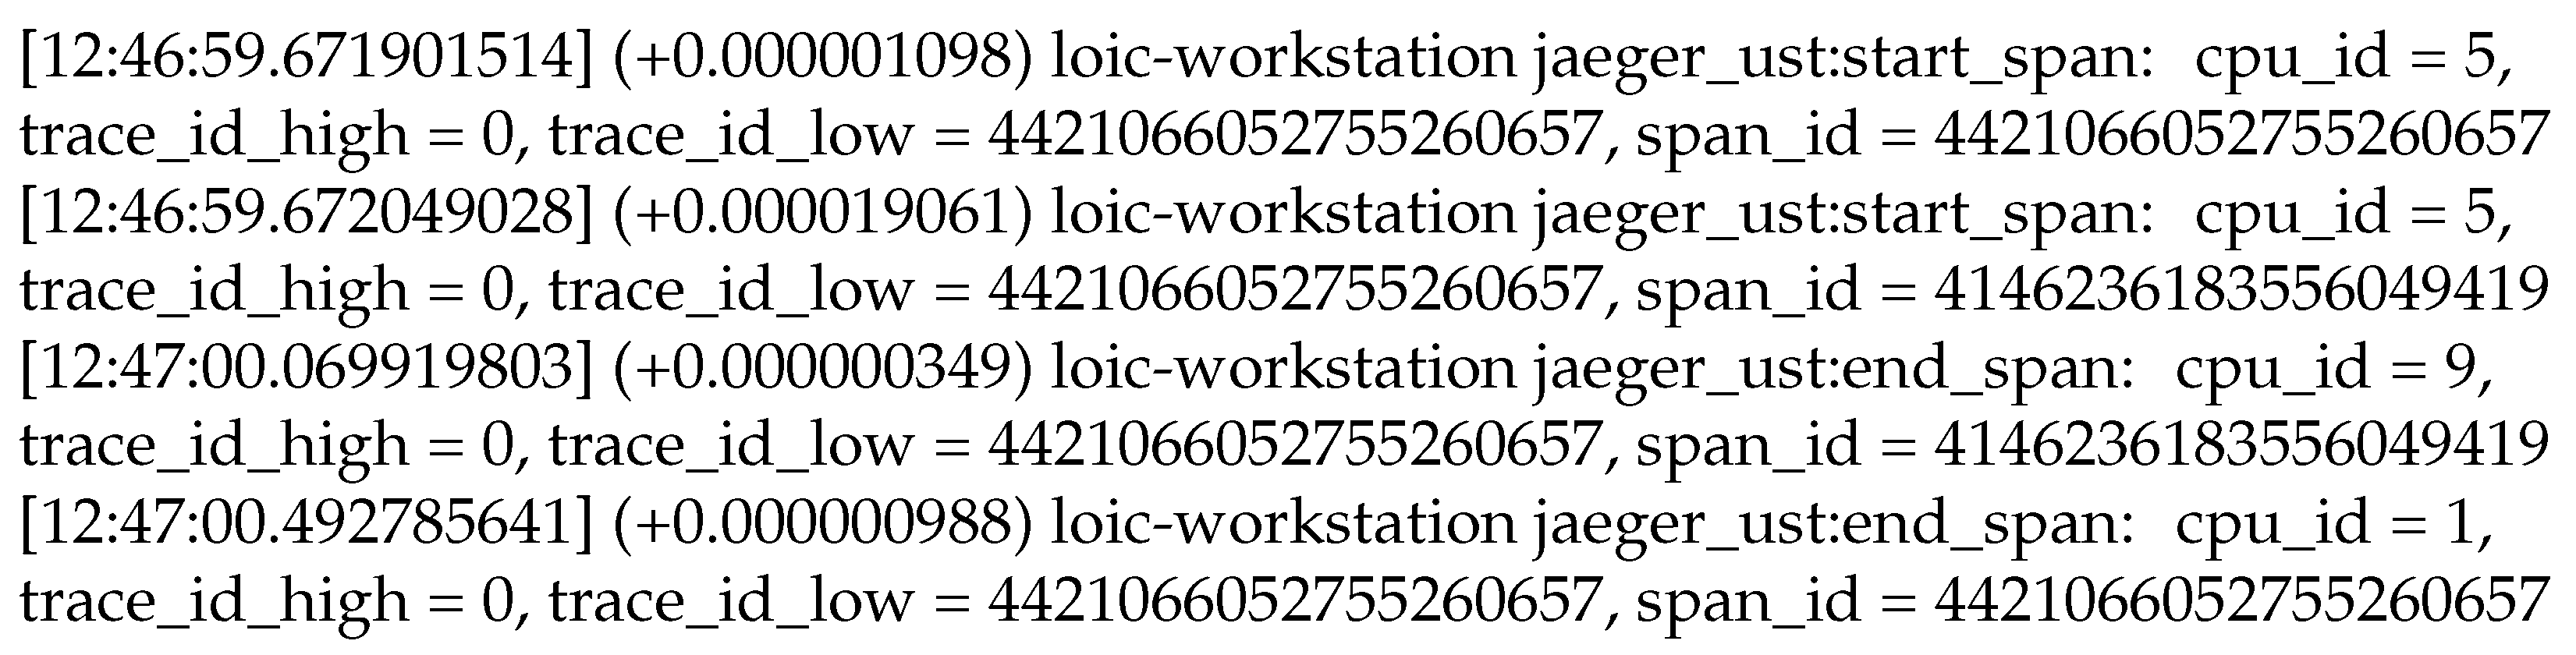
Sample synchronization events collected using our solution. Our solution collects events in the user-space mode for synchronization between distributed traces and kernel traces. Examples of such events are shown here, as displayed by the Babeltrace trace reader. Each event carries (i) nanosecond-precise absolute and relative timestamps, (ii) the name of the source server, (iii) the name of the event, (iv) the source CPU identifier and (v) the event payload.
Figure 5.
Sample synchronization events collected using our solution. Our solution collects events in the user-space mode for synchronization between distributed traces and kernel traces. Examples of such events are shown here, as displayed by the Babeltrace trace reader. Each event carries (i) nanosecond-precise absolute and relative timestamps, (ii) the name of the source server, (iii) the name of the event, (iv) the source CPU identifier and (v) the event payload.
Figure 6.
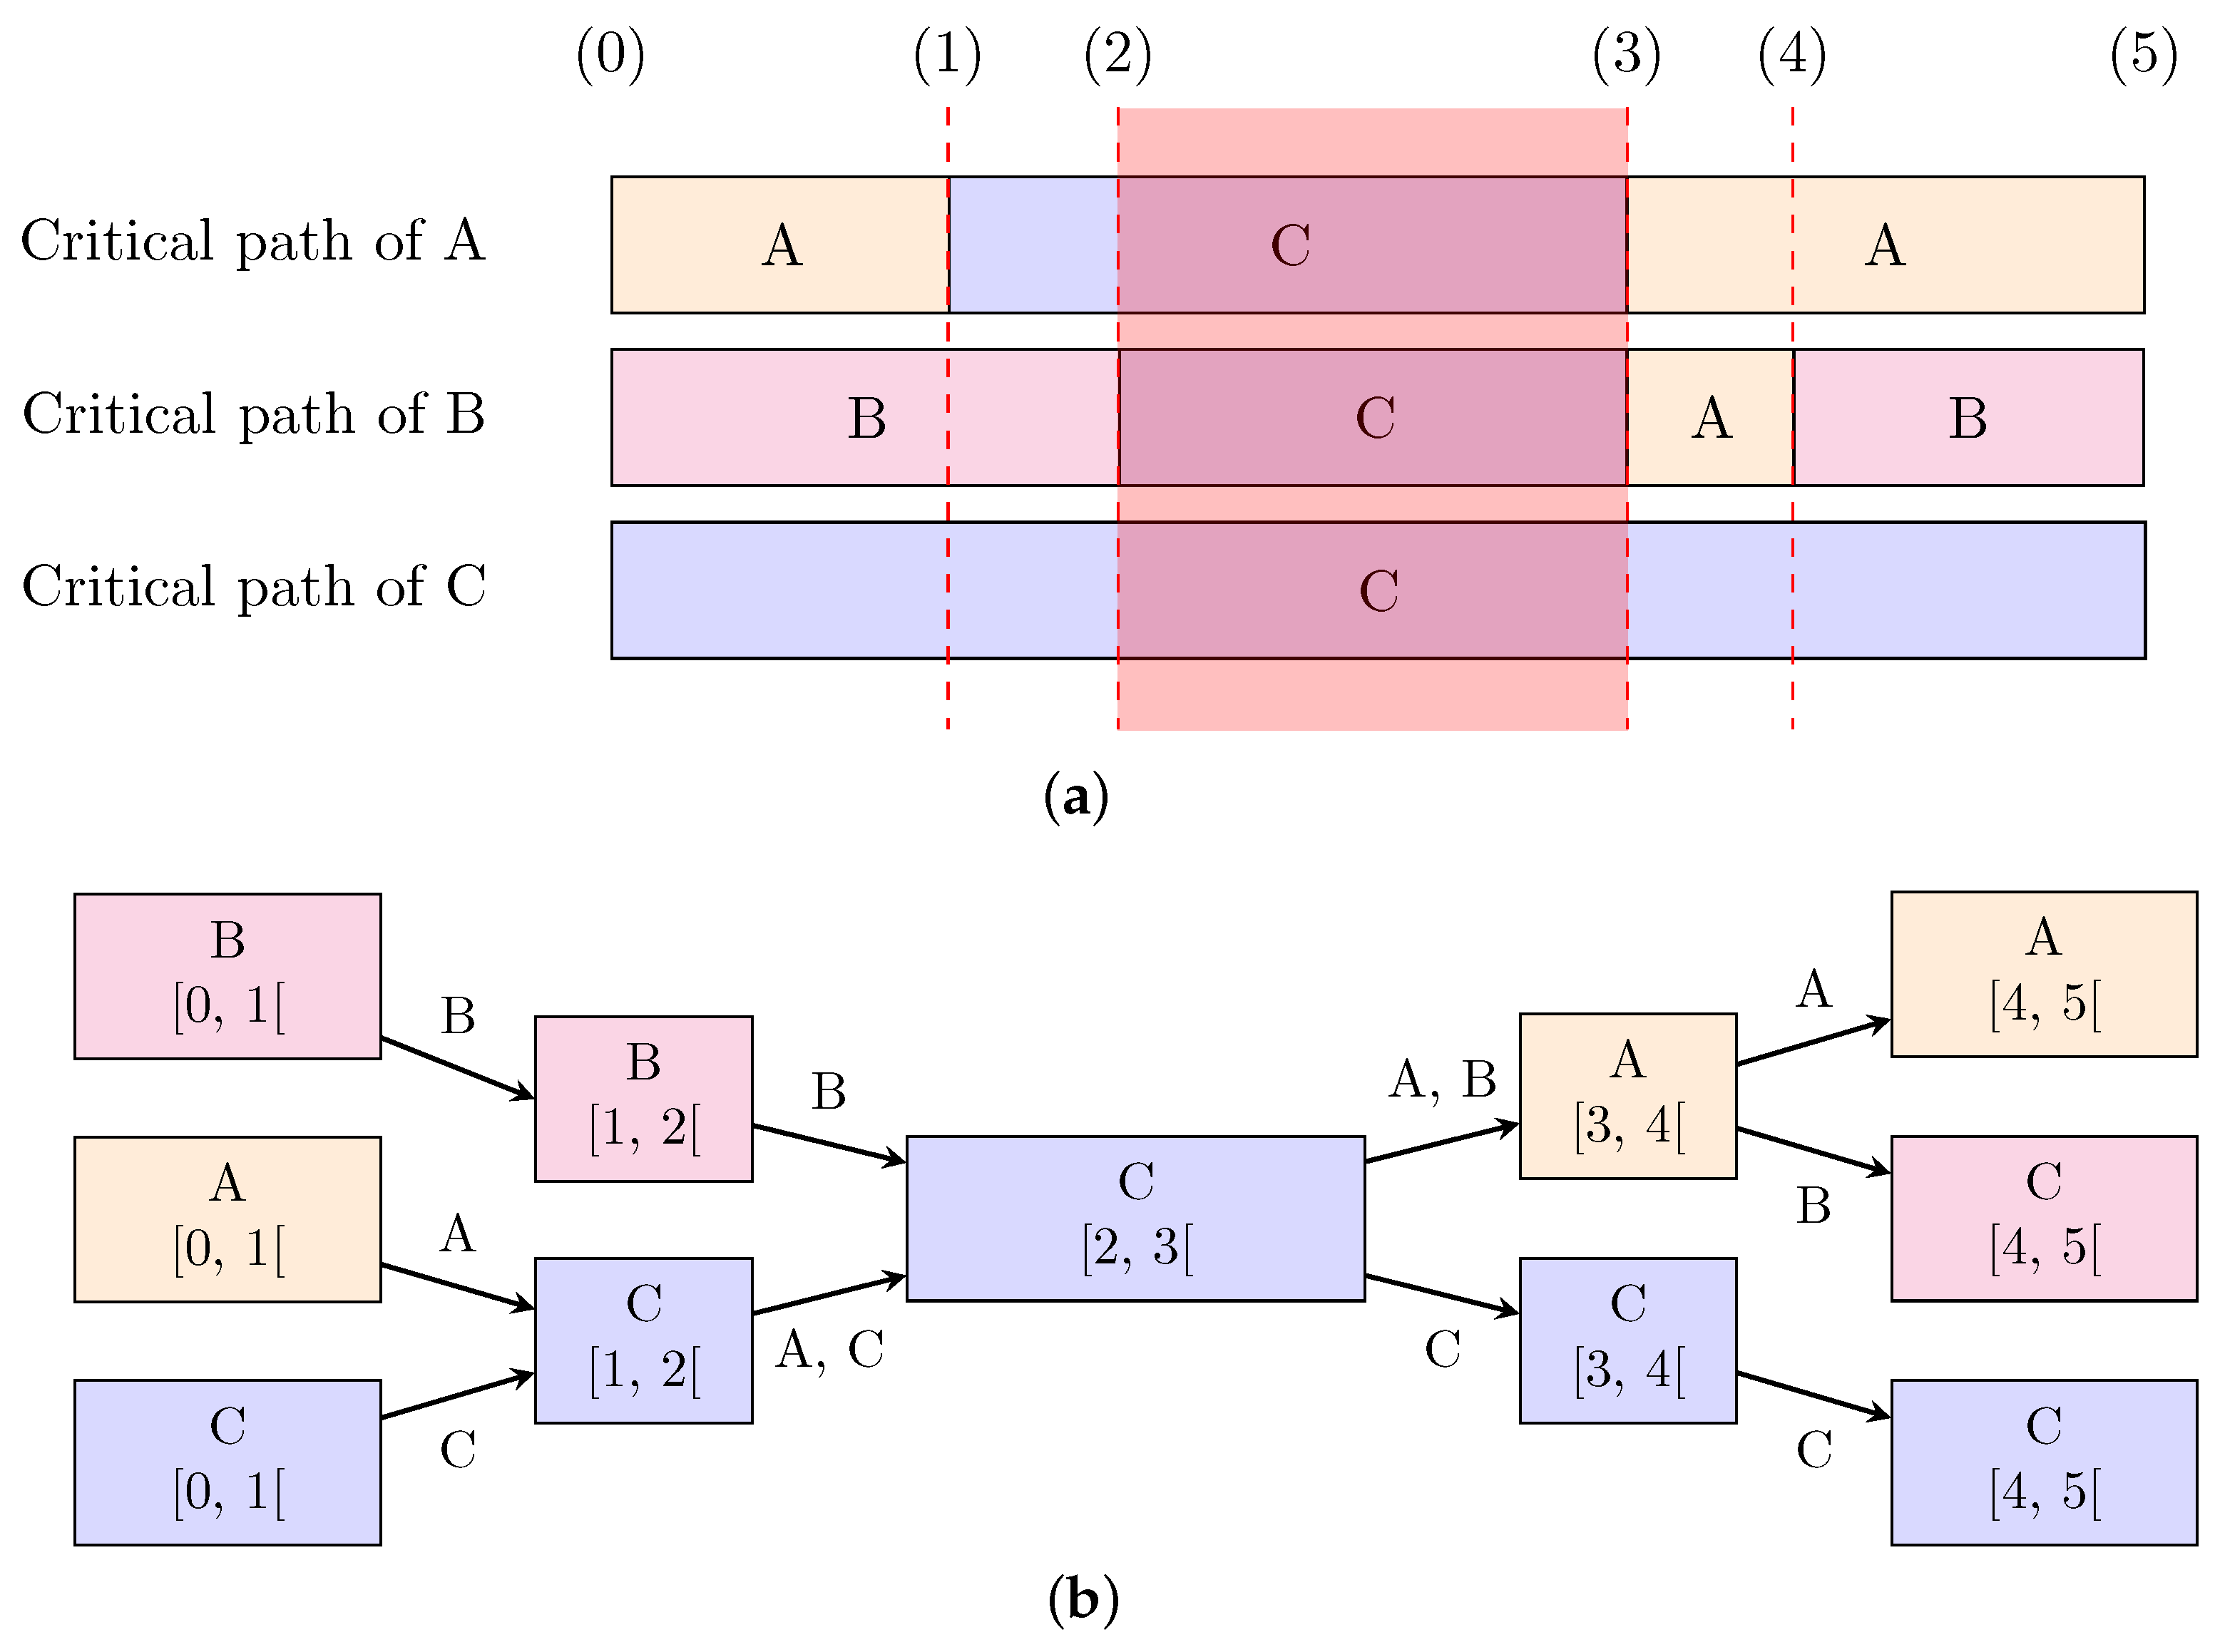
Shared states between different thread critical paths. The critical paths of different threads can share one or more states (a). In this example, the thread C initially holds a mutex M and threads A, B and C are running. Each block indicates which thread is on the critical path of the thread of interest. (Solid lines indicate requesting, acquiring or releasing a lock on a resource). The critical paths are built according to the sequence of the following events: (0) trace begins, (1) A requests locking M, (2) B requests locking M, (3) C releases M and A locks M, (4) A releases M and B locks M, and (5) trace ends. (It is important to note that execution continues even after releasing a lock). The red overlay in subfigure (a) highlights the interval during which all threads have the same state in their respective critical path. Our critical path merging algorithm outputs the graph in subfigure (b). Each graph node indicates which thread the state refers to, as well as the time interval of the state. The critical path of a given thread can be recovered back from the graph by following the edges labelled with that thread name.
Figure 6.
Shared states between different thread critical paths. The critical paths of different threads can share one or more states (a). In this example, the thread C initially holds a mutex M and threads A, B and C are running. Each block indicates which thread is on the critical path of the thread of interest. (Solid lines indicate requesting, acquiring or releasing a lock on a resource). The critical paths are built according to the sequence of the following events: (0) trace begins, (1) A requests locking M, (2) B requests locking M, (3) C releases M and A locks M, (4) A releases M and B locks M, and (5) trace ends. (It is important to note that execution continues even after releasing a lock). The red overlay in subfigure (a) highlights the interval during which all threads have the same state in their respective critical path. Our critical path merging algorithm outputs the graph in subfigure (b). Each graph node indicates which thread the state refers to, as well as the time interval of the state. The critical path of a given thread can be recovered back from the graph by following the edges labelled with that thread name.
![Electronics 10 02610 g006]()
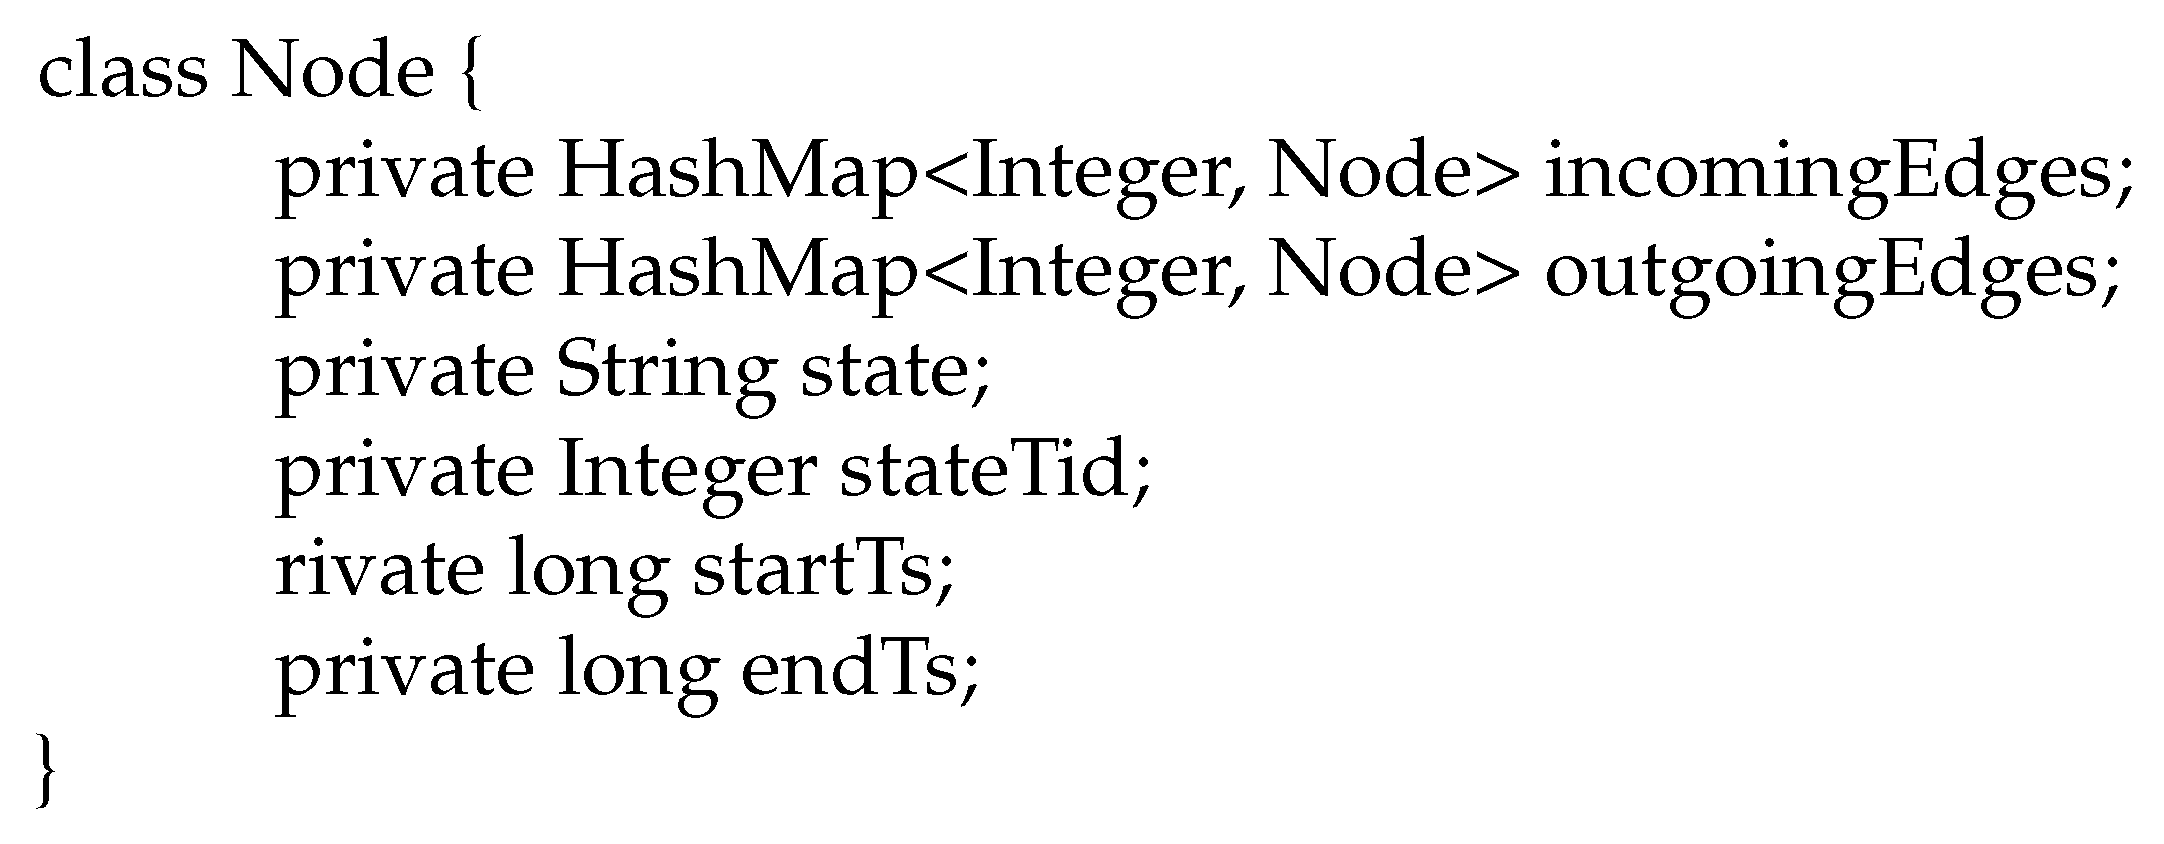
Figure 7.
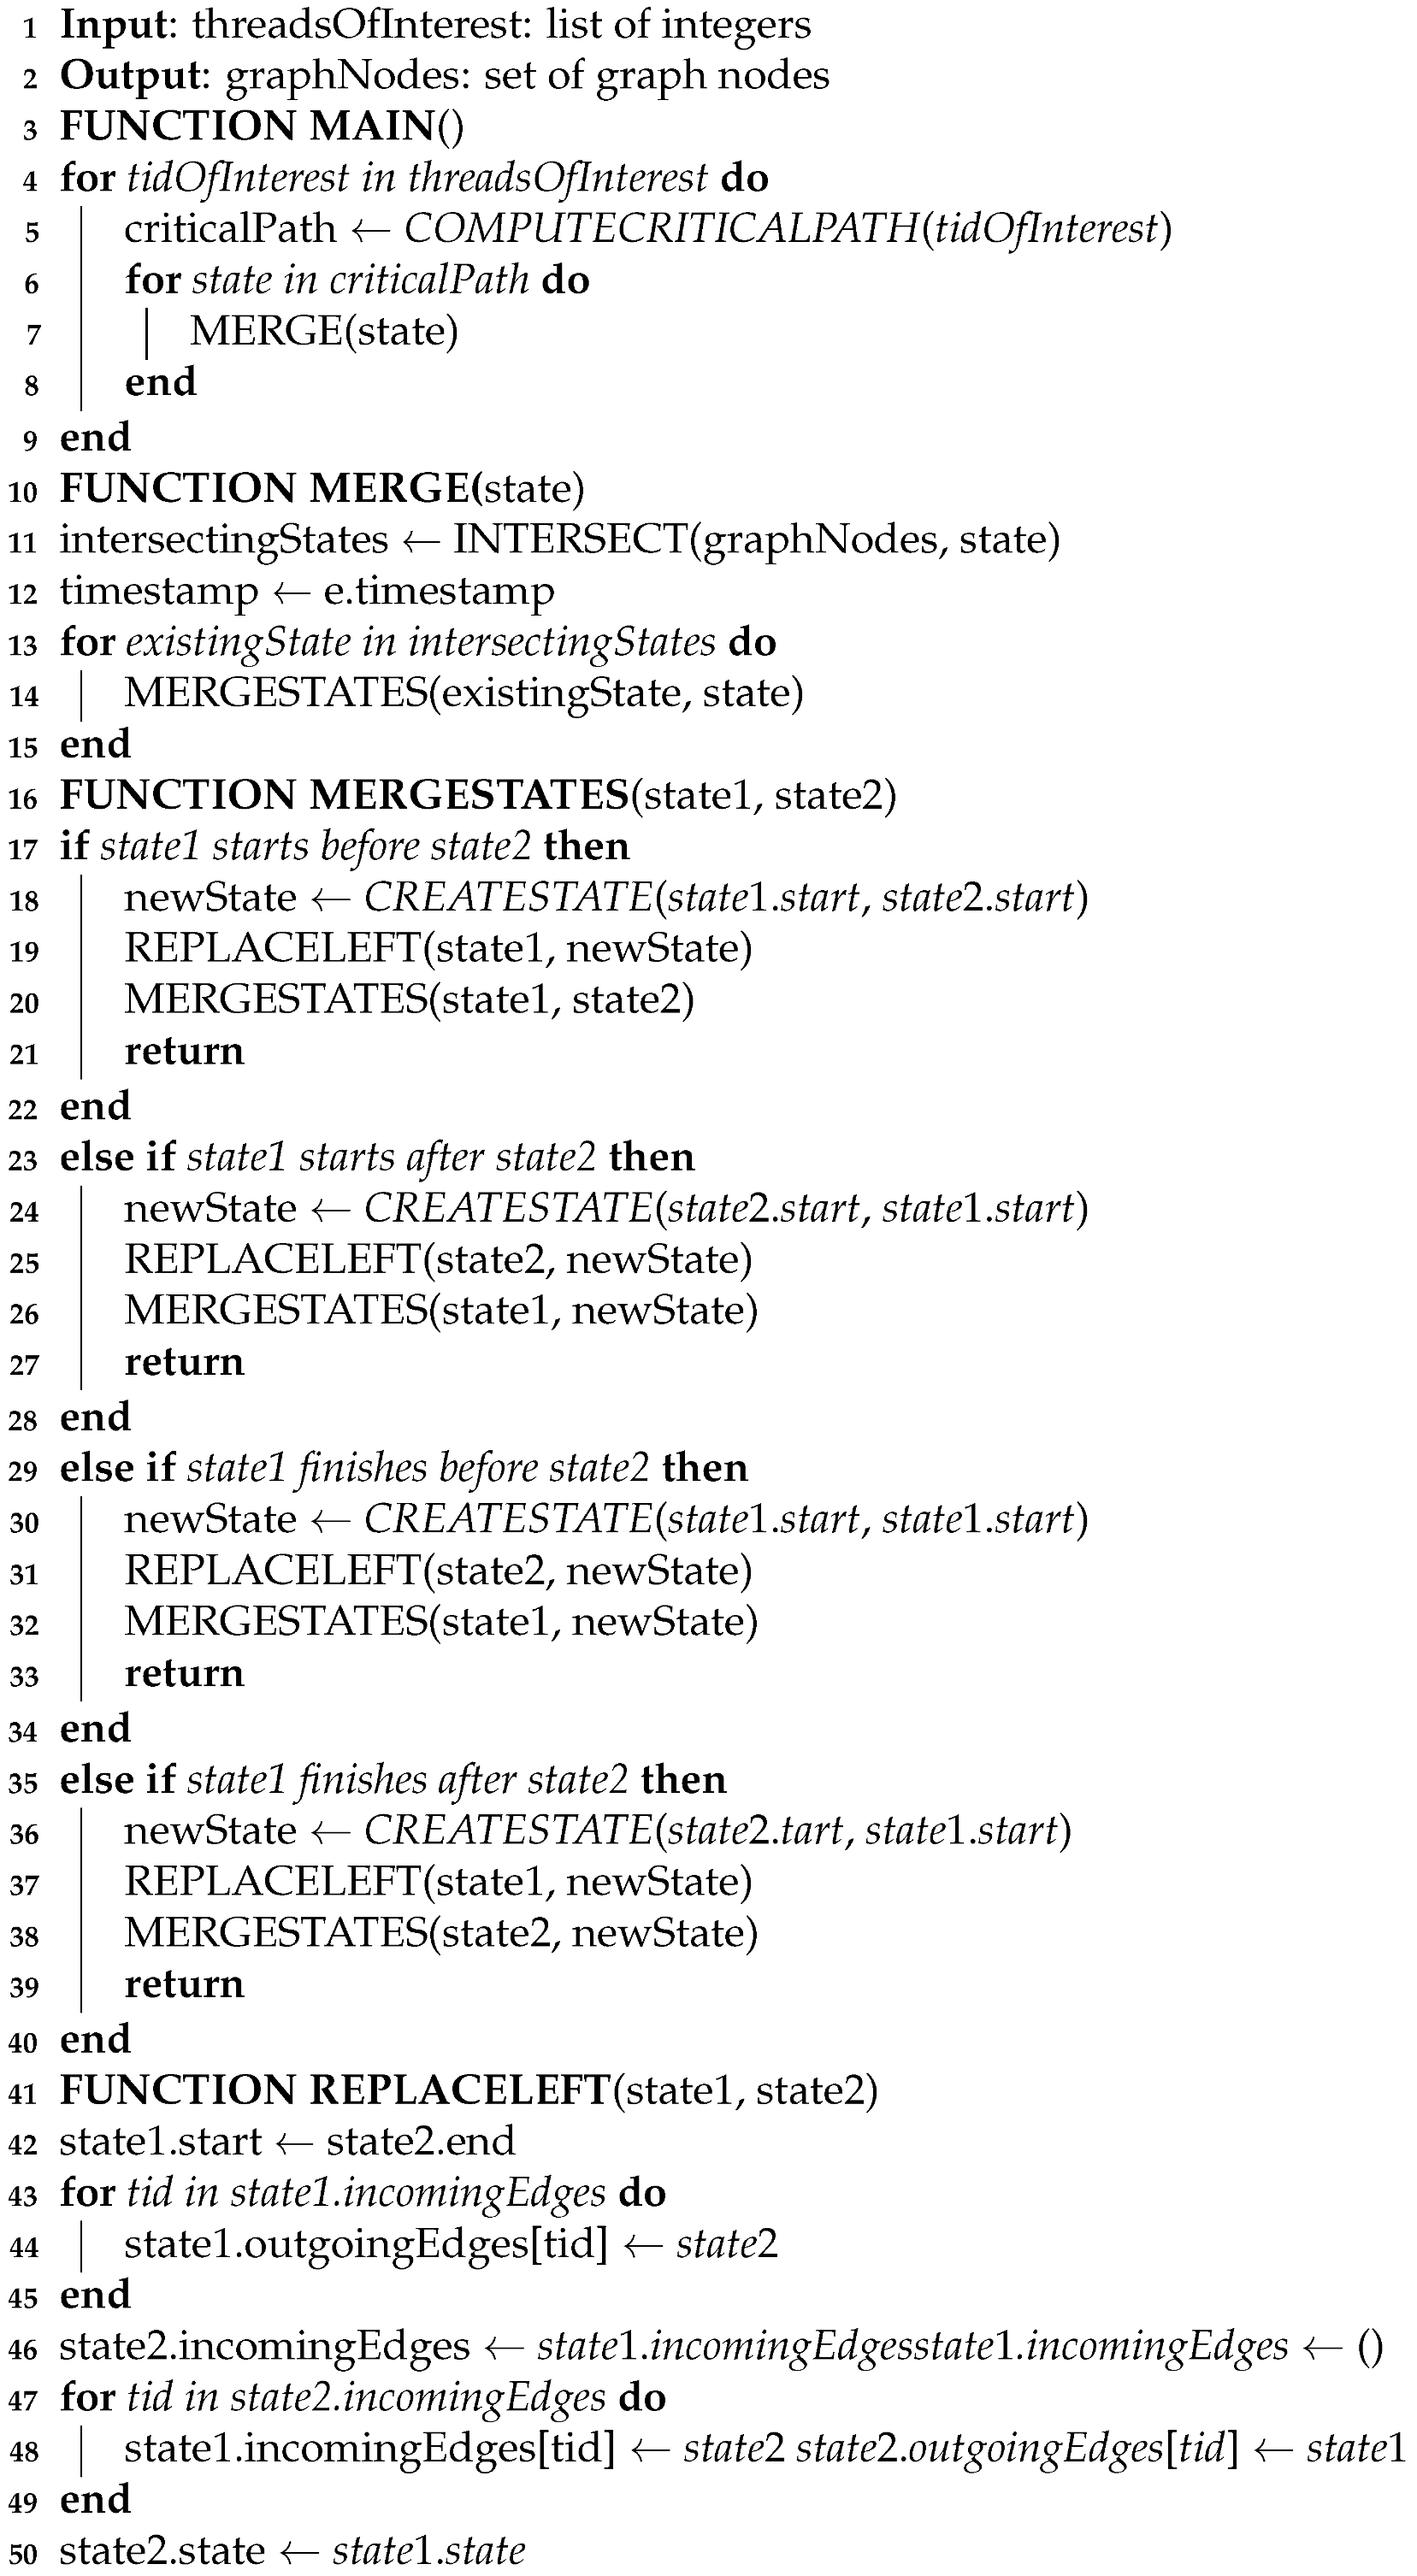
Simplified version of the Java data structure used for our critical path nodes. A node from the graph obtained by merging critical paths has all the information needed to traverse the graph for any thread of interest.
Figure 7.
Simplified version of the Java data structure used for our critical path nodes. A node from the graph obtained by merging critical paths has all the information needed to traverse the graph for any thread of interest.
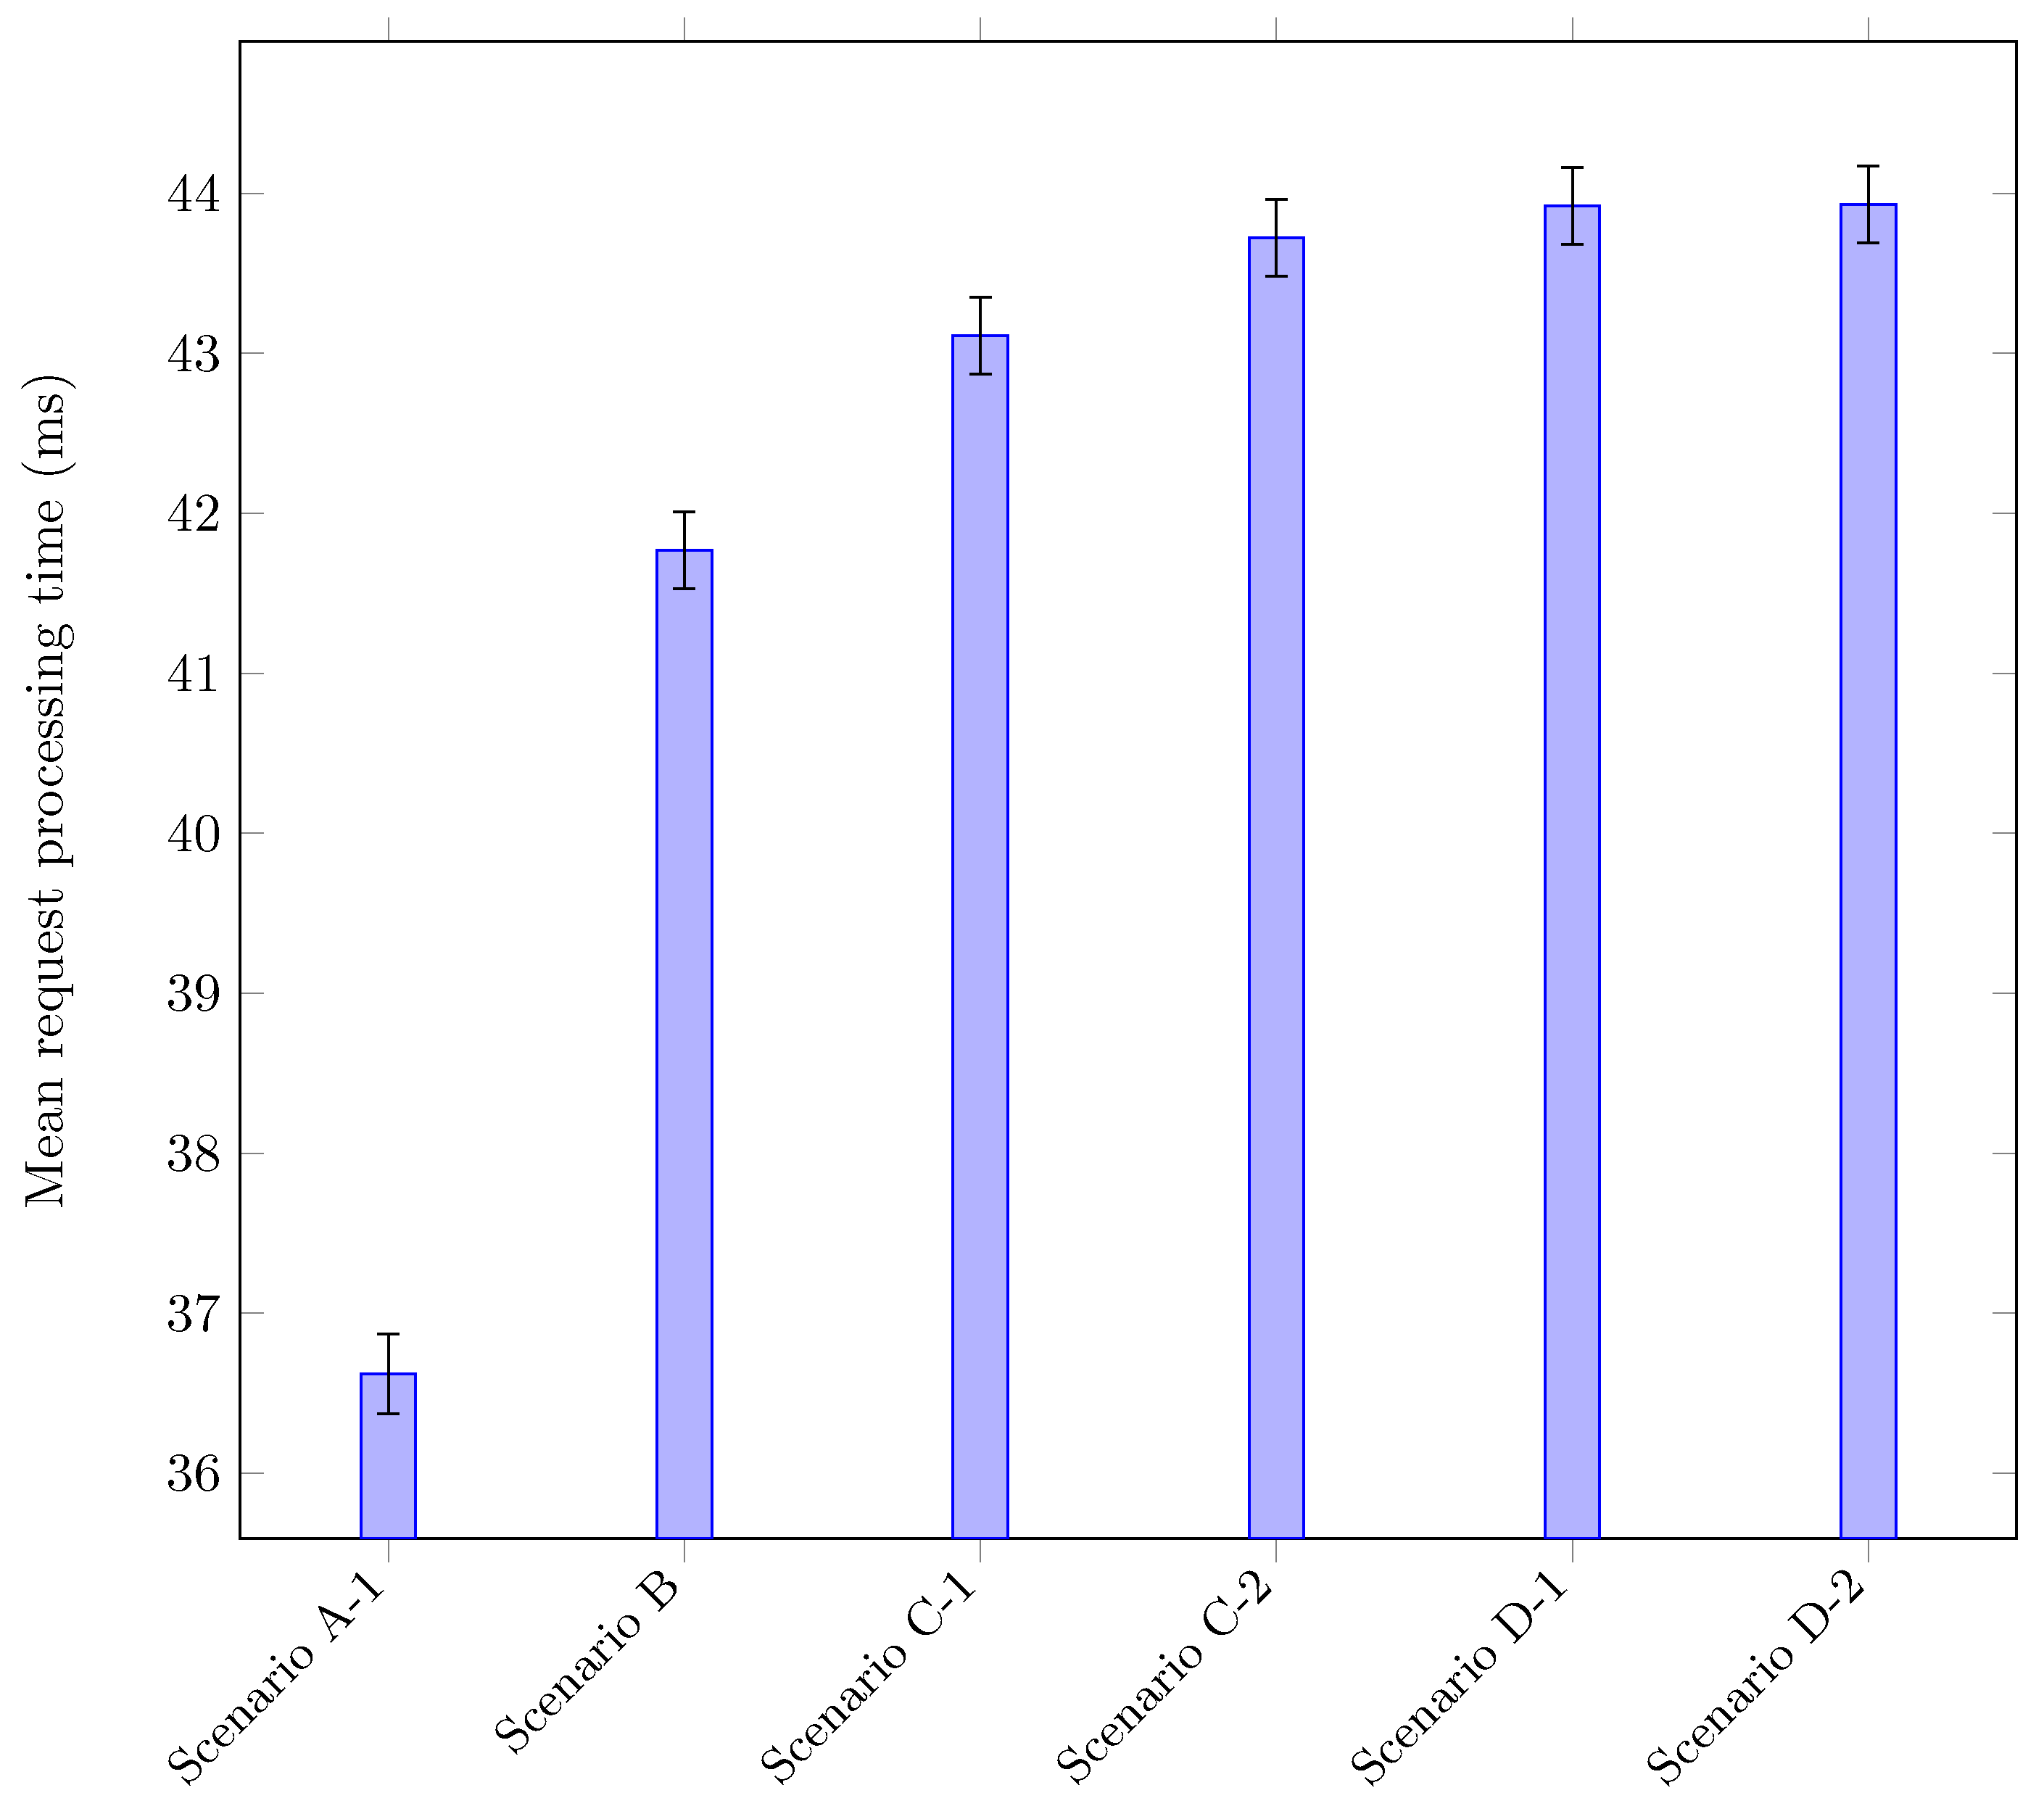
Figure 8.
Request processing times for HotROD using different tracing scenarios. The two configurations corresponding to our solution are scenarios C-1 and C-2, while the baseline—tracing with Jaeger only—is scenario B. For reference, scenario A-1 corresponds to disabling all tracing. Scenarios D-1 and D-2 are two configurations for the fake syscall technique that we implemented for comparison.
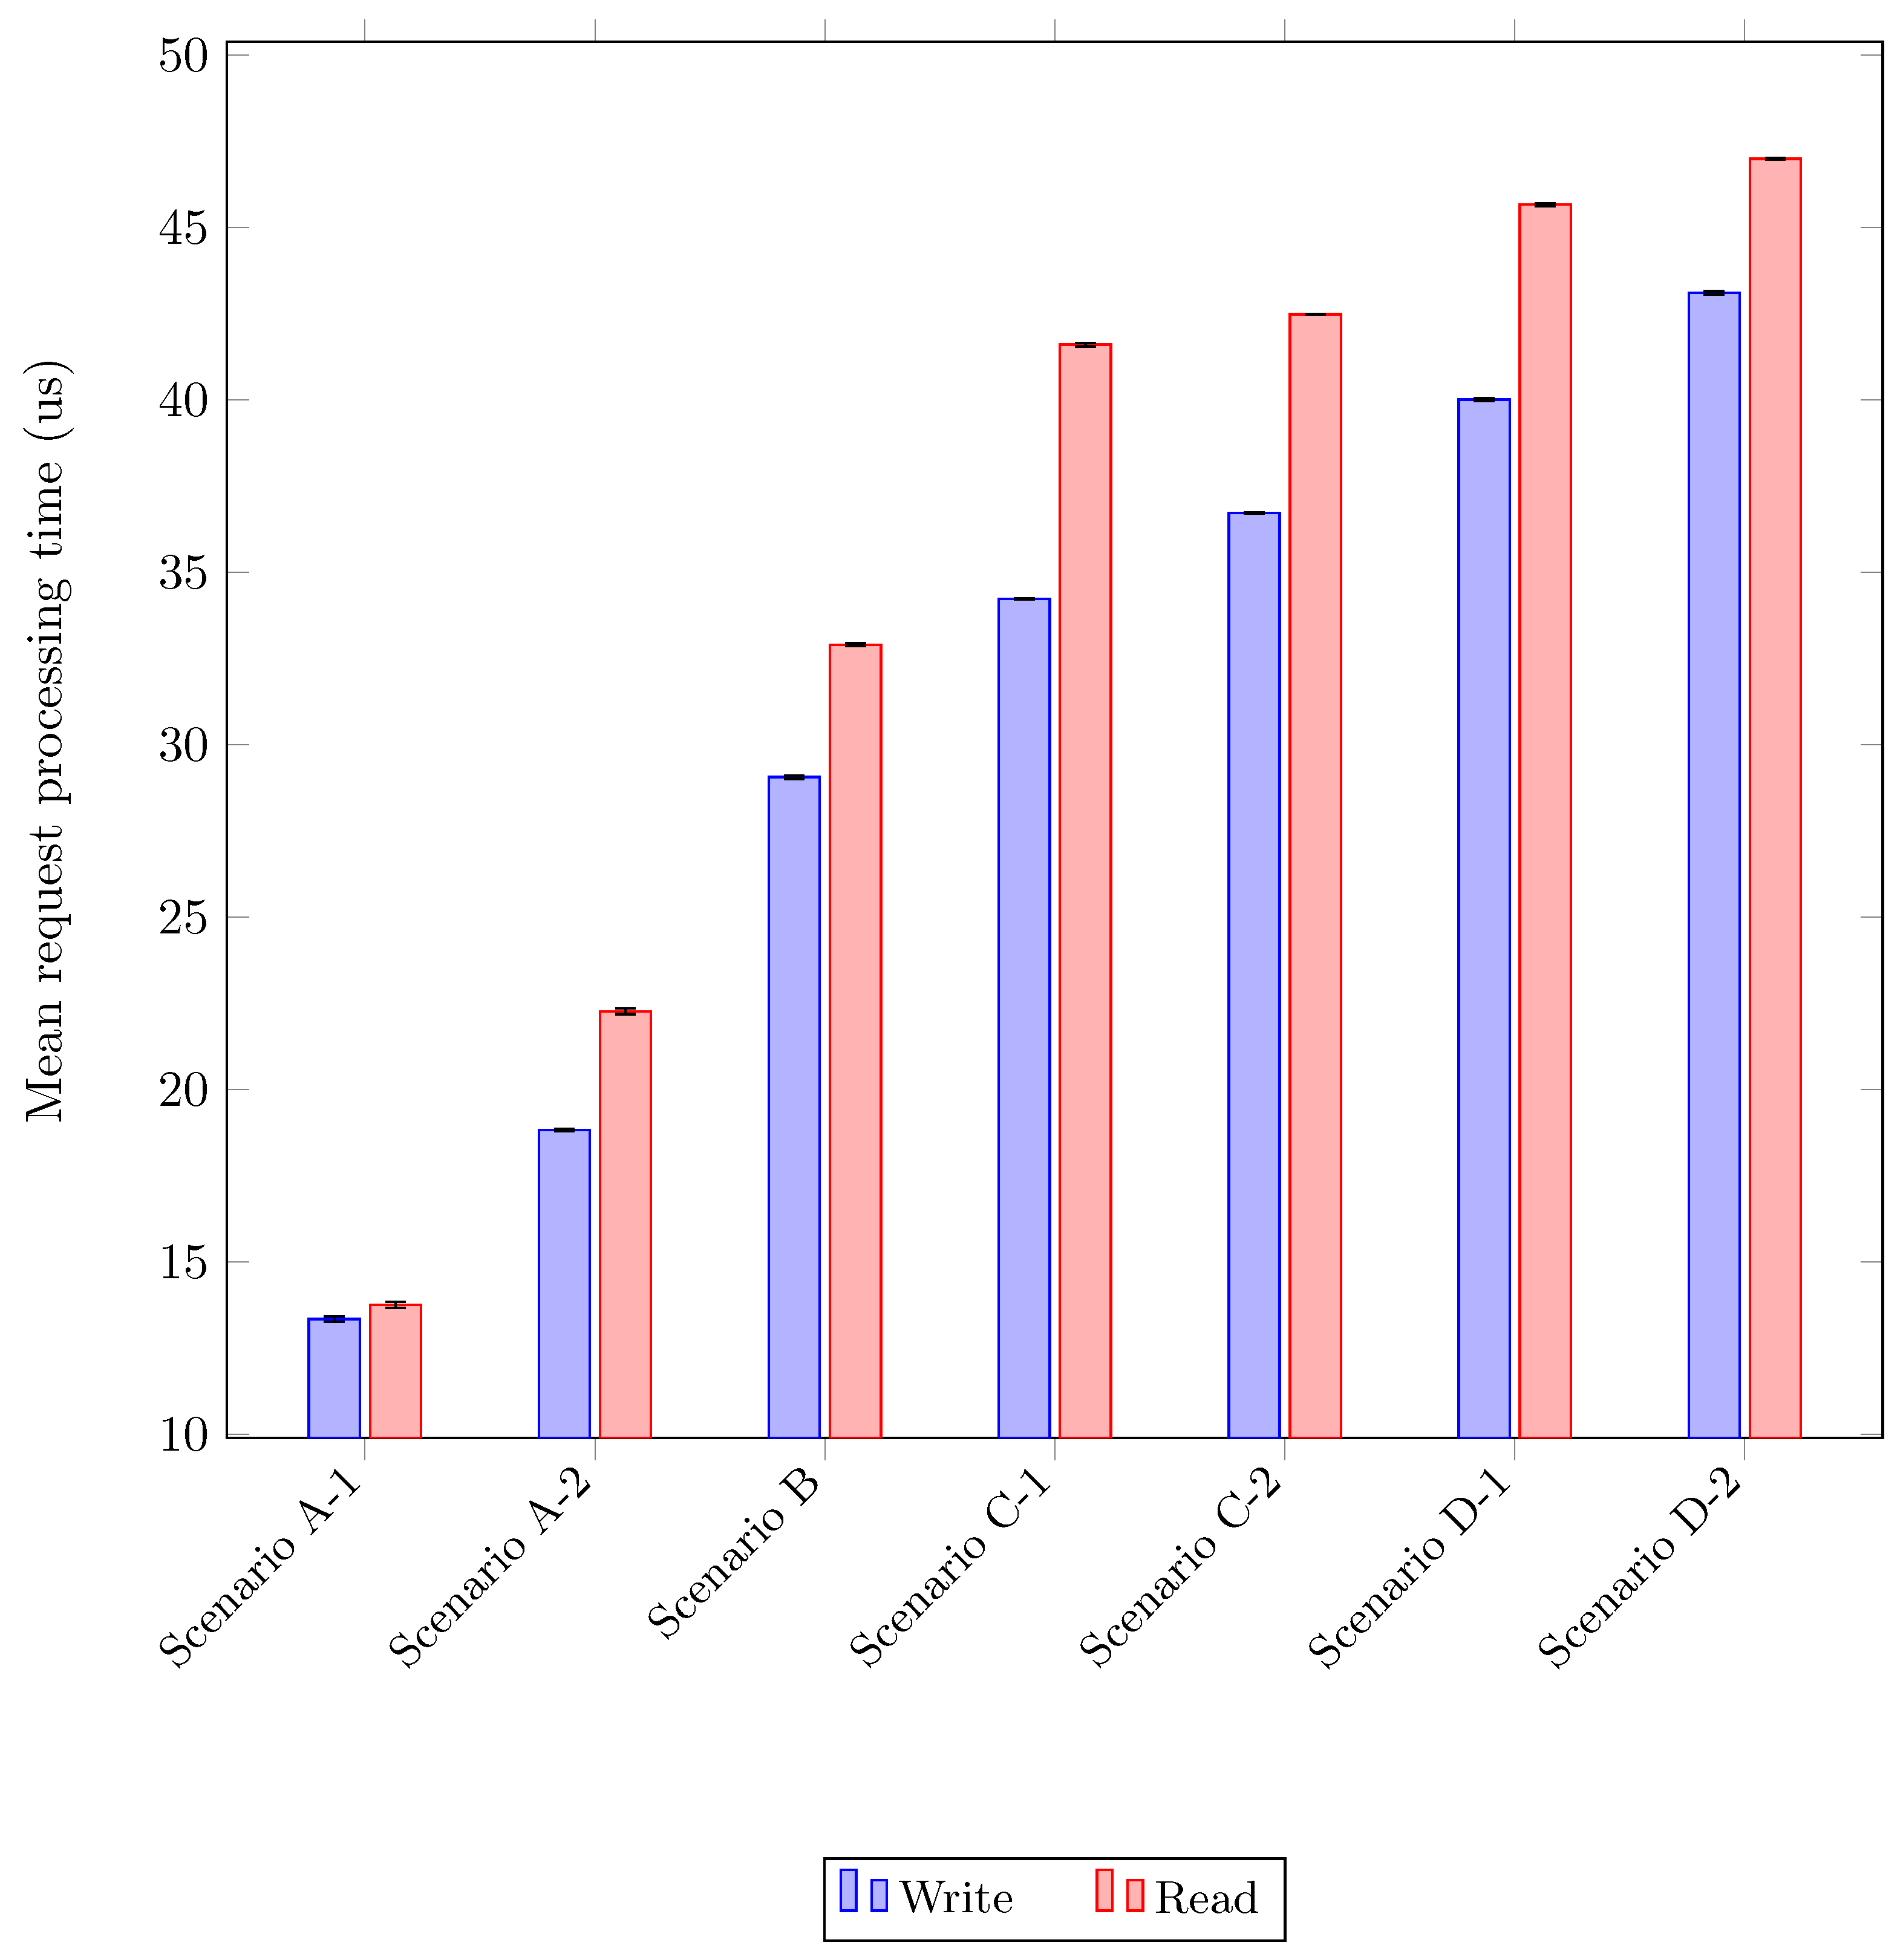
Figure 9.
Request processing times for Cassandra using different tracing scenarios. The two configurations corresponding to our solution are scenarios C-1 and C-2, while the baseline—tracing with Jaeger only—is scenario B. For reference, scenario A-1 corresponds to disabling all tracing and scenario A-2 to using the built-in request logging feature in Cassandra. Scenarios D-1 and D-2 are two configurations for the fake syscall technique that we implemented for comparison. For each scenario, we distinguish between read and write workloads.
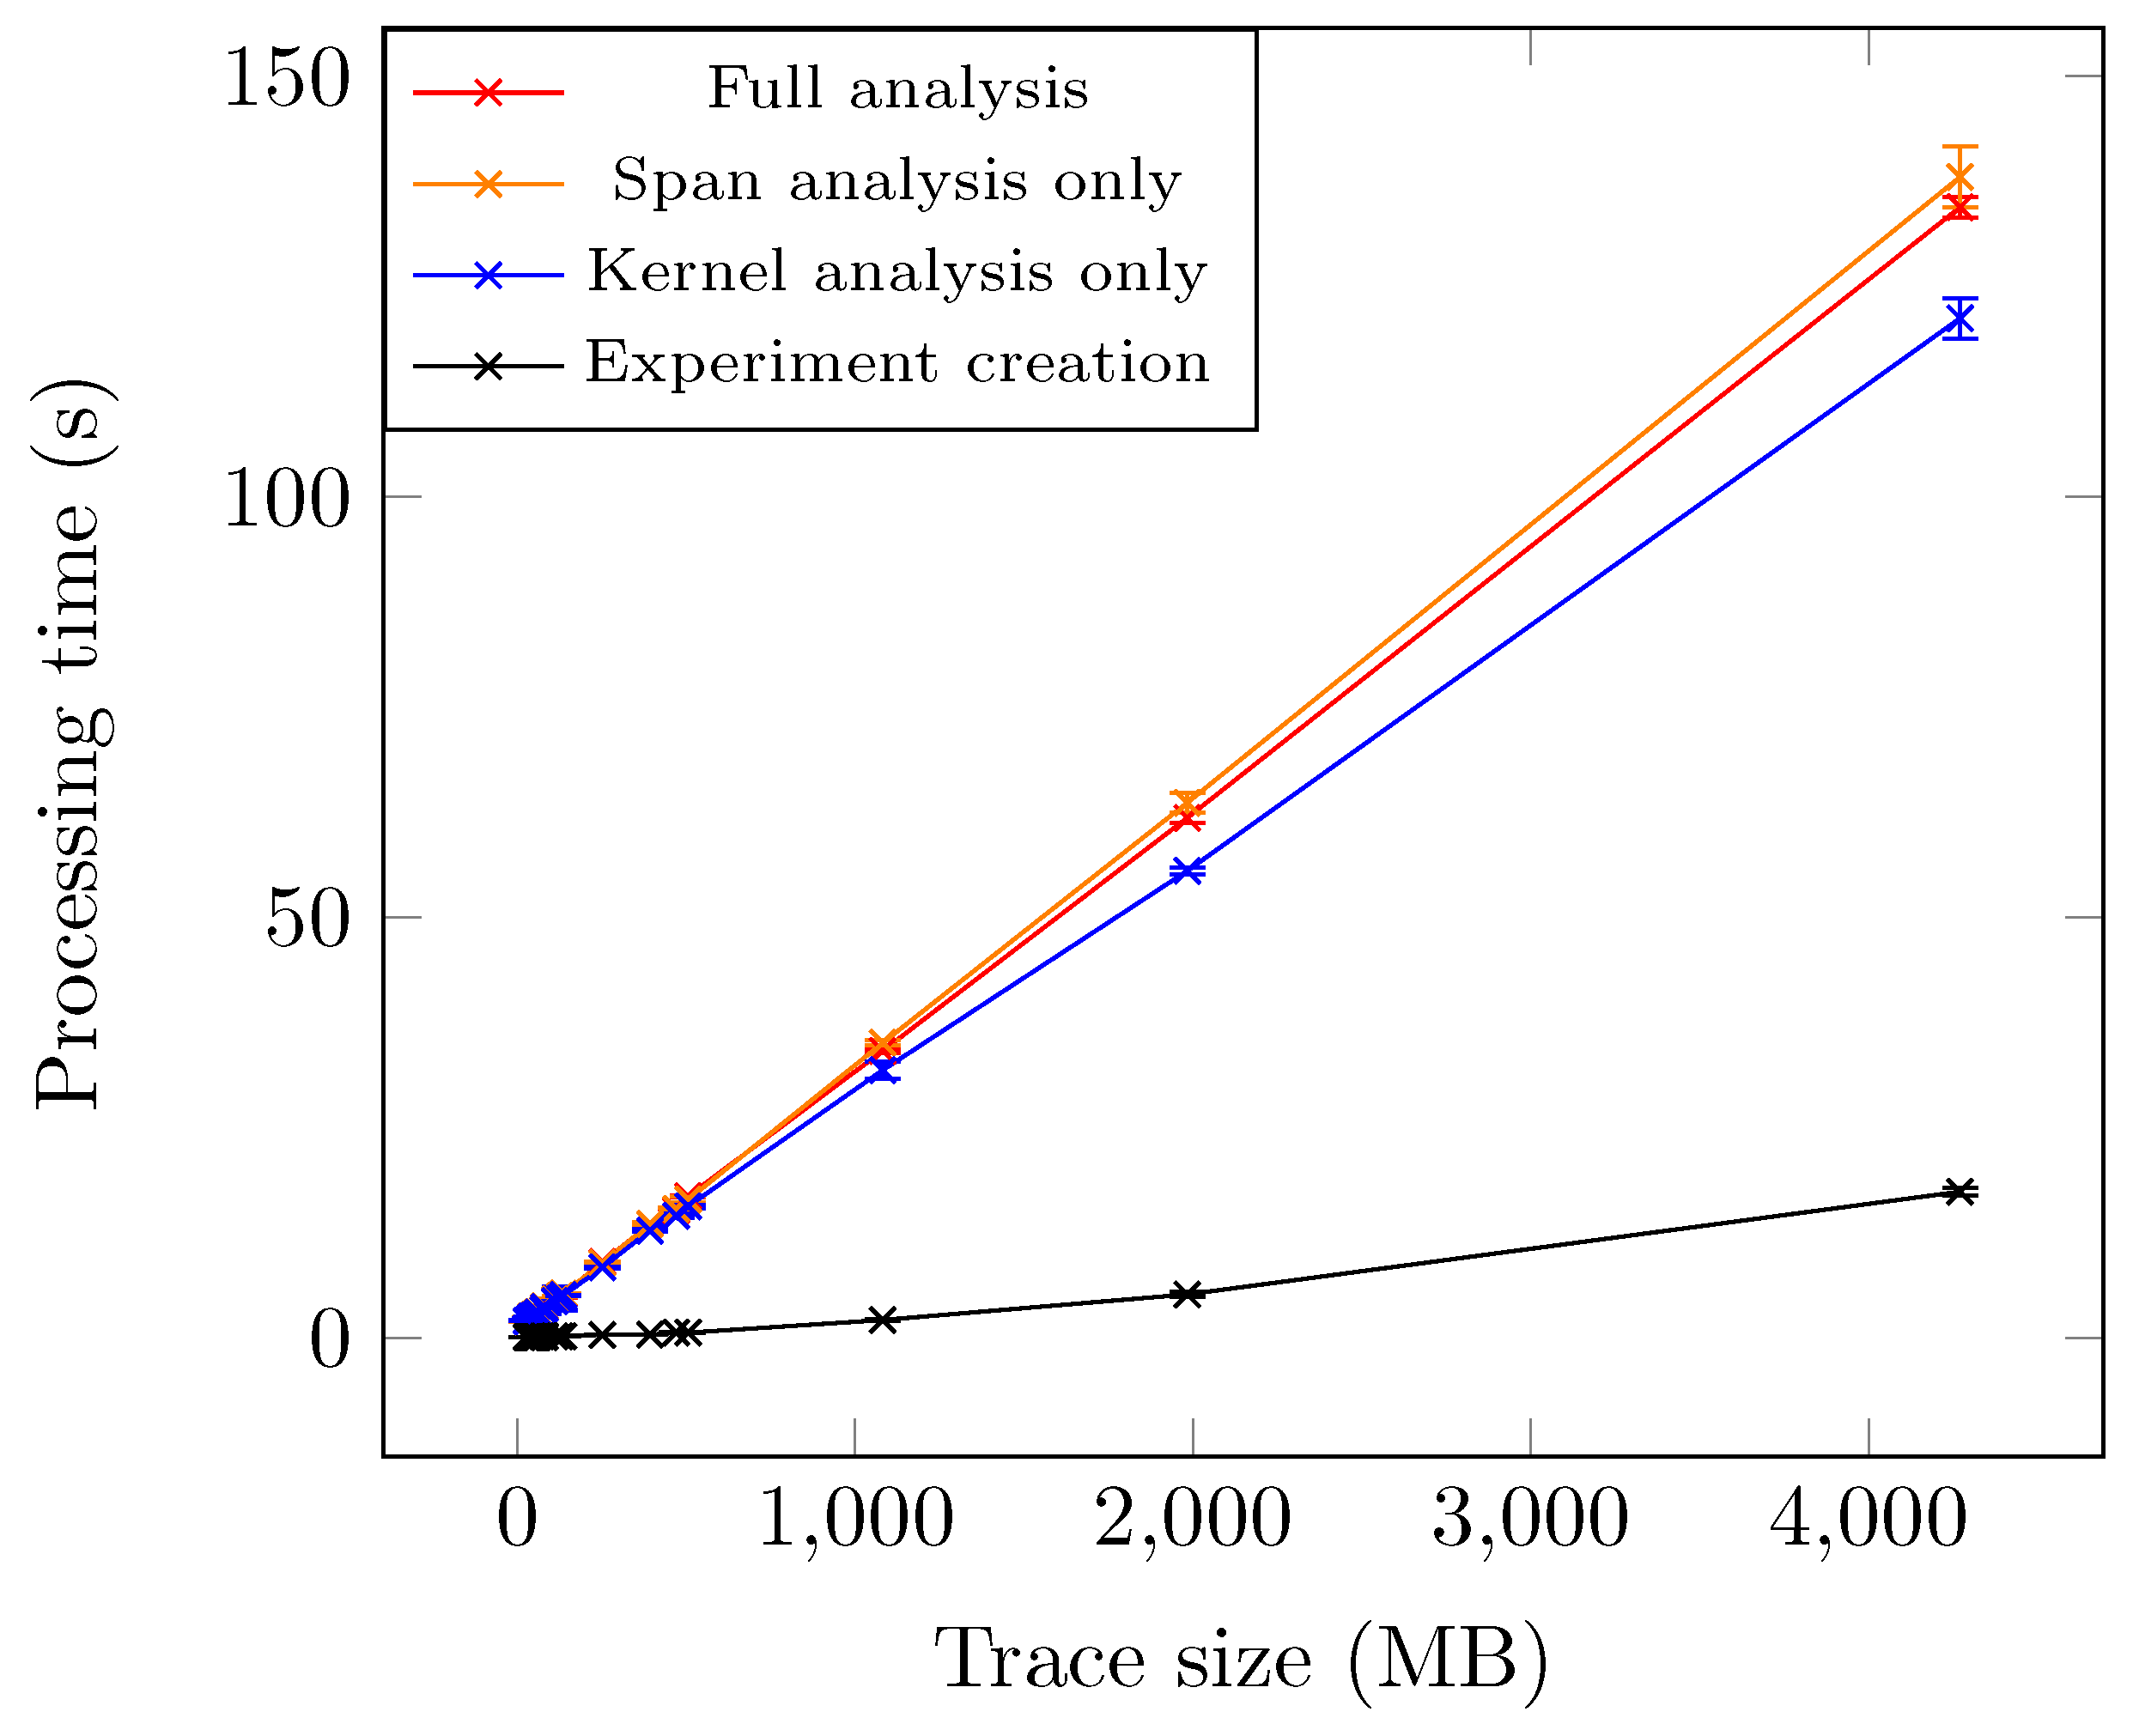
Figure 10.
Execution time of our critical path analysis of requests. Considering the test traces used, our analysis seems to scale linearly with the trace size. The execution time is very reasonable for moderately large traces.
Figure 10.
Execution time of our critical path analysis of requests. Considering the test traces used, our analysis seems to scale linearly with the trace size. The execution time is very reasonable for moderately large traces.
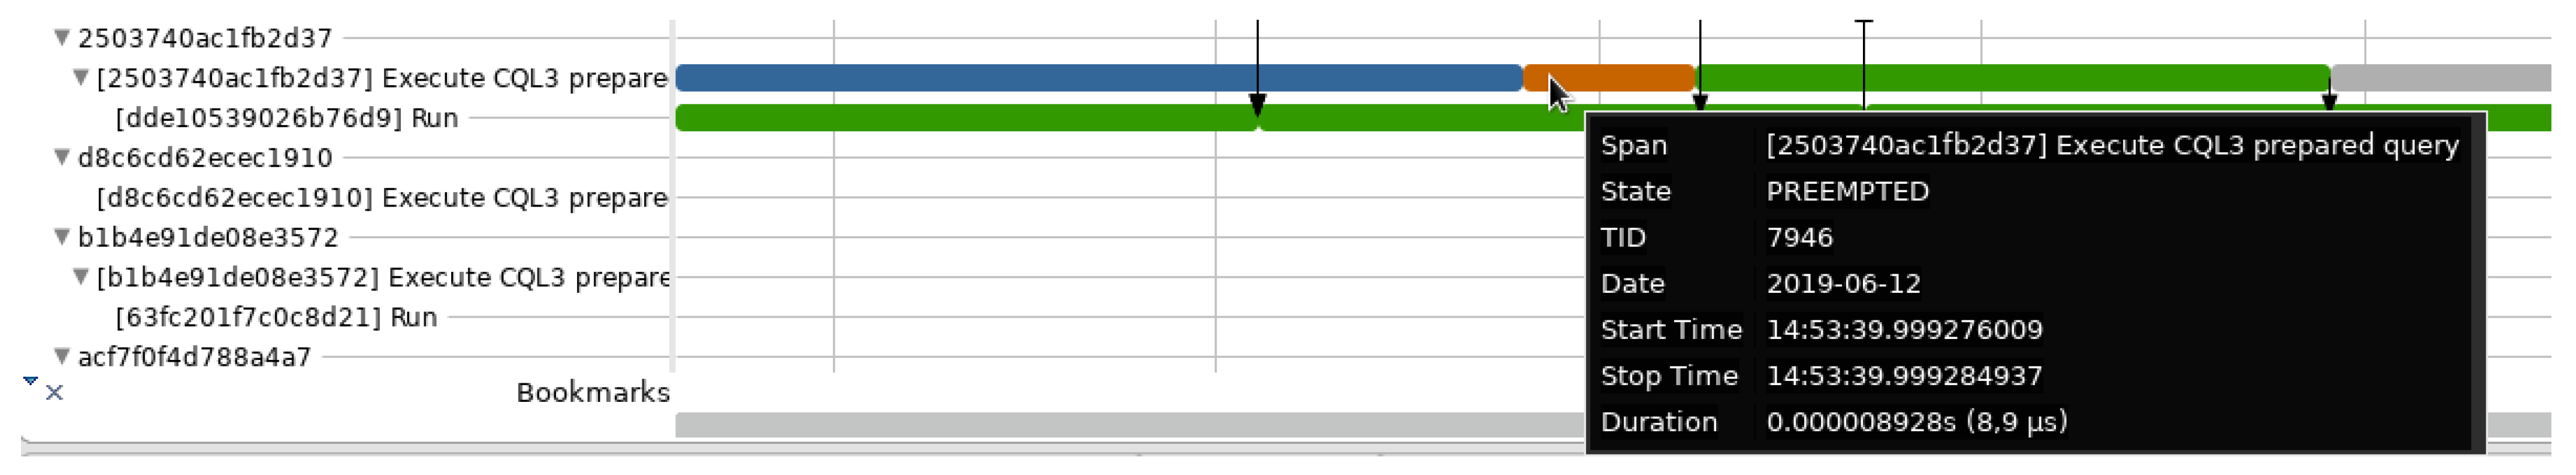
Figure 11.
Use case: tooltips. The tooltips in our analysis allow for getting more information about a given critical path state.
Figure 11.
Use case: tooltips. The tooltips in our analysis allow for getting more information about a given critical path state.
Figure 12.
Use case: identifying the latency. The requests are all equivalent in the expected execution time, but the ones on the left take 2 s to process, as opposed to about 5 ms for the ones on the right. The view shows that the slow requests spend most of their time waiting on CPU or on another request.
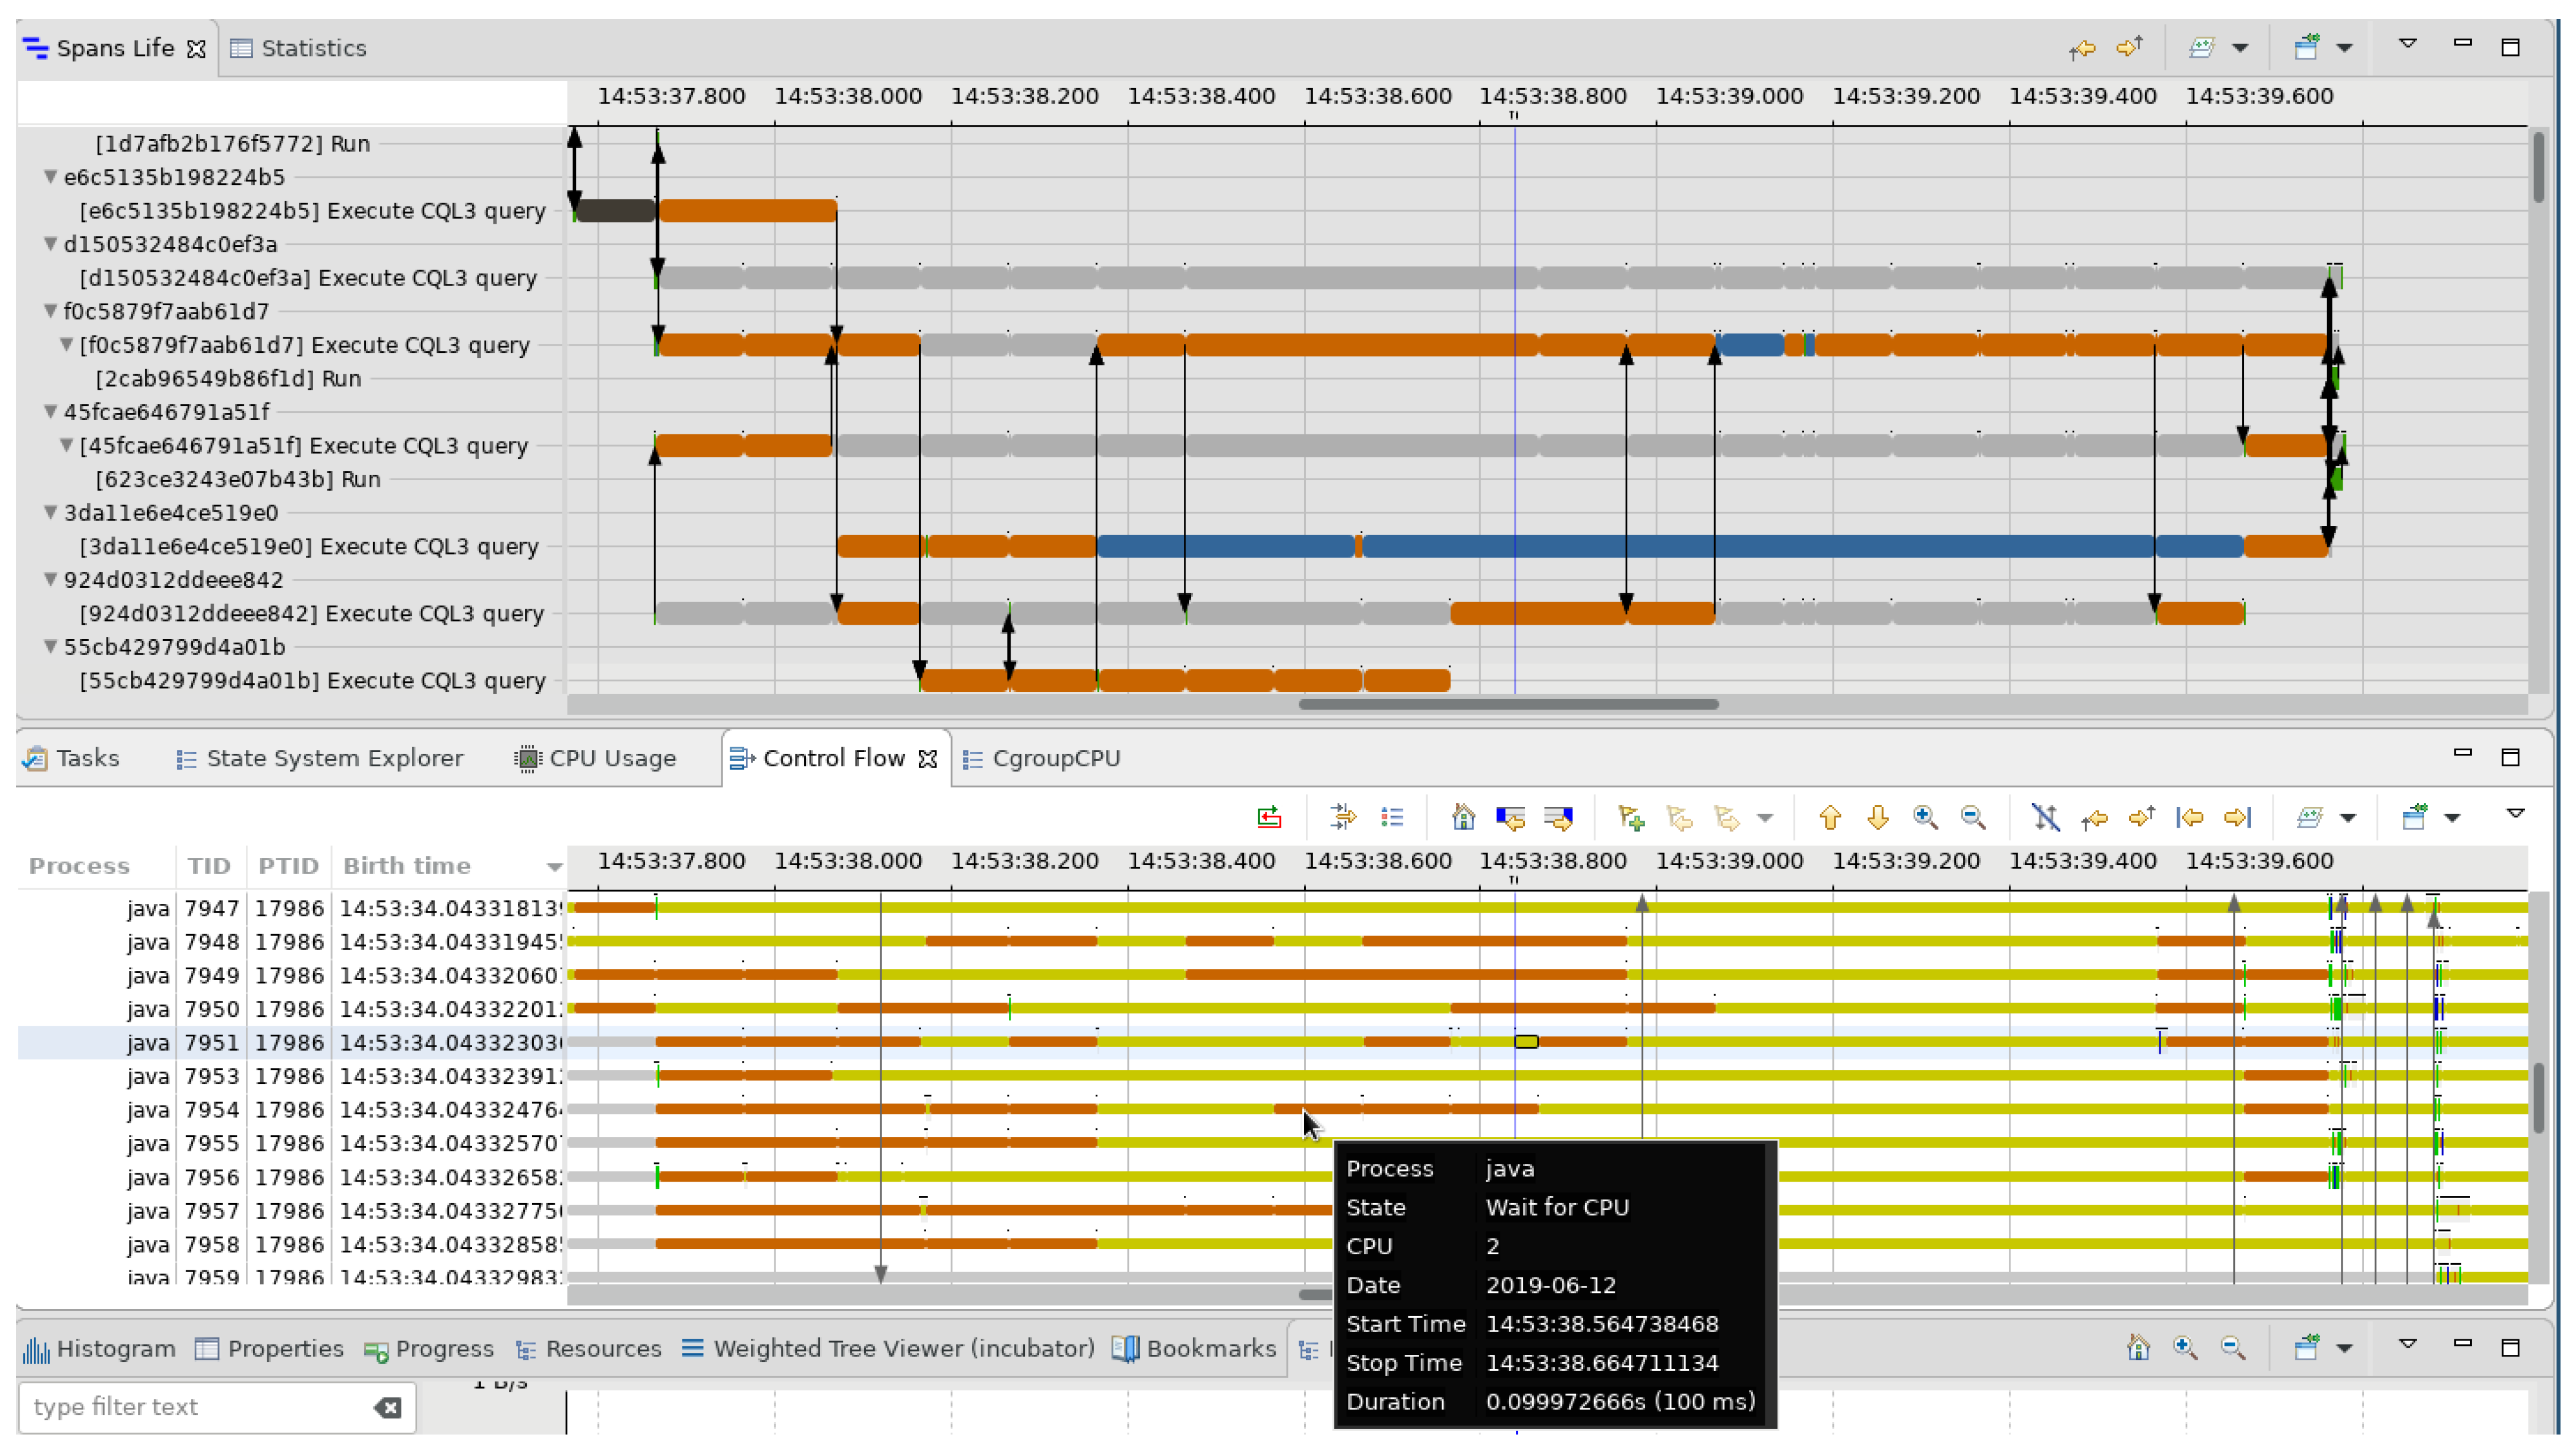
Figure 13.
Use case: CPU time sharing between worker threads. The Resources view in Trace Compass shows that the threads in Cassandra all share scarce CPU resources. They are waiting on the CPU or are blocked most of the time.
Figure 13.
Use case: CPU time sharing between worker threads. The Resources view in Trace Compass shows that the threads in Cassandra all share scarce CPU resources. They are waiting on the CPU or are blocked most of the time.
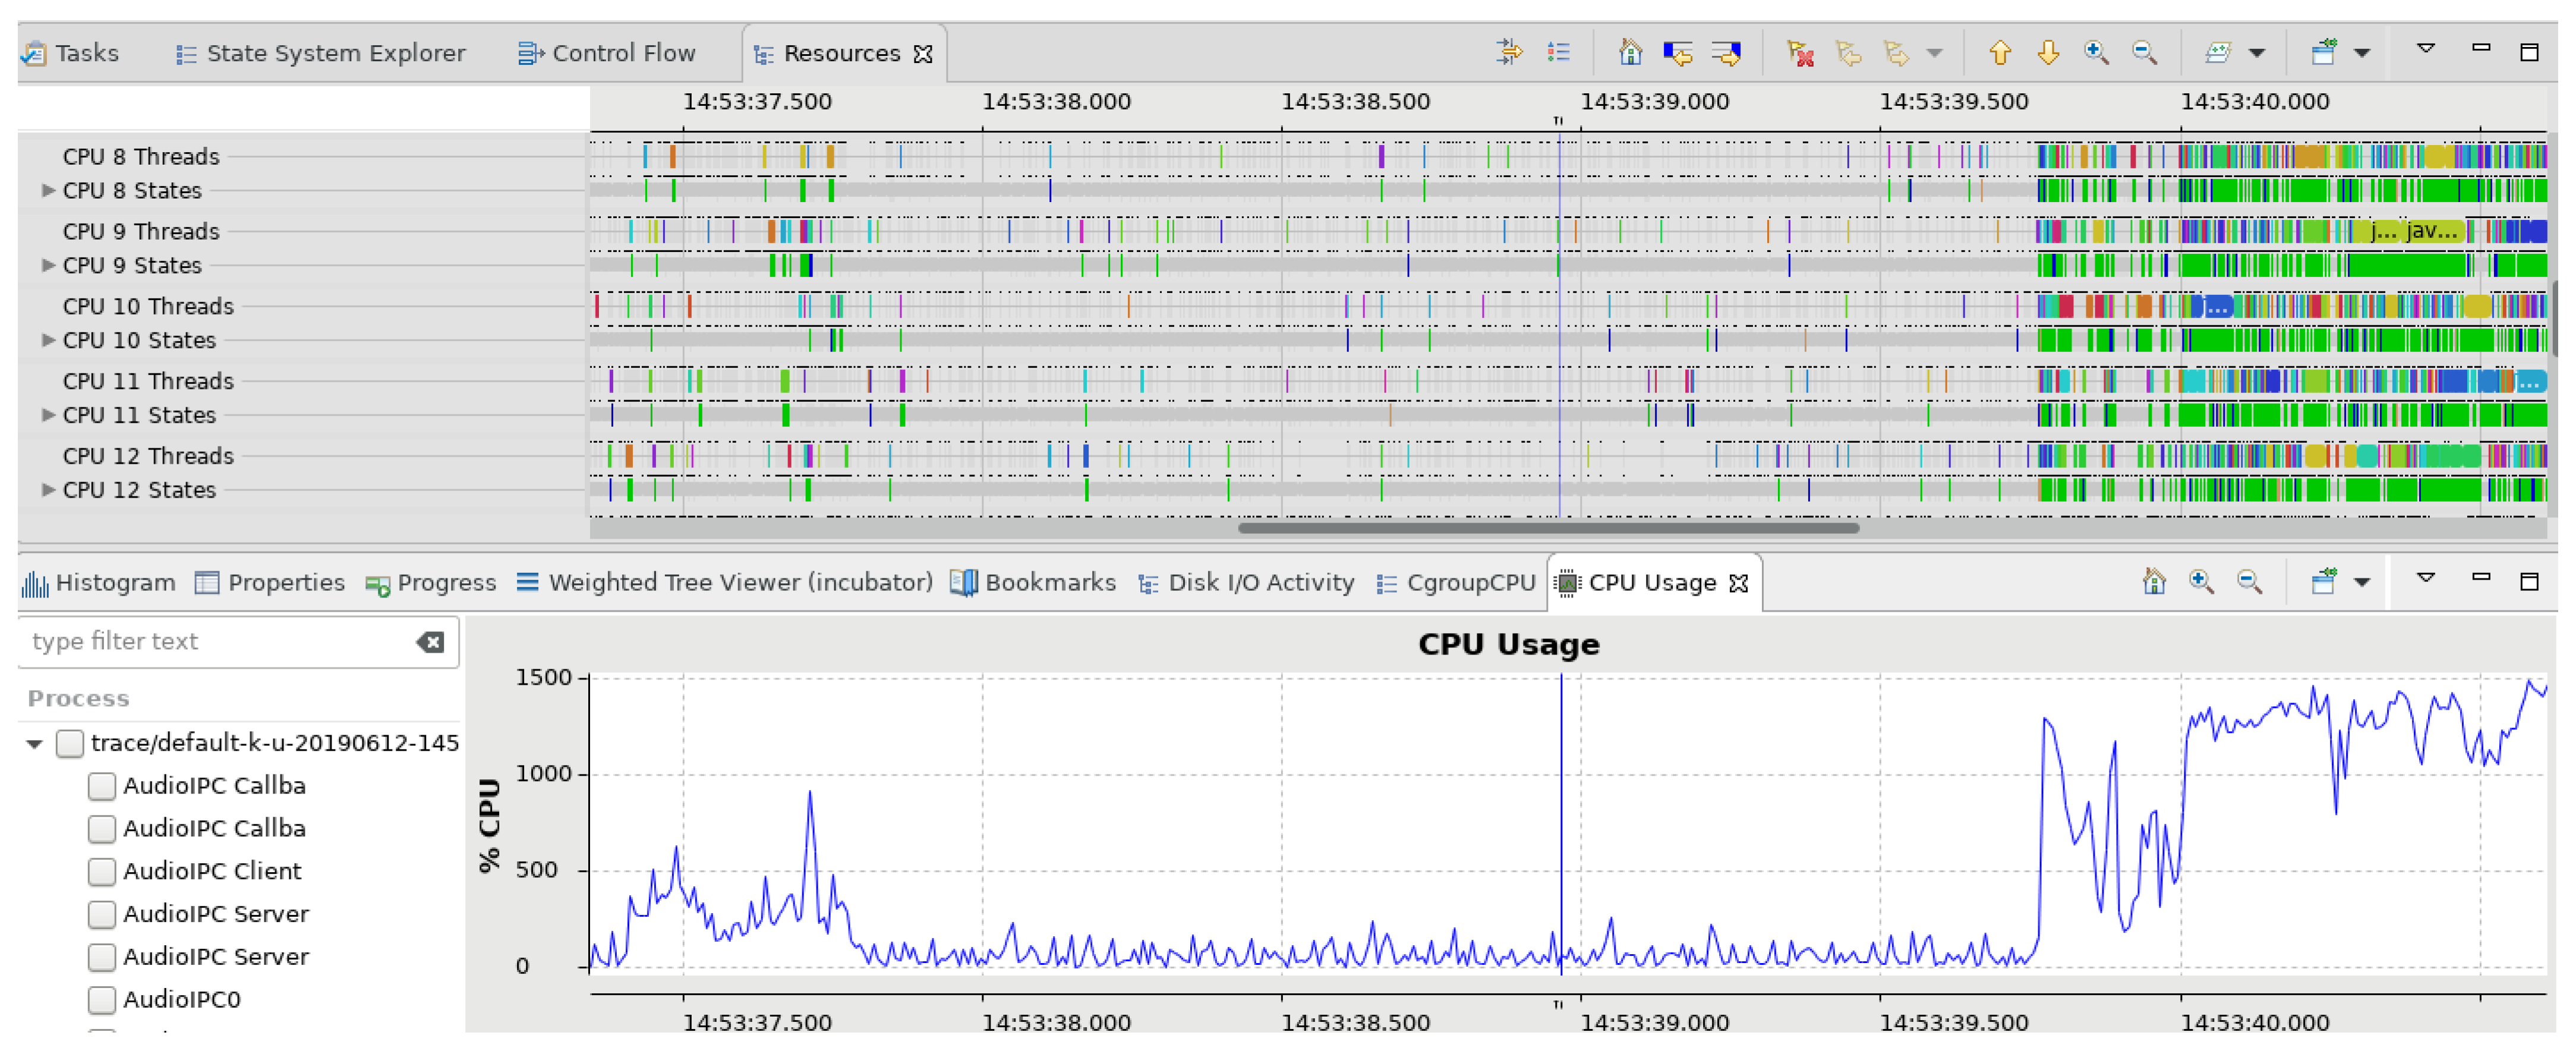
Figure 14.
Use case: sub-optimal usage of the CPU. Heavy CPU limit can lead to the machine being underused. Once the CPU limit is waived, the usage is back to normal.
Figure 14.
Use case: sub-optimal usage of the CPU. Heavy CPU limit can lead to the machine being underused. Once the CPU limit is waived, the usage is back to normal.
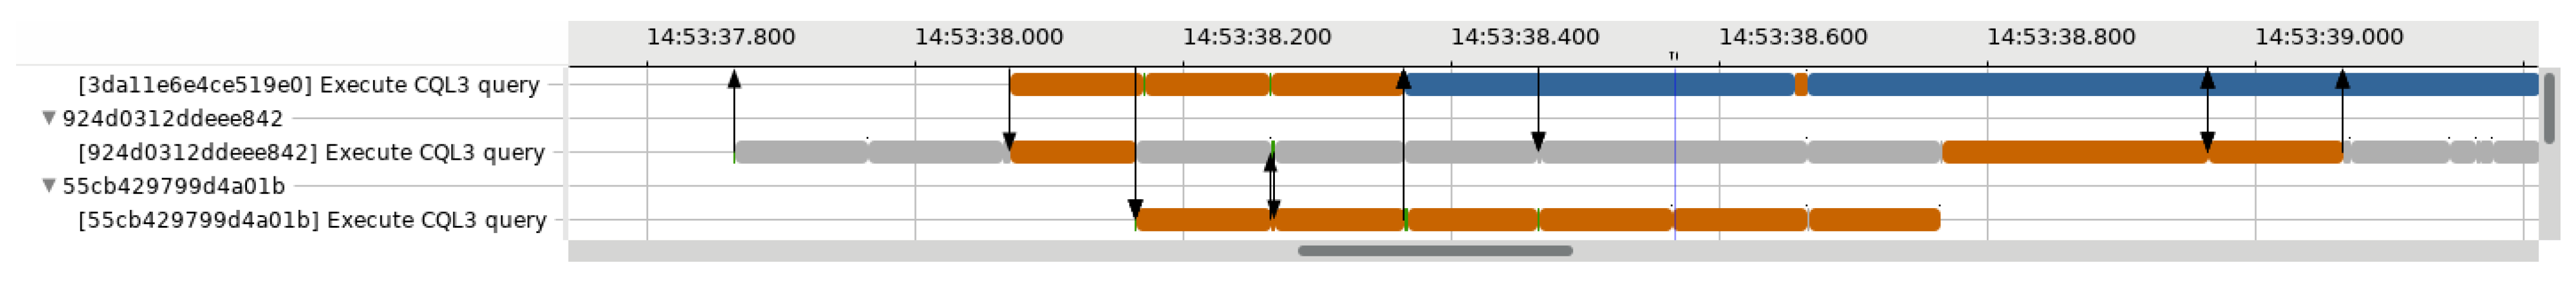
Figure 15.
Use case: pattern of preemption. Request 55cb429799d4a01b takes about 600 ms to process but shows a pattern of recurring preemption every 100 ms.
Figure 15.
Use case: pattern of preemption. Request 55cb429799d4a01b takes about 600 ms to process but shows a pattern of recurring preemption every 100 ms.
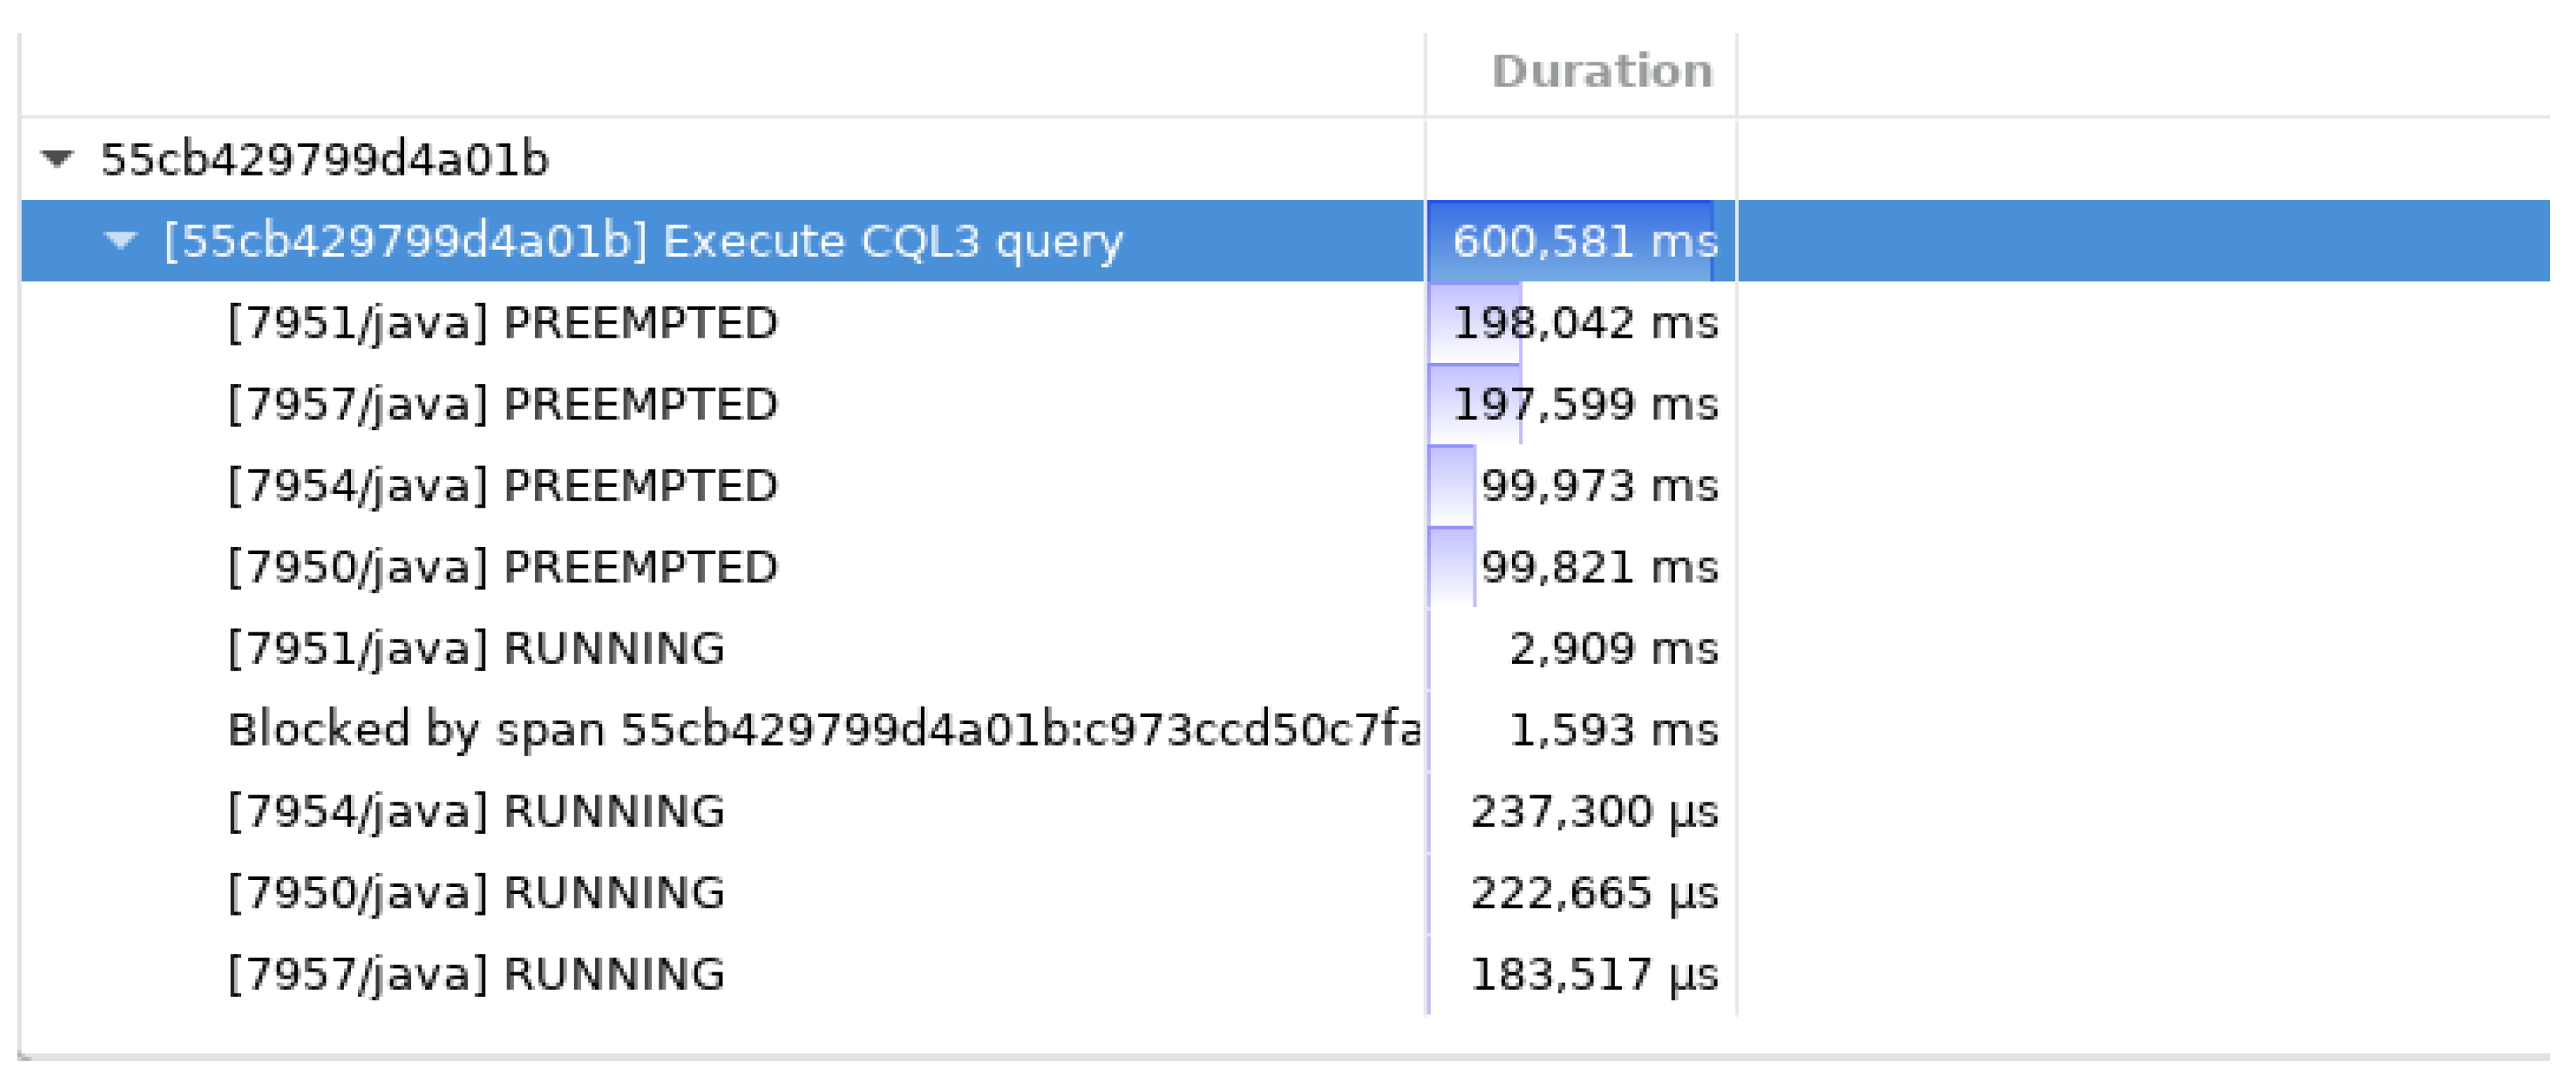
Figure 16.
Use case: summary of a critical path. The critical path summary shows that request 55cb429799d4a01b spends most of its time in the PREEMPTED state.
Figure 16.
Use case: summary of a critical path. The critical path summary shows that request 55cb429799d4a01b spends most of its time in the PREEMPTED state.
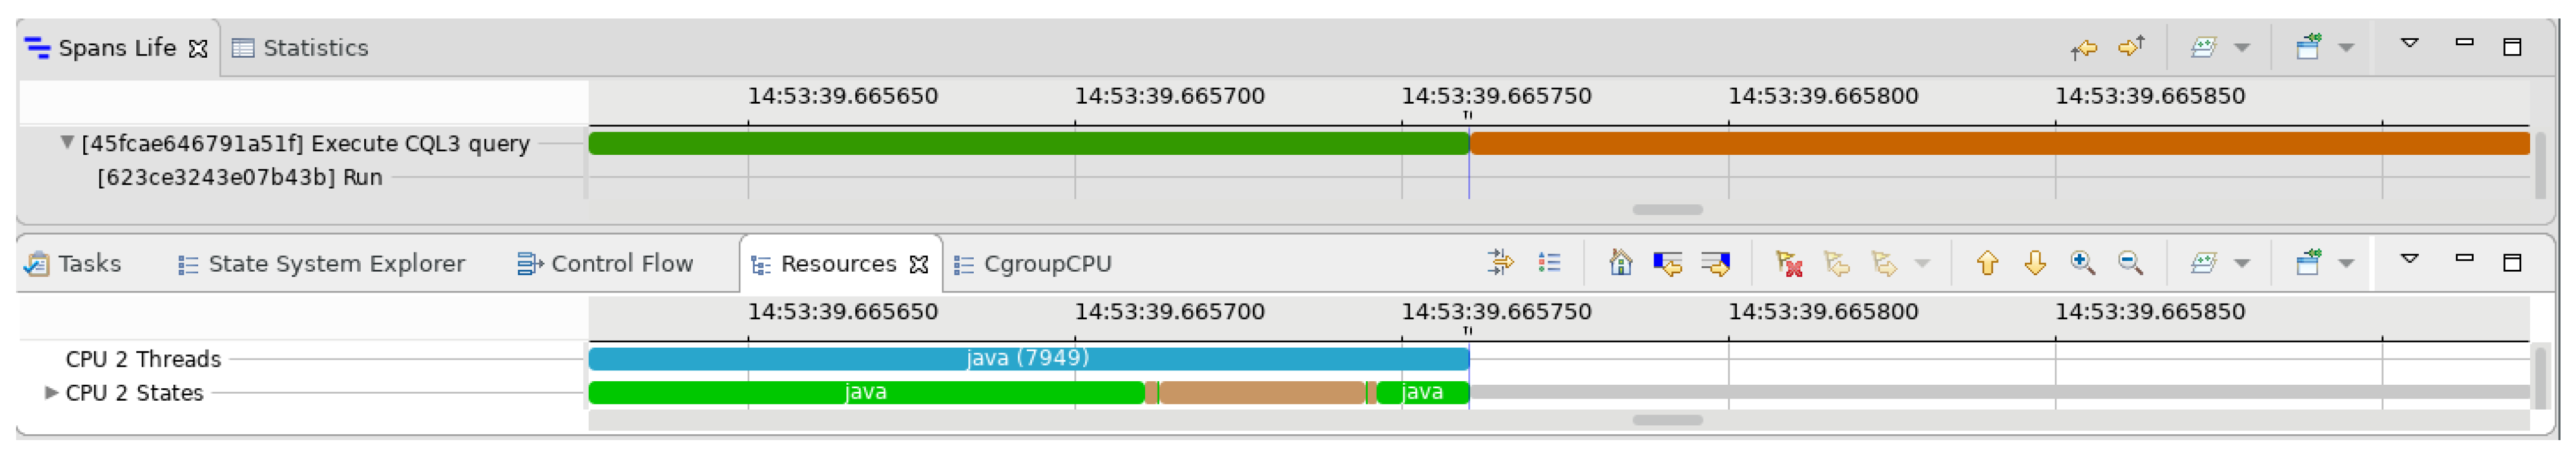
Figure 17.
Use case: preemption without replacement. The Resources view in Trace Compass shows that the java thread used by Cassandra is preempted but not replaced.
Figure 17.
Use case: preemption without replacement. The Resources view in Trace Compass shows that the java thread used by Cassandra is preempted but not replaced.
Table 1.
Comparison with selected related works.
Table 1.
Comparison with selected related works.
| Work | Distributed Tracing | Kernel Tracing | Critical Path Analysis |
|---|
| [1] | no | yes | no |
| [3] | yes | no | no |
| [4,5] | yes | no | no |
| [18] | yes | yes | no |
| [19] | yes | yes | no |
| [34] | no | no | yes |
| [39] | yes | yes | no |
| [42] | no | yes | yes |
| This | yes | yes | yes |
Table 2.
Overhead of our trace collection solution for HotROD. The overhead of our solution compared to the baseline is below 4% when using the snapshot mode in LTTng and around 5% when using the standard mode.
Table 2.
Overhead of our trace collection solution for HotROD. The overhead of our solution compared to the baseline is below 4% when using the snapshot mode in LTTng and around 5% when using the standard mode.
| Scenario | B | C-1 | C-2 | D-1 | D-2 |
|---|
| Reference | |
|---|
| A-1 | 14.1 ± 0.6% | 17.7 ± 0.6% | 19.4 ± 0.7% | 19.9 ± 0.7% | 20.0 ± 0.7% |
| B (baseline) | | 3.2 ± 0.6% | 4.7 ± 0.6% | 5.2 ± 0.6% | 5.2 ± 0.6% |
| C-1 | | | | 1.9 ± 0.6% | |
| C-2 | | | | | 0.5 ± 0.5% |
Table 3.
Overhead of our trace collection solution for high-throughput read workloads in Cassandra. The overhead of our solution compared to the baseline is below 18% when using the snapshot mode in LTTng and below 27% when using the standard mode.
Table 3.
Overhead of our trace collection solution for high-throughput read workloads in Cassandra. The overhead of our solution compared to the baseline is below 18% when using the snapshot mode in LTTng and below 27% when using the standard mode.
| Scenario | A-2 | B | C-1 | C-2 | D-1 | D-2 |
|---|
| Reference | |
|---|
| A-1 | 41.0 ± 1.1% | 117.7 ± 1.7% | 156.4 ± 1.7% | 175.0 ± 1.9% | 199.7 ± 2.2% | 222.8 ± 2.4% |
| A-2 | | 54.3 ± 0.5% | 81.8 ± 0.4% | 95.0 ± 0.4% | 112.5 ± 0.6% | 128.9 ± 0.7% |
| B (baseline) | | | 17.8 ± 0.2% | 26.3 ± 0.3% | 37.7 ± 0.4% | 48.3 ± 0.4% |
| C-1 | | | | | 16.9 ± 0.17% | |
| C-2 | | | | | | 17.4 ± 0.20% |
Table 4.
Overhead of our trace collection solution for high-throughput write workloads in Cassandra. The overhead of our solution compared to the baseline is below 27% when using the snapshot mode in LTTng and around 29% when using the standard mode.
Table 4.
Overhead of our trace collection solution for high-throughput write workloads in Cassandra. The overhead of our solution compared to the baseline is below 27% when using the snapshot mode in LTTng and around 29% when using the standard mode.
| Scenario | A-2 | B | C-1 | C-2 | D-1 | D-2 |
|---|
| Reference | |
|---|
| A-1 | 61.8 ± 1.7% | 139.0 ± 1.9% | 202.3 ± 2.4% | 208.7 ± 2.2% | 231.8 ± 2.6% | 241.4 ± 2.5% |
| A-2 | | 47.7 ± 0.7% | 86.8 ± 0.9% | 90.7 ± 0.8% | 105.0 ± 1.0% | 111.0 ± 0.9% |
| B (baseline) | | | 26.5 ± 0.3% | 29.1 ± 0.3% | 38.8 ± 0.3% | 42.8 ± 0.3% |
| C-1 | | | | | 9.8 ± 0.23% | |
| C-2 | | | | | | 10.6 ± 0.07% |
Table 5.
Use case: scheduling event for a worker thread. The worker thread is replaced by the virtual process swapper, which indicates that the CPU is becoming idle. The state of the worker thread is left to 0, meaning it could potentially be running.
Table 5.
Use case: scheduling event for a worker thread. The worker thread is replaced by the virtual process swapper, which indicates that the CPU is becoming idle. The state of the worker thread is left to 0, meaning it could potentially be running.
| CPU | Event Type | Contents | TID | Prio | PID |
|---|
| 2 | sched_switch | prev_comm=java, prev_tid=7949, prev_prio=20, prev_state=0, | 7949 | 20 | 5322 |
| next_comm=swapper/2, next_tid=0, next_prio=20 |


