Abstract
Artificial intelligence allows computer systems to make decisions similar to those of humans. However, the expert knowledge that artificial intelligence systems have is rarely used to teach non-expert humans in a specific knowledge domain. In this paper, we want to explore this possibility by proposing a tool which presents and explains recommendations for playing board games generated by a Monte Carlo Tree Search algorithm combined with Neural Networks. The aim of the aforementioned tool is to showcase the information in an easily interpretable way and to effectively transfer knowledge: in this case, which movements should be avoided, and which action is recommended. Our system displays the state of the game in the form of a tree, showing all the movements available from the current state and a set of their successors. To convince and try to teach people, the tool offers a series of queries and all information available about every possible movement. In addition, it produces a brief textual explanation for those which are recommended or not advisable. To evaluate the tool, we performed a series of user tests, observing and assessing how participants learn while using this system.
1. Introduction
Decision support systems (DSS) have attracted great interest since the beginnings of the Computer Age, being the subject of multiple studies and research. Generally speaking, DSSs can be defined as computer-based systems which help humans in the decision-making process [1]. Note that, typically, these systems are focused on assisting the decision maker, rather than replacing them. We can find plenty of interesting work in this field from the mid-20th century to the last years, mainly in the area of organization management: Muralidhar et al. described a DSS that helps electricity utility companies in the task of selecting and designing sampling procedures for precise estimation of electrical demand [2]; Basnet et al. created FleetManager [3] (a DSS developed to aid New Zealand milk tanker schedulers in creating or improving routes for their vehicles); or BRANDFRAME [4], presented by Wierenga et al., which is a system that assists brand managers in monitoring brands, diagnosing events, and planning proper marketing actions.
Educational applications and software for self-learning have also caught a lot of attention for years due to their great potential for accelerating and facilitating the learning process for a wide variety of tasks and areas. As an example, Ling et al. [5] evaluated how mobile applications could enhance student learning of statistical concepts, obtaining that those students who used the educational app performed better on practical problems. In a similar way, Griffith et al. [6] synthesized a series of studies evaluating the potential of educational applications in young children, concluding that interactive apps may be useful and accessible tools for supporting early academic development. Eagle et al. developed Wu’s Castle [7], a game where students program changes in loops and arrays interactively. This helps them visualize the code execution, thus, improving learning in introductory programming. As another illustrative case, Cavus [8] developed a mobile application for learning English pronunciation which utilizes artificial intelligence (AI) to recognize spoken words so that pronunciation errors can be detected and, later, corrected.
In the field of educational video games, CyberVR [9] (a virtual reality videogame that provides an interactive learning experience to improve the user awareness of cybersecurity-related issues) proves that these kinds of interactive applications are equally effective but more engaging than traditional learning methods such as textbooks.
AI is a really powerful tool that can be applied to a huge number of fields and problems. As an example, Aceto et al. [10] proposed the DISTILLER classifier, which employs a multimodal multitask deep learning architecture for encrypted traffic classification. AI can potentially allow computer systems to make decisions in a similar way to humans. Accordingly, the idea of applying AI to DSSs and educational applications seems to have great potential to improve the benefits and utility of these kinds of software. Thus, the aim of this study is to develop and present a tool capable of successfully transferring expert knowledge from an artificial intelligence system to non-expert humans. The approach we have chosen for trying to achieve this is to create a system which aids the user in making a concrete decision. This will be done by showing them the relevant information available, and offering them a recommended option, along with an explanation of why it is the preferred alternative, so the user can obtain knowledge and apply it later to different situations. Hence, the tool we present can be seen as a hybrid between a DSS and an application for self-learning. For this project, we are employing the AI system developed in our previous work [11], which is based on a Monte Carlo Tree Search (MCTS) algorithm combined with artificial neural networks (ANN) to achieve better results.
The idea behind this tool is to teach humans, or to speed up their process of acquiring knowledge, while learning a given task—in this work, we make use of a case study with a perfect information game, Dots and Boxes. To achieve this, we require an artificial intelligence system capable of making good level recommendations. However, we also need to implement techniques to facilitate the user’s understanding of the reasoning behind each recommendation. If the tool is capable of effectively transmitting why a certain decision is good—arguably, the best—the user can acquire and generalize knowledge and, potentially, they will be able to later apply it to a wide range of different particular scenarios.
Furthermore, for the tool to be more effective in speeding up the learning process of a user, it needs to be able to convince them of why a certain decision is the correct one in a given context. This becomes especially relevant in those situations where the benefits of that decision come in the long term, and even presents relevant drawbacks in the short term or implies giving up some condition that seems advantageous.
In this work, we propose a self-learning tool which allows users to play Dots and Boxes games and displays recommendations for every possible movement. The latter recommendations are based on the decisions made by the MCTS system and come along with some relevant information—this helps the user evaluate their different options and their consequences and, thus, make a decision—and textual explanations which are intended to make it easier for the user to understand those recommendations and to convince them that they are the correct ones.
In brief, this work focuses on trying to make the recommendations easily interpretable for a human user so that they can learn from the algorithm. The main contributions of this paper with respect to our previous work [11] are:
- An interactive view of the tree produced by the MCTS algorithm that allows the user to explore all the existing possibilities for each decision throughout the game. This tree view shows the player any helpful information about each node and implements a series of queries which allow searching, depending on their characteristics, for the distinct paths leading to a final state;
- A brief textual explanation of why a certain option is the recommended one. In a similar way, the tool tries to explain why some of the available options are the least advisable;
- A backend WebSocket server that, together with the interfaces between it and the interactive board and tree, allows multiple users to play games against the MCTS system and obtain its recommendations simultaneously;
- The study with real users that tries assessing whether they are capable of interpreting and learning from the recommendations produced by the MCTS algorithm or not.
From here, this work is structured as follows: In Section 2, we review some relevant backgrounds to this article. Section 3 introduces and explains the Dots and Boxes board game. In Section 4, we propose our work and present the tool we developed. In Section 5, we perform an evaluation of our proposal and present the obtained results. Section 6 deals with the limitations of this work and proposes a series of possible improvements and work to be done. Finally, in Section 7, gives a further interpretation of the obtained results and draws a series of conclusions.
2. Background
In this section we take a look at previous related work and some concepts we are using in this research: information representation through graphs, explainability of artificial intelligence systems, and learning phases theory.
In Table 1, you can find a summary of the most relevant related works grouped by topic and their most interesting aspects.

Table 1.
Main related works grouped by topic and their most relevant aspects for our paper.
2.1. Graph Construction and Representation Methods
A graph is an ordered triple of a non-empty set of vertices, a set of edges, and an incidence function which joins an edge with a pair of vertices. The graphical representation of graphs eases the interpretation of their information [12]. Graphs are commonly used in computer science to represent networks, databases, algorithms, and knowledge graphs, which are a way to structure information [13]. They represent facts, entities, relationships, and semantic descriptions [25]. They are usually associated to Web Semantics. According to Hogan et al. [26], one of the long-term goals of knowledge graphs is to help explaining data and models either for humans or machines. This is achieved through queries. Knowledge graphs can be generated by extracting the information from raw text as research from Koncel-Kedziorski et al. [27] and Schmitt et al. [28] shows, with the possibility of decoding it to text again. The objective is to use text generation to express complex ideas.
Trees are the data structure that the Monte Carlo Tree Search uses and they are a subtype of graphs. García-Díaz et al. [14] presented a tool set which eases the process of developing and testing MCTS systems, allowing to create applications using this kind of algorithms in a simple way. The tree our MCTS system generates encloses information about relations between different states—each of them represented as a node of the tree—and paths from an initial board configuration to a set of different reachable states. For each state, a set of game features such as game status, which player performed the last movement, the number of visits the node has obtained, or score and calculated win probability for each player. Having this into account, it is possible to fit these trees into a broader definition of knowledge graph, although they do not store semantic relationships between nodes. Domain-Specific Languages (DSL) can, in some contexts, ease the task of working with graphs as, for example, Social-Web Query Language (SWQL) [29] proves.
DSLs help the user avoid the technological concepts, obtaining an abstraction to work with keywords and concepts of the domain [30]. The reason being that a DSL is a small language that only has information about a specific domain, instead of General-Purpose Languages (GPLs) such as C++, Java, C#, Objective-C, or Swift, which use a lot of keywords such as static, protected, int, float, import, etc. As such, with a DSL, users just have to learn a reduced language about the domain in which they can work. Usually, the pros of using DSLs are: a great power of expression, an increase in productivity, less errors and mistakes, easier maintenance, and portability [31,32,33,34]. However, the drawbacks of using a DSL are related to a potential lower efficiency than a GPL—this depends completely on the implementation—and the costs of designing, constructing, and maintaining it [31,32,34,35]. A variety of examples of both graphical and textual DSLs can be found as, for example, Midgar [34], which presents a DSL for IoT applications which also offers a graphical web editor, or a DSL for easing the development of educational video games [36], raising the level of abstraction from a technological point of view, and allowing non-expert users to easily understand what they are doing.
Graphs can be created and stored with Domain-Specific Languages, such as Dot (https://www.graphviz.org/doc/info/lang.html accessed on 19 January 2021), or query languages for graph databases, such as Cypher (https://neo4j.com/developer/cypher/ accessed on 19 January 2021), and visualized with tools such as Graphviz (https://www.graphviz.org/documentation/ accessed on 19 January 2021) or Neo4j (https://neo4j.com/ accessed on 19 January 2021). Dot stores information and relationships between nodes, so that this can be read by Graphviz to generate an image with the provided information. Gansner et al. [37] show how by combining these two technologies you can easily produce complex graphs writing few lines of code. For its part, Cypher is a language which permits storing and querying data in graph data models—which offer the advantage of representing data naturally as a graph structure—allowing a direct expression of graph-oriented operations, such as transitive closure. For further information, Francis et al. [38] provide a definition, examples of use, and describe its properties for easily expressing subgraphs of interest. Cypher is the language used by Neo4j graph databases, which also allows to graphically visualize the relationships between nodes. Taking all this into consideration, graphs will be used in the tool we are presenting for their proven capabilities for storing information for different nodes or states, and easily keep and represent relationships between them.
Graphs are a widely used mean of encoding information, they are employed in a huge variety of scopes and can be found in extremely distinct matters: using graphs for representing different stages in potential network attacks and the relations between those phases [39]; structuring associations between distinct web pages, permitting a more efficient processing of massive repositories [40]; or even representing computer programs to perform different tasks over them such as renaming variables or detect misused variables [15].
2.2. How to Explain Results from Artificial Intelligence
Predictions in machine learning algorithms are often an answer to a problem which requires the analysis of big amounts of data. In some cases, where the result is applied in a high-risk environment, just knowing the prediction is not enough [16]. For example, the answer to the question “will this drug be effective to this patient?” can output a percentage based on several patient and drug factors. However, in this context, where the health of a person is on risk, we are lacking the “why”. Why is the drug effective (or not)? Doshi-Velez et al. [17] say that a prediction without explanation of how the model came to it would be an incomplete solution to the problem. According to these authors, there are scenarios where that explanation is needed such as:
- Scientific understanding. On research, causes of certain decisions should be clear. For example, on drug discovery over molecular science [41];
- Safety. In scenarios where human physical integrity may be compromised, safety is a very important factor. For example, Lauritsen et al. [42] presents a system which contributes with clinical translation to decisions made by an AI model to early detection of serious illness;
- Ethics. Algorithms can lead to biased predictions, and to avoid discrimination their answers must be reviewed. O’Neil [18] describes how USA judicial system developed a model to assign jail sentences based on statistical recidivism. This system had discrimination bias due to racial and poverty discrimination presented in training data. Author points out the need of an explanation of the decisions of the algorithm as its result is related to deprivation of freedom;
- Mismatched objects. The algorithm could be focused on a part of the main research objective. As Doshi-Velez et al. [17] give as an example a car engineer interested in how to improve a whole car, but the algorithm only predicts engine failures;
- Multi-objective trade-offs. A machine learning system may aim to optimize two objectives which could be, in some sense, opposites: if the system tries to improve one of them, this will impair the other target. Doshi-Velez et al. [17] say that the dynamics of the trade-off between those two targets, even if they are well defined, may not be completely known, and the decision may have to be made for each case. An example of this situation is the trade-off between privacy and prediction quality, as presented by Hardt et al. [43].
To formulate the explanations for the previous cases, a set of properties is presented by Robnik-Šikonja et al. [44], Lughofer et al. [45], and Ribeiro et al. [46]. All these authors mostly agree in the conclusions of their analysis, so we will focus on the properties described by Molnar [16], which are a great general summary of the properties an explainable machine learning algorithm should have: expressive power, translucency, portability, algorithmic complexity, and those related to explanation quality: accuracy, fidelity, consistency, stability, comprehensibility, certainty, degree of importance, novelty, and representativeness. Since one of the objectives of explanations is to provide transparency to machine learning algorithms, the way they are directed to humans should be taken into account. Miller [19] summarizes a set of good practices which lead to good explanations for humans. Explanations should:
- Be contrastive. How would a prediction change if its input was different? We have to explain why a prediction was made instead of other by contrasting them focusing of differences;
- Be selected. One or two causes should be selected;
- Be social. They should be adapted to the target audience;
- Be focused on abnormal. Between the causes selected, we should include those which have low probabilities of happening, but they happened. Such as a rare input feature;
- Be truthful. They should be proven as true in other situations;
- Be consistent with prior beliefs of the person who receives the explanation. Although this is difficult to integrate with machine learning contexts;
- Be general and probable. This could differ from the previous practice about focusing on abnormal, but according to Molnar [16], abnormal causes have preference over general causes.
Explanations over machine learning predictions are used to give humans confidence about the model [16], but they also help filter causal beliefs and have a role on inference and learning [47]. Due to this, we believe that it is critical to keep in mind the previously explained notions for the creation of a tool which aims to teach users on the basis of the results generated by a machine learning system.
Explainable AI (XAI) Systems
Došilović et al. [20] distinguish between two approaches to explainable machine learning: integrated and post-hoc. Integrated explanations are based on transparency, which consists of the explanation of the algorithm to be understandable by humans [48,49]. However, there are very complex models which can be difficult to explain. For these cases where the model is considered a black-box due to its complexity, there is post-hoc interpretability. Post-hoc tries to explain the results as a human would justify a decision. We can find plenty of recent work exploring this last approach: Kenny et al. [50] describe a post-hoc explanation-by-example where a deep learning system is explained by reference to a more transparent proxy model—specifically, a case-based reasoner—based on a feature weighting analysis of the former that is used to find explanatory cases from the latter. Similarly, Nascita et al. [51] investigate trustworthiness and interpretability employing XAI-based techniques to understand, interpret, and improve the behaviour of multimodal deep learning architectures for mobile traffic classification.
At the same time, techniques for explaining machine learning algorithms are divided in interpretability and explainability methods. Although these two terms are commonly used as synonyms, interpretability focuses on describing why a machine learning system produces a concrete result, being able to predict how modifying the input would affect the output; while explainability is centred on explicating in human terms how data is processed in the insides of that system. About interpretability methods, Martens et al. [52] explore Support Vector Machine (SVM) model comprehensibility by the extraction of rules with pedagogical techniques. This relates inputs and outputs of a SVM model. Dong et al. [53] introduces training with an adversarial dataset to improve the interpretability of Deep Neural Networks. Explainability methods offer a report of feature importance that leads to a certain decision. Model-agnostic approximations can only capture the influence level of inputs on outputs [54], without trying to explain the algorithm or machine learning system itself.
DeepLIFT [21] and layer-wise relev ance propagation [55] explain the model for a certain input by representing the effect of the opposite values for the original inputs. Shapley regression values [56] retrain the model based on the presence or not of several features to assign an importance value to each one. Shapley sampling values [57] take use of samples from training dataset to avoid retraining the model. SHAP (SHapley Additive exPlanations) [49] is a framework which uses different additive feature importance methods to avoid humans having to decide which method is preferable for helping them to interpret the predictions. Authors found more consistency with human intuition than with other methods. This was measured by asking users for the level of agreement with the provided explanation. Huysmans et al. [58] studied the comprehensibility of several model representations such as decision tables, decision trees, propositional rules, and oblique rules. Results showed that decision tables are the best in terms of accuracy, response time, answer confidence, and user preference.
Molnar [16] said that explanations should be contrastive, following this research line, there are approaches which use contrastive and counterfactual explanations [59].
Much literature has been written on the subject of explaining machine learning models which are not interpretable by themselves, focusing on a notable variety of aspects. Holzinger et al. [60] write about the evolution of Explainable Artificial Intelligence and the necessity of understanding and comprehending these models, and Samek et al. [61] describe why we need XAI and present different methods for the problem of explaining deep learning models, also dividing them into two main approaches: one which lays in determining how the prediction varies when different changes are made on the input and a second approach which is based on dividing the decision process in terms of the input variables, making it understandable by humans. Writings discussing the needs of applying Explainable Machine Learning for real-world problems are also common: Tonekaboni et al. [62] study how achieving machine learning models which are able to justify their outputs is crucial for establishing clinicians’ trust, making it possible to apply those models successfully to clinical practice.
2.3. Game Learning Phases
In the literature, we can find many authors dividing the learning process in distinct phases or stages, leading in many cases to not too different approaches. Dreyfus et al. [22] establish five stages of adult skill acquisition: novice, advanced beginner, competence, proficiency, and expertise. They focus on how, as the skill level of the individual increases, they gain the ability of applying general knowledge to specific contexts, they get more involved in the task, and the decision process they make becomes more intuitive.
Shuell [23] divides meaningful learning into only three different phases: initial, intermediate, and terminal. He states that, at first, individuals face large amounts of information presented as multiple, almost isolated pieces of information and what they learn is strongly linked to a concrete context. In the intermediate phase, the individual starts to find similarities and relationships between those pieces of information and starts constructing a stronger knowledge of the domain. When an individual reaches the terminal phase, they can perform some tasks in a more or less automatic way and are able to apply abstract concepts to many different concrete situations.
When learning to play a game, a person goes through several phases according to their level. Chess is one of the games with more studies behind, e.g., Chase et al. [63] studied how the perception of chess board configurations is related to the level of chess skill the player has. We have chosen one of its learning methodologies to be applied to our research, the Stappen Methode or Steps Method [24]. This methodology provides a staggered way to learn to play chess and it is the official teaching method of the Royal Dutch Chess Federation (https://www.schaakbond.nl/scholen/lesmethodes-en-materiaal/lesmethodes accessed on 13 April 2021). This process is applied by chess associations and schools in Netherlands, Belgium, France, Germany, Switzerland, and Austria (https://www.stappenmethode.nl/ accessed on 13 April 2021). The Steps Method differentiates the phases in Table 2 in early steps of the learning process. Then, the concepts become more specific around chess rules.
Table 2.
Learning phases from the Steps Method.
The Steps Method is a fairly proven technique in the field of teaching how to play chess. Therefore, we are going to adapt this method for our particular case, following the guides that it fixes for generating our text recommendations and using its different phases for analyzing how humans learn to play and the way their strategies evolve while using the tool we are presenting in this article.
3. Dots and Boxes
To do this research, we make use of a case study with a perfect information game. In perfect information games every player has access to all information about the game, as the position of the board or any configuration depending on the game. Chess and tic tac toe are perfect information games. Victory is only influenced by the strategy followed by players. Additionally, there are no random variables which may affect the result [64].
We have chosen Dots and Boxes, which is a combinatorial strategy game for two players popularized between children and adults. In L’Aritmétique amusante the first reference we can find about it appears, which comes from the 19th century. It was written by the mathematician Willian Lucas, who called the game “la pipopipette” [65]. The objective is to have more closed boxes than the rival when reaching the end of the game.
The board of the game is made up by a matrix of dots. For each move, the player must draw a vertical or horizontal line between two consecutive dots. The strategy consists of trying to close as many boxes as possible and avoid closure by the rival player. To close a box, it must already have three sides, with only one empty side left where the player will place the corresponding line. The turns are alternate, but after closing a box, the player plays again until no more boxes are closed. When closing a box, a different mark for each player is written inside. At the end, the score is computed by counting the marks, the winner being the player with maximum number of closed boxes.
Figure 1 shows the steps of a game played on a board. Notice that is the movement the image represents, and P1 and P2 specifies which player performed that movement, marking boxes closed by P1 with an A and the ones closed by P2 with a B. We can observe that the main strategy followed is to avoid putting the third side of a box because it could be closed in the next turn by the rival. Additionally, when there is no other alternative, the player has to minimize the number of closed boxes that the opponent could concatenate in their turn.
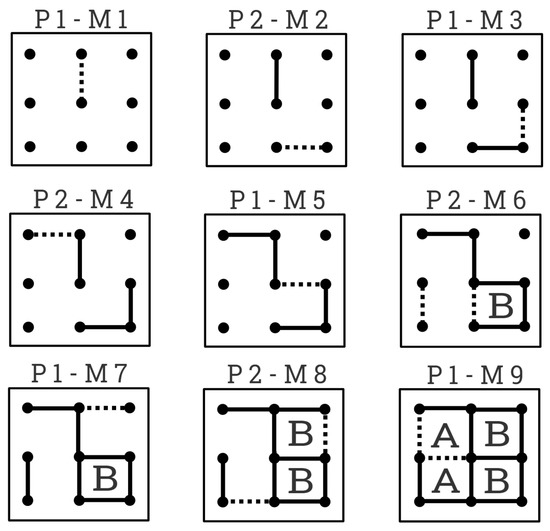
Figure 1.
Dots and Boxes game between two players.
4. Proposal
The objective of this research is to make the tree generated by MCTS easily interpretable by people without knowledge in this field. This is reached in an agnostic way to the process or the game. To use as an example on this research we are modeling the Dots and Boxes game.
The algorithm we employ for producing those trees is the one that you can find described in more detail in our previous work [11]. It is an MCTS implementation which includes a double counter and uses an ANN in its simulation phase to obtain—in the case of the Dots and Boxes game—a probability of victory, draw, or defeat for each node. This ANN is composed of three different layers with 85, 100, and 3 neurons, respectively. To train the aforementioned ANN, we generated the datasets by making the algorithm play against itself. Our algorithm is generic, it does not use any heuristic based on the domain of the problem, as opposed to other solutions, such as the one implemented by Zhuang et al. [66], which makes use of a heuristic to reorder the candidate nodes to be selected in the MCTS selection phase.
In our previous study [11] we were testing our MCTS system, which is optimized using ANN against the system proposed by Zhuang et al. [66] and, in this case, we want the user to play against our own system. MCTS will recommend a move to the user and this tool will explain the reasons of why it has chosen it instead of another. This is also aimed to satisfy user concerns about the correctness of one of the possible best moves [16], to show him facts supporting the choice in order to understand the decision and be able to potentially repeat it in the future. That is, to teach him how to play.
We are proposing the tool presented in this article precisely to address the issue of instructing the user on how to play, a part of the job that was not covered in our previous work, nor in any other article, to our best knowledge.
For this work, we do not use common integrated nor post-hoc XAI techniques, rather try to present the MCTS algorithm’s output in a way that is easily interpretable and potentially instructive for a regular user. To achieve this, the tool showcases all the relevant information, allows the users to explore all their different options and search for paths with some specific characteristics, and provides a series of recommendations explained by means of text.
As Kejriwal et al. [67] say, graphs are oriented to represent knowledge in a way machines and algorithms can process it. So, we are considering this tree as a knowledge graph which the user can navigate through. The graph represents the following information for each node:
- Image: image representation of the state. This is generated according to the domain of the game;
- Player: player who has performed the move;
- Score: score of each player at that point of the game;
- Percentage: percentage of victory of Player 1 (P1) and Player 2 (P2). Percentage is calculated with the next formula, where victories is the number of simulated victories from that node for either P1 or P2 and visits is the times it has been visited;
- Visits: number of MCTS visits the node has received.
The user can navigate through the tree to understand the reasons why the system has chosen a certain node based on the information it shows. That is done clicking on the nodes to expand and hide their children.
Figure 2 shows the tool tip that is displayed when the user positions the cursor over a specific node. This tool tip contains all the information listed above about that node, except which player has performed the movement, which is represented by the color of the node border. To understand the tree information, the user should know about the meaning of all these attributes in terms of the game domain.
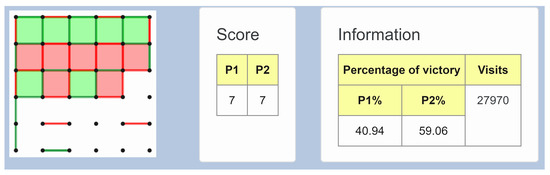
Figure 2.
Tool tip displaying relevant information about a node.
- Image: a drawing of the board at that time. Spatial visualization of moves. It can be observed at the left of the image, representing moves performed by P1 and P2 in green and red, respectively;
- Player: who has done that move. To ease contextualization of the game;
- Score: scoreboard to search for the nodes of paths with best or worst score. In this case, as you can see in the center of the figure, players are tied with a score of seven boxes;
- Percentage: percentage of victory for a determined player from that node, it must be compared to its sibling nodes. It can be seen that, in the concrete node we are analyzing, the system has obtained that P2 has a slightly greater possibility of victory, with a 59.06% as opposed to the 40.94% that P1 has;
- Visits: number of node visits, 27,970 out of 70,000 for this concrete node. According to MCTS, the more visits a node has the better the move is. So, if user is P2, for P2 moves, they should pick the most visited. For P1 moves, they should take into account that the move with more visits is the one that P1 will most likely choose. A non-experimented user could think of ignoring visits and only considering the immediate score each possible movement produces. This strategy would be an error, it is not uncommon to find a context where, closing a box—increasing your immediate score—leads the rival to a situation in which they can capture several boxes in a row, deciding the final result of the game.
Some node information is distinguished with colors and style showing:
- Which player has performed the movement displayed on the node;
- Which node is currently expanded;
- Which player has won when reaching a terminal state;
- Which node is recommended by the system;
- Whether a node has children to expand or not.
To ease the localization of the interesting nodes based on the previous points, we divided the explanations of the reasoning into two approaches: direct system-interpretation (non-expert mode) and interactive user-interpretation (expert mode).
4.1. Non-Expert Mode
In non-expert mode, the system provides an interpretation of the tree with the next information:
- Recommended node. The system advice on which node should be chosen (i.e., what movement the user should perform) and shows the path to a terminal node following the most visited children;
- Not recommended nodes. The system advice on which nodes should not be chosen because they could lead to defeat. If there are more than eight nodes to choose, the application shows the worst four in order not to overwhelm the user by displaying too much information. If there are less than eight, the tool shows half. The system also shows the paths to a terminal state following the children with greater victory percentage for rival player.
In Figure 3 you can observe the chart showing which movement is recommended and the list of not advisable nodes, along with a brief textual explanation for each of them. If you click the “See why” button, the tool will display a sequence of movements—or a set of sequences—which reinforces the explanation for the user. Note that these recommendations are directed to P2, whose movements are represented in red.
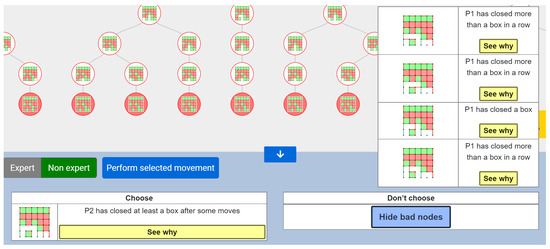
Figure 3.
Recommended and not advisable nodes for P2 displayed in the Non-Expert mode.
For each indicated node, the system shows a brief sentence explaining why it is recommended or not. The reasoning consists of an adaptation of the Steps Method [24], mentioned in Section 2.3. From immediate moves (Capture) to the understanding of move sequences (Temporal). We specified five phases according to the characteristics of these learning stages and defined the text taking into account the paths from that node to the end of the tree branch. For every specific situation, the system determines the text that could explain better why the user should chose (or avoid) a concrete node, selecting it by analyzing how the MCTS has simulated the evolution of the game from that node and comparing scores until the end.
- Phase 1. To close a box in just one move.To explain why a move is good based on the number of closed boxes by the user.
- Phase 2. Do not let the rival close a box in just one move.To explain why a move is bad based on the number of closed boxes by the rival.
- Phase 3. To maximize the number of closed boxes by the user in a row.To explain why a move is good based on the number of closed boxes at the end of the turn (several moves by the same player).
- Phase 4. To minimize the number of closed boxes by the rival in a row.To explain why a move is bad based on the number of closed boxes at the end of the turn (several moves by the same player).
- Phase 5. To take several moves to reach one of the previous objectives.To explain why a move is good based on the number of closed boxes when reaching a terminal node.
In the case no player closes any box along the path, the reference the system takes is the ratio of victory percentage multiplied by the number of visits. Phases 1 and 2 include moves with immediate rewards or penalties. These are the easiest to identify and correspond to Capture phase of the Steps Method. Phases 3 and 4 are between Capture and Temporal phase because their objective is to close as many boxes as possible but by using several moves, requiring to explore different moves and the influence they have on the board situation the rival or themselves will find after those moves. However, it is easier to identify than the next phase, because the boxes are closed in a row. Finally, phase 5 corresponds to Temporal, the reward is not immediate and requires a sequence of moves, as a box can be sacrificed to somehow trap or obligate the rival to later let you close a bigger number of squares. A strategy where the player performs several moves without pay-off leading to a closed box, is part of this fifth phase too. These two strategies are clearly related to the Temporal phase in the Steps Method, as they require understanding of the need to perform various movements to achieve a final objective.
4.2. Expert Mode
At this mode, the user can interpret the results of MCTS by querying the tree. The interface is showing the information mentioned previously for each node and provides some tools to ease the finding of meaningful nodes. These tools consist of two sets of queries. The first group of them is defined involving the terminal status of the game—P1 victory, P2 victory, or draw. Others are related to the maximum number of shown nodes and the maximum depth the user wants to observe when displaying the children of a node.
For each status, the user can ask for:
- All paths which lead to that status;
- The fastest path to that status. The one which passes through the minimal number of nodes in case the number of moves per game is not always the same. Note that this cannot happen in our concrete case study—the Dots and Boxes game—but, since the tool we are proposing is aimed to be generalizable, we wanted to give this possibility;
- The most visited path to that status. It includes the most visited nodes of each depth level. This can be interpreted as “the path which is most likely to happen”;
- The path with best percentage to that status. It includes the nodes with the best percentage of victory for that player of each depth level.
Additionally, the paths with best victory percentage for P1 and P2 are shown. This can be consulted when the game is at an early stage and no terminal nodes are reached yet. In Figure 4 the buttons for the different queries and configuration options in this mode can be observed.
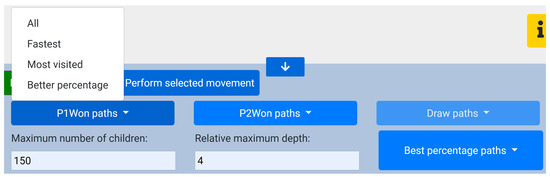
Figure 4.
Button panel available at the Expert mode.
The required paths will be shown on the tree interface. The user can also navigate through the tree freely and configure the parameters related to the maximum number of children nodes shown after opening a node and the relative maximum depth level they want to reach for each click.
5. Evaluation
Our aim with this section is to describe in detail the process of evaluation and then, present the obtained results. In the first part we will expound the methodology we used to test this tool, and, after that, we will show and discuss our results.
5.1. Methodology
To evaluate whether the system we are presenting is helpful or not in the learning process of the Dots and Boxes game and in which level it helps, we performed a series of user tests. In this subsection, we describe the methodology used in the process and detail the common profile all individuals who participated in the tests share.
The methodology we used is based on the ones applied by Gonzalez García et al. [34,36,68] and Meana-Llorián et al. [69]. We divide the process in several phases, which we will explain in detail shortly, obtaining for each phase a series of measurements to later compare them, followed by an assessment of the users’ sentiments about the tool. Every user played 12 games (the whole process taking about two hours per participant) against our system through a web application we deployed in an internal network at the University of Oviedo. Those games were equally distributed into three differentiated phases:
- Phase 1. To evaluate the initial level of the users participating in this experiment, they played four games exclusively from the interactive board that the presented tool offers (which can be seen in Figure 5a) without having access to our system’s recommendations nor the rest of information the tool grants (in Section 4, we defined in detail the information the tool offers for every node and the set of existing queries). Before playing these starting games, we detailed the users the rules of Dots and Boxes verbally, while we played a demo game for every one of them to see;
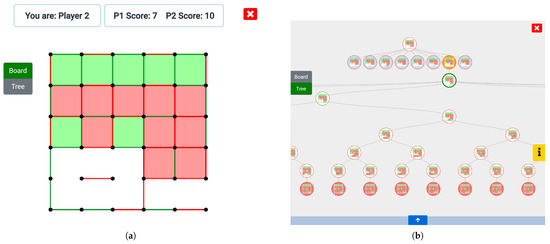 Figure 5. The tool implements two different playing modes: (a) an interactive board and (b) an interactive tree.
 - Phase 2. Immediately after, we explained them how to use the different options of the tool we are presenting offers and how to inspect its recommendations, which we presented and explained in Section 4. After this clarification, each individual played four more games, permitting them to access every feature the tool implements—this is achieved by allowing them to swap between the interactive board and the tree that can be observed in Figure 5b at any time. The idea under this phase is letting users learn and increase their understanding of how to play the game, studying the recommendations, and the information produced by our system;
- Phase 3. In this phase, we evaluated the users’ final playing level after learning from our system, so we can compare it with the initial one. This is achieved by letting them play their four last games, again with no access to the system recommendations nor the rest of information the tool offers—that is, playing exclusively from the board seen in Figure 5a—so we can assess what they learned. Finally, we asked them their opinion about the tool and what they think helped them the most in their learning process.
For each played game we considered three different measurements: whether the user won or not, the scores at the end of the game, and the mean time taken by the user for each decision.
Twelve participants (p1–p12), to whom we are enormously grateful, took part in the experiment:
- All of them were between 20 and 24 years old;
- All of them were studying some university degree or had recently finished it, those degrees belonging to several distinct fields: engineering and computer science, graphic design, education, law, and physiotherapy.
- Two thirds of the participants knew and had played the game previously.
It is clear that all participants share similar characteristics—having an age within a reduced range and a not too different educational level. This is not by chance, as we wanted to achieve that in order to avoid biased results caused by notable differences in a small population.
We monitored all sessions of user testing to make sure they did not share any heuristic or win strategy before the activity ended, so we could guarantee that the learning process of each user evolved individually.
5.2. Results
After the evaluation process finished for each user, the results of their test were collected. In the following section, we present and analyze these results.
Table 3 shows the average time each player took to perform a movement in every single game (G1–G12). This time is measured and exported by the tool, in a millisecond scale, rounded to the unit. The timer starts when the user receives the enemy movement (or after the participant closes a box, when playing without recommendations, or after receiving the recommendations, if those are enabled) and stops just after the user performs the movement. In Figure 6 we can see the average time every player took per movement sorted by phase. It can be observed that, for almost every user, the higher times were obtained along phase 2—including games from 5 to 8—reaching an average of 23.3 seconds per decision. This finding fits what we expected, since participants played with recommendations in phase 2. This takes some extra time to analyze, study, and learn how the tool justifies the recommendations, and observe how the game could evolve from that point. From phase 1 (G1–G4) to phase 3 (G9–G12)—those without recommendations—the average resulting time per movement decreased by 29.29%, being, respectively, 15.0 and 10.6 seconds.
Table 3.
Average time per movement, in milliseconds, for every player in each game.
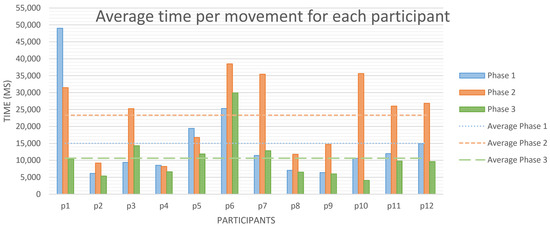
Figure 6.
Average time per movement, in milliseconds, for every player in each phase.
This reduction in time taken per movement comes along with a significant improvement in squares conquered and victories (said data is represented in Figure 7 and Figure 8, which are analyzed below) so it cannot be explained just assuming participants are less involved in the game. In fact, these results fit quite well with what we reviewed in Section 2.3 about the learning process: Dreyfus et al. [22] stated that, as an individual acquires more skill in a matter, their decision process becomes more intuitive, and Shuell [23] who, for his part, said that, when someone reaches the terminal phase of the learning process, some tasks become nearly automatic for them, since they can apply their abstract knowledge to a wide range of different concrete contexts.
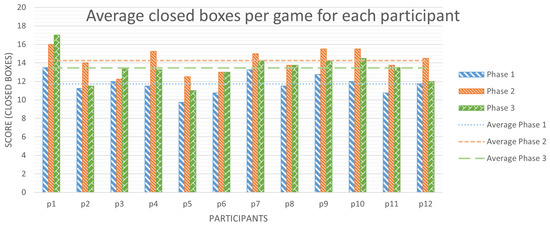
Figure 7.
Average boxes scored per game for every player in each phase.
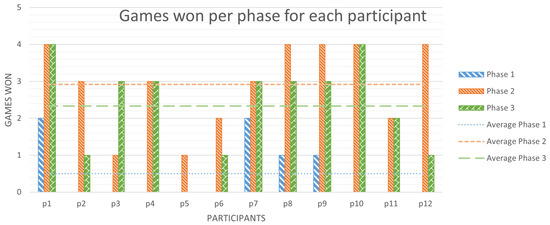
Figure 8.
Average games won per phase for each player.
Figure 7 shows the average number of boxes each participant has conquered per game in each phase—out of a maximum of 25 in a board. Besides studying the variation of average boxes closed between phases, because all values will be centered around 12.5—half of the available total boxes—we will also count the number of participants that exceeded 12.5 boxes scored per game on average. This is to discover how many of them conquered in each phase more boxes than their rival and to analyze how this evolves.
- In phase 1, without recommendations, participants closed an average of 11.73 boxes per game. Only 25% of the participants—3 out of 12—closed more than 12.5 boxes on average per game;
- In phase 2, with tool recommendations available, the average of scored boxes per game was 14.25. Here, 10 participants—83.33% of them—achieved an average greater than 12.5;
- In phase 3, again without recommendations, but after, presumably learning strategies from the tool, participants conquered an average of 13.46 boxes per game, 1.73 more than in phase 1, which represents an increment of a 14.75%. In this phase, 75% of users reached an average of closed boxes per game greater than 12.5.
In Figure 8 we can observe the number of games each player won per phase—out of a maximum of four. Let us study how this evolved between the different phases:
- In phase 1, without recommendations, users won 0.5 games on average. Specifically, 16.67% of the participants won 2 games each, 16.67% of them obtained just 1 victory, and the remaining 66.66% did not win any match;
- In phase 2, with tool recommendations and the rest of the implemented features available, the average games won per participant were 2.92: 41.67% of them won 4 out of 4 games, 25% of the participants obtained 3 victories each, just 16.67% of them won 2 games, and the remaining 16.66% only managed to win 1 single game in this phase;
- In phase 3, after learning from the recommendations provided by the tool, each player won, on average, 2.33 games, improving this mark by a 366.67% with respect to phase 1. In this phase, only 16.67% of the participants obtained 4 victories each, 41.67% of them won 3 games, just 8.33% of the players won 2 games, 25% of them succeeded in only 1 match, and the remaining 8.33% lost all of their games.
Table 4 shows, for each game, how many participants have won and the number of victories the rival system has obtained, along with their scores. From it we can draw that those results obtained in a game do not strongly differ from those extracted in games belonging to the same phase. It is clear that the most relevant differences can be observed when comparing two different phases—before or after learning from the tool, or when using the recommendations and possibilities the tool offers. This shows that our participants have not improved their skill level gradually throughout the 12 different games but have significantly improved after learning from the recommendations and information the presented tool grants. We can also see that, although there is a general improvement of the obtained results from phase 3 with respect to phase 1, it seems that the level gap between different participants has grown, since the standard deviation of scored boxes is generally higher in games belonging to phase 3, growing from an average of 1.98 in games belonging to phase 1, to an average of 2.55 in phase 3.
Table 4.
Victories and average boxes closed in each game by the participants and the rival system.
Table 5 allows us to observe some important differences between those participants who knew the game beforehand and those who did not until they took part in our test. Although we know there are not enough test subjects in both groups to draw definitive conclusions, some relevant tendencies can be identified:
Table 5.
Average games won by participant in each phase, dividing them into two differentiated groups depending on whether they knew or not the game.
- Those who did not know the game won, on average, less matches in the three phases;
- Participants who did know the game beforehand obtained an average improvement of 280% in phase 3 with respect to phase 1—from 0.625 games won on average to 2.375—while those which did not know Dots and Boxes reached an 800% improvement in their results—from an average of 0.25 victories obtained in phase 1 to 2.25 in phase 3.
- It seems that, with the help of the presented tool, the level of knowledge of participants tends to equalize remarkably quickly since, from phases 1 to 3, the difference in average victories per player between the two groups is noticeably reduced, both in absolute and relative terms. Specifically, players who knew the game in advance won, on average, 0.375 games more—a difference of 150%— in phase 1 than those who did not, whilst, in phase 3, they won 0.125 games more on average—a difference of 5.56%.
Therefore, it can be appreciated that subjects who did not know the game before our experiment have scored, on average, less victories. However, comparing the results they obtained from phase 3—after learning from the presented tool—with those from phase 1—before using the tool—their general improvement is noticeably greater than the one achieved by participants who knew the game previously—as we have just seen, 800% more victories versus a 280% increment.
Not only we have collected these measurements, but we have also asked the participants whether they found the tool and its recommendations helpful or not, how their learning experience evolved, and what aspects of our system they think we should improve. Next, we will sketch the most common and relevant answers:
- A total of 91.67% of the participants declared having followed almost every recommendation from the tool—in phase 2, when those were available—because they found them helpful. We can assert that users tend to trust the tool, which is able to convince them that the recommended move is most likely the best one available;
- The whole group found the information that the presented tool offers useful for analyzing the state of the game and the different possibilities they had in each moment. The aforementioned information is the following: board status for each node, percentage of victory of every movement, querying different paths to final states, the possibility of inspecting every available movement and its successors from the current board state, and the rest of information and possibilities we specified in Section 4;
- The majority of the participants stated that they felt that the most important moment in the learning process was when they noticed that giving a box to their opponent could, in some contexts, produce very advantageous situations in which they would conquer more squares—and even tip the game in their favor. This strategy is clearly related with the fifth phase of the adaptation of the Steps Method we defined in Section 4.1 for the Dots and Boxes game, which focuses on long-term plays, requiring several moves to reach a final objective. A situation for which this applies can be observed in Figure 5a: we will focus on P2—whose moves and closed boxes are represented in red—who has just conquered a square and must perform a movement once again. In the initial phase of our user tests, we have observed that novice players, considering only the short-term consequences of their moves, are very likely to close the two boxes on the right, forcing themselves to place a line on the left-side area and losing the game. A more experienced player, thinking in the long term, would, presumably, place the line far to the right, giving away two boxes but forcing their rival to move on the left-side area, which would allow the player to conquer six squares, winning the game.
- Some of them complained about not having noticed some rival movement. This could be easily solved by implementing an in-game history of movements (at the present time, it is only available after finishing a game) and adding some animation to the opponent’s move rather than just “popping” it.
6. Discussion
In this section, we focus on limitations, possible improvements, and future work—not only on the presented tool, but also on the algorithm lying in the back end and the evaluation and validation process.
Regarding the tool itself, some participants communicated not having noticed some rival movement during the game. To solve this issue, we propose implementing a history of moves available at any time while playing. Additionally, we will also include an animation to rival movements, which should give the player enough time to realize what movement the adversary is performing. We also believe that implementing different levels of difficulty—which could be selected at the start of each game—would be a nice possible improvement, preventing novice players from becoming frustrated when facing a rival too strong for them. This could be easily achieved by modifying the number of iterations—the lower, the less difficulty and waiting time—that the MCTS algorithm performs for deciding each movement for the rival.
Moreover, experienced players often beat the algorithm without help, which limits what they can potentially learn from the tool. We see two main possible improvements that could enhance the algorithm playing capabilities: learning from users and making it comprehend symmetry. A possible course of action to achieve the former could be to register games against users, completing the training dataset with them, and maybe trying to give more weight to those which result in victory for the player. The latter could be reached by developing a way of representing the board that is inherently symmetrical—i.e., two board states with the same characteristics and possibilities for example, the same board configuration but rotated, would be represented by the exact same value.
With respect to user testing, we would like to expand our evaluation process applying it to more groups with broader characteristics: both older and younger participants, different educational levels, etc. If we had no time restrictions with each participant, it would also be interesting to lengthen the evaluation process—adding more phases—in order to study how the learning curve of the users continues evolving. Besides, having more volunteers would allow us to construct a control group—which would play the whole 12 games without tool recommendations nor any external aid—permitting us to extract more robust conclusions. This way, we could establish differences on how individuals’ learning process progresses with and without the help of our tool.
7. Conclusions
In this paper, we have introduced a tool which, using MCTS and neural networks, produces real time recommendations for playing Dots and Boxes. Along with these recommendations, the tool offers a textual explanation which tries to convince and teach users, and a bunch of extra information which includes probability of victory and MCTS visits for each possible move, board status, possibility of querying feasible paths leading to concrete final status, or the opportunity of exploring how the game could evolve from a possible movement. Furthermore, the presented tool also permits playing in real time against the MCTS system for user training.
In order to validate the usefulness of the tool, we have established an evaluation process divided into three differentiated phases, each of them containing four games. Phases 1 and 3, where participants played entirely from the interactive board (which can be seen in Figure 5a) and without access to the tool’s recommendations, serve for measuring and comparing the initial and final playing level of participants. In phase 2, intended for participants to learn from the tool, they played interchangeably from the board or the tree (observable in Figure 5b) and having access to recommendations and the rest of information available in the tool. In Section 5.1, you can find further details about the evaluation process we have used.
For each played game, we registered three measurements for comparing the results obtained in the different phases—time per movement, conquered boxes per game and games won per phase. Thus, we have assessed the degree of improvement of the participants and whether the tool resulted in being helpful or not. In addition to those measurements, we have also interviewed the participants about their feelings on the tool so we can discern how it influenced their learning process and what aspects should be improved. For these interviews, we did not follow a complex fixed process, we merely asked participants about their sentiments on the tool and about how their knowledge evolved during the test. We will sum up their different responses at the end of this section.
Analyzing the results we have measured, we can observe some remarkable aspects about phase 2:
- This is where we registered the longer times taken per movement, with an average of 23.3 seconds per decision;
- In this phase, participants also obtained the best results—for both closed boxes and games won—scoring an average of 14.25 out of 25 squares per game and participant and presenting a mean of 2.92 out of 4 victories per volunteer.
These results match what we expected a priori, since in this phase, participants are allowed to access all the features the tool implements, which takes some time, but also gives a great advantage.
Now, we will compare phases 1 and 3, which are aimed to obtain the playing level of participants at the start and at the end of the experiment, in order to determine whether the tool helped in their learning process or not. Regarding decision times, the resulting average decreased by 29.29% between these two phases, from 15.0 to 10.6 seconds. In addition to this reduction in time taken per movement, we have also registered a significant improvement in squares closed per game and games won:
- In phase 3, participants closed an average of 13.46 boxes per game, which represents an increment of 14.75% over the average of 11.73 boxes per game in phase 1. In phase 1, only 3 participants reached an average greater than 12.5—half of the available boxes in a board—while, in phase 3, this number was raised to 9 participants.
- In phases 1 and 3, every participant won, respectively, 0.5 and 2.33 games on average, reaching an improvement of 366.67%.
These results fit quite well with what we have seen in the literature about the learning process: when an individual reaches advanced stages of their learning process in a concrete matter, they are able to perform some tasks faster and with better results, some decision processes become more intuitive and even automatic, and they acquire the ability of applying general knowledge to different concrete situations.
Additionally, if we analyze the data in more detail, we find that the results obtained in games within the same phase do not considerably differ but, when we observe games belonging to distinct phases, the differences are more than evident, as we can see in Table 4. Thus, we can state that the participants’ improvement has not been gradual, but has occurred after phase 2 in which, presumably, our participants acquired knowledge from the tool we are presenting in this article.
Interviewing those who took part in the experiment, we found that, in phase 2, 91.67% of the participants—all of them but one—followed the majority of recommendations, which suggests that, in general, users trust what the tool determines. This confidence is most likely reinforced by the textual explanation of why it recommends or not recommends a given node, along with the rest of the data and querying possibilities the tool grants to the users, in which the whole group declared to have found it useful for analyzing the state of the game and their possibilities. Most participants also expressed that the peak moment in their learning process was when they realized that, in some concrete situations, granting a box (or two) to their rival could produce really advantageous situations for them later. This kind of advanced strategy matches pretty well with the fifth—and last—phase of our adaptation of the Steps Method for the Dots and Boxes game, which requires analyzing the long-term consequences and benefits of a move and performing several moves to reach an objective.
Author Contributions
Conceptualization, A.C., V.G.-C., V.G.-D., E.R.N.-V., C.G.G. and A.G.; methodology, A.C. and V.G.-C.; software, A.C. and V.G.-C.; validation, A.C., V.G.-C., V.G.-D., E.R.N.-V., C.G.G. and A.G.; formal analysis, A.C., V.G.-C., V.G.-D., E.R.N.-V., C.G.G. and A.G.; investigation, A.C., V.G.-C., V.G.-D., E.R.N.-V., C.G.G. and A.G.; resources, A.C., V.G.-C., V.G.-D., E.R.N.-V., C.G.G. and A.G.; data curation, A.C., V.G.-C., V.G.-D., E.R.N.-V., C.G.G. and A.G.; writing—original draft preparation, A.C., V.G.-C. and V.G.-D.; writing—review and editing, A.C., V.G.-C., V.G.-D., E.R.N.-V., C.G.G. and A.G.; visualization, A.C., V.G.-C., V.G.-D., E.R.N.-V., C.G.G. and A.G.; supervision, V.G.-D., E.R.N.-V., C.G.G. and A.G.; project administration, A.C., V.G.-C., V.G.-D., E.R.N.-V., C.G.G. and A.G.; funding acquisition, A.G. All authors have read and agreed to the published version of the manuscript.
Funding
This research was funded by Fundación Universidad de Oviedo grant number FUO-21-095.
Informed Consent Statement
Informed consent was obtained from all subjects involved in the study.
Acknowledgments
We would like to thank all the volunteer participants who cooperated in this study.
Conflicts of Interest
The authors declare no conflict of interest. The funders had no role in the design of the study; in the collection, analyses, or interpretation of data; in the writing of the manuscript, or in the decision to publish the results.
Abbreviations
The following abbreviations are used in this manuscript:
| AI | Artificial intelligence |
| MCTS | Monte Carlo Tree Search |
| DSL | Domain-specific language |
| GPL | General purpose language |
| SVM | Support vector machine |
| SHAP | SHapley Additive exPlanations |
| DSS | Decision support system |
| XAI | Explainable artificial intelligence |
| ANN | Artificial neural network |
References
- Finlay, P. Introducing Decision Support Systems; NCC Blackwell: Oxford, UK, 1994. [Google Scholar]
- Muralidhar, K.; Tretter, M.J. An interactive decision support system for designing appropriate and adaptive sampling procedures in electric utility load research. Soc.-Econ. Plan. Sci. 1989, 23, 387–397. [Google Scholar] [CrossRef]
- Basnet, C.; Foulds, L.; Igbaria, M. FleetManager: A microcomputer-based decision support system for vehicle routing. Decis. Support Syst. 1996, 16, 195–207. [Google Scholar] [CrossRef]
- Wierenga, B.; Bruggen, G.H.V. Developing a Customized Decision-Support System for Brand Managers. Interfaces 2001, 31, S128–S145. [Google Scholar] [CrossRef]
- Ling, C.; Harnish, D.; Shehab, R. Educational Apps: Using Mobile Applications to Enhance Student Learning of Statistical Concepts. Hum. Factors Ergon. Manuf. Serv. Ind. 2014, 24, 532–543. [Google Scholar] [CrossRef]
- Griffith, S.F.; Hagan, M.B.; Heymann, P.; Heflin, B.H.; Bagner, D.M. Apps As Learning Tools: A Systematic Review. Pediatrics 2020, 145, e20191579. [Google Scholar] [CrossRef]
- Eagle, M.; Barnes, T. Experimental Evaluation of an Educational Game for Improved Learning in Introductory Computing. SIGCSE Bull. 2009, 41, 321–325. [Google Scholar] [CrossRef]
- Cavus, N. Development of an Intellegent Mobile Application for Teaching English Pronunciation. Procedia Comput. Sci. 2016, 102, 365–369. [Google Scholar] [CrossRef][Green Version]
- Veneruso, S.V.; Ferro, L.S.; Marrella, A.; Mecella, M.; Catarci, T. CyberVR: An Interactive Learning Experience in Virtual Reality for Cybersecurity Related Issues. In Proceedings of the International Conference on Advanced Visual Interfaces, New York, NY, USA, 28 September–2 October 2020. [Google Scholar] [CrossRef]
- Aceto, G.; Ciuonzo, D.; Montieri, A.; Pescapè, A. DISTILLER: Encrypted Traffic Classification via Multimodal Multitask Deep Learning. J. Netw. Comput. Appl. 2021, 183–184, 102985. [Google Scholar] [CrossRef]
- Cotarelo, A.; García-Díaz, V.; Núñez-Valdez, E.R.; González García, C.; Gómez, A.; Lin, J.C.-W. Improving Monte Carlo Tree Search with Artificial Neural Networks without Heuristics. Appl. Sci. 2021, 11, 2056. [Google Scholar] [CrossRef]
- Bondy, J.A.; Murty, U.S.R. Graph Theory with Applications; Macmillan: London, UK, 1976; Volume 290. [Google Scholar]
- Ehrlinger, L.; Wöß, W. Towards a Definition of Knowledge Graphs. In Proceedings of the SEMANTiCS 2016 (Posters, Demos, SuCCESS), Leipzig, Germany, 13–14 September 2016. [Google Scholar]
- García-Díaz, V.; Núñez-Valdez, E.R.; García, C.G.; Gómez-Gómez, A.; Crespo, R.G. JGraphs: A Toolset to Work with Monte-Carlo Tree Search-Based Algorithms. Int. J. Uncertain. Fuzziness -Knowl.-Based Syst. 2020, 28, 1–22. [Google Scholar] [CrossRef]
- Allamanis, M.; Brockschmidt, M.; Khademi, M. Learning to Represent Programs with Graphs. arXiv 2018, arXiv:cs.LG/1711.00740. [Google Scholar]
- Molnar, C. Interpretable Machine Learning; 2019; Available online: https://christophm.github.io/interpretable-ml-book/ (accessed on 24 June 2021).
- Doshi-Velez, F.; Kim, B. Towards A Rigorous Science of Interpretable Machine Learning. arXiv 2017, arXiv:stat.ML/1702.08608. [Google Scholar]
- O’neil, C. Weapons of Math Destruction: How Big Data Increases Inequality and Threatens Democracy; Crown: New York, NY, USA, 2016. [Google Scholar]
- Miller, T. Explanation in Artificial Intelligence: Insights from the Social Sciences. Artif. Intell. 2019, 267, 1–38. [Google Scholar] [CrossRef]
- Došilović, F.K.; Brčić, M.; Hlupić, N. Explainable artificial intelligence: A survey. In Proceedings of the 2018 41st International Convention on Information and Communication Technology, Electronics and Microelectronics (MIPRO), Opatija, Croatia, 21–25 May 2018; pp. 210–215. [Google Scholar]
- Shrikumar, A.; Greenside, P.; Kundaje, A. Learning important features through propagating activation differences. In Proceedings of the International Conference on Machine Learning, Sydney, NSW, Australia, 6–11 August 2017; pp. 3145–3153. [Google Scholar]
- Dreyfus, S.E. The Five-Stage Model of Adult Skill Acquisition. Bull. Sci. Technol. Soc. 2004, 24, 177–181. [Google Scholar] [CrossRef]
- Shuell, T.J. Phases of Meaningful Learning. Rev. Educ. Res. 1990, 60, 531–547. [Google Scholar] [CrossRef]
- Brunia, R.; Van Wijgerden, C. Learning Chess, Step 1, Step 2, Step 3, Step 4, Step 5, Step 6. 2011. Available online: https://www.stappenmethode.nl/en/download.php (accessed on 13 April 2021).
- Ji, S.; Pan, S.; Cambria, E.; Marttinen, P.; Yu, P.S. A survey on knowledge graphs: Representation, acquisition and applications. arXiv 2020, arXiv:2002.00388. [Google Scholar]
- Hogan, A.; Blomqvist, E.; Cochez, M.; d’Amato, C.; de Melo, G.; Gutierrez, C.; Gayo, J.E.L.; Kirrane, S.; Neumaier, S.; Polleres, A.; et al. Knowledge Graphs. arXiv 2021, arXiv:cs.AI/2003.02320. [Google Scholar]
- Koncel-Kedziorski, R.; Bekal, D.; Luan, Y.; Lapata, M.; Hajishirzi, H. Text Generation from Knowledge Graphs with Graph Transformers. arXiv 2021, arXiv:1904.02342v2. [Google Scholar]
- Schmitt, M.; Ribeiro, L.F.R.; Dufter, P.; Gurevych, I.; Schütze, H. Modeling Graph Structure via Relative Position for Text Generation from Knowledge Graphs. arXiv 2021, arXiv:cs.CL/2006.09242. [Google Scholar]
- Guzmán-Guzmán, X.; Núñez-Valdez, E.R.; Vásquez-Reynoso, R.; Asencio, A.; García-Díaz, V. SWQL: A new domain-specific language for mining the social Web. Sci. Comput. Program. 2021, 207, 102642. [Google Scholar] [CrossRef]
- Mernik, M.; Heering, J.; Sloane, A. When and How to Develop Domain-Specific Languages. ACM Comput. Surv. 2005, 37, 316–344. [Google Scholar] [CrossRef]
- Deursen, A.; Klint, P.; Visser, J. Domain-Specific Languages: An Annotated Bibliography. ACM Sigplan Not. 2000, 35, 26–36. [Google Scholar] [CrossRef]
- Deursen, A.; Klint, P. Little languages: Little maintenance? J. Softw. Maint. Res. Pract. 1998, 10, 75–92. [Google Scholar] [CrossRef]
- Cook, S.; Jones, G.; Kent, S.; Wills, A. Domain-Specific Development with Visual Studio DSL Tools; Addison-Wesley Professional, 2007; Available online: https://www.semanticscholar.org/paper/Domain-Specific-Development-with-Visual-Studio-DSL-Cook-Jones/f5624a055680d501918f28b08fe93a038ac2f4ff (accessed on 21 June 2021).
- González García, C.; Pelayo G-Bustelo, B.C.; Pascual Espada, J.; Cueva-Fernandez, G. Midgar: Generation of heterogeneous objects interconnecting applications. A Domain Specific Language proposal for Internet of Things scenarios. Comput. Netw. 2014, 64, 143–158. [Google Scholar] [CrossRef]
- Watson, A. A brief history of MDA. Upgrade Eur. J. Inform. Prof. 2008, 9, 7–11. [Google Scholar]
- González García, C.; Núñez-Valdez, E.R.; Moreno-Ger, P.; González Crespo, R.; Pelayo G-Bustelo, B.C.; Cueva Lovelle, J.M. Agile development of multiplatform educational video games using a Domain-Specific Language. Univers. Access Inf. Soc. 2019, 18, 599–614. [Google Scholar] [CrossRef]
- Gansner, E.R.; Koutsofios, E.; North, S. Drawing Graphs with dot. 2015. Available online: https://www.graphviz.org/pdf/dotguide.pdf (accessed on 23 June 2021).
- Francis, N.; Green, A.; Guagliardo, P.; Libkin, L.; Lindaaker, T.; Marsault, V.; Plantikow, S.; Rydberg, M.; Selmer, P.; Taylor, A. Cypher: An Evolving Query Language for Property Graphs. In Proceedings of the 2018 International Conference on Management of Data, New York, NY, USA, 10–16 June 2018; pp. 1433–1445. [Google Scholar] [CrossRef]
- Phillips, C.; Swiler, L.P. A Graph-Based System for Network-Vulnerability Analysis. In Proceedings of the 1998 Workshop on New Security Paradigms, Charlottesville, VA, USA, 22–26 September 1998; Association for Computing Machinery: New York, NY, USA; pp. 71–79. [Google Scholar] [CrossRef]
- Raghavan, S.; Garcia-Molina, H. Representing Web graphs. In Proceedings of the 19th International Conference on Data Engineering (Cat. No.03CH37405), Bangalore, India, 5–8 March 2003; pp. 405–416. [Google Scholar] [CrossRef]
- Jiménez-Luna, J.; Grisoni, F.; Schneider, G. Drug discovery with explainable artificial intelligence. Nat. Mach. Intell. 2020, 2, 573–584. [Google Scholar] [CrossRef]
- Lauritsen, S.M.; Kristensen, M.; Olsen, M.V.; Larsen, M.S.; Lauritsen, K.M.; Jørgensen, M.J.; Lange, J.; Thiesson, B. Explainable artificial intelligence model to predict acute critical illness from electronic health records. Nat. Commun. 2020, 11, 3852. [Google Scholar] [CrossRef]
- Hardt, M.; Price, E.; Srebro, N. Equality of Opportunity in Supervised Learning. arXiv 2016, arXiv:cs.LG/1610.02413. [Google Scholar]
- Robnik-Šikonja, M.; Bohanec, M. Perturbation-based explanations of prediction models. In Human and Machine Learning; Springer: Berlin/Heidelberg, Germany, 2018; pp. 159–175. [Google Scholar]
- Lughofer, E.; Richter, R.; Neissl, U.; Heidl, W.; Eitzinger, C.; Radauer, T. Explaining classifier decisions linguistically for stimulating and improving operators labeling behavior. Inf. Sci. 2017, 420, 16–36. [Google Scholar] [CrossRef]
- Ribeiro, M.T.; Singh, S.; Guestrin, C. “Why should I trust you?” Explaining the predictions of any classifier. In Proceedings of the 22nd ACM SIGKDD International Conference on Knowledge Discovery and Data Mining, San Francisco, CA, USA, 13–17 August 2016; pp. 1135–1144. [Google Scholar]
- Lombrozo, T. The structure and function of explanations. Trends Cogn. Sci. 2006, 10, 464–470. [Google Scholar] [CrossRef] [PubMed]
- Lipton, Z.C. The Mythos of Model Interpretability: In machine learning, the concept of interpretability is both important and slippery. Queue 2018, 16, 31–57. [Google Scholar] [CrossRef]
- Lundberg, S.; Lee, S.I. A unified approach to interpreting model predictions. arXiv 2017, arXiv:1705.07874. [Google Scholar]
- Kenny, E.M.; Ford, C.; Quinn, M.; Keane, M.T. Explaining black-box classifiers using post-hoc explanations-by-example: The effect of explanations and error-rates in XAI user studies. Artif. Intell. 2021, 294, 103459. [Google Scholar] [CrossRef]
- Nascita, A.; Montieri, A.; Aceto, G.; Ciuonzo, D.; Persico, V.; Pescapé, A. XAI meets Mobile Traffic Classification: Understanding and Improving Multimodal Deep Learning Architectures. IEEE Trans. Netw. Serv. Manag. 2021, in press. [Google Scholar] [CrossRef]
- Martens, D.; Baesens, B.; Van Gestel, T.; Vanthienen, J. Comprehensible credit scoring models using rule extraction from support vector machines. Eur. J. Oper. Res. 2007, 183, 1466–1476. [Google Scholar] [CrossRef]
- Dong, Y.; Su, H.; Zhu, J.; Bao, F. Towards interpretable deep neural networks by leveraging adversarial examples. arXiv 2017, arXiv:1708.05493. [Google Scholar]
- Datta, A.; Sen, S.; Zick, Y. Algorithmic transparency via quantitative input influence: Theory and experiments with learning systems. In Proceedings of the 2016 IEEE Symposium on Security and Privacy (SP), San Jose, CA, USA, 22–26 May 2016; pp. 598–617. [Google Scholar]
- Bach, S.; Binder, A.; Montavon, G.; Klauschen, F.; Müller, K.R.; Samek, W. On pixel-wise explanations for non-linear classifier decisions by layer-wise relevance propagation. PLoS ONE 2015, 10, e0130140. [Google Scholar] [CrossRef]
- Lipovetsky, S.; Conklin, M. Analysis of regression in game theory approach. Appl. Stoch. Models Bus. Ind. 2001, 17, 319–330. [Google Scholar] [CrossRef]
- Štrumbelj, E.; Kononenko, I. Explaining prediction models and individual predictions with feature contributions. Knowl. Inf. Syst. 2014, 41, 647–665. [Google Scholar] [CrossRef]
- Huysmans, J.; Dejaeger, K.; Mues, C.; Vanthienen, J.; Baesens, B. An empirical evaluation of the comprehensibility of decision table, tree and rule based predictive models. Decis. Support Syst. 2011, 51, 141–154. [Google Scholar] [CrossRef]
- Stepin, I.; Alonso, J.M.; Catala, A.; Pereira-Fariña, M. A survey of contrastive and counterfactual explanation generation methods for explainable artificial intelligence. IEEE Access 2021, 9, 11974–12001. [Google Scholar] [CrossRef]
- Holzinger, A. From Machine Learning to Explainable AI. In Proceedings of the 2018 World Symposium on Digital Intelligence for Systems and Machines (DISA), Koice, Slovakia, 23–25 August 2018; pp. 55–66. [Google Scholar] [CrossRef]
- Samek, W.; Wiegand, T.; Müller, K.R. Explainable Artificial Intelligence: Understanding, Visualizing and Interpreting Deep Learning Models. arXiv 2017, arXiv:cs.AI/1708.08296. [Google Scholar]
- Tonekaboni, S.; Joshi, S.; McCradden, M.D.; Goldenberg, A. What Clinicians Want: Contextualizing Explainable Machine Learning for Clinical End Use. In Proceedings of the 4th Machine Learning for Healthcare Conference; Doshi-Velez, F., Fackler, J., Jung, K., Kale, D., Ranganath, R., Wallace, B., Wiens, J., Eds.; PMLR: Ann Arbor, MI, USA, 2019; Volume 106, pp. 359–380. [Google Scholar]
- Chase, W.G.; Simon, H.A. Perception in chess. Cogn. Psychol. 1973, 4, 55–81. [Google Scholar] [CrossRef]
- Kuhn, H.W. Classics in Game Theory; Princeton University Press: Princeton, NJ, USA, 1997. [Google Scholar]
- Lucas, W. L’arithmétique amusante. Nature 1895, 53, 79. [Google Scholar] [CrossRef]
- Zhuang, Y.; Li, S.; Peters, T.V.; Zhang, C. Improving Monte-Carlo tree search for dots-and-boxes with a novel board representation and artificial neural networks. In Proceedings of the 2015 IEEE Conference on Computational Intelligence and Games (CIG), Tainan, Taiwan, 31 August–2 September 2015; pp. 314–321. [Google Scholar] [CrossRef]
- Kejriwal, M.; Knoblock, C.A.; Szekely, P. Knowledge Graphs: Fundamentals, Techniques, and Applications; MIT Press: Cambridge, MA, USA, 2021. [Google Scholar]
- González García, C.; Zhao, L.; García-Díaz, V. A User-Oriented Language for Specifying Interconnections Between Heterogeneous Objects in the Internet of Things. IEEE Internet Things J. 2019, 6, 3806–3819. [Google Scholar] [CrossRef]
- Meana-Llorián, D.; García, C.G.; García-Bustelo, B.C.P.; Lovelle, J.M.C. BILROST: Handling Actuators of the Internet of Things through Tweets on Twitter using a Domain- Specific Language. Int. J. Interact. Multim. Artif. Intell. 2021, 6, 133–144. [Google Scholar]


Publisher’s Note: MDPI stays neutral with regard to jurisdictional claims in published maps and institutional affiliations. |
© 2021 by the authors. Licensee MDPI, Basel, Switzerland. This article is an open access article distributed under the terms and conditions of the Creative Commons Attribution (CC BY) license (https://creativecommons.org/licenses/by/4.0/).