Article

Improving Deep Object Detection Algorithms for Game Scenes

1
Department of Human Centric Intelligent Information, Sangmyung University, Seoul 03016, Korea
2
Division of SW Convergence, Sangmyung University, Seoul 03016, Korea
3
Department of Computer Science, Sangmyung University, Seoul 03016, Korea
*
Authors to whom correspondence should be addressed.
These authors contributed equally to this work.
Electronics 2021, 10(20), 2527; https://doi.org/10.3390/electronics10202527
Submission received: 29 August 2021 / Revised: 3 October 2021 / Accepted: 8 October 2021 / Published: 17 October 2021
(This article belongs to the Special Issue Applications of Computer Vision in Interactive Environments)

Abstract

:
The advancement and popularity of computer games make game scene analysis one of the most interesting research topics in the computer vision society. Among the various computer vision techniques, we employ object detection algorithms for the analysis, since they can both recognize and localize objects in a scene. However, applying the existing object detection algorithms for analyzing game scenes does not guarantee a desired performance, since the algorithms are trained using datasets collected from the real world. In order to achieve a desired performance for analyzing game scenes, we built a dataset by collecting game scenes and retrained the object detection algorithms pre-trained with the datasets from the real world. We selected five object detection algorithms, namely YOLOv3, Faster R-CNN, SSD, FPN and EfficientDet, and eight games from various game genres including first-person shooting, role-playing, sports, and driving. PascalVOC and MS COCO were employed for the pre-training of the object detection algorithms. We proved the improvement in the performance that comes from our strategy in two aspects: recognition and localization. The improvement in recognition performance was measured using mean average precision (mAP) and the improvement in localization using intersection over union (IoU).

1. Introduction

Computer games have been one of the most popular applications for all generations since the dawn of the computing age. Recent progress in computer hardware and software has presented computer games of high quality. Nowadays, e-sports, playing or watching computer games, have become some of the most popular sports. E-sports are newly emerging sports where professional players compete in highly popular games, such as Starcraft and League of Legends (LoL), while millions of people watch them. Consequently, e-sports have become one of the most popular types of content on various media channels, including YouTube and Tiktok. From these trends, analyzing game scenes by recognizing and localizing objects in the scenes has become an interesting research topic.
Among the many computer vision algorithms including object recognition and object detection, localization and segmentation are candidates for analyzing game scenes. In analyzing game scenes, both recognizing and localizing objects in the scene are required. Therefore, we select object detection algorithms for analyzing game scenes. Object detection algorithms can identify thousands of objects and draw bounding boxes for objects in real-time. At this point, we have a question in relation to applying object detection algorithms to game scenes: “Can the object detection algorithms trained by real scenes be applied to game scenes?”
Detecting objects in game scenes is not a straightforward problem that can be resolved by applying existing object detection algorithms. The recent progress in computing hardware and software techniques presents diverse visually pleasing rendering styles to computer games. Some games are rendered in a photorealistic style, while some are in a cartoon style. Furthermore, various depictions of a game scene with various colors and tones present a distinctive game scene style. Some cartoon-based games present their deformed characters and objects according to their original cartoons. Therefore, detecting various objects in diverse games can be challenging.
Existing deep-learning-based object detection algorithms show satisfactory detection performance for images captured from the real world. We selected five of the most widely-used deep object detection algorithms: YOLOv3 [1], Faster R-CNN [2], SSD [3], FPN [4] and EfficientDet [5]. We also prepared two frequently used datasets, PascalVOC [6,7] and MS COCO [8], for training the object detection algorithms. We examined these algorithms in recognizing objects in game scenes.
We aimed to improve the performance of object recognition of these algorithms by retraining them using game scenes. We prepared eight games including various genres, such as first-person shooting, racing, sports, and role-playing. Two of the selected games presented cartoon-styled scenes. We excluded games with non-real objects. In many fantasy games, for example, dragons, orcs, and non-existent characters appear. We excluded these games since existing object detection algorithms are not trained to detect dragons or orcs.
We also tested a data augmentation scheme that produces cartoon-styled images for the images in frequently used datasets. Several widely used image abstraction and cartoon-styled rendering algorithms were employed for the augmentation process. We retrained the algorithms using the augmented images and measured their performances.
To prove that the performance of the object detection algorithms was improved using game scene datasets, we compared the comparison for two cases. One case was to compare PascalVOC and PascalVOC with game scenes, and the other case was to compare MS COCO and MS COCO with game scenes. For each case of comparisons, the five object detection algorithms were pre-trained with a frequently used dataset. After measuring the performance, we retrained the algorithms with game scenes and measured the performance. These performances were compared to prove our hypothesis that the object detection algorithms trained with the public dataset and game scenes showed better performance than the algorithms trained only with the public dataset.
We compared the pre-trained and retrained algorithms in terms of two metrics: mean average precision (mAP) and intersection over union (IoU). We examined the accuracy of recognizing objects with mAP and the accuracy of localizing objects with IoU. From this comparison, we could determine whether the existing object detection algorithms could be used for game scenes. Furthermore, we could also determine whether the object detection algorithms retrained with game scenes showed a significant difference from the pre-trained object detection algorithms.
The contributions of this study are summarized as follows:
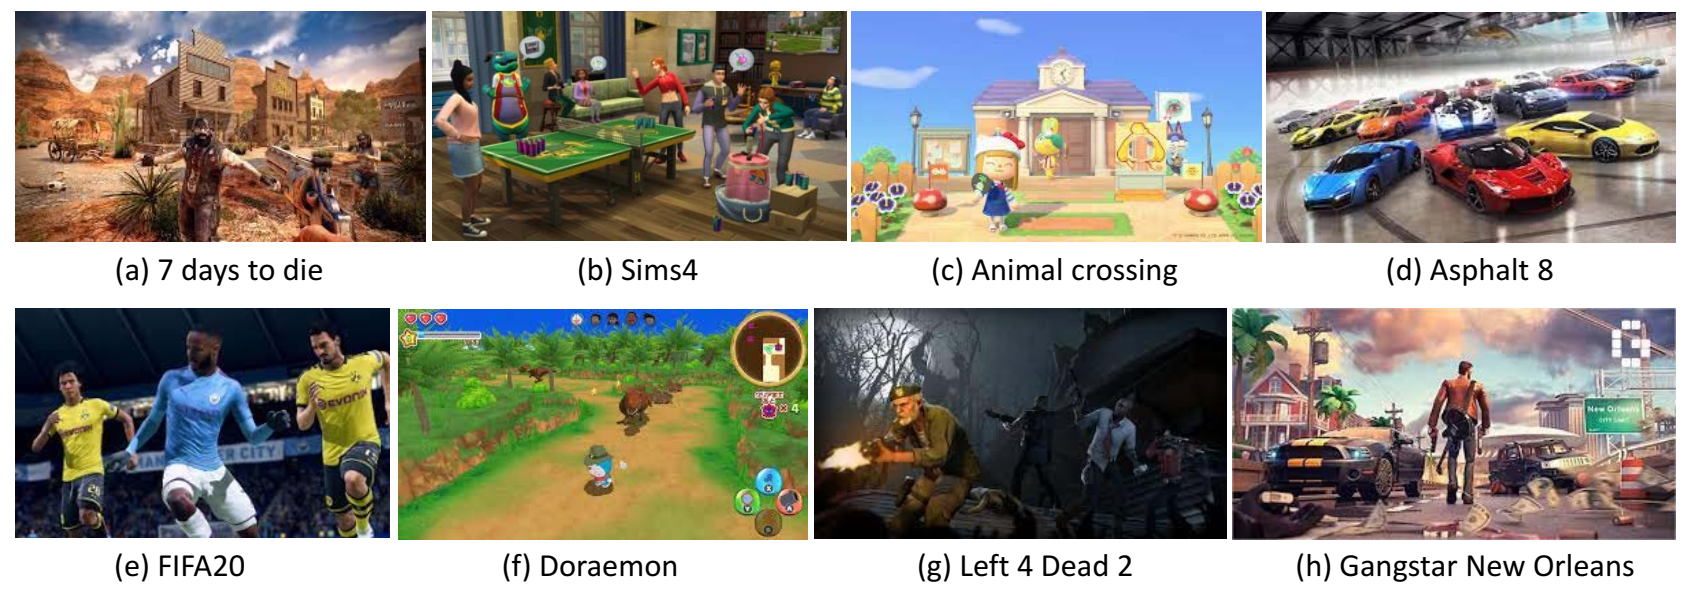
  • We built a dataset of game scenes collected from eight games.
  • We presented a framework for improving the performance of object detection algorithms on game scenes by retraining them using game scene datasets.
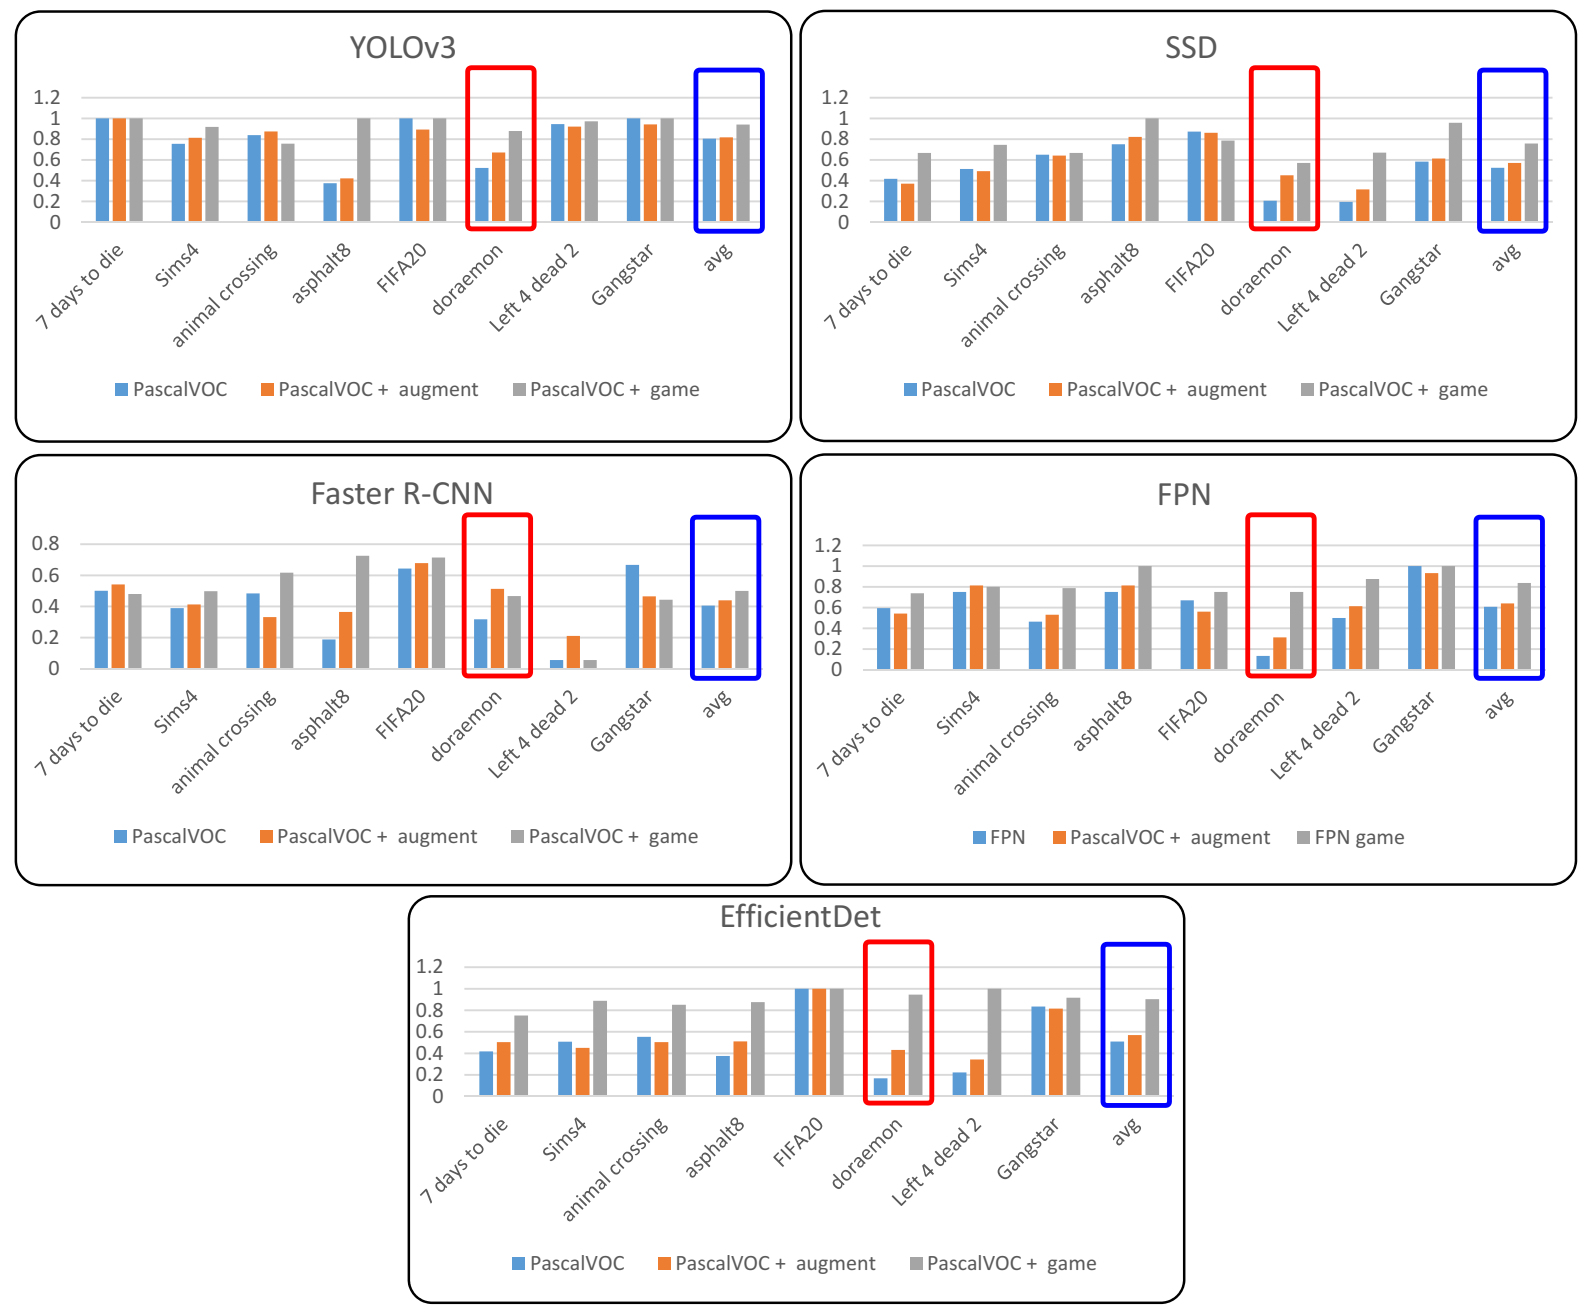
  • We tested whether the augmented images using image abstraction and stylization schemes can improve the performance of the object detection algorithms on game scenes.
This study is organized as follows. Section 2 briefly explains deep-learning-based object detection algorithms and presents several works on object detection techniques in computer games. We elaborate on how we selected object detection algorithms and games in Section 3. In Section 4, we explain how we trained the algorithms and present the resulting figures. In Section 5, we analyze the results and answer our RQ. Finally, we conclude and suggest future directions in Section 6.

2. Related Work

2.1. Deep Object Detection Approaches

Object detection, which extracts a bounding box around a target object from a scene, is one of the most popular research topics in computer vision. Many object detection algorithms have been presented after the emergence of the histogram of the oriented gradient (HoG) algorithm [9]. Recently, the progress of deep learning techniques has accelerated object detection algorithms on a great scale. Many recent works, including the you only look once (YOLO) series [1,10,11], the region with a convolutional neural network (R-CNN) series [2,12,13], spatial pyramid pooling (SPP) [14] and the single-shot multibox detector (SSD) [3], have demonstrated impressive results in detecting diverse objects from various scenes.
YOLO detects objects by decomposing an image into S × S grid cells. We estimate B bounding boxes at each cell, each of which possesses a box confidence score and C conditional class probabilities. The class confidence score, which estimates the probability of an object belonging to a class in the cell, is computed by multiplying the box confidence score with the conditional class probability. YOLO is a CNN that estimates the class confidence score for each cell. Although YOLOv1 [10] has a very fast computational speed, it suffers from relatively low mAP and limited classes for detection. Redmon et al. later presented YOLOv2, also known as YOLO9000, which detects 9000 objects with improved precision [11]. They further improved YOLOv2’s performance in YOLOv3 [1].
R-CNN, which is another mainstream deep object detection algorithm, employs a two-pass approach [12]. The first pass extracts a candidate region, where an object should go through a selective search and a region proposal network. In the second, they recognize the object and localize it using a convolutional network. Girshick presented fast R-CNN, improving computational efficiency [13], and Ren et al. presented faster R-CNN [2].
The SPP algorithm allows arbitrary size input for object detection [14]. It does not crop or warp input images to avoid distortion of the result. It devises an SPP layer before the fully connected (FC) layer to fix the size of feature vectors extracted from the convolution layers. SSD addresses the problem of YOLO, which neglects objects smaller than the grid [3]. The SSD algorithm applies an object detection algorithm to each feature map extracted through a series of convolutional layers. The detected information is merged into a final detection result by executing a fast non-maximum suppression.
FPN builds a pyramid structure on the images by reducing their resolutions [4]. FPN extracts features in a top-down approach and merges the extracted features in both high-resolution images and low-resolution images. In the high-resolution images, the features in low-resolution images are employed to predict the features in high-resolution images. The pyramid structure of FPN extracts more semantics on the features in low-resolution images. Therefore, FPN extracts features from the input image in a convincing way.

2.2. Object Detection in a Game

Utsumi et al. [15] presented a classical object detection and tracking method for a soccer game in the early days. They employed a color rarity and local edge property for their object detection scheme. They extracted objects with high edges from a roughly single-colored background. Compared to a real soccer game scene, their model shows a comparatively high detection rate.
Many researchers have applied the recent progress of deep-learning-based object detection algorithms to individual games.
Chen and Yi [16] presented a deep Q-learning approach for detecting objects in 30 classes from the classic game Super Smash Bros. They proposed a single-frame 19-layered CNN model, with five convolution layers, three pooling layers and three FC layers. Their model recorded 80% top-1 and 96% top-3 accuracies.
Sundareson [17] chose a specific data flow for in-game object classification. Their model also aimed to detect objects in virtual reality (VR). They converted 4K input images into 256 × 256 resolution for efficiency. Their model’s performance exhibits very competitive results in implementing in-game and in-VR object classification using CUDA.
Venkatesh [18] surveyed and proposed SmashNet, a CNN-based object tracking scheme in games. This model recorded 68.25% classification precision for four characters in fighting games by employing very effective structures. The author also developed KirbuBot, which performs basic commands on the positions of two tracked characters.
Liu et al. [19] employed faster R-CNN to implement the vision system of a game robot. They extracted features and position label mapping for a single object using ResNet100. The information about object movement in a game is tracked using the robot’s camera to improve the accuracy and speed of the model recognition.
Chen et al. [20] attempted to address the multi-object tracking problem, which is crucial in video analysis, surveillance and robot control, using a deep-learning-based tracking method. They applied their method to a football video to demonstrate the performance of their method.
Tolmacheva et al. [21] used a YOLOv2 model to track a puck in an air hockey game. The air hockey game is an arcade game played by two players who aim to push a puck into the opponent’s goal by moving a small hand-held stick. Since the puck moves with great velocity, exact detecting and tracking of an object is a challenging problem. They collected and prepared datasets from game images to predict the trajectory of a fixed object. Using YOLOv2 in a C implementation, they recorded 80% detection accuracy.
Yao et al. [22] presented a two-stage algorithm to detect and recognize “hero” characters from a video game named Honor of Kings. They applied a template-matching method to detect all heroes in the frames and devised a deep convolutional network to recognize the name of each detected hero. They employed InceptionNet and recorded a 99.6% F1 score with less than 5 ms recognition time.
Spijkerman and van der Harr [23] presented a vehicle recognition scheme for Formula One game scenes using several object detection algorithms, including HoG, support vector machine and faster R-CNN. They trained their models using images captured from the F1 2019 video game. Their models’ precision and recall scores based on R-CNN, the best among the three models, record 97% and 99%, respectively. They applied the trained R-CNN model to real objects and achieved 93% precision.
Kim et al. [24] improved the performance of a safety zone monitoring system using game-engine-based internal traffic control plans (ITCPs). They used a deep-learning-based object detection algorithm to recognize and detect workers and types of equipment from aerial images. They also monitored unsafe activities of works by observing four rules. Through this approach, they emphasized the importance of a digital ITCP-based safety monitoring system.
Recently, the YOLO model has been employed with Unity to present a very effective model for object detection in games [25].

3. Collecting Materials

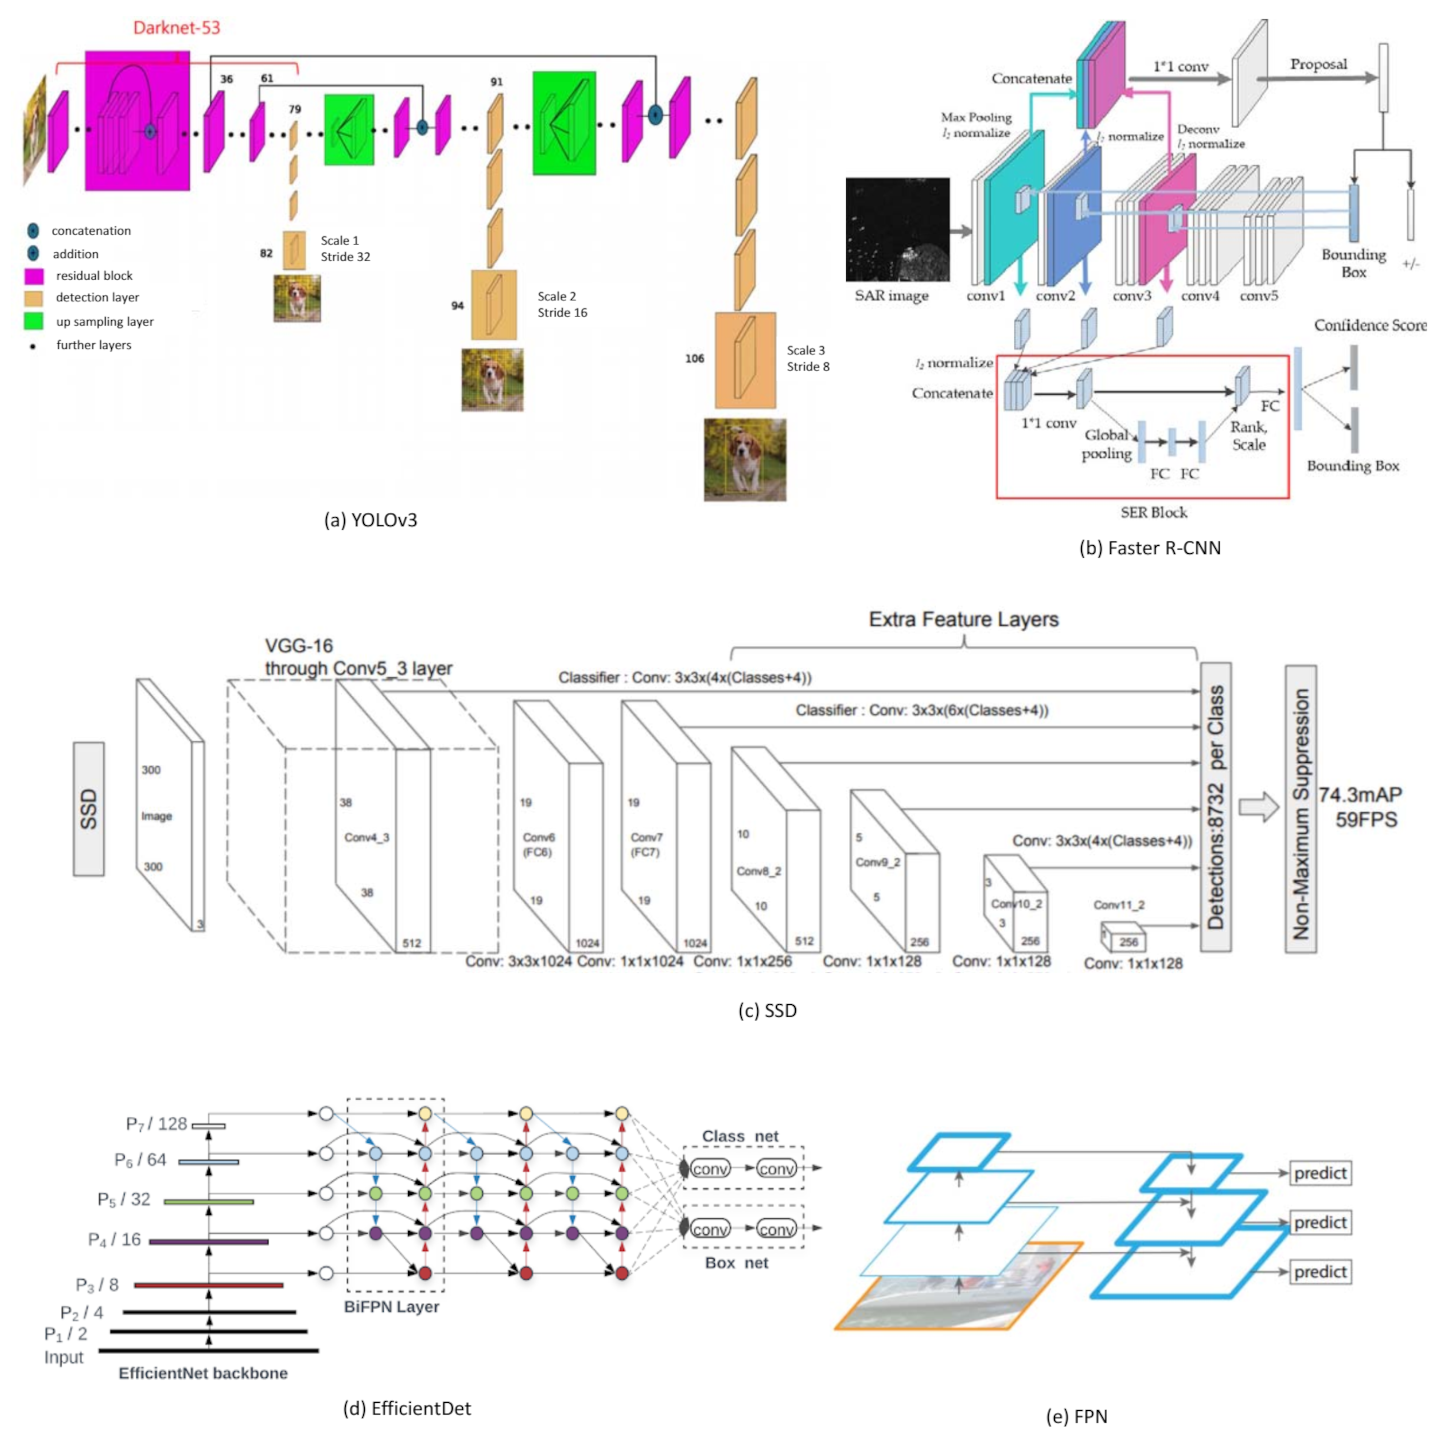
3.1. Selected Deep Object Detection Algorithms

We found many excellent deep object detection algorithms in the recent literature. Among these algorithms, we selected the most highly-cited algorithms: YOLO [1,10,11], R-CNN [2,12,13], and SSD [3]. Among various versions of YOLO algorithms, we selected YOLOv3 [1], which detects 9000 objects very effectively. For R-CNN algorithms, we selected Faster R-CNN [2], the cutting-edge version of the R-CNNs. Although these algorithms are highly cited, we needed to select a recent algorithm. Therefore, we selected EfficientDet [5]. Therefore, we compared four deep object detection algorithms in our study: YOLOv3, Faster R-CNN, SSD and EfficientDet. The architectures of these algorithms are compared in Figure 1.

3.2. Selected Games

We had three strategies for selecting games in our study. The first strategy was to select games over various game genres. Therefore, we referred to Wikipedia [26] and sampled game genres including action, adventure, role-playing, simulation, strategy, and sports. The second strategy was to exclude games with objects that existing object detection algorithms cannot recognize. Many role-playing games include fantasy items such as dragons, wyverns, titans, or orcs, which are not recognized by existing algorithms. We also excluded strategy games since they include weapons such as tanks, machine guns, and jet fighters that are not recognized. Our third strategy was to sample both photo-realistically rendered games and cartoon-rendered games. Although most games are rendered photo-realistically, some games employ cartoon-styled rendering because of their uniqueness. Games whose original story is based on cartoons tend to preserve cartoon-styled rendering. Therefore, we sampled cartoon-rendered games to test how the selected algorithms can detect cartoon-styled objects.
We selected games for our study from these genres as evenly as possible. For action and adventure games, we selected 7 Days to Die [27], Left 4 Dead 2 [28] and Gangstar New Orleans [29]. For simulation, we selected Sims4 [30], Animal Crossing [31], and Doraemon [32]. For sports, we selected Asphalt 8 [33] and FIFA 20 [34]. Among these games, Animal Crossing and Doraemon are rendered in a cartoon style. Figure 2 shows illustrations of the selected games.

4. Training and Results

4.1. Training

We retrained the existing object detection algorithms using two datasets: PascalVOC and game scenes. We sampled 800 game scenes: 100 scenes from 8 games we selected. We augmented the sampled game scenes in various schemes: flipping, rotation, controlling hues and controlling tone. By alternating these augmentation schemes, we could build more than 10,000 game scenes for retraining the selected algorithms.
We trained and tested the algorithms on a personal computer with an Intel Pentium i7 CPU and nVidia RTX 2080 GPU. The time required for re-training the algorithms is presented in Table 1.

4.2. Results

The result images on sampled eight samples comparing pre-trained algorithms and re-trained algorithms are presented in Appendix A. We have presented our results according to the following strategies: recognition performance measured by mAP, localization performance measured by IoU and various statistics. We measured mAP, IoU and various statistic values including average IoU, precision, recall, F1 score and accuracy for the five object recognition algorithms with two datasets.

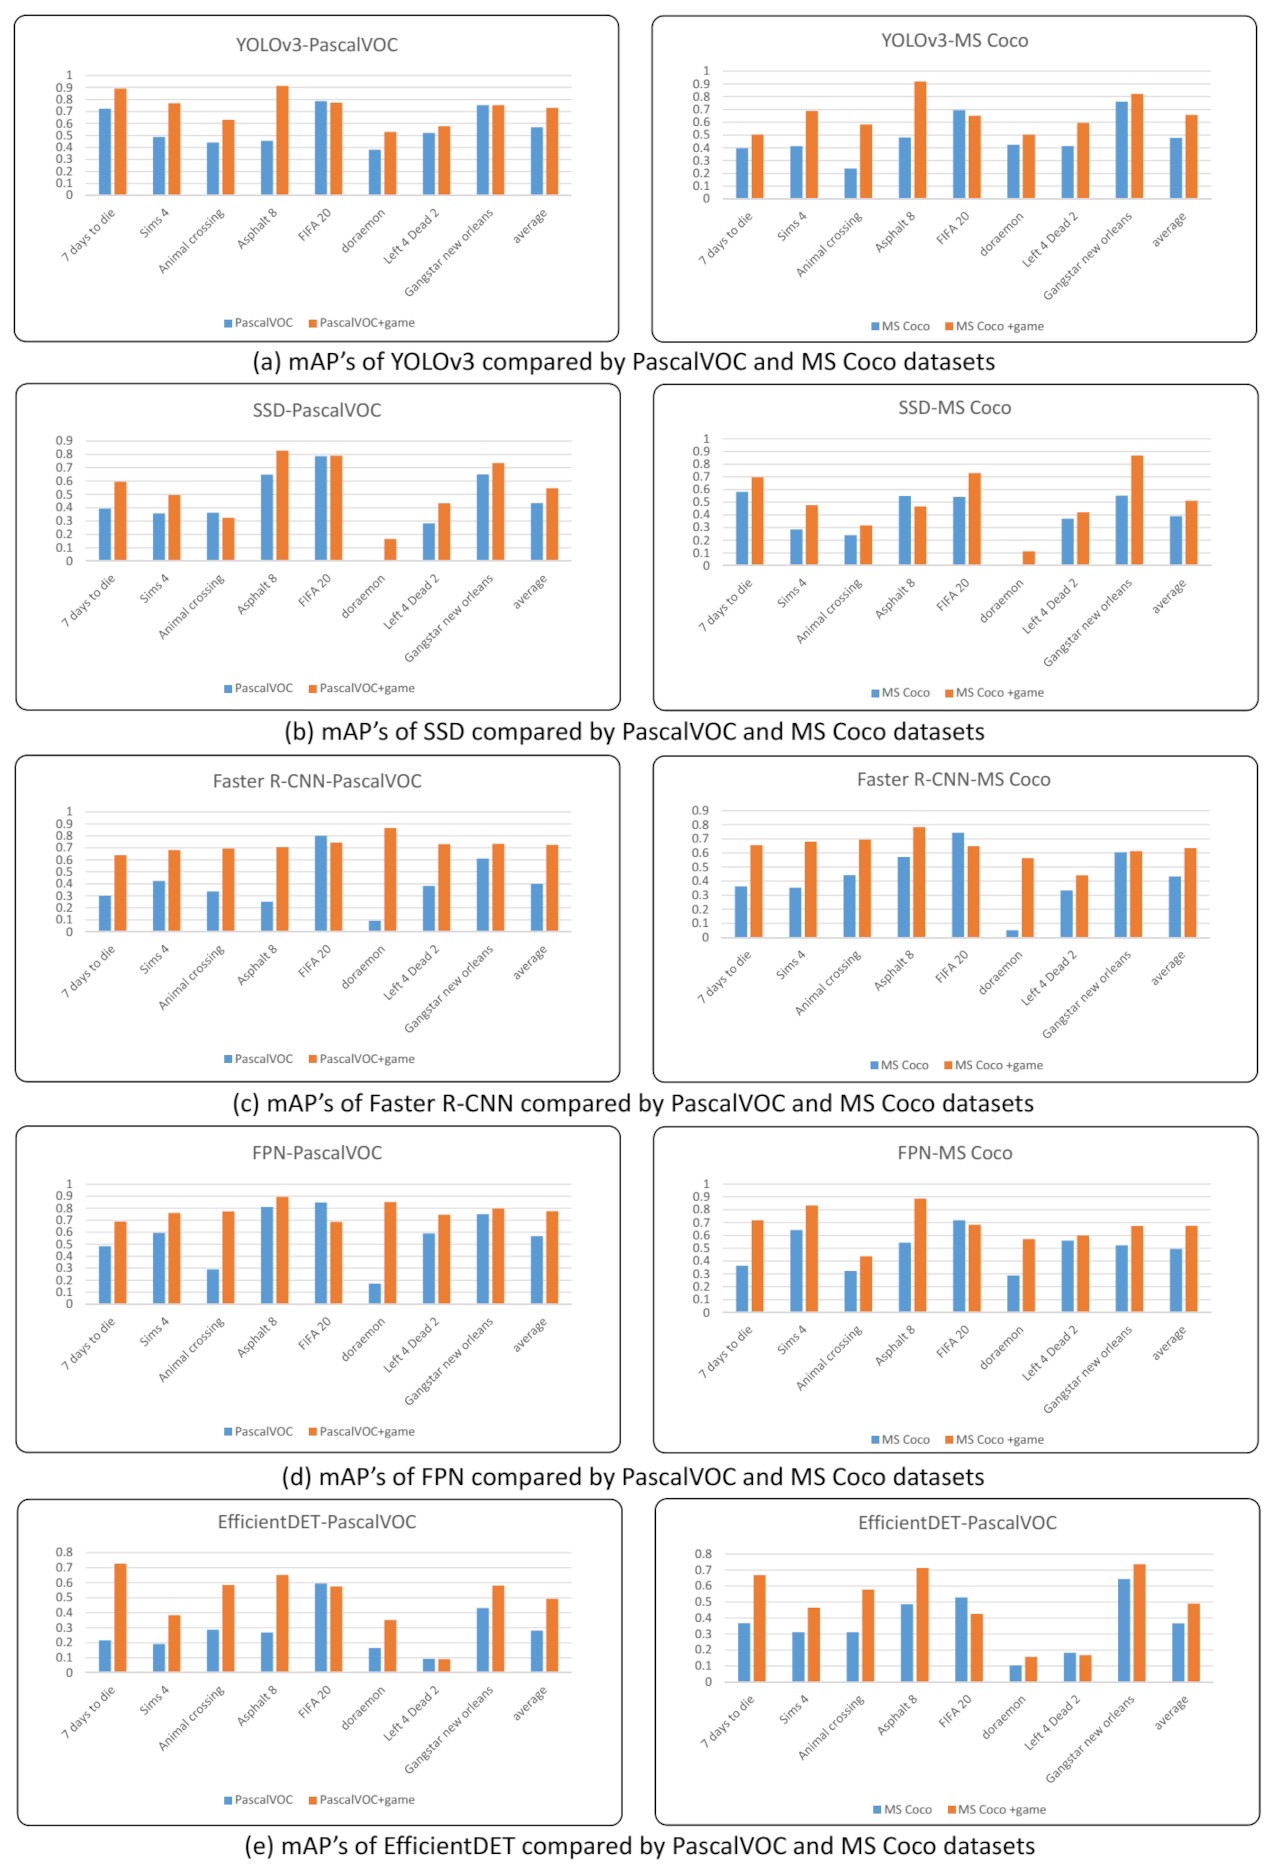
4.2.1. Measuring and Comparing Recognition Performance Using mAP

In Table 2, we compare mAP values for the five algorithms between the Pascal VOC dataset and the Pascal VOC dataset with game scenes. We show the same comparison on the MS COCO dataset in Table 3. In Figure 3, we illustrate the comparisons presented in Table 2 and Table 3.

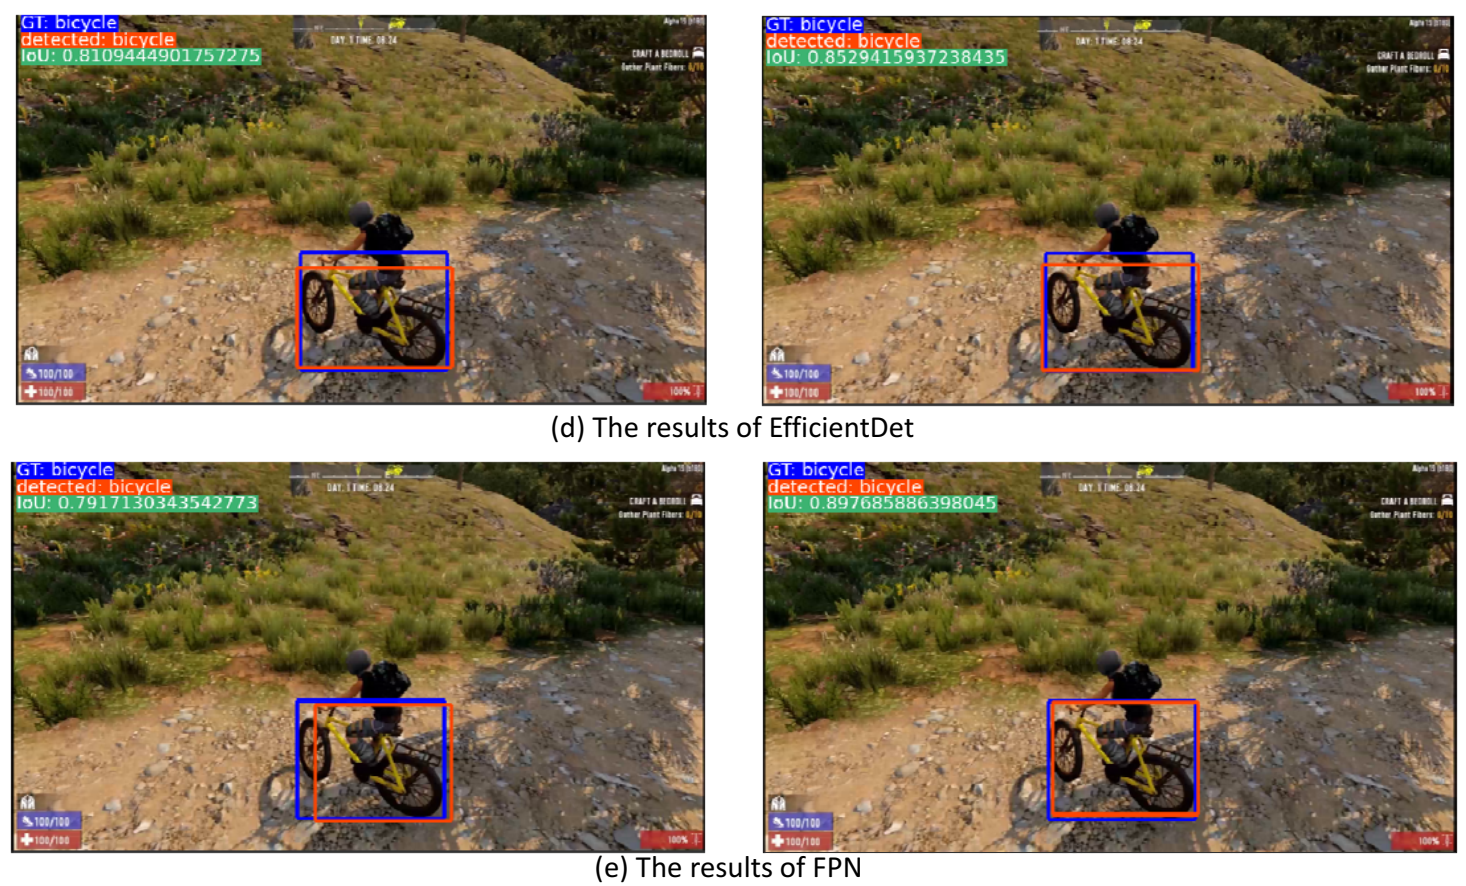
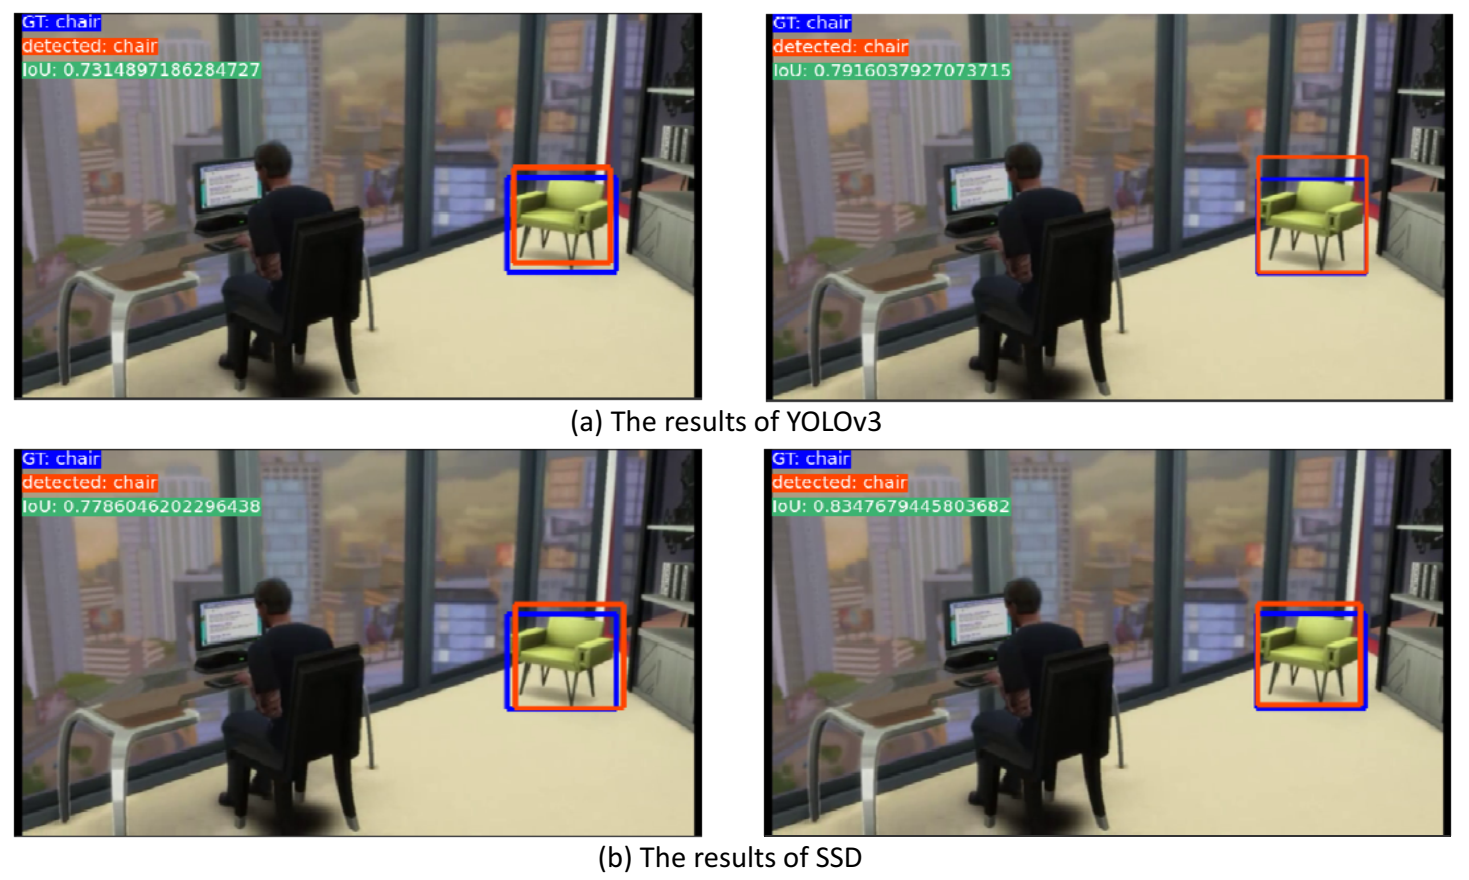
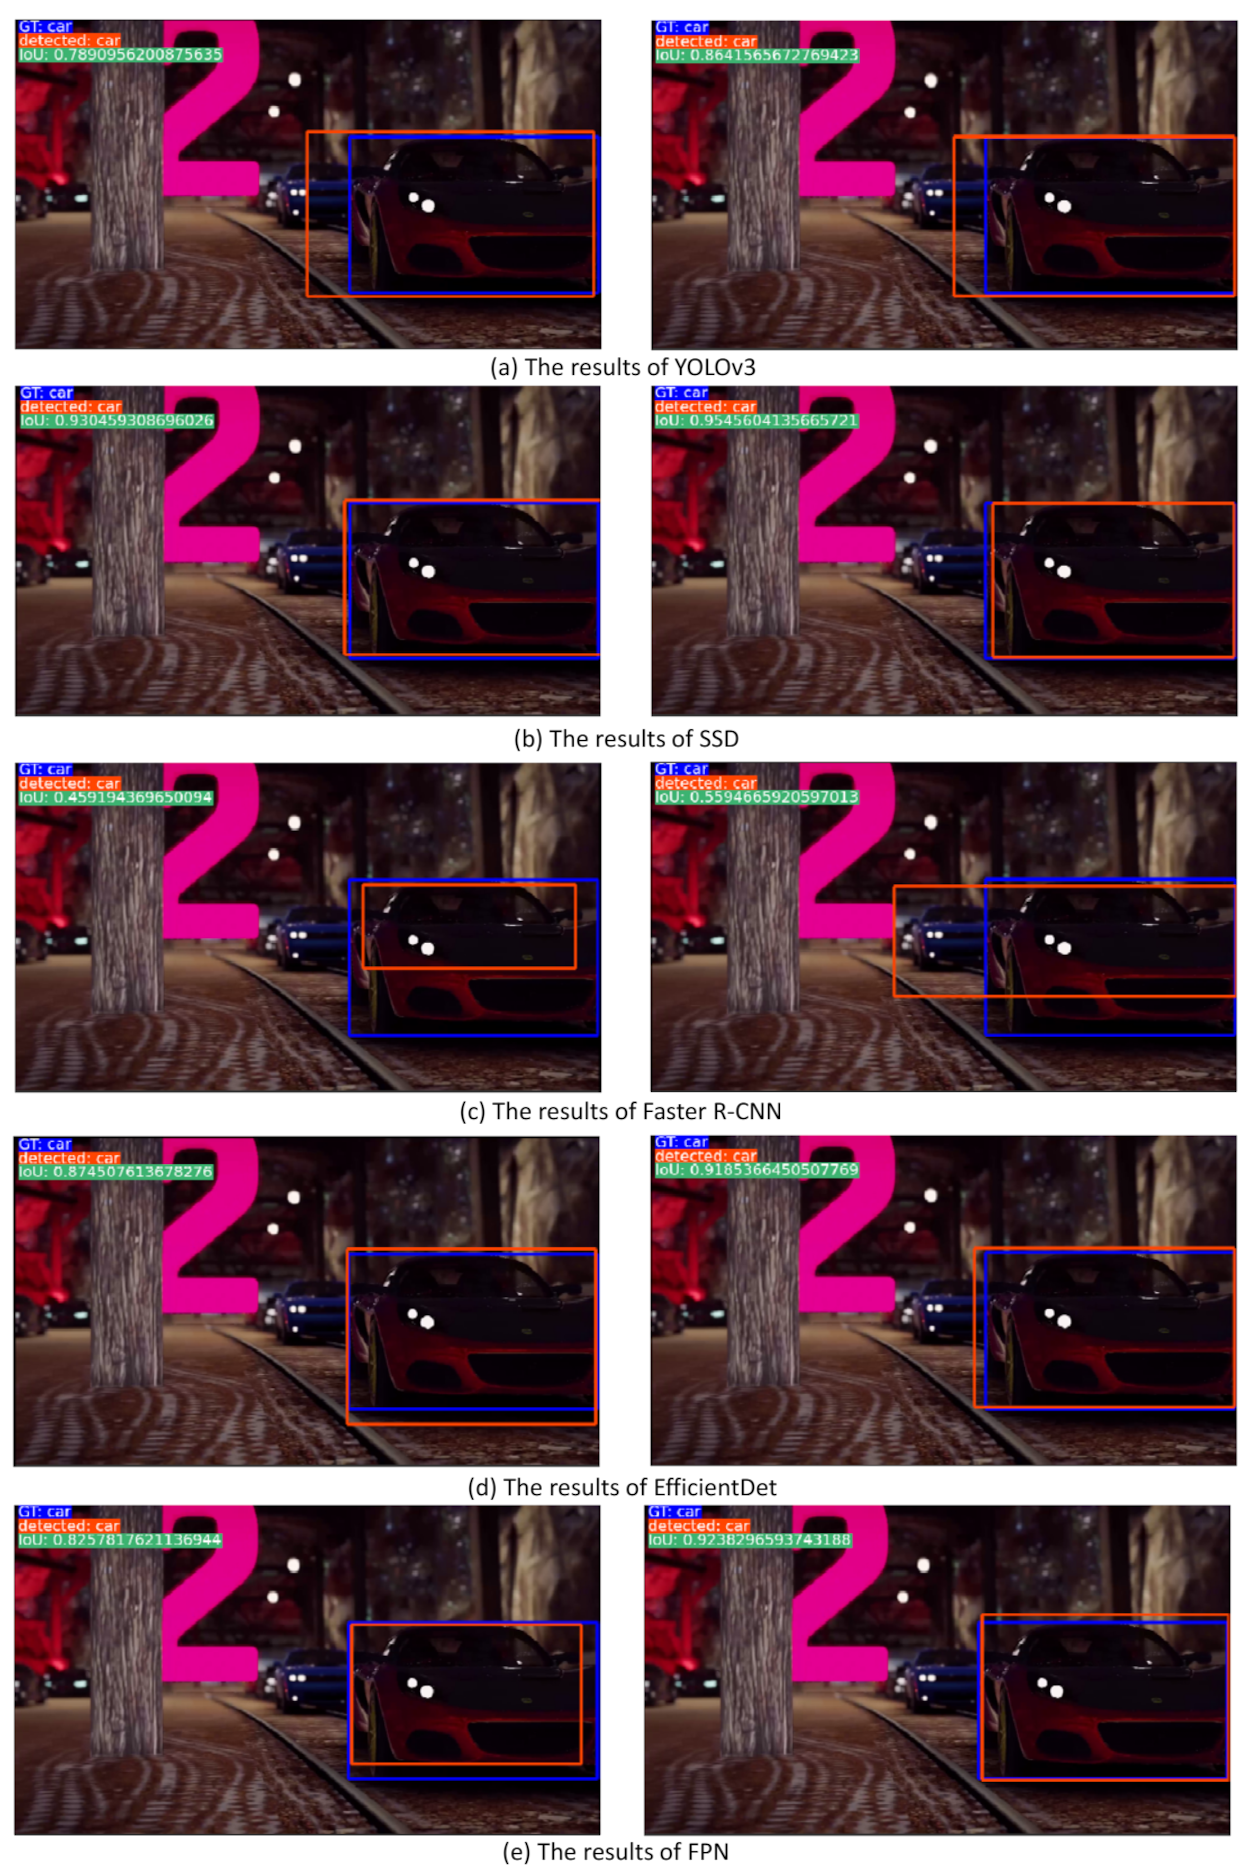
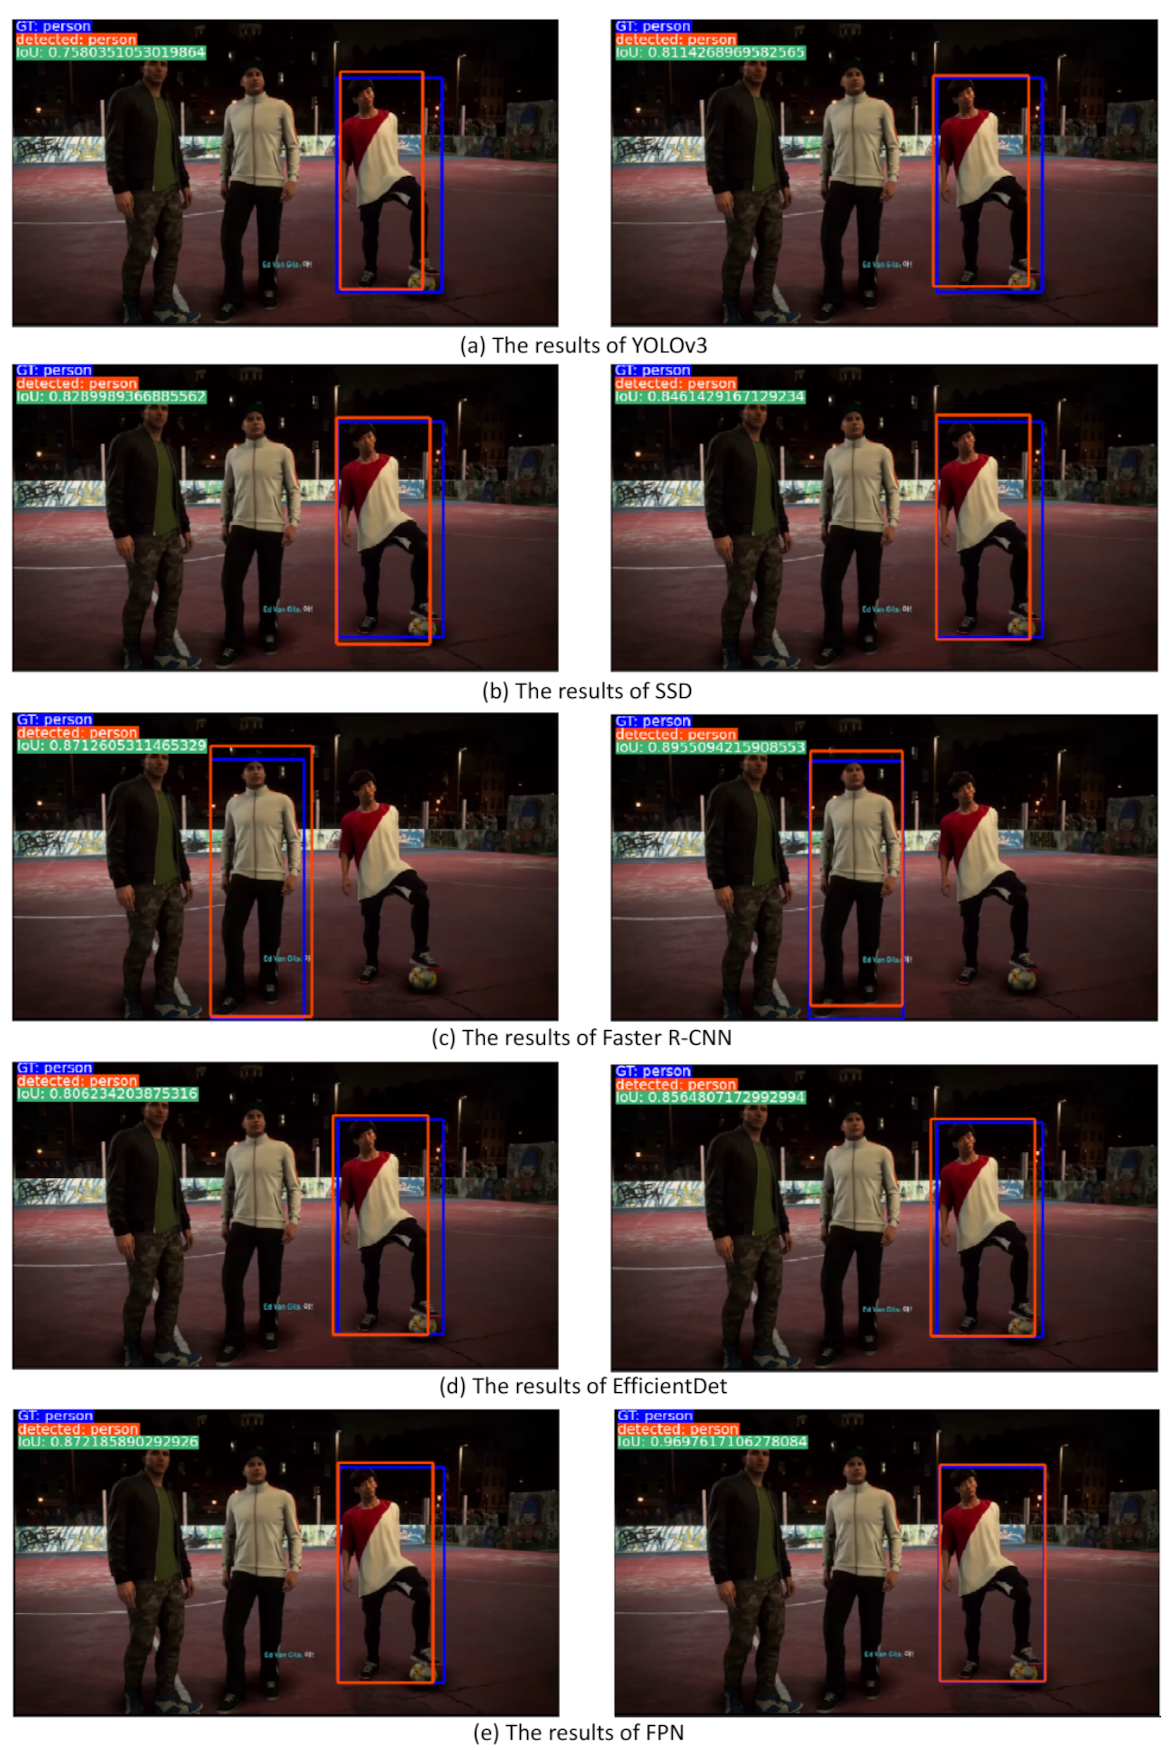
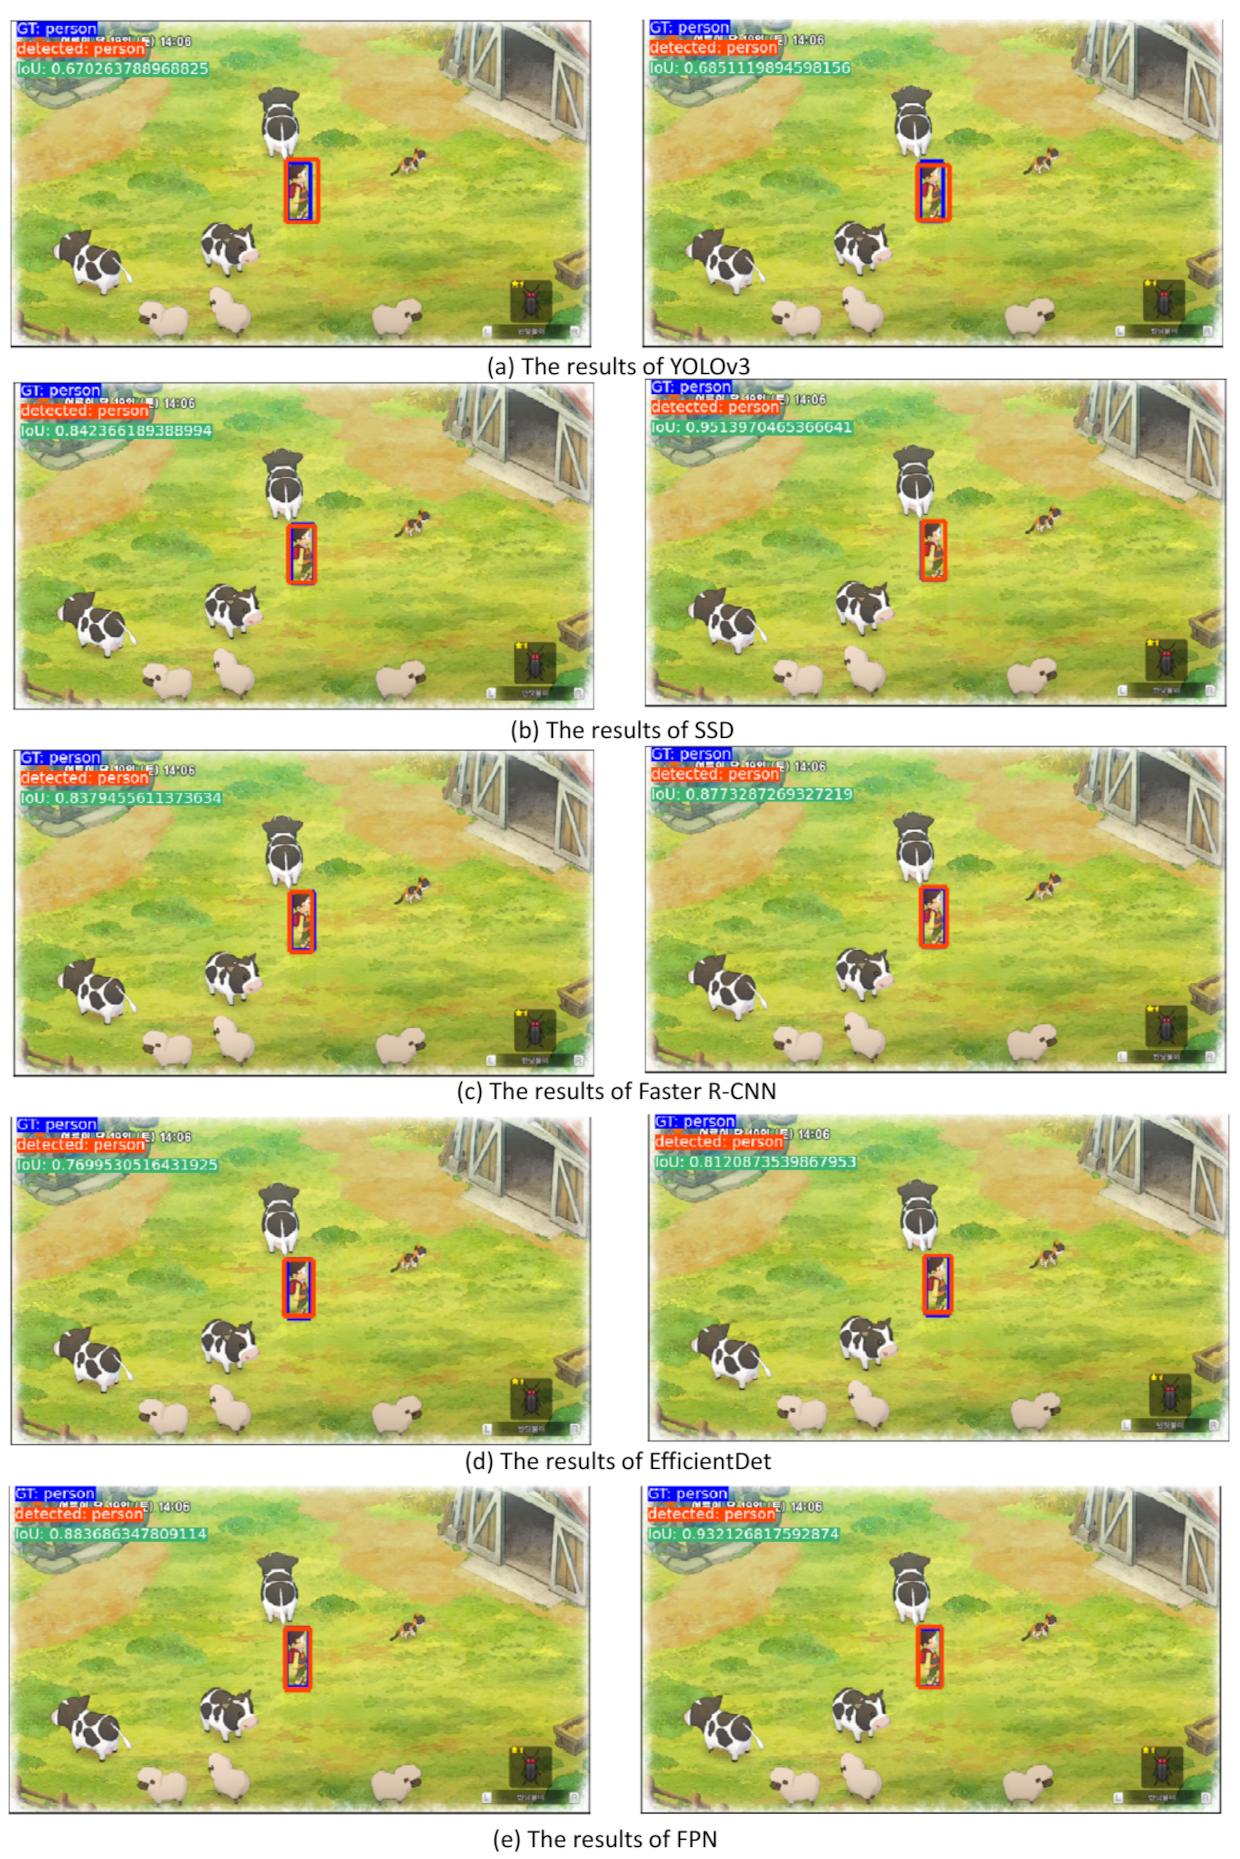
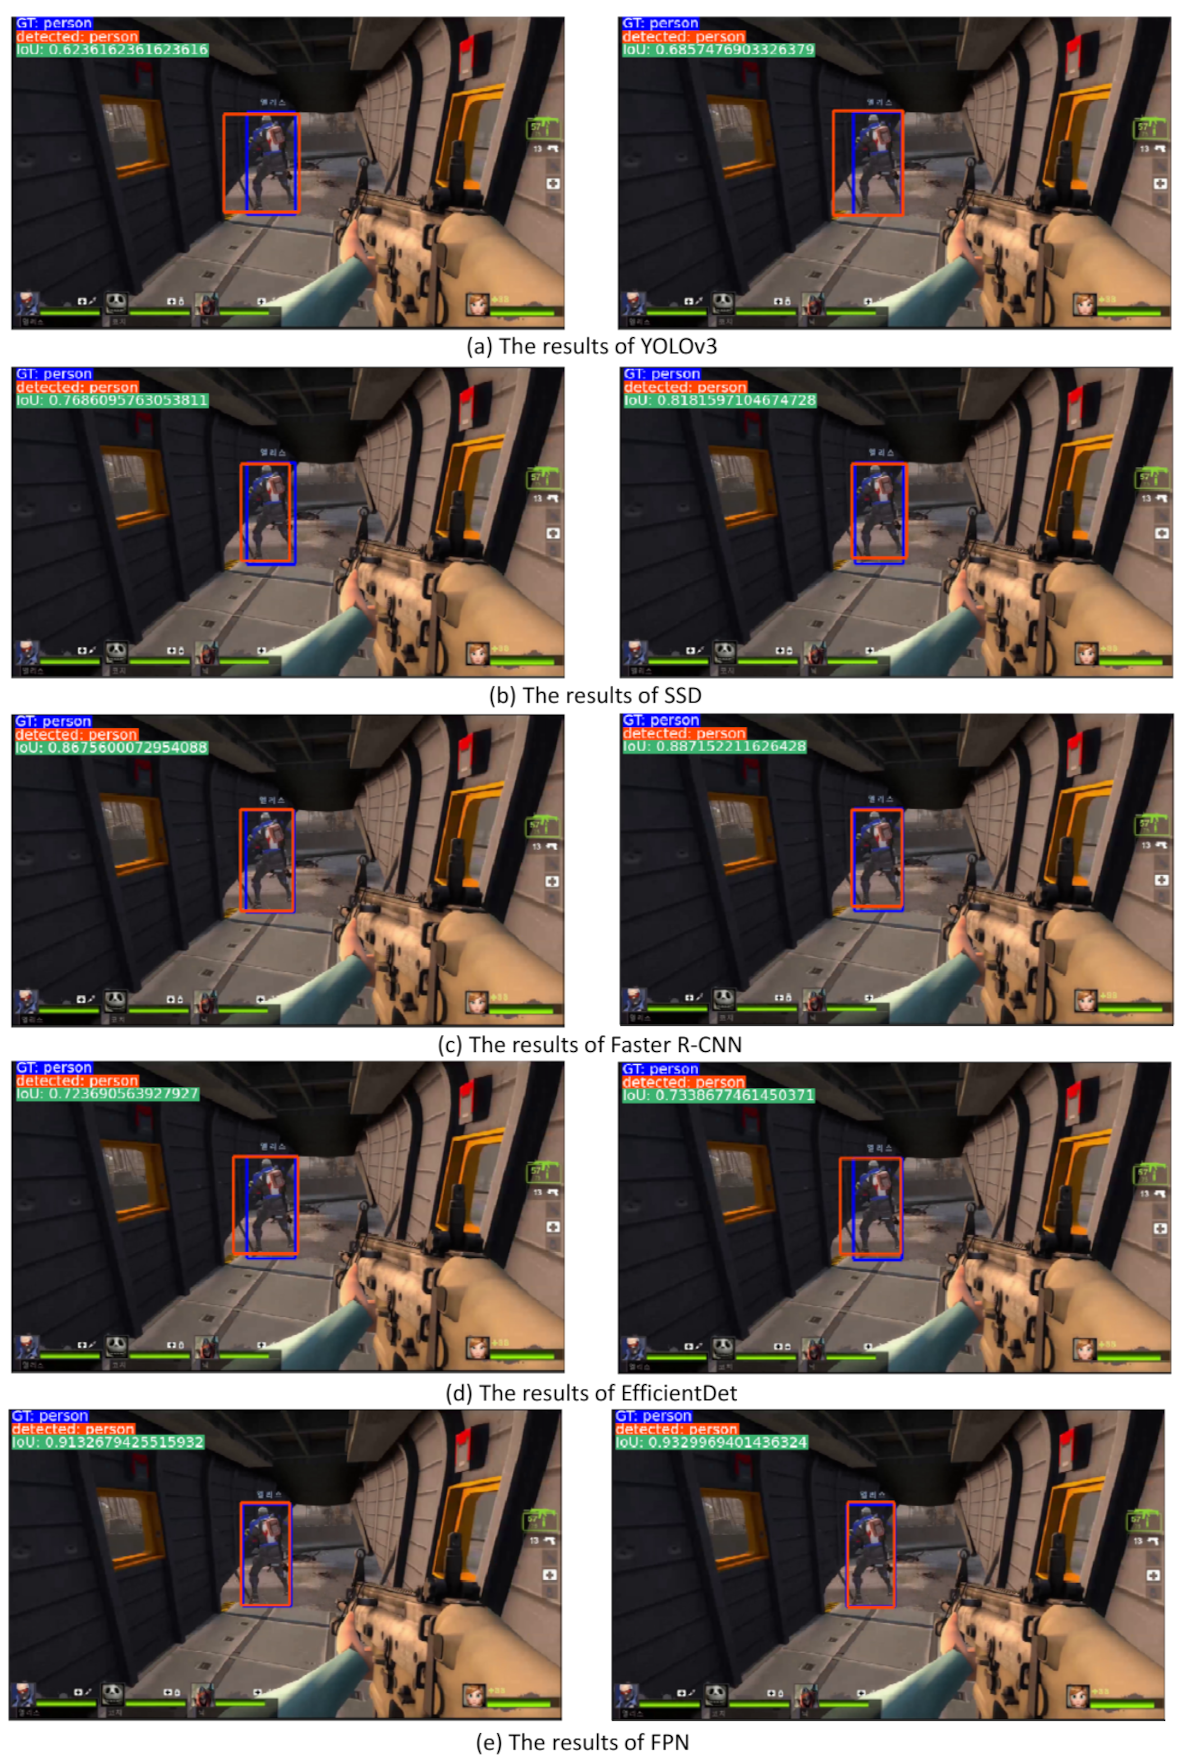
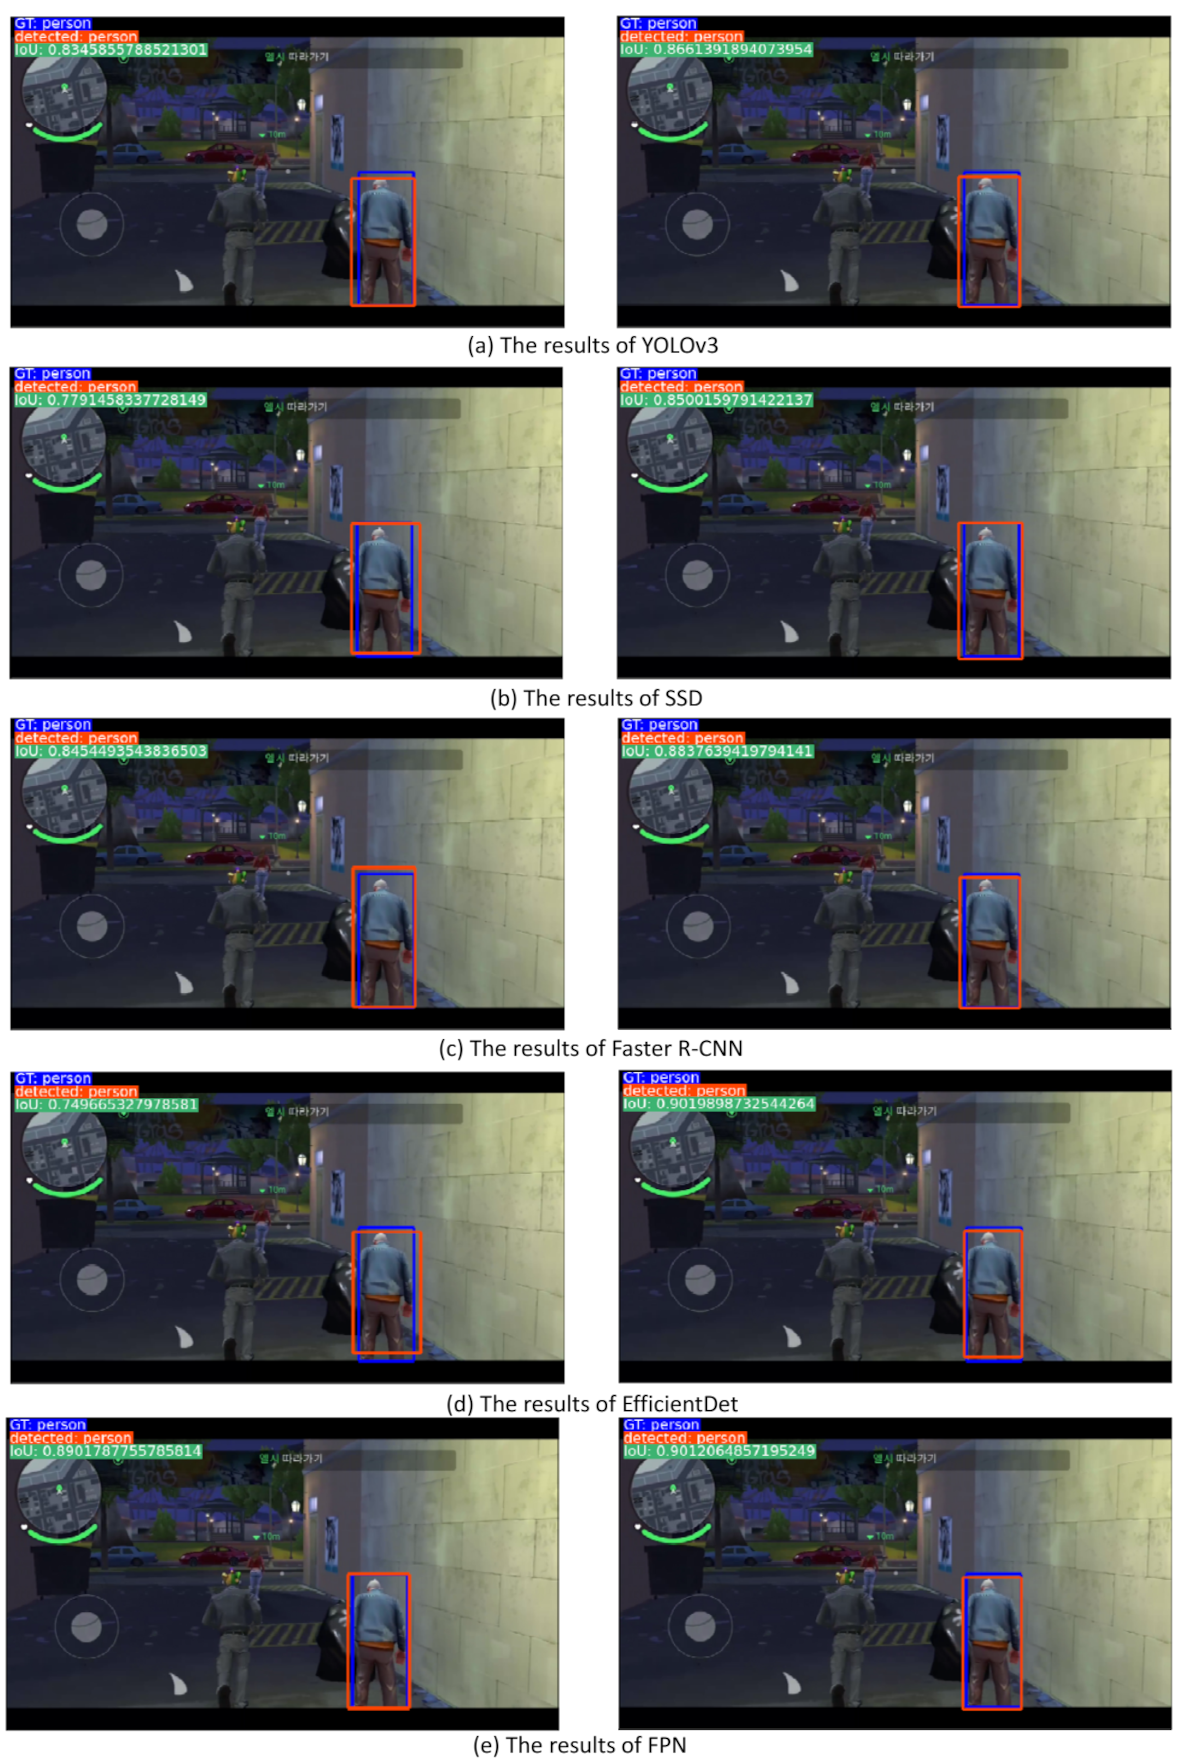
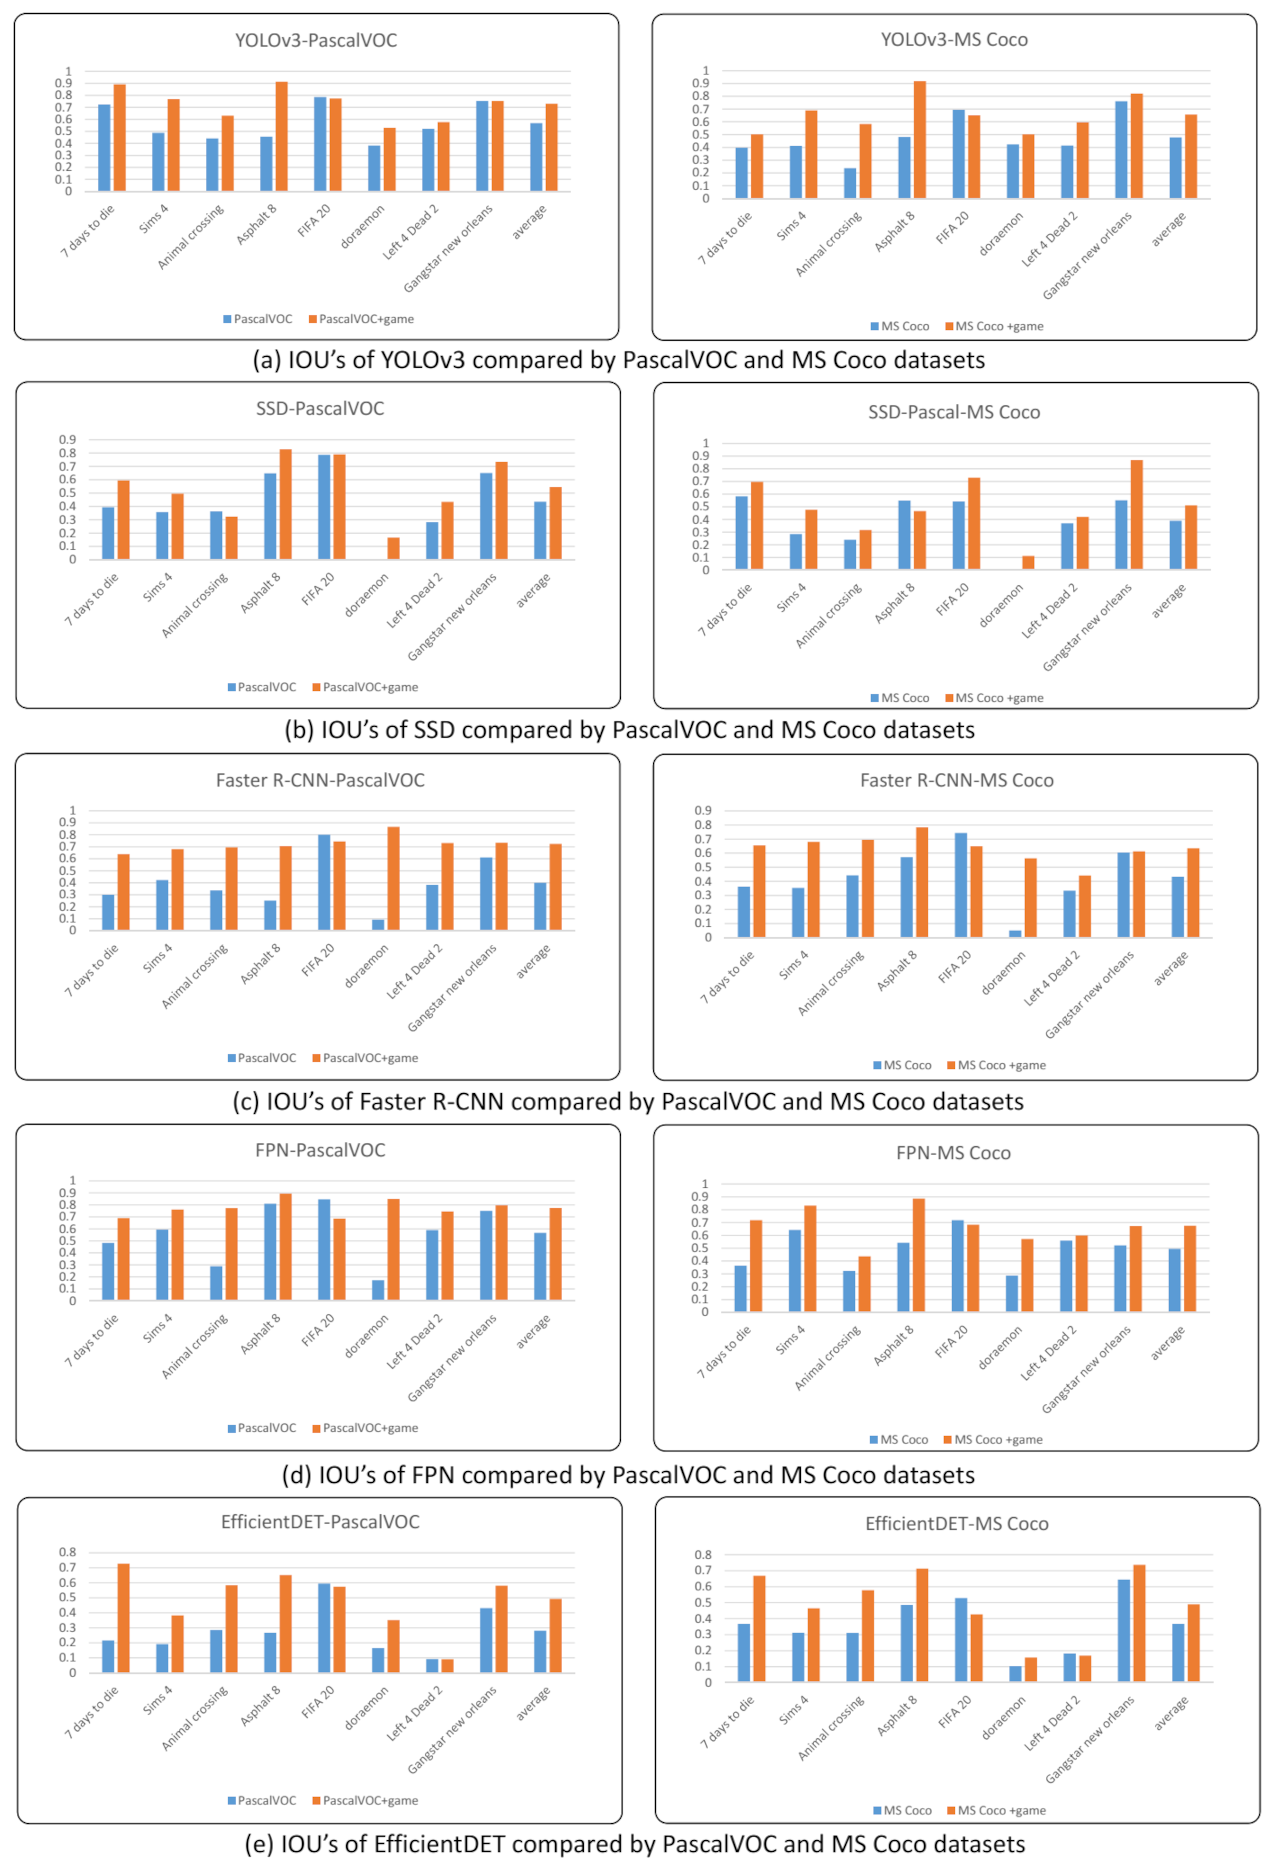
4.2.2. Measuring and Comparing Localization Performance Using IoU

In Table 4, we compare IoU values of the five algorithms between the Pascal VOC dataset and the Pascal VOC dataset with game scenes. We show the same comparison on the MS COCO dataset in Table 5. In Figure 4, we illustrate the comparisons presented in Table 4 and Table 5.

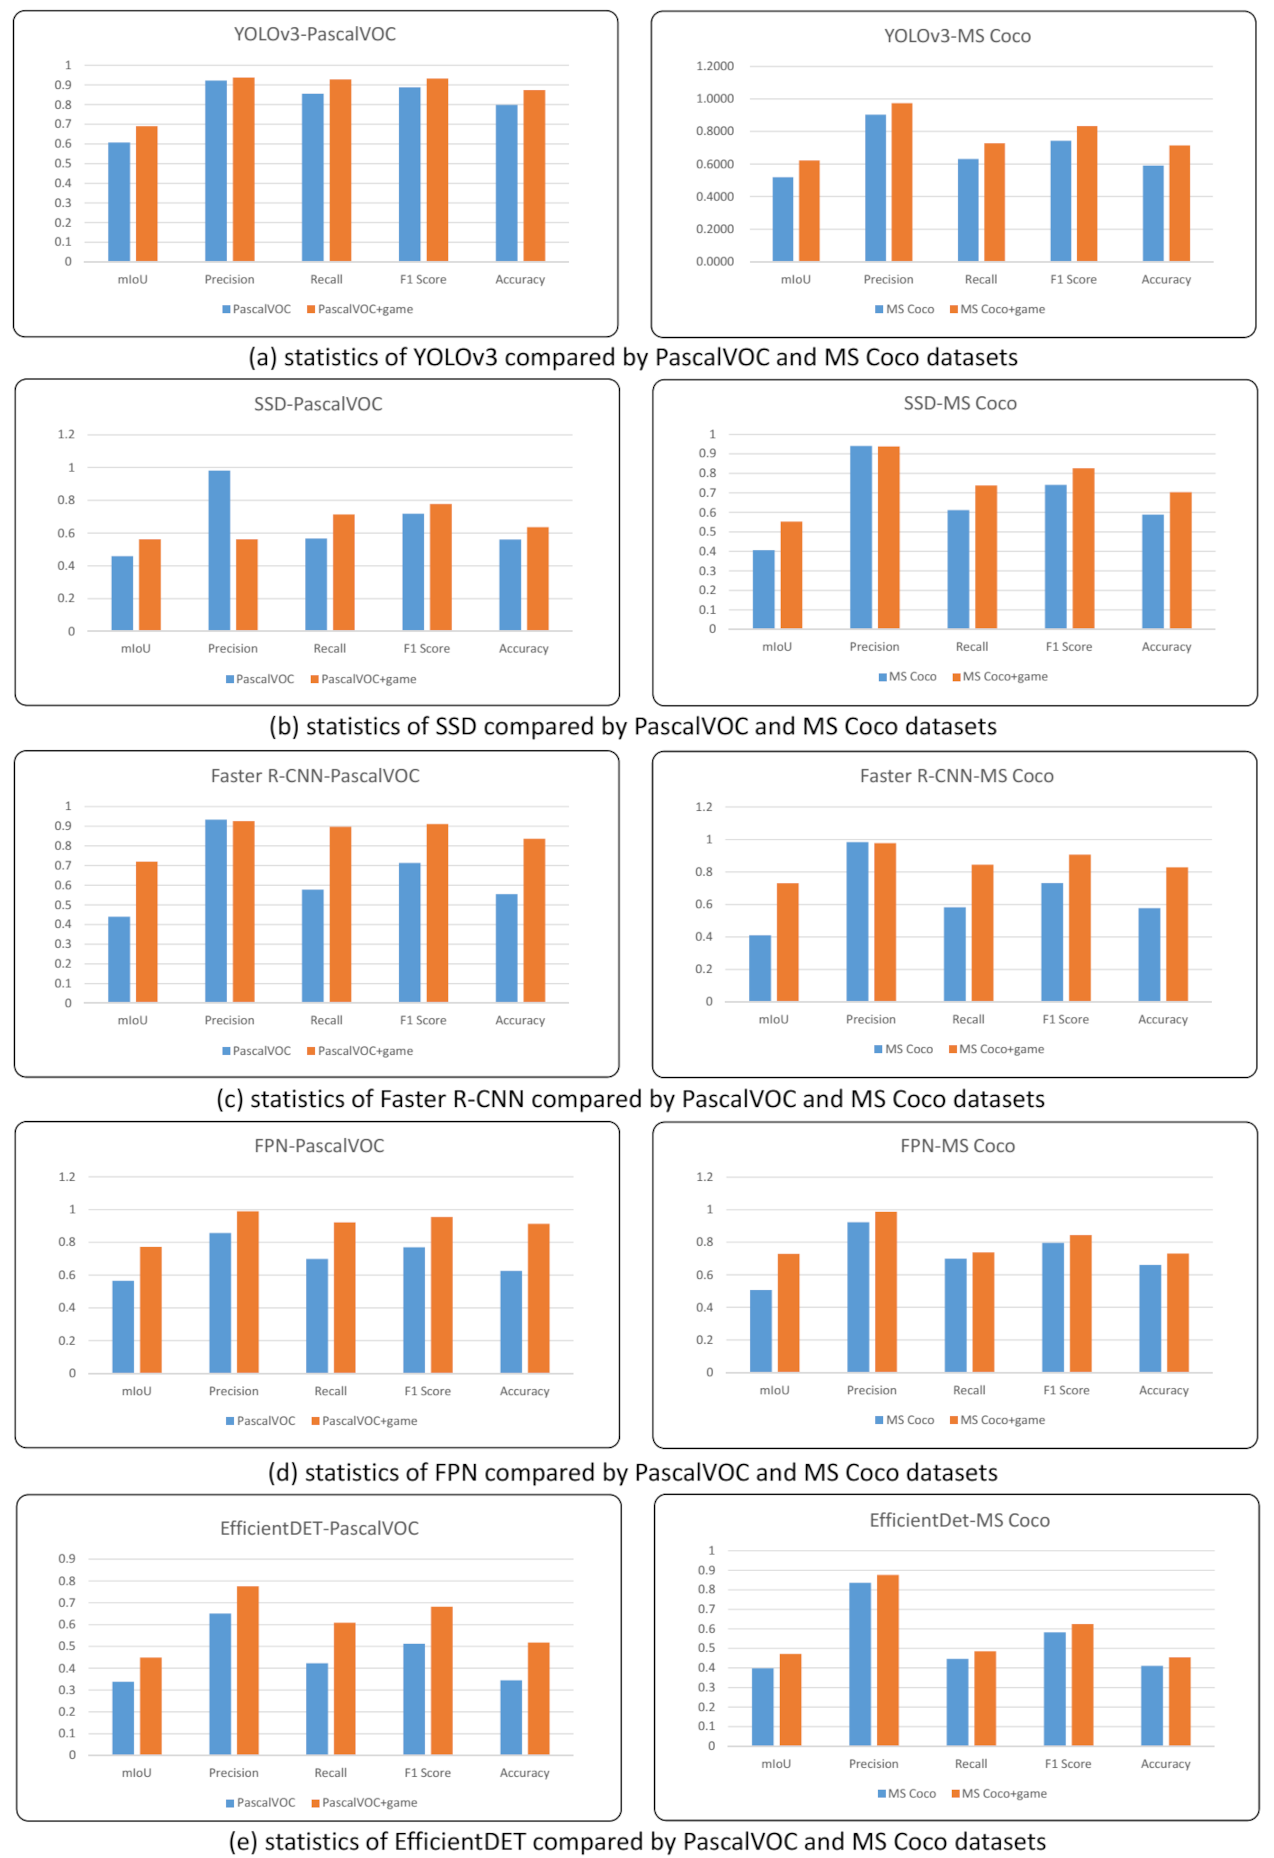
4.2.3. Measuring and Comparing Various Statistics

In Table 6 and Table 7, we estimate the average IoU, precision, recall, F1 score and accuracy of the five algorithms for the Pascal VOC dataset and the MS COCO dataset. In Figure 5, we illustrate the comparisons presented in Table 6 and Table 7.

5. Analysis

To prove our claim that the object detection algorithms retrained with game scenes show better performance than the object detection algorithms trained only with existing datasets such as Pascal VOC and MS COCO, we asked the following research questions ( R Q ).
RQ
Does our strategy to retrain existing object detection algorithms with game scenes improve mAP?
RQ
Does our strategy to retrain existing object detection algorithms with game scenes improve IoU?

5.1. Analysis of mAP Improvement

To answer R Q 1 , we compared and analyzed mAP values suggested in Table 2 and Table 3, which compare the mAP values of the object detection algorithms trained only with the existing datasets and retrained with game scenes. An overall observation reveals that the retrained object detection algorithms show better mAP than the pre-trained algorithms for 61 of all 80 cases. For further analysis, we performed a t-test and measured the effect size using Cohen’s d value.

5.1.1. t-Test

Table 8 compares the p values for the five algorithms trained by PascalVOC and retrained by PascalVOC + game scenes. From the p values, we found that the results from three of the five algorithms are distinguished for p < 0.05 . The results from EffficientDet are distinguished even for p < 0.01 .
Table 9 compares the p values for the five algorithms trained by MS COCO and retrained by MS COCO + game scenes. From the p values, we found that the results from four of the five algorithms are distinguished for p < 0.05 .
From these results, we show that seven cases from all ten cases exhibit significantly distinguishable results for p < 0.05 .

5.1.2. Cohen’s d

We also measured the effect size using Cohen’s d value for the mAP values and present the results in Table 10 and Table 11.
Since four Cohen’s d values in Table 10 are greater than 0.8, we can conclude that the effect size of retraining the algorithms using game scenes is great for four algorithms.
We also suggest the Cohen’s d values measured from the MS COCO dataset in Table 11, where four Cohen’s d values are greater than 0.8. We can also conclude that the effect size of retraining the algorithms using game scenes is great for four algorithms.

5.2. Analysis on the Improvement of IoU

To answer R Q 2 , we compared and analyzed IoU values suggested in Table 4 and Table 5 that compare the IoU values of the object detection algorithms trained only with existing datasets and retrained with game scenes. From these values, we found that the retrained object detection algorithms show better IoU for 68 of all 80 cases. For further analysis, we performed a t-test and measured the effect size using Cohen’s d value.

5.2.1. t-Test

Table 12 compares the p values for the five algorithms trained by PascalVOC and PascalVOC + game scenes. From the p-values, we found that the results from all the five algorithms are distinguished for p < 0.05 . Therefore, our strategy to retrain the algorithms with game scenes shows a significant improvement for localization.
Table 13 compares the p values for the five algorithms trained by MS COCO and MS COCO + game scenes. From the p-values, we found that the results from three algorithms are distinguished for p < 0.05 .
From these results, we have demonstrated that eight cases from all ten cases show a significant distinguishable results for p < 0.05 .

5.2.2. Cohen’s d

We also measured the effect size using Cohen’s d value for the IoU values and present the results in Table 14 and Table 15.
Since four Cohen’s d values in Table 10 are greater than 0.8, we can conclude that the effect size of retraining the algorithms using game scenes is great for four algorithms.
We also suggest the Cohen’s d values measured from the MS COCO dataset in Table 11, where three Cohen’s d values are greater than 0.8. We can also conclude that the effect size of retraining the algorithms using game scenes is great for three algorithms.
In summary, mAP is improved for 61 of 80 cases and IoU for 68 of 80 cases. When we performed a t-test on p < 0.05 , 7 of 10 cases showed a significantly unique improvement for mAP and 8 of 10 cases for IoU. When we measured the effect size, 8 of 10 cases showed a large effect size for mAP and 7 of 10 for IoU. Therefore, we can answer the research questions as the object detection algorithms retrained with game scenes show an improved mAP and IoU compared with the algorithms trained only with public datasets including PascalVOC and MS COCO.

5.3. Training with Augmented Dataset

An interesting approach for improving the performance of object detection algorithms on game scenes is to employ augmented images from datasets such as Pascal VOC or MS COCO. In several studies, intentionally transformed images are generated and employed to train pedestrian detection [35,36]. In our approach, stylization schemes are employed to render images in some game scene style. The stylization schemes we employ include flow-based image abstraction with coherent lines [37], color abstraction using bilateral filters [38] and deep cartoon-styled rendering [39].
In our approach, we augmented 3000 images by applying three stylization schemes [37,38,39] and retrained object detection algorithms. Some of the augmented images are suggested in Figure 6. In Table 16, we present a comparison between mAP values from pre-trained algorithms and mAP values from retraining with the augmented images. We tested this approach for the Pascal VOC dataset.
Among the eight games we used for the experiment, the scenes from D o r a e m o n show similar styles to the augmented images. It is interesting to note that this approach shows somewhat improved results on the scenes from D o r a e m o n . For other game scenes, we cannot recognize the improvement in the results. Figure 7 illustrates the comparison of three approaches: (i) trained with Pascal VOC, (ii) retrained with augmentation and (iii) retrained with game scenes.

6. Conclusions and Future Work

This study proved that the object detection algorithms retrained using game scenes show an improved performance compared with the algorithms trained only with the public datasets. Pascal VOC and MS COCO, two of the most frequently used datasets, were employed for our study. We tested our approach for five widely used object detection algorithms, YOLOv3, SSD, Faster R-CNN, FPN and EfficientDet, and for eight games from various genres. We estimated mAP between the pre-trained and retrained algorithms to show that object recognition accuracy is improved. We also estimated IoU to show that the accuracy of localizing objects is improved. We also tested data augmentation schemes that can be applied for our purpose, which shows very limited results according to the style of game scenes.
We have two further research directions. One direction is to establish a dataset about game scenes to improve the performance of existing object detection algorithms on game scenes. We aim to include various non-existent characters such as dragons, elves or orcs. Another direction is to modify the structure of the object detection algorithms to optimize them on game scenes.

Author Contributions

Conceptualization, M.J. and K.M.; methodology, H.Y.; software, M.J.; validation, H.Y. and K.M.; formal analysis, K.M.; investigation, M.J.; resources, M.J.; data curation, M.J.; writing—original draft preparation, H.Y.; writing—review and editing, K.M.; visualization, K.M.; supervision, K.M.; project administration, K.M.; funding acquisition, K.M. All authors have read and agreed to the published version of the manuscript.

Funding

This study was supported by Sangmyung Univ. Research Fund 2019.

Conflicts of Interest

The authors declare no conflict of interest.

Appendix A

In Appendix A, we present eight figures (Figure A1, Figure A2, Figure A3, Figure A4, Figure A5, Figure A6, Figure A7 and Figure A8) that sample the results for eight games by five important object detection algorithms: YOLOv3, SSD, Faster R-CNN, FPN and EfficientDet.
Figure A1. Comparison of the bounding box detection on game 7 Days to Die. The left column is the result from the models trained by PASCAL VOC and the right column is the result from the models trained by PASCAL VOC and game scenes.
Electronics 10 02527 g0a1aElectronics 10 02527 g0a1b
Figure A2. Comparison of the bounding box detection on game Sims. The left column is the result from the models trained by PASCAL VOC and the right column is the result from the models trained by PASCAL VOC and game scenes.
Electronics 10 02527 g0a2aElectronics 10 02527 g0a2b
Figure A3. Comparison of the bounding box detection on game Animal Crossing. The left column is the result from the models trained by PASCAL VOC and the right column is the result from the models trained by PASCAL VOC and game scenes.
Electronics 10 02527 g0a3
Figure A4. Comparison of the bounding box detection on game Asphalt 8. The left column is the result from the models trained by PASCAL VOC and the right column is the result from the models trained by PASCAL VOC and game scenes.
Electronics 10 02527 g0a4
Figure A5. Comparison of the bounding box detection on game FIFA20. The left column is the result from the models trained by PASCAL VOC and the right column is the result from the models trained by PASCAL VOC and game scenes.
Electronics 10 02527 g0a5
Figure A6. Comparison of the bounding box detection on game Doraemon. The left column is the result from the models trained by PASCAL VOC and the right column is the result from the models trained by PASCAL VOC and game scenes.
Electronics 10 02527 g0a6
Figure A7. Comparison of the bounding box detection on game Left4Dead2. The left column is the result from the models trained by PASCAL VOC and the right column is the result from the models trained by PASCAL VOC and game scenes.
Electronics 10 02527 g0a7
Figure A8. Comparison of the bounding box detection on game Gangstar, New Orleans. The left column is the result from the models trained by PASCAL VOC and the right column is the result from the models trained by PASCAL VOC and game scenes.
Electronics 10 02527 g0a8

References

  1. Redmon, J.; Farhardi, A. YOLOv3: An Incremental improvement. arXiv 2018, arXiv:1804.02767. [Google Scholar]
  2. Ren, S.; He, K.; Girshick, R.; Sun, J. Faster R-CNN: Towards Real-Time Object Detection with Region Proposal Networks. IEEE Trans. Pattern Anal. Mach. Intell. 2017, 39, 1137–1149. [Google Scholar] [CrossRef] [PubMed] [Green Version]
  3. Liu, W.; Anguelov, D.; Erhan, D.; Szegedy, C.; Reed, S.; Fu, C.-Y.; Berg, A. SSD: Single shot multiBox detector. In Proceedings of the ECCV 2016: 14th European Conference, Amsterdam, The Netherlands, 11–14 October 2016; pp. 21–37. [Google Scholar]
  4. Lin, T.-Y.; Dollar, P.; Girshick, R.; He, K.; Hariharan, B.; Belongie, S. Feature Pyramid Networks for Object Detection. In Proceedings of the 2017 IEEE Conference on Computer Vision and Pattern Recognition (CVPR 2017), Honolulu, HI, USA, 21–26 July 2017; pp. 2117–2125. [Google Scholar]
  5. Tan, M.; Pang, R.; Le, Q.V. EfficientDet: Scalable and Efficient Object Detection. In Proceedings of the 2020 Conference on Computer Vision and Pattern Recognition, Seattle, WA, USA, 13–19 June 2020; pp. 10778–10787. [Google Scholar]
  6. Everingham, M.; van Gool, L.; Williams, C.; Winn, J.; Zisserman, A. The Pascal Visual Object Classes Challenge. Int. J. Comput. Vis. 2010, 88, 303–338. [Google Scholar] [CrossRef] [Green Version]
  7. Everingham, M.; Eslami, S.A.; van Gool, L.; Williams, C.; Winn, J.; Zisserman, A. The Pascal Visual Object Chasses Challenges: A Retrospective. Int. J. Comput. Vis. 2015, 111, 98–136. [Google Scholar] [CrossRef]
  8. Lin, T.-Y.; Maire, M.; Belongie, S.; Hays, J.; Perona, P.; Ramanan, D.; Dollar, P.; Zitnick, C. Microsoft COCO: Common Objects in Context. In Proceedings of the ECCV 2014: 13th European Conference, Zurich, Switzerland, 6–12 September 2014; pp. 740–755. [Google Scholar]
  9. Dalal, N.; Triggs, B. Histograms of oriented gradients for human detection. In Proceedings of the 2005 IEEE Computer Society Conference on Computer Vision and Pattern Recognition (CVPR 2005), San Diego, CA, USA, 20–26 June 2005; pp. 886–893. [Google Scholar]
  10. Redmon, J.; Divvala, S.; Girshick, R.; Farhadi, A. You Only Look Once: Unified, Real-Time Object Detection. In Proceedings of the 2016 IEEE Conference on Computer Vision and Pattern Recognition (CVPR 2016), Las Vegas, NV, USA, 27–30 June 2016; pp. 779–788. [Google Scholar]
  11. Redmon, J.; Farhadi, A. YOLO9000: Better, Faster, Stronger. In Proceedings of the 2017 IEEE Conference on Computer Vision and Pattern Recognition (CVPR 2017), Honolulu, HI, USA, 21–26 July 2017; pp. 7263–7271. [Google Scholar]
  12. Girshick, R.; Donahue, J.; Darrell, T.; Malik, J. Rich feature hierarchies for accurate object detection and semantic segmentation. In Proceedings of the 2014 IEEE Conference on Computer Vision and Pattern Recognition (CVPR 2014), Columbus, OH, USA, 23–28 June 2014; pp. 580–587. [Google Scholar]
  13. Girschick, R. Fast R-CNN. In Proceedings of the 2015 IEEE International Conference on Computer Vision (ICCV 2015), Santiago, Chile, 7–13 December 2015; pp. 1440–1448. [Google Scholar]
  14. He, K.; Zhang, X.; Ren, S.; Sun, J. Spatial Pyramid Pooling in Deep Convolutional Networks for Visual Recognition. IEEE Trans. Pattern Anal. Mach. Intell. 2015, 37, 1904–1916. [Google Scholar] [CrossRef] [PubMed] [Green Version]
  15. Utsumi, O.; Miura, K.; Ide, I.; Sakai, S.; Tanaka, H. An object detection method for describing soccer games from video. In Proceedings of the IEEE International Conference on Multimedia and Expo, Lausanne, Switzerland, 26–29 August 2002; pp. 45–48. [Google Scholar]
  16. Chen, Z.; Yi, D. The Game Imitation: Deep Supervised Convolutional Networks for Quick Video Game AI. arXiv 2017, arXiv:1702.05663. [Google Scholar]
  17. Sundareson, P. Parallel image pre-processing for in-game object classification. In Proceedings of the IEEE International Conference on Consumer Electronics-Asia (ICCE-Asia), Bengaluru, India, 5–7 October 2017; pp. 115–116. [Google Scholar]
  18. Venkatesh, A. Object Tracking in Games Using Convolutional Neutral Networks. Master’s Thesis, California Polytechnic State University, San Luis Obispo, CA, USA, 2018. [Google Scholar]
  19. Liu, S.; Zheng, B.; Zhao, Y.; Guo, B. Game robot’s vision based on faster R-CNN. In Proceedings of the Chinese Automation Congress (CAC) 2018, Xi’an, China, 30 November–2 December 2018; pp. 2472–2476. [Google Scholar]
  20. Chen, Y.; Huang, W.; He, S.; Sun, Y. A Long-time multi-object tracking method for football game analysis. In Proceedings of the Photonics & Electromagnetics Research Symposium-Fall 2019, Xiamen, China, 17–20 December 2019; pp. 440–442. [Google Scholar]
  21. Tolmacheva, A.; Ogurcov, D.; Dorrer, M. Puck tracking system for aerohockey game with YOLO2. J. Phys. Conf. Ser. 2019, 1399. [Google Scholar] [CrossRef] [Green Version]
  22. Yao, W.; Sun, Z.; Chen, X. Understanding video content: Efficient hero detection and recognition for the game Honor of Kings. arXiv 2019, arXiv:1907.07854. [Google Scholar]
  23. Spijkerman, R.; van der Haar, D. Video footage highlight detection in Formula 1 through vehicle recognition with faster R-CNN trained on game footage. In Proceedings of the International Conference on Computer Vision and Graphics 2020, Warsaw, Poland, 14–16 September 2020; pp. 176–187. [Google Scholar]
  24. Kim, K.; Kim, S.; Shchur, D. A UAS-based work zone safety monitoring system by integrating internal traffic control plan (ITCP) and automated object detection in game engine environment. Autom. Constr. 2021, 128. [Google Scholar] [CrossRef]
  25. YOLO in Game Object Detection. 2019. Available online: https://forum.unity.com/threads/yolo-in-game-object-detection-deep-learning.643240/ (accessed on 10 March 2019).
  26. List of Video Game Genres. Available online: https://en.wikipedia.org/wiki/List_of_video_game_genres (accessed on 17 September 2021).
  27. 7 Days to Die. Available online: https://7daystodie.com/ (accessed on 5 August 2013).
  28. Left 4 Dead 2. Available online: https://www.l4d.com/blog/ (accessed on 17 November 2009).
  29. Gangstar New Orleans. Available online: https://www.gameloft.com/en/game/gangstar-new-orleans/ (accessed on 7 February 2017).
  30. Sims4. Available online: https://www.ea.com/games/the-sims/the-sims-4 (accessed on 2 September 2014).
  31. Animal Crossing. Available online: https://animal-crossing.com/ (accessed on 14 April 2001).
  32. Doraemon. Available online: https://store.steampowered.com/app/965230/DORAEMON_STORY_OF_SEASONS/ (accessed on 13 June 2019).
  33. Asphalt 8. Available online: https://www.gameloft.com/asphalt8/ (accessed on 22 August 2013).
  34. FIFA 20. Available online: https://www.ea.com/games/fifa/fifa-20 (accessed on 24 September 2019).
  35. Huang, S.; Ramanan, D. Expecting the Unexpected: Training Detectors for Unusual Pedestrians with Adversarial Imposters. In Proceedings of the 2017 IEEE Conference on Computer Vision and Pattern Recognition (CVPR 2017), Honolulu, HI, USA, 21–26 July 2017; pp. 2243–2252. [Google Scholar]
  36. Chan, Z.; Ouyang, W.; Liu, T.; Tao, D. A Shape Transformation-based Dataset Augmentation Framework for Pedestrian Detection. Int. J. Comput. Vis. 2021, 129, 1121–1138. [Google Scholar] [CrossRef]
  37. Kang, H.; Lee, S.; Chui, C. Flow-based image abstraction. IEEE Trans. Vis. Comp. Graph. 2009, 15, 62–76. [Google Scholar] [CrossRef] [PubMed]
  38. Winnemoller, H.; Olsen, S.; Gooch, B. Real-time video abstraction. ACM Trans. Graph. 2006, 25, 1221–1226. [Google Scholar] [CrossRef]
  39. Kim, J.; Kim, M.; Kang, H.; Lee, K. U-gat-it: Unsupervised generative attentional networks with adaptive layer-instance normalization for image-to-image translation. In Proceedings of the 8th International Conference on Learning Representations, Addis Ababa, Ethiopia, 26–30 April 2020. [Google Scholar]
Figure 1. The architectures of the deep object detection algorithms used in this study.
Electronics 10 02527 g001
Figure 2. Eight games we selected for our study.
Electronics 10 02527 g002
Figure 3. mAPs from five object detection algorithms trained by different datasets are compared. In the left column, blue bars denote mAPs from those models trained using PascalVOC only and red bars are for PascalVOC + game scenes. In the right column, blue bars denote mAPs from those models trained using MS COCO only and red bars are for MS COCO + game scenes.
Electronics 10 02527 g003
Figure 4. IoUs from five object detection algorithms trained by different datasets are compared. In the left column, blue bars denote IoUs from those models trained using PascalVOC only and red bars are for PascalVOC + game scenes. In the right column, blue bars denote IoUs from those models trained using MS COCO only and red bars are for MS COCO + game scenes.
Electronics 10 02527 g004
Figure 5. Mean IoU, precision, recall, F1 score and accuracy are compared between two different datasets. In the left column, blue bars denote the values from those models trained using PascalVOC only and red bars are for PascalVOC + game scenes. In the right column, blue bars denote the values from those models trained using MS COCO only and red bars are for MS COCO + game scenes.
Electronics 10 02527 g005
Figure 6. The augmented images from Pascal VOC: (a) is the sampled images from Pascal VOC dastaset, (b) is produced by flow-based image abstraction with coherent lines [37], (c) is produced by color abstraction using a bilateral filter [38] and (d) is produced by deep cartoon-styled rendering [39].
Electronics 10 02527 g006
Figure 7. Comparison of three approaches: training only with Pascal VOC, retrained with augmented images and retrained with game scenes. The red rectangle shows comparison of mAPs on scenes from D o r a e m o n , which shows greatest improvement. The blue rectangle shows comparison of average mAPs.
Electronics 10 02527 g007
Table 1. Time required for retraining the algorithms (hrs).
AlgorithmYOLOv3  [1]Faster R-CNN [2]SSD [3]FPN [4]EfficientDet  [5]
Time required for retraining the algorithms9.58.19.19.48.5
Table 2. The comparison of mAPs for each game. We compared five object detection algorithms pre-trained by PascalVOC and retrained by PascalVOC with game scenes. Note that PascalVOC is abbreviated as Pascal in the table.
AlgorithmYOLOv3SSDFaster R-CNNFPNEfficientDet
DatasetPascalPascal
+
Game
PascalPascal
+
Game
PascalPascal
+
Game
PascalPascal
+
Game
PascalPascal
+
Game
7 Days to Die1.01.00.41670.66670.50.47920.59400.73760.41670.75
Sims40.75560.91820.51180.74520.38850.49730.750.80.50920.8878
Animal Crossing0.83890.75670.650.66670.48330.61670.46360.78820.55240.85
Asphalt80.3751.00.751.00.18750.7250.7510.3750.875
FIFA 201.01.00.87250.78570.64280.71430.66940.751.01.0
Doraemon0.52220.87780.20560.570.31670.46670.13330.8750.16670.9444
Left 4 Dead 20.94440.97240.19440.670.0560.2150.50.8750.22221.0
Gangstar1.01.00.58330.95830.66670.4431110.83330.9167
Average0.80450.94060.52300.75780.40510.49730.60760.83760.50920.9029
Table 3. The comparison of mAPs for each game. We compared five object detection algorithms pre-trained by MS COCO and retrained by MS COCO with game scenes. Note that MS COCO is abbreviated as MS in the table.
AlgorithmYOLOv3SSDFaster R-CNNFPNEfficientDet
DatasetMSMS
+
Game
MSMS
+
Game
MSMS
+
Game
MSMS
+
Game
MSMS
+
Game
7 Days to Die0.880.90.7510.74570.80.50.80.47920.9
Sims40.35110.79840.450.59610.56430.7250.66970.83610.751
Animal Crossing0.67310.80300.66940.75760.46360.6390.43370.83940.57580.875
Asphalt80.778110.7510.69640.8750.67860.8750.71431
FIFA 200.87120.92860.74810.85710.7857110.85711
Doraemon0.38710.720200.55230.27620.5260.13330.66670.40.8
Left 4 Dead 20.61530.92180.58330.8140.28570.44640.87510.8750.875
Gangstar0.891410.44310.95830.91350.96890.5790.87510.8571
Average0.68090.88400.549230.83480.60030.72080.60870.86150.70640.9134
Table 4. The comparison of IoUs for each game. We compared five object detection algorithms pre-trained by PascalVOC and retrained by PascalVOC with game scenes. Note that PascalVOC is abbreviated as Pascal in the table.
AlgorithmYOLOv3SSDFaster R-CNNFPNEfficientDet
DatasetPascalPascal
+
Game
PascalPascal
+
Game
PascalPascal
+
Game
PascalPascal
+
Game
PascalPascal
+
Game
7 Days to Die0.72370.78890.39380.69440.30100.63890.48310.68910.38870.5566
Sims40.51480.63730.35760.59550.42340.68050.59340.76050.19110.4830
Animal Crossing0.50010.68100.36320.35450.33690.69490.28910.77320.39850.5974
Asphalt80.55600.79410.64820.82890.25160.70570.80990.89460.35060.6062
FIFA 200.78570.77410.78700.85000.80050.74450.84720.68600.59500.5752
Doraemon0.38180.63030.16640.62310.09270.86560.17190.85070.16440.4516
Left 4 Dead 20.52140.67690.28280.63450.38250.73080.58940.74540.09170.0905
Gangstar0.75360.80330.65030.73520.61130.73340.75030.79660.43080.4751
Average0.56890.72990.43540.54620.39990.72430.28030.49350.56680.7745
Table 5. The comparison of IoUs for each game. We compared five object detection algorithms pre-trained by MS COCO and retrained by MS COCO with game scenes. Note that MS COCO is abbreviated as MS in the table.
AlgorithmYOLOv3SSDFaster R-CNNFPNEfficientDet
DatasetMSMS
+
Game
MSMS
+
Game
MSMS
+
Game
MSMS
+
Game
MSMS
+
Game
7 Days to Die0.39720.50240.58230.69640.36240.65510.36720.66910.36430.7183
Sims40.41290.68910.28520.47670.35310.68050.31140.46480.64190.8419
Animal Crossing0.23820.58300.24030.31740.44270.69490.31090.57890.32340.4371
Asphalt80.48170.91840.54950.46650.57170.78320.48580.71330.54280.8873
FIFA 200.69420.65160.54240.73040.74350.64860.52990.42620.71770.6830
Doraemon0.42420.502700.11320.05130.56320.10310.15740.28730.5719
Left 4 Dead 20.41440.59560.37060.42090.33370.44080.18240.16840.55880.5985
Gangstar0.76110.82150.55150.86940.60430.61250.64480.73740.52240.6730
Average0.47790.65800.39020.51140.43280.63490.36690.48940.49480.6751
Table 6. The statistics. We compared the algorithms trained by PascalVOC and retrained by PascalVOC with game scenes for five object detection algorithms. Note that PascalVOC is abbreviated as Pascal in the table.
AlgorithmYOLOv3SSDFaster R-CNNFPNEfficientDet
DatasetPascalPascal
+
Game
PascalPascal
+
Game
PascalPascal
+
Game
PascalPascal
+
Game
PascalPascal
+
Game
average IoU0.56890.72990.43540.54620.39990.72430.28030.49340.32630.4795
precision0.92220.93750.98210.56270.93330.92550.85710.98960.65080.7763
recall0.85570.92780.56700.71430.57730.89690.69900.92230.42270.6082
F1 score0.88770.93260.71900.77780.71340.91100.77010.95480.51250.6821
accuracy0.79810.87380.56120.63640.55450.83650.62610.91350.34450.5175
Table 7. The statistics. We compared the algorithms trained by MS COCO and retrained by MS COCO with game scenes for five object detection algorithms. Note that MS COCO is abbreviated as MS in the table.
AlgorithmYOLOv3SSDFaster R-CNNFPNEfficientDet
DatasetMSMS
+
Game
MSMS
+
Game
MSMS
+
Game
MSMS
+
Game
MSMS
+
Game
average IoU0.47790.65800.39020.51140.43280.63490.36690.48940.49480.6751
precision0.90280.97400.94030.93830.98360.97750.92310.98700.83640.8772
recall0.63110.72820.61170.73790.58250.84470.69900.73790.44660.4854
F1 score0.74290.83330.74120.82610.73170.90620.79560.84440.58230.6250
accuracy0.59090.71430.58880.70370.57690.82860.66060.73080.41070.4545
Table 8. p values for the mAPs from five object detection algorithms. We compared the algorithms trained by PascalVOC and retrained by PascalVOC with game scenes. Note that PascalVOC is abbreviated as Pascal in the table.
AlgorithmYOLOv3SSDFaster R-CNNFPNEfficientDet
DatasetPascalPascal
+
Game
PascalPascal
+
Game
PascalPascal
+
Game
PascalPascal
+
Game
PascalPascal
+
Game
average mAP0.80450.91820.51180.74520.38850.49730.60760.83760.50920.8878
std. dev.0.23960.10570.24570.15620.21960.21140.25520.10910.28640.0959
p0.24760.03970.33010.04370.0063
p < 0.05 NotDistinguishedNotDistinguishedDistinguished
p < 0.01 NotNotNotNotDistinguished
Table 9. p values for the mAPs from five object detection algorithms. We compared the algorithms trained by MS COCO and retrained by MS COCO with game scenes. Note that MS COCO is abbreviated as MS in the table.
AlgorithmYOLOv3SSDFaster R-CNNFPNEfficientDet
DatasetMSMS
+
Game
MSMS
+
Game
MSMS
+
Game
MSMS
+
Game
MSMS
+
Game
average mAP0.68090.88400.54920.83480.60030.72080.70640.91340.60870.8615
std. dev.0.21680.10090.25590.18530.24450.17560.20760.07710.26780.1079
p0.03720.02280.27680.03520.0268
p < 0.05 DistinguishedDistinguishedNotDistinguishedDistinguished
p < 0.01 NotNotNotNotNot
Table 10. Cohen’s d values for mAPs from five object detection algorithms. We compared the algorithms trained by PascalVOC and retrained by PascalVOC with game scenes. Note that PascalVOC is abbreviated as Pascal in the table.
AlgorithmYOLOv3SSDFaster R-CNNFPNEfficientDet
DatasetPascalPascal
+
Game
PascalPascal
+
Game
PascalPascal
+
Game
PascalPascal
+
Game
PascalPascal
+
Game
average mAP0.80450.91820.51180.74520.38850.49730.60760.83760.50920.8878
std. dev.0.18830.23260.27430.21570.2237
Cohen’s d0.86811.60312.50731.02780.7136
Effect sizeLargeLargeLargeLarge>medium
Table 11. Cohen’s d values for mAPs from five object detection algorithms. We compared the algorithms trained by MS COCO and retrained by MS COCO with game scenes. Note that MS COCO is abbreviated as MS in the table.
AlgorithmYOLOv3SSDFaster R-CNNFPNEfficientDet
DatasetMSMS
+
Game
MSMS
+
Game
MSMS
+
Game
MSMS
+
Game
MSMS
+
Game
average mAP0.68090.88400.54920.83480.60030.72080.70640.91340.60870.8615
std. dev.0.19410.26140.21480.18530.2365
Cohen’s d1.04611.09241.06891.11710.5606
Effect sizeLargeLargeLargeLarge>medium
Table 12. p values for the IoUs from four object detection algorithms. We compared the algorithms trained by PascalVOC and retrained by PascalVOC with game scenes. Note that PascalVOC is abbreviated as Pascal in the table.
AlgorithmYOLOv3SSDFaster R-CNNFPNEfficientDet
DatasetPascalPascal
+
Game
PascalPascal
+
Game
PascalPascal
+
Game
PascalPascal
+
Game
PascalPascal
+
Game
average IoU0.56890.72990.43560.54620.39990.72430.56680.77450.28030.4935
std. dev.0.15940.13980.25090.23480.21910.06650.24280.07260.16160.2064
p0.04970.03770.00390.04900.0373
p < 0.05 DistinguishedDistinguishedDistinguishedDistinguishedDistinguished
p < 0.01 NotNotDistinguishedNotNot
Table 13. p values for the IoUs from four object detection algorithms. We compared the algorithms trained by MS COCO and retrained by MS COCO with game scenes. Note that MS COCO is abbreviated as MS in the table.
AlgorithmYOLOv3SSDFaster R-CNNFPNEfficientDet
DatasetMSMS
+
Game
MSMS
+
Game
MSMS
+
Game
MSMS
+
Game
MSMS
+
Game
average IoU0.47790.65800.39020.51140.43290.64390.36690.48940.49480.6751
std. dev.0.16990.14800.20620.24430.21110.10110.18040.22980.15490.1438
p0.04030.30210.03480.25540.0301
p < 0.05 DistinguishedNotDistinguishedNotDistinguished
p < 0.01 NotNotNotNotNot
Table 14. Cohen’s d values for IoUs from four object detection algorithms. We compared the algorithms trained by PascalVOC and retrained by PascalVOC with game scenes. Note that PascalVOC is abbreviated as Pascal in the table.
AlgorithmYOLOv3SSDFaster R-CNNFPNEfficientDet
DatasetPascalPascal
+
Game
PascalPascal
+
Game
PascalPascal
+
Game
PascalPascal
+
Game
PascalPascal
+
Game
average IoU0.56890.72990.43560.54620.39990.72430.56680.77450.28030.4935
std. dev.0.16700.24160.22910.20370.2102
Cohen’s d0.96410.45861.41531.0200.0142
Effect sizeLarge>smallLargeLargeLarge
Table 15. Cohen’s d values for IoUs from four object detection algorithms. We compared the algorithms trained by MS COCO and retrained by MS COCO with game scenes. Note that MS COCO is abbreviated as MS in the table.
AlgorithmYOLOv3SSDFaster R-CNNFPNEfficientDet
DatasetMSMS
+
Game
MSMS
+
Game
MSMS
+
Game
MSMS
+
Game
MSMS
+
Game
average IoU0.47790.65800.39020.51140.43290.64390.36690.48940.49480.6751
std. dev.0.17980.22720.19090.17180.2094
Cohen’s d1.00110.53321.05811.04940.5849
Effect sizeLarge>mediumLarge>mediumLarge
Table 16. The comparison of mAPs of the object detection algorithms between the VOC dataset trained with Pascal and retrained using augmented images.
AlgorithmYOLOv3SSDFaster R-CNNFPNEfficientDet
DatasetPascalPascal
+
Augment
PascalPascal
+
Augment
PascalPascal
+
Augment
PascalPascal
+
Augment
PascalPascal
+
Augment
7 Days to Die1.01.00.41670.37050.50.54130.59400.54150.41670.5035
Sims40.75560.81250.51180.49150.38850.41240.750.81250.50920.4501
Animal Crossing0.83890.87350.650.64130.48330.33140.46360.53150.55240.5035
Asphalt80.3750.42140.750.82150.18750.36410.750.81250.3750.5102
FIFA 201.00.89210.87250.86130.64280.67840.66940.56031.01.0
Doraemon0.52220.67120.20560.45100.31670.51240.13330.31250.16670.4315
Left 4 Dead 20.94440.92140.19440.3150.0560.21050.50.61240.22220.3415
Gangstar1.00.94160.58330.61350.66670.464110.93150.83330.8145
Average0.80450.81680.52300.57070.40510.42880.60760.63940.50920.5693
Publisher’s Note: MDPI stays neutral with regard to jurisdictional claims in published maps and institutional affiliations.

