Article

RCVC: RSU-Aided Cluster-Based Vehicular Clouds Architecture for Urban Areas

by
Mohamed Ben bezziane
1,*,
Ahmed Korichi
1,
Chaker Abdelaziz Kerrache
2 and
Mohamed el Amine Fekair
1
1
Laboratoire d’INtelligence Artificielle et des Technologies de l’Information, Department of Computer science, Faculty of New Technologies of Information and Communication, University of Kasdi Merbah, Ouargla BP 511 30000, Algeria
2
Laboratoire d’Informatique et de Mathématiques, University of Laghouat, Laghouat BP 37G 03000, Algeria
*
Author to whom correspondence should be addressed.
Electronics 2021, 10(2), 193; https://doi.org/10.3390/electronics10020193
Submission received: 15 December 2020 / Revised: 11 January 2021 / Accepted: 13 January 2021 / Published: 15 January 2021
(This article belongs to the Section Electrical and Autonomous Vehicles)

Abstract

:
As a promising topic of research, Vehicular Cloud (VC) incorporates cloud computing and ad-hoc vehicular network (VANET). In VC, supplier vehicles provide their services to consumer vehicles in real-time. These services have a significant impact on the applications of internet access, storage and data. Due to the high-speed mobility of vehicles, users in consumer vehicles need a mechanism to discover services in their vicinity. Besides this, quality of service varies from one supplier vehicle to another; thus, consumer vehicles attempt to pick out the most appropriate services. In this paper, we propose a novel protocol named RSU-aided Cluster-based Vehicular Clouds protocol (RCVC), which constructs the VC using the Road Side Unit (RSU) directory and Cluster Head (CH) directory to make the resources of supplier vehicles more visible. While clusters of vehicles that move on the same road form a mobile cloud, the remaining vehicles form a different cloud on the road side unit. Furthermore, the consumption operation is achieved via the service selection method, which is managed by the CHs and RSUs based on a mathematical model to select the best services. Simulation results prove the effectiveness of our protocol in terms of service discovery and end-to-end delay, where we achieved service discovery and end-to-end delay of 3 × 10⁻³ s and 13 × 10−2 s, respectively. Moreover, we carried out an experimental comparison, revealing that the proposed method outperformed several states of the art protocols.

1. Introduction

In recent times, remarkable advances have been achieved in the field of vehicular Ad Hoc, which help enhancing driving by increasing safety and providing commercial services [1]. All exertions aim to increase the use of Intelligent Transportation Systems (ITS).
Due to their restricted range and motion (direction and speed), VANETs are considered as a specific type of Mobile Ad hoc Network (MANET) with a particular mobility. In VANETs, vehicles move according to an organized pattern that is called a mobility model, which is based on predefined roads, buildings and junctions, etc. [2]. Two types of VANET nodes can be distinguished; these types are mobile nodes such as vehicles, and fixed nodes known as Road Side Units (RSUs) deployed at critical locations on roadsides to provide various services including internet access, and can play the role on an Intermediate Trusted Authority (ITA). Vehicles and RSUs transmit messages between the source and destination nodes using two types of wireless multi-hop transmission, which are Inter-Vehicle Communication (IVC) and Vehicle-to-Roadside Communication (VRC).
It is worth mentioning the efforts of the automotive industry that developed the Dedicated Short-Range Communication (DSRC) technology, which enables high-speed direct communication between vehicles and the surrounding infrastructure. DSRC is an IEEE 802.11p-based wireless communication amendment for Wireless Access in Vehicular Environments (WAVE) [3,4]. The IEEE 1609.2, 1609.3 and 1609.4 standards are structured for security, network services and multi-channel operation, respectively [5]. These results are advantageous to drivers, passengers and transport authorities such as freeway management, crash prevention and safety, road weather, collision avoidance and driver assistance [6].
Cloud computing is a paradigm for hosting and delivering services [7]; its providers sell computing resources in the form of data centers, servers, data storage, networks and applications through the Internet. Cloud computing is flexible, scalable and measurable to customers; they pay for what they use. At the advent of edge computing, mobile cloud computing (MCC) is a promising technology that can comparatively resolve the inherent problems that appeared with the increasing number of connected devices in classical cloud computing [8]. Subsequently, MCC involves the emergence of VC [9] in which certain vehicles play the role of suppliers, while the others act as consumers.
Note that a provider may offer its resources to neighboring vehicles according to three fundamental types of services [10] with their attributes such as:
(1).
Network as a Service (NaaS): it means to offer the extra bandwidth in terms of the Internet to others for a certain fee.
(2).
Storage as a Service (SaaS): it means to offer storage for a certain fee.
(3).
Data as a Service (DaaS): it means offering the data like books, city maps and video files for a certain fee as well.
Currently, intelligent vehicles in smart cities are equipped with some devices, such as wireless device On-Board Unit (OBU), radar, camera, localization systems, storage unit and unlimited energy source. Similarly, RSUs offer high-speed internet access by wireless transmission technologies (LTE, WiMAX and 5G) [11]. Yet, the systems have been suffering from delay, intermittent connections and packet loss due to the high-speed mobility of vehicles and the overlapping of radio frequency in crowded traffic.
In this paper, we propose a new protocol termed RSU-aided Cluster-based Vehicular Clouds (RCVC) architecture for urban areas. Our RCVC enables RSU and CH to act as repositories aiming to help consumer vehicles (CV) to access and find resources that are offered by supplier vehicles (SV) on VC in an urban environment. Using clustering, we implemented RCVC to form the first vehicular cloud for some reasons, which are: first, to make benefit from vehicles that are travelling on the same routes, and which can transmit their messages closely; second, to make, in the cluster, the management of the supply and consumption easy. However, in parallel, RCVC can construct a vehicular cloud at the RSU levels that are considered to be connected through fixed communication links. According to the literature review, the present work, concerning the definition of a protocol that allows forming two kinds of VC, seems to be an original contribution to the domain of service consumption in vehicular cloud.
The rest of the paper is organized as follows: Section 2 is about the related work. Section 3 is devoted to the technical details of the suggested protocol. Section 4 deals with the simulation that validates the proposal and discusses the reached results. Finally, Section 5 concludes the paper.

2. Related Work

Several research studies have been carried out in the context of VCs. While some researchers proposed a set of protocols, the others had introduced new vehicular cloud architectures. We seize the opportunity to cite some works that have been done in this direction. These works concern all protocols and approaches that allow some vehicles to offer their resources as services to others that request these services for consumption.
Mershad et al. [12] implemented a disCoveRing and cOnsuming services WithiN vehicular clouds protocol (CROWN), where they considered an urban scenario and suggested a set of vehicles as providers, known as STARs, and the remaining ones as consumers. The STARs register their resources in the nearest RSUs. Then, once the consumer vehicles seek some services, they request RSUs for their needs; the latter search in their directories and respond to consumer vehicles by informing them of the most suitable STARs.
Brik et al. [10] made an important push-forward toward finding a public bus to rent out services in vehicular clouds. The authors designed a Discovering and Consuming Cloud Services in Vehicular Clouds protocol (DCCS-VC) that finds adequate public buses and uses them as cloud directories to facilitate the discovery of supplier vehicles’ services. The proposed protocol is based on the Grid-based Tracking Cell technique (GTC) that allows partitioning the route of each bus group into several cells. The cells are grouped in tracking bus path (TBP), and each TBP has a unique identification (TBPI). Then, once a supplier vehicle registers a service on a public bus, it will be informed by the corresponding TBPI. The authors of [13,14] improved the DCCS-VC, where they added new research by proposing a protocol named Fast Discovering and Consuming Cloud Services in Vehicular Cloud (FDCCS-VC). Some enhancements have been made allowing vehicles to share all public bus routes and schedules.
Arkian, et al. [15,16] proposed a Fuzzy Clustering-based Vehicular Cloud Architecture (FcVcA), where they introduced the concept of clustering in the vehicular cloud. The election of the cluster head (CH) is done using a fuzzy logic algorithm. The CH manages the cloud in real-time in terms of creation and maintenance. When a consumer vehicle wants to consume services, it sends a request to the CH, which uses Q-learning to provide it with the adequate service provider vehicle. It is worth noting that the proposed protocol was implemented in a highway scenario.
Azizian, et al. [17] introduced an optimization vehicular cloud model. They used a distributed D-hop cluster formation algorithm (DHCV) to organize vehicles into clusters without overlapping. All clusters are considered as clouds and brokers (cloud coordinator), and the vehicle chooses its broker according to mobility calculations proportional to its neighbors D-hop. This model uses a mathematical optimization-scheduling algorithm to maximize bandwidth and minimize delays.
Hussain, et al. [18] implemented a Vehicle Witnesses as a Service (VWaaS) protocol that employs some vehicles that assist as witnesses using their cameras to build a VANET-cloud service. This protocol offers the use of the installed cameras on vehicles as well as roadside cameras to provide pictorial services to other entities (e.g., VANET users and/or law obligation). The event’s occurrence allows some vehicles to serve as witnesses, and provides legal confirmation to law obligation for ex-amination.
Lin, et al. [19] proposed a Gateway as a Service (GaaS) protocol, which includes three levels. The first is a gateway, which can be RSU or vehicle, that connects vehicles to the Internet. The second is the consumer vehicle that requests internet access, while the third is the vehicular cloud that provides two sub-repositories, which are:
(1).
GaaS register: it is to save all data on the gateways.
(2).
GaaS dispatcher: it is to send the associated gateways for consumer vehicles.
Jafari et al. [20] introduced a Two-level cOntroller-based aPproach for serVice advertISement and discOveRy in vehicular cloud network (TOPVISOR). They implemented the proposed scheme in a vehicular cloud network. This approach is based on two central controllers that are connected to the distributed directories of roadside units; the information discovery with its registration is achieved in a hierarchical proactive manner at the controller levels.
However, all previous studies used to focus on improving few performance metrics, whereas other metrics were neglected. Therefore, we proposed a protocol that finds compromises by negotiating all metrics, especially those that have a strong relationship with decreasing delays in urban environments.

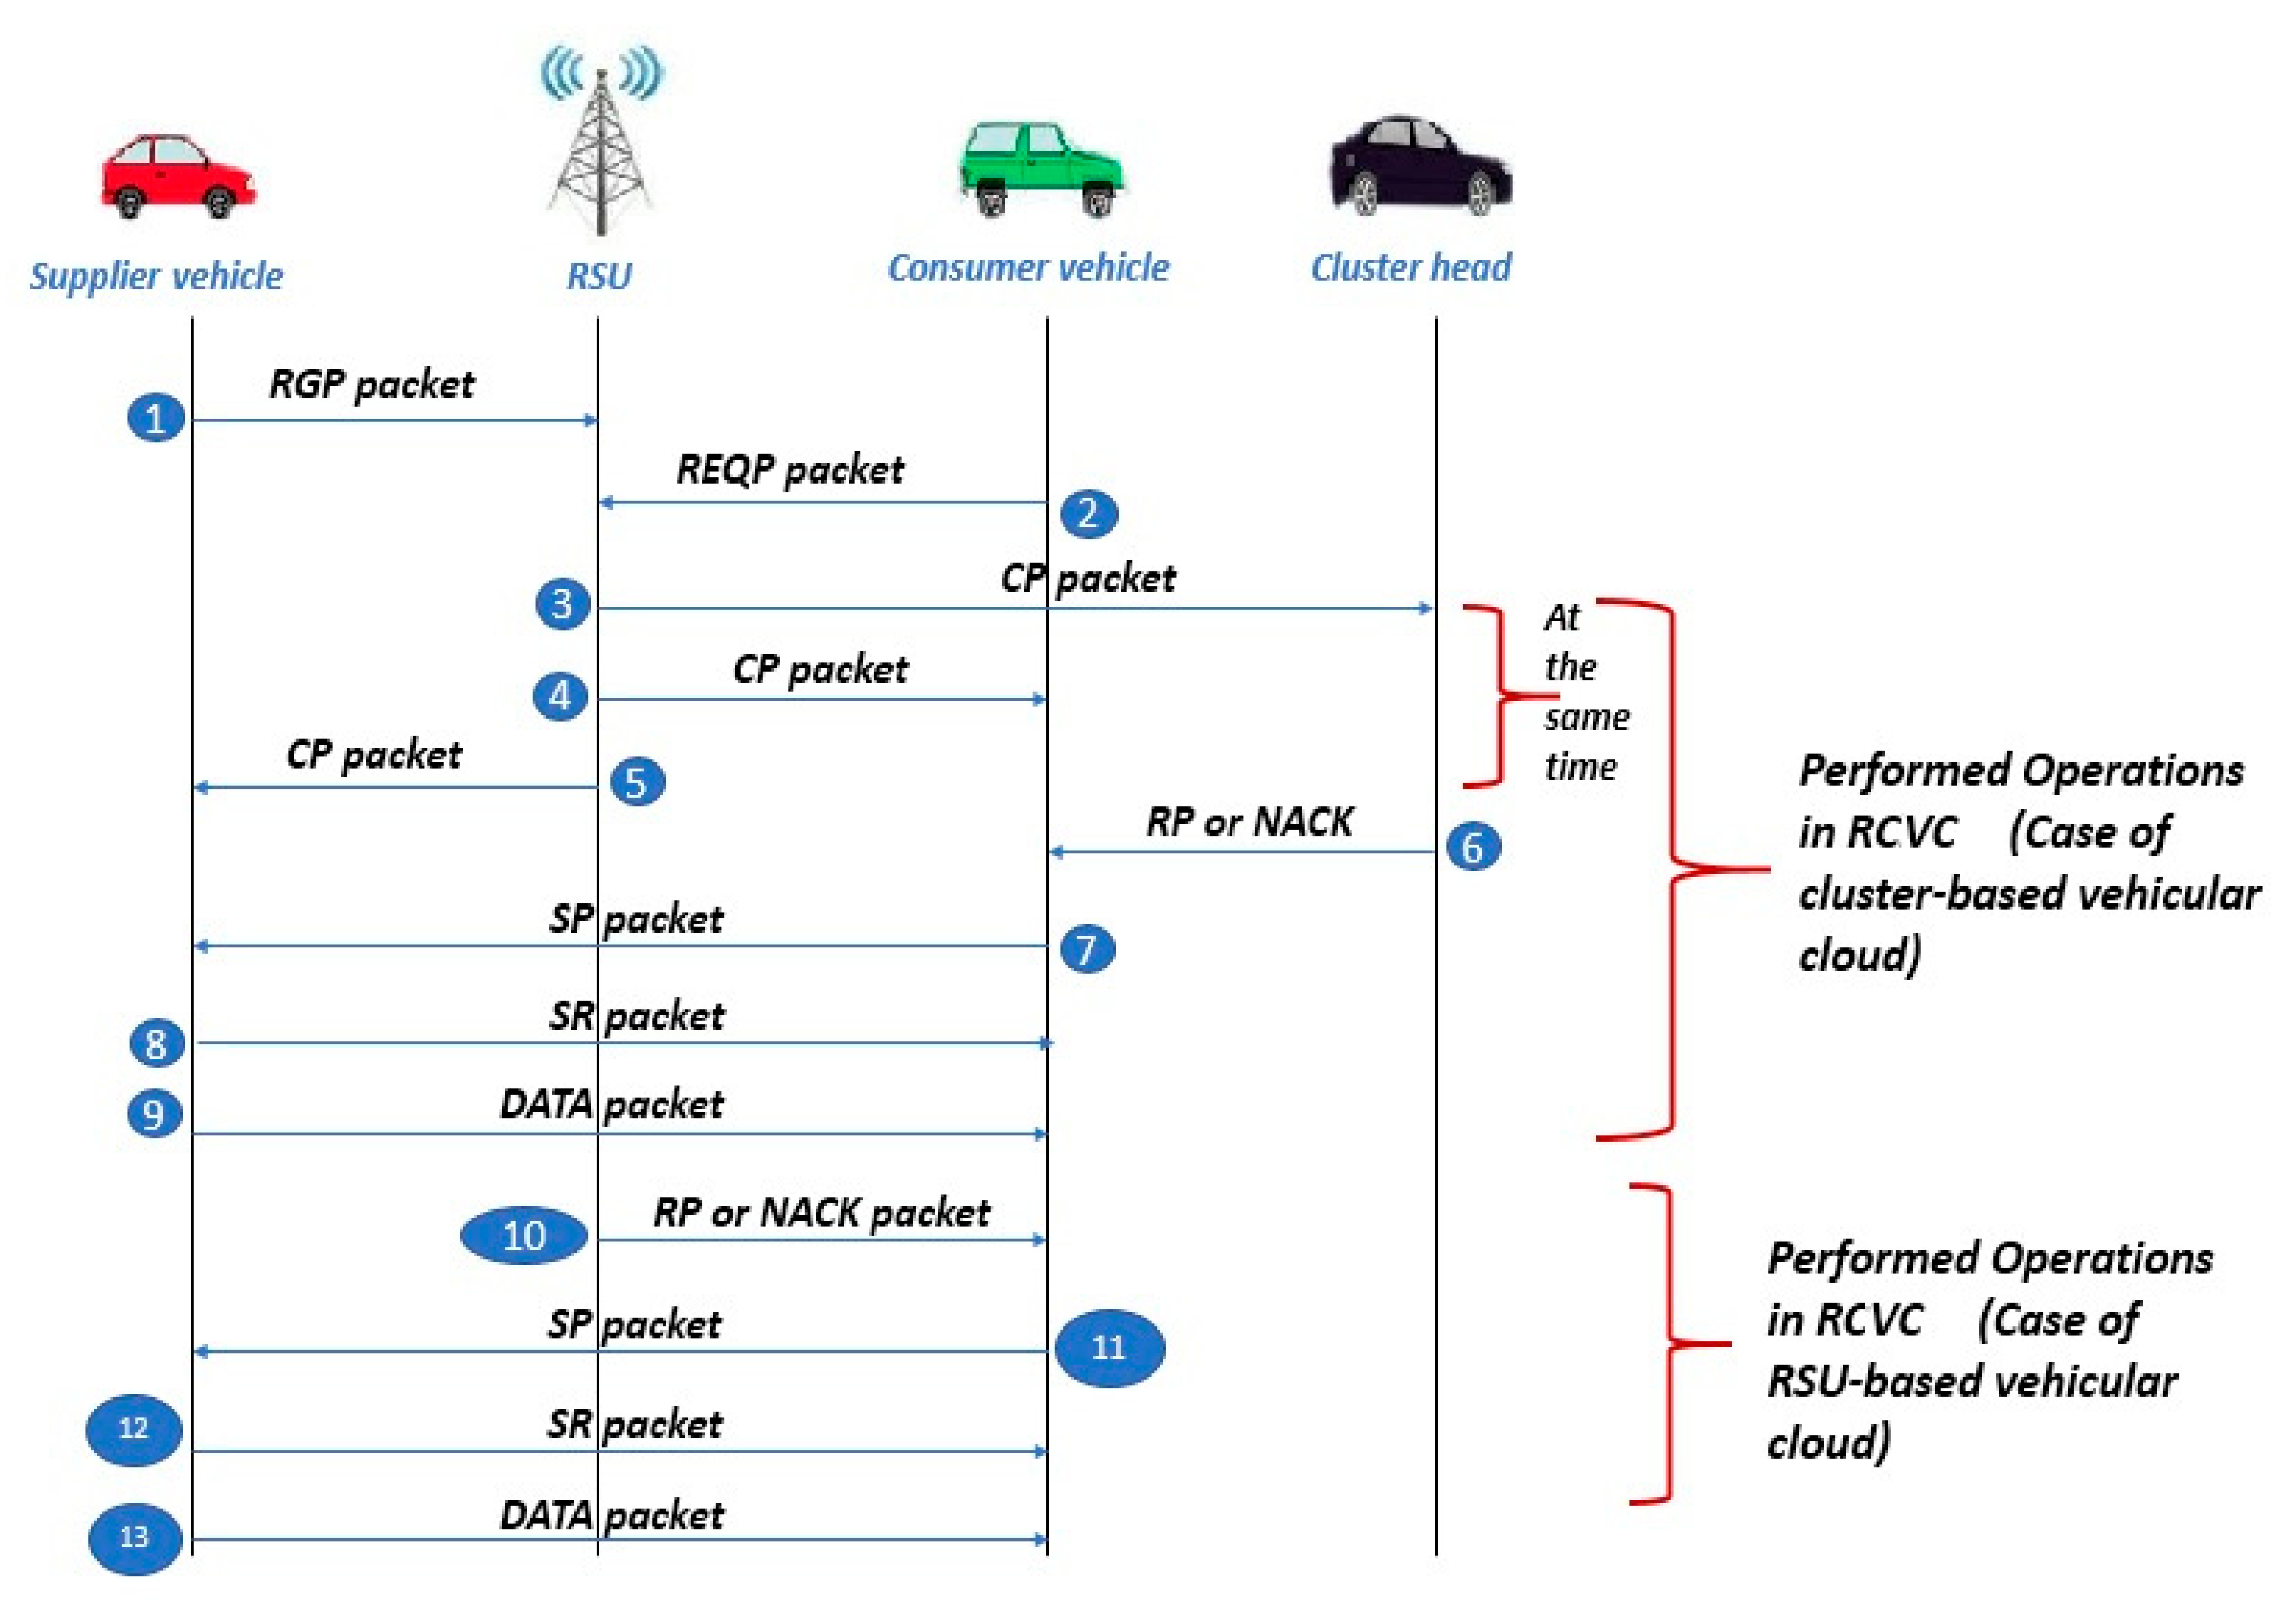
3. Proposed Protocol

We designed RCVC taking into consideration the MANHATTAN mobility model [21] as an environment where all vehicles are moving randomly in this area. RSUs are chosen near junctions and are also installed uniformly on the board.
All vehicles can exchange messages between them or with the nearest RSUs via their OBU antennas. RSU range helps vehicles to construct a set of clusters if they receive offers and consumptions services according to their needs. Note that such RSU can create a cluster only when it receives a set of registration or request packets. Some vehicles going in the same direction, where there are SVs and CVs that have stable links with the CH, can form a cluster, as shown in Figure 1. Therefore, based on this concept, to create a cluster, it is mandatory to select a CH that will be able to manage the cluster and responds to all requests, which are belonging to the cluster. The rest of the vehicles, which do not fulfill the condition mentioned above, must register their services in the closest RSU if they are SVs, but if they are CVs, they must send their requests. However, a wired transmission connects all RSUs with delay between [0.05, 0.1] seconds.

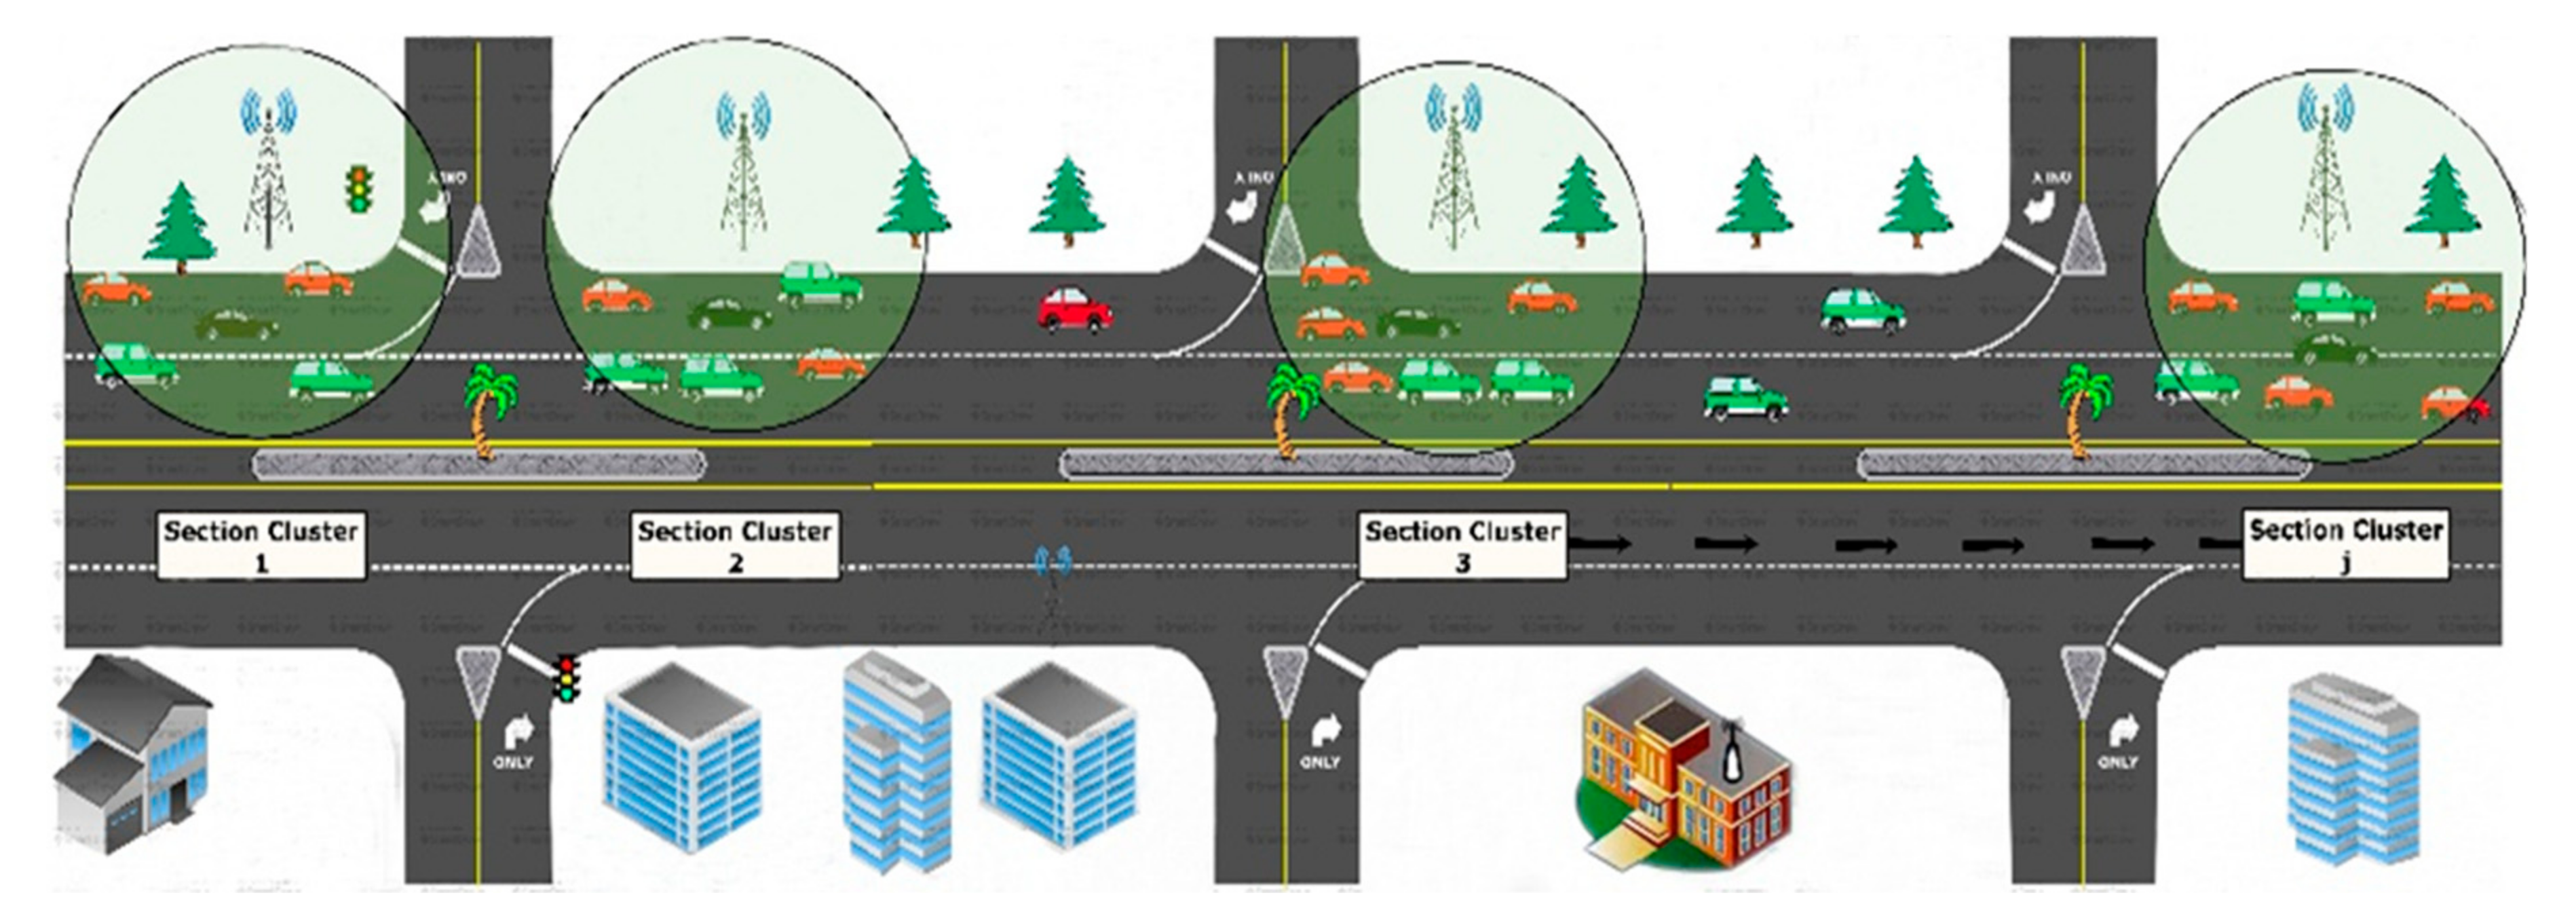
3.1. Mobile Cluster-Based Vehicular Cloud

Once a smart vehicle wants to offer its resources to other vehicles, it sends a registration packet (RGP) to the nearest RSU. If a user in an intelligent vehicle needs an internet connection, requires additional resources that his vehicle does not have or he is interested in certain data, he uses the services of one or more nearby SVs. The user’s vehicle formulates a request packet (REQP) and sends it to the nearest RSU. The format of the registration and request packets are shown in Figure 2.
If CVs and SVs are not receiving the response from RSUs, they all keep constantly sending their packets after waiting time (WT) of ten (10) seconds (the ten seconds choice explanation is in the experimental section).
Consequently, the reception of the registration and request packets by RSUs triggers some operations to create clusters and select cluster heads or construct directories at RSUs level. Figure 3 depicts this process. When such an RSU receives the first packet, either a registration packet or request packet, it starts a timer. Then, the transmission process of packets continues until the timer reaches a certain threshold θ (e.g., 1.5 min), some operations are launched.

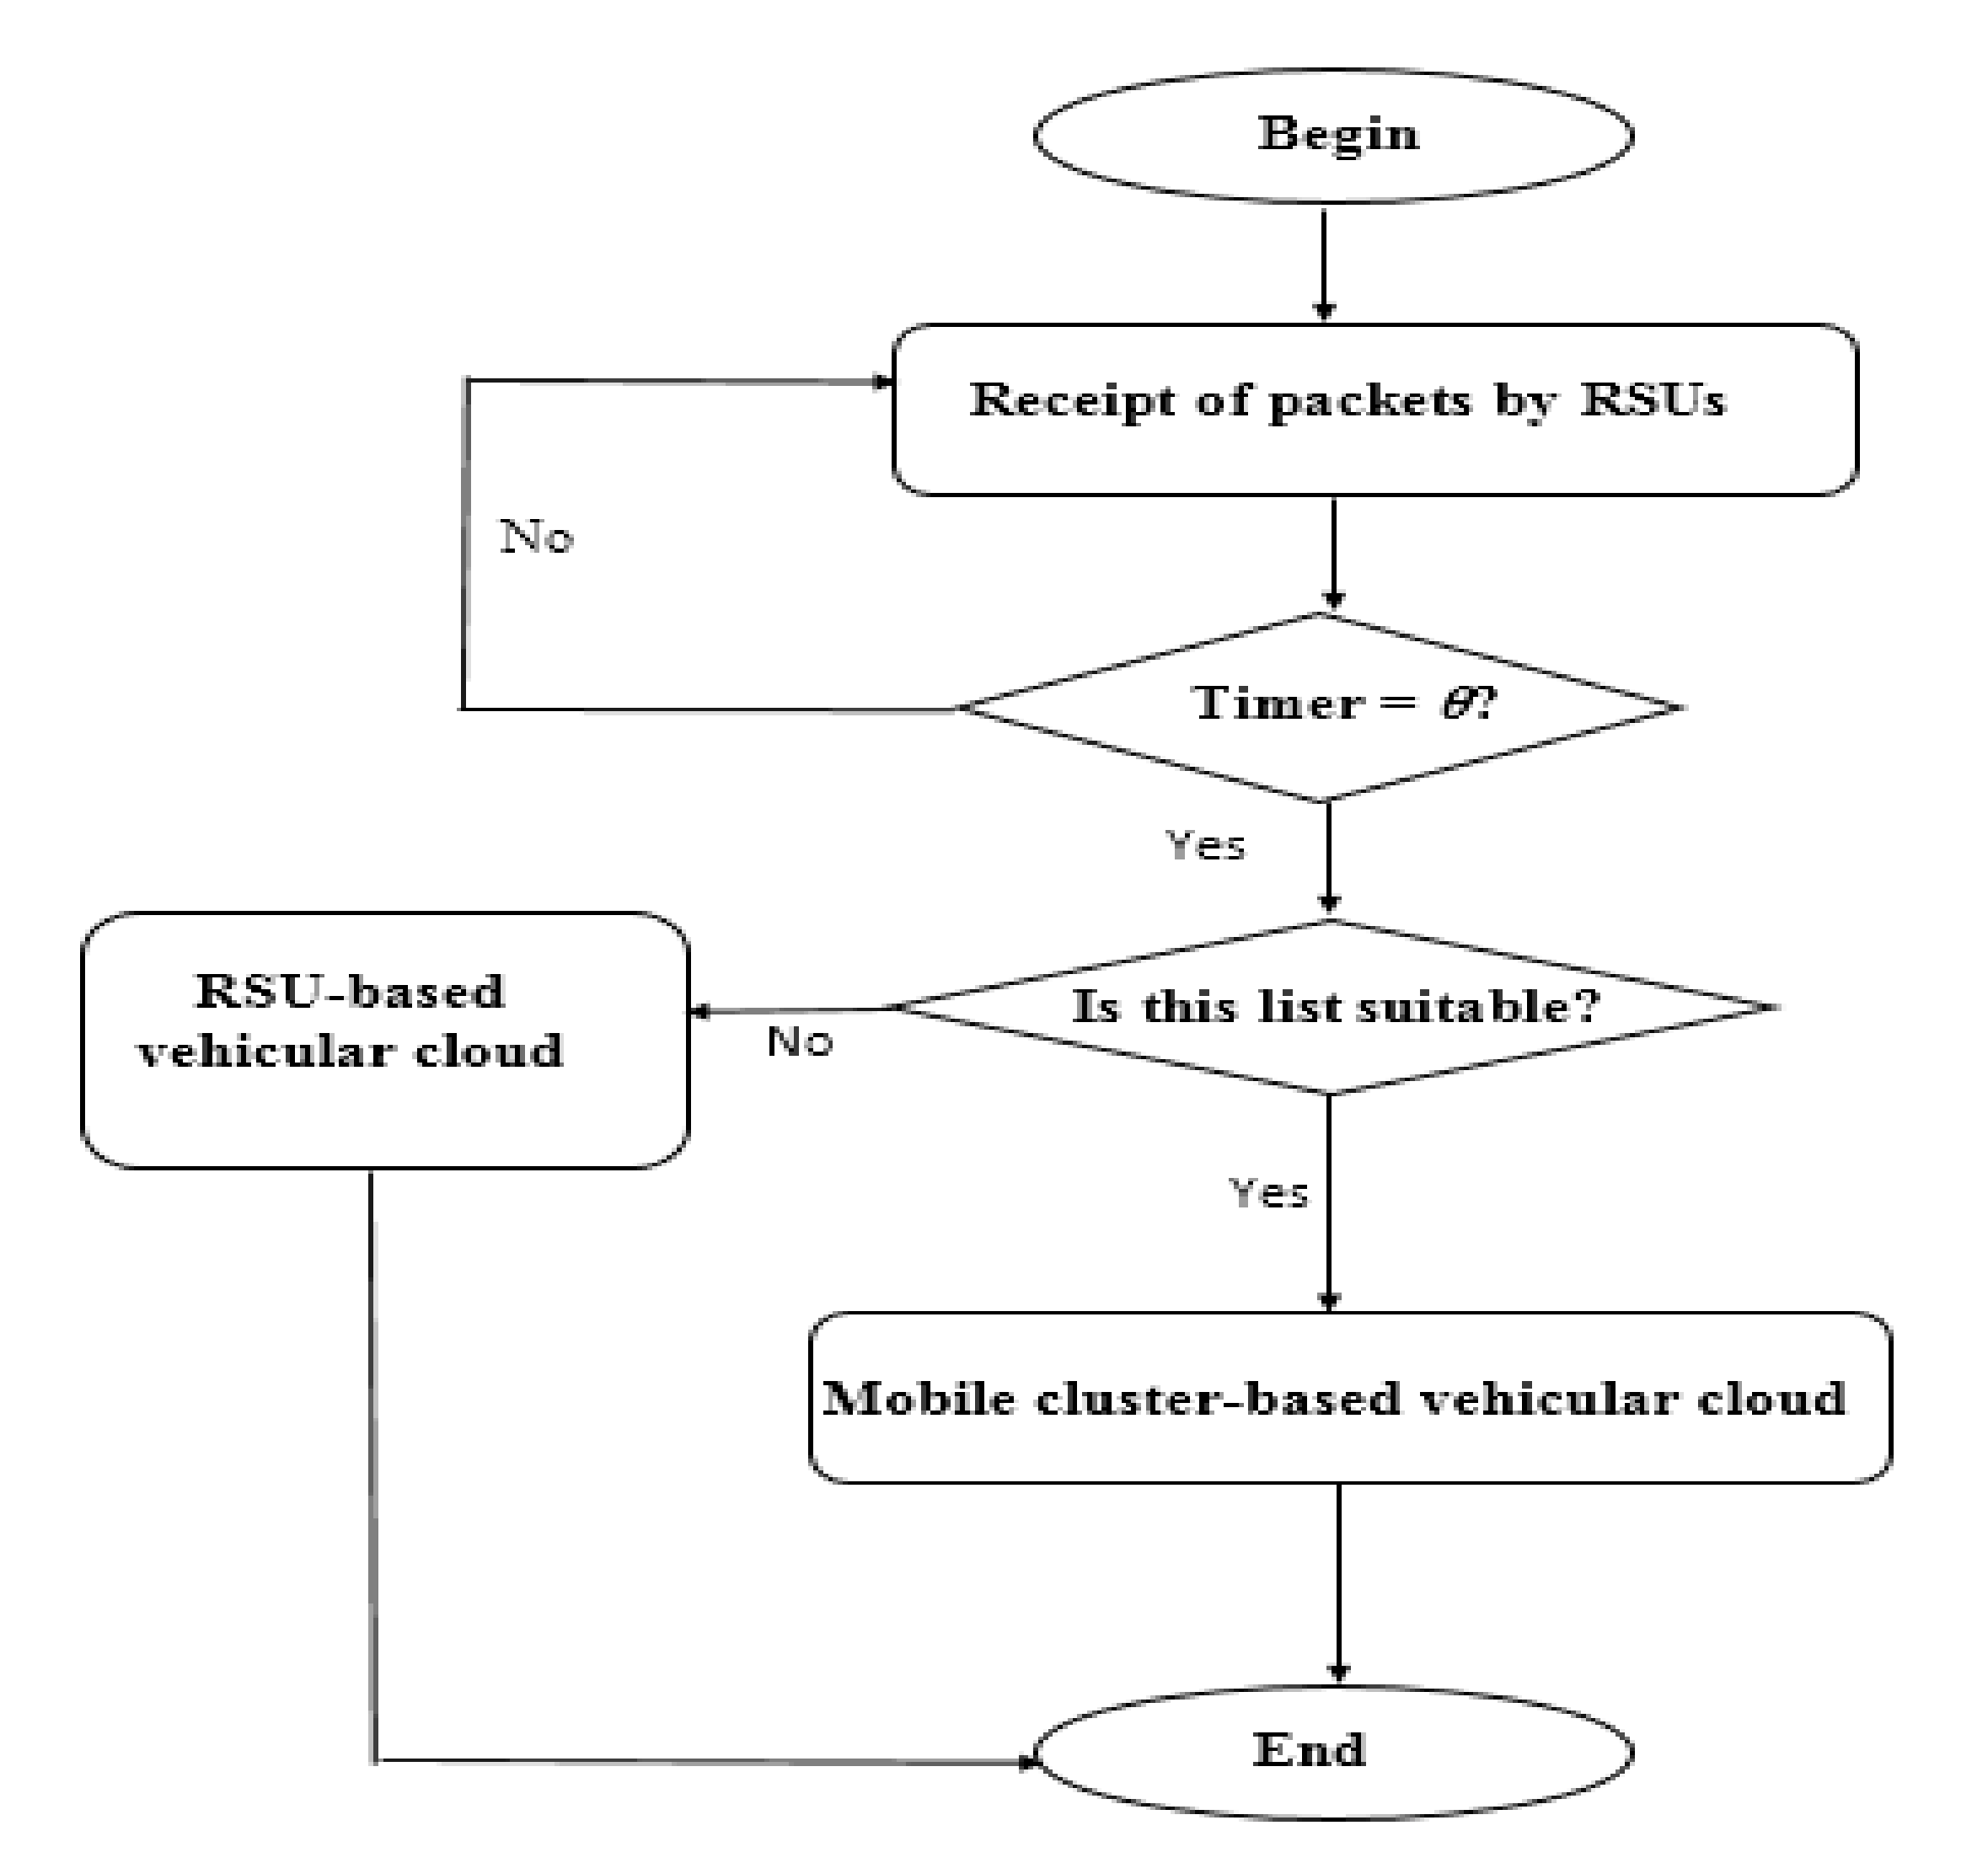
3.1.1. RSU Level Operation After θ

This step is called Discovery Phase (DPH) that allows saving all resources on RSU’s directory or creating clusters. We summarize these operations as follows:
(1).
Reset the time θ.
(2).
Put all packets on the list.
(3).
If the list contains the same type of vehicles, either CVs or SVs, the RSU creates its proper directory.
(4).
If the list contains at least one SV or one CV and the sum of vehicles is higher than one (1), the RSU creates a cluster and selects its CH (described in Section 3.1.2).
(5).
Delete the list’s items in the directory after creating the cluster.
The following Algorithm 1 highlights how RSUs try to create VCs.
Algorithm 1 RCVC process Pseudo-code, which checks the ability either to create a cluster or RSU’s cloud.
 1: input: stack temporary_cloud // temporary_cloud is a stack that contains the
              // temporary cloud built using the received packets.
 2: stack RSU_cloud;
 3: boolean find_supplier ← false;
 4: boolean find_client ← false;
 5: j ← θ; // It is a counter.
 6: while j <= simulation time do
 7: begin
 8: for each V in temporary_cloud
 9:  begin
 10:   if V = "client"
 11:   begin
 12:    find_client ← true;
 13:   end if
 14:  if  V = "supplier"
 15:   begin
 16:    find_supplier ← true;
 17:   end if
 18:  end for.
 19:   if (temporary_cloud.size() >= 2) and (find_client) and (find_supplier)
 20:     begin
 21:       create_cluster(temporary_cloud); // This function informs vehicles that
                // belong in the same cluster for cluster creation.
 22:      temporary_cloud.clear(); // This function deletes the temporary cloud.
 23:     end if
 24:   else
 25:     begin
 26:      for each item i in temporary_cloud
 27:       begin
 28:        RSU_cloud.push_back(i); // This function creates a cloud at RSU’s level.
 29:        end for
 30:        temporary_cloud.clear();
 31:   end else
 32: j ← j + θ;
 33:  end while
Algorithm 1 verifies the existence of at least one SV and one CV in the temporary cloud that is created at the beginning, and that will be deleted after a threshold θ if it does not fulfill the conditions of creating a cluster. Note that, in our proposed protocol, not all vehicles can join clusters. Thus, in the case of a vehicle that cannot join any cluster, it registers the offers and requests on the VC at the RSU level.

3.1.2. Clustering

The RSUs proceed with creating vehicle clusters using vehicles’ coordinates in a plan of Euclidean space by defining what is called a section cluster. RCVC considers all routes on the map as sections from 1 to j, as shown in Figure 4.
Thus, to select CHj in section j in real-time, we utilize the Euclidean distance [22], taking as parameters all vehicles’ coordinates Vi (Xi, Yi) and their average speeds AVi at the time t. The formulas used to calculate the central point Pj (Xj, Yj), are expressed mathematically as:
X j = i = 1 n X i n
Y j = i = 1 n Y i n
A V j = i = 1 n A V i n
where n is the number of vehicles in cluster section Sj.
To get the coordinates of the vehicle that is a cluster head in the cluster section Sj, we calculate the distance (Dist) between all vehicles and Pj. The vehicle that has a smaller distance will be a cluster head CHj in Sj. The average speed AV is included because the accelerations and decelerations are very frequent within the urban area. That is why it is considered as a representative and stable value and used to maintain the cluster formation for as long as possible.
This formula calculates the Euclidean distance between vehicle Vx and Pj:
D i s t V x , P j = ( X V x X P j ) 2 + ( Y V x Y p j ) 2   + ( A V V x A V p j ) 2
Besides the minimum required number of vehicles to form a cluster, all vehicles having similar mobility patterns can also join the formed cluster. The similarity of the mobility patterns is mainly measured by the link stability LSPj,Vj between the joining vehicle and the cluster head Pj [23].
The LSPj,Vj is calculated by Equation (5).
L S P j , V i =   α L S P j , V i + 1 + α 1 Δ V P j , V i t + p Δ V P j , V i , t Δ D P j , V i t + p Δ D P j , V i t
where α: a constant that is used to avoid the influence of peak cases, such as unexpected braking;
VVi (t) the velocity of vehicle Vi at time t;
ΔVPj,Vi = VPj (t) – VVi (t); VPj and VVi speed variation at instant t;
ΔDPj,Vi(t): Distance between Pj and Vi at the time t.
Each RSU informs all vehicles that are included on the same cluster for this creation and selection by broadcasting the cluster packet (CP). The CP does not contain only the ID of the CH, but all the information about offered/requested services and Numhops (a variable that defines the number of authorized hops between the CV and the SV) that promote the clusters to the autonomous management as well. As the CH has all the pertinent information on its cluster vehicles, it starts to manage the consumption between vehicles by applying the service selection operation (it will be detailed hereafter) to optimally schedule the CVs queue. RCVC searches in its SV’s candidate list (Lc) that is obtained from the RSU during the clustering to respond to all CVs via response packet (RP) that contains the ID of SV and their resources if:
  • There are some SVs whose queues contain only less than the value of the Queuecv variable. The latter is scalable according the global number of vehicles and SVs in a VC (it will be explained in the experimental).
  • There are some SVs that can satisfy CVs requirements.
On the contrary, the CH responds by negative acknowledgement (NACK).
The user in CV specifies its needed resources and attributes by sending a service packet (SP) to the SV using Numhops hops (explained in the experimental section). SP contains the ID of the vehicle and its requests. Upon receipt of the user service packet, the SV responds with a service response packet (SR) packet, asking the CV for the payment method. The CV and the SV exchange data packets corresponding to the resources. Figure 5 shows the structure of the RCVC protocol packet, where C, R, N, P, S are flags for the CP, RP, NACK, SP and SR packets, respectively.

3.2. RSU-Based Vehicular Cloud

The storage of all SVs and CVs information on RSU directory (DR) in the case of no cluster creation triggers the calculation of the SV’s influence area Ai, in which the SVs can offer their resources reliably to consumers [12]. Moreover, Ai allows tracking the SVs itineraries. The fact that all RSUs are wired enables them to share their DRs and SVs Ai to form a global cloud of RSUs. When the SV moves to other RSU and becomes nearest, Ai changes its value on all RSUs DR by sending another registration packet to other RSU (R2, for example). Consequently, the RSU adds (updates) the packet to its DR and forwards it to all RSUs, where they update their DRs.
The SV, which does not belong to any cluster, always sends a beacon to the nearest RSU (every 2 s). These beacons allow RSUs to follow the supplier vehicle’s movements. When the beacons are delayed to arrive at RSU, the latter tries to know voluntarily the location of the SV’s area, which is called estimated area Ae. With this formula, we can estimate the Ae, Ae = 1.3 × V × (Tc–T1), where T1 is the time of sending the last beacon, Tc is the current time and V is the average speed of supplier vehicle). The RSU sends the value of Ae to all RSUs. It is worth noting that the RSU will delete the supplier vehicle from its DR if it does not receive beacons from it, for a time X = 10 × (interval beacon) [12].
When a CV needs to consume some services, it formulates a REQP and sends it to its nearest RSU. In addition to the needed resources and their attributes, the REQP packet contains the vehicle’s geographical coordinates. Wherever, if the RSU receives a REQP from the CV, it searches in its DR for one or more supplier vehicles that can meet the vehicle’s requirements.
The RSU responds to a CV’s request by choosing the corresponding SV from its list Lc, which has undergone a service selection operation (it will be detailed hereafter). Then, the RSU formulates an RP and sends it to each CV, this kind of packet contains the following elements:
(1).
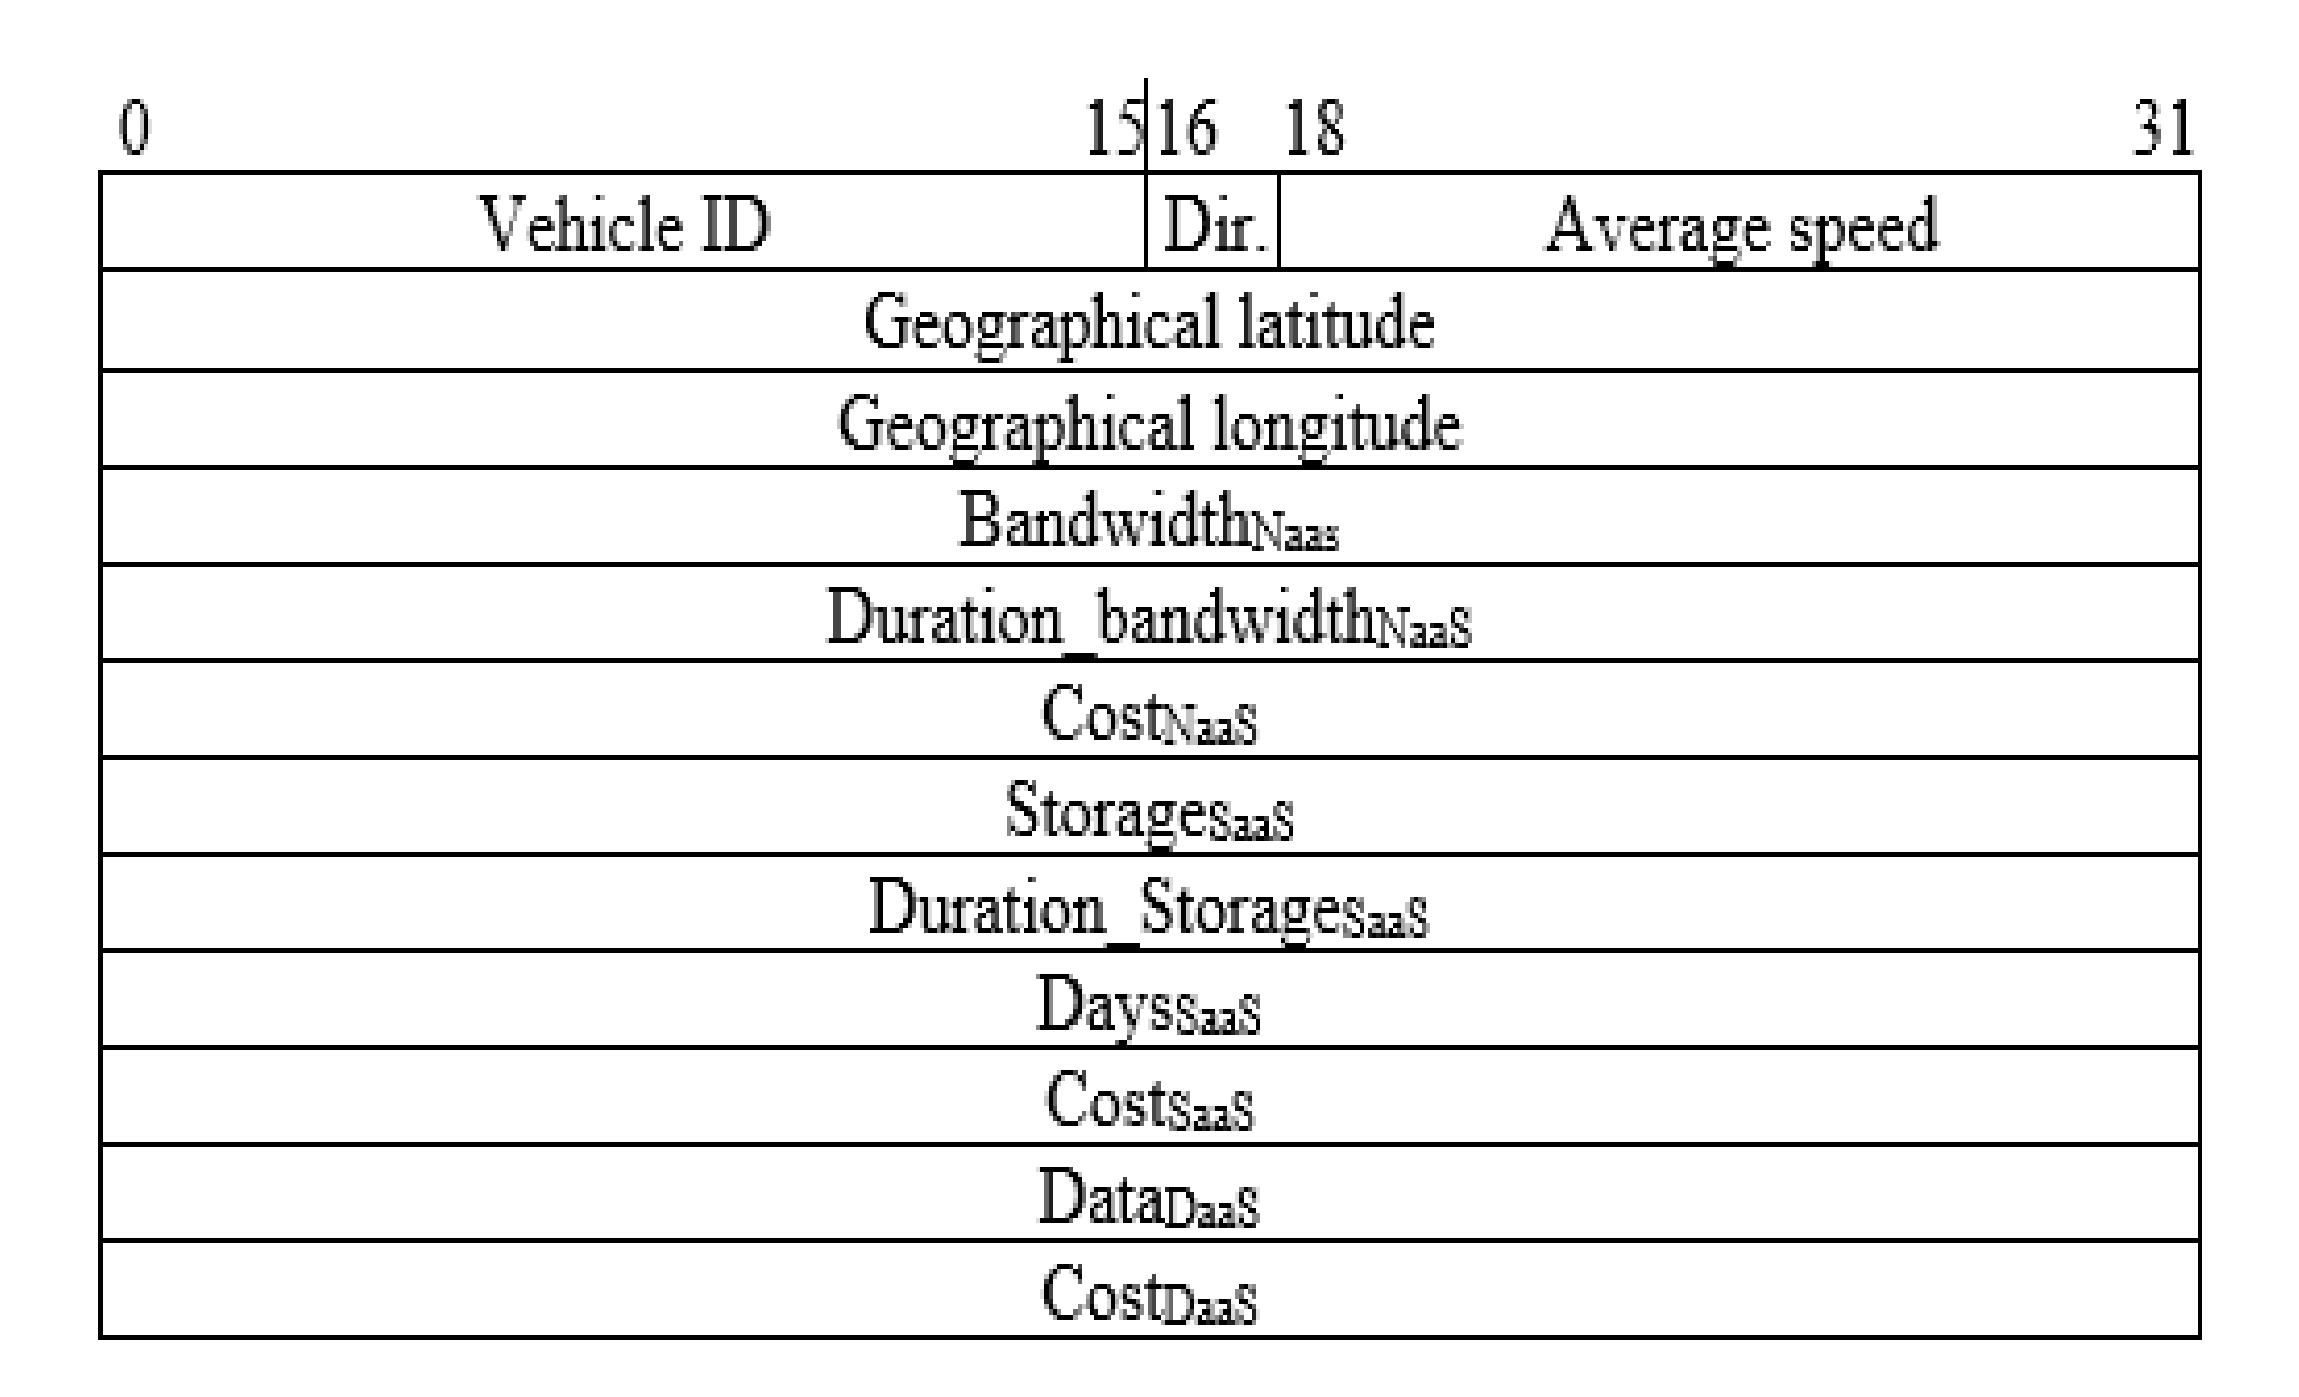
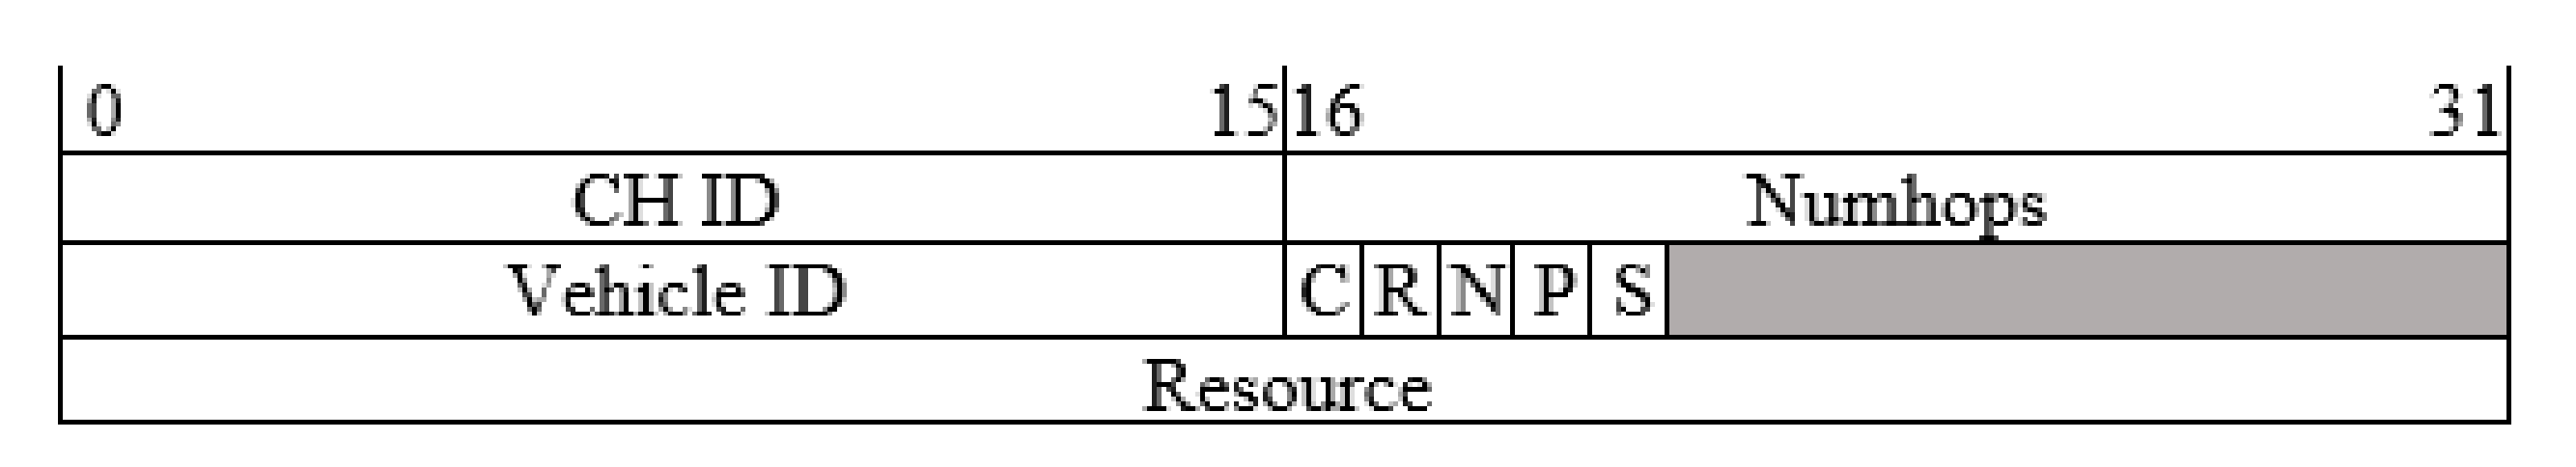
The ID of supplier vehicle.
(2).
Latest SV’s location from the latest beacon.
(3).
Resources and their attributes.
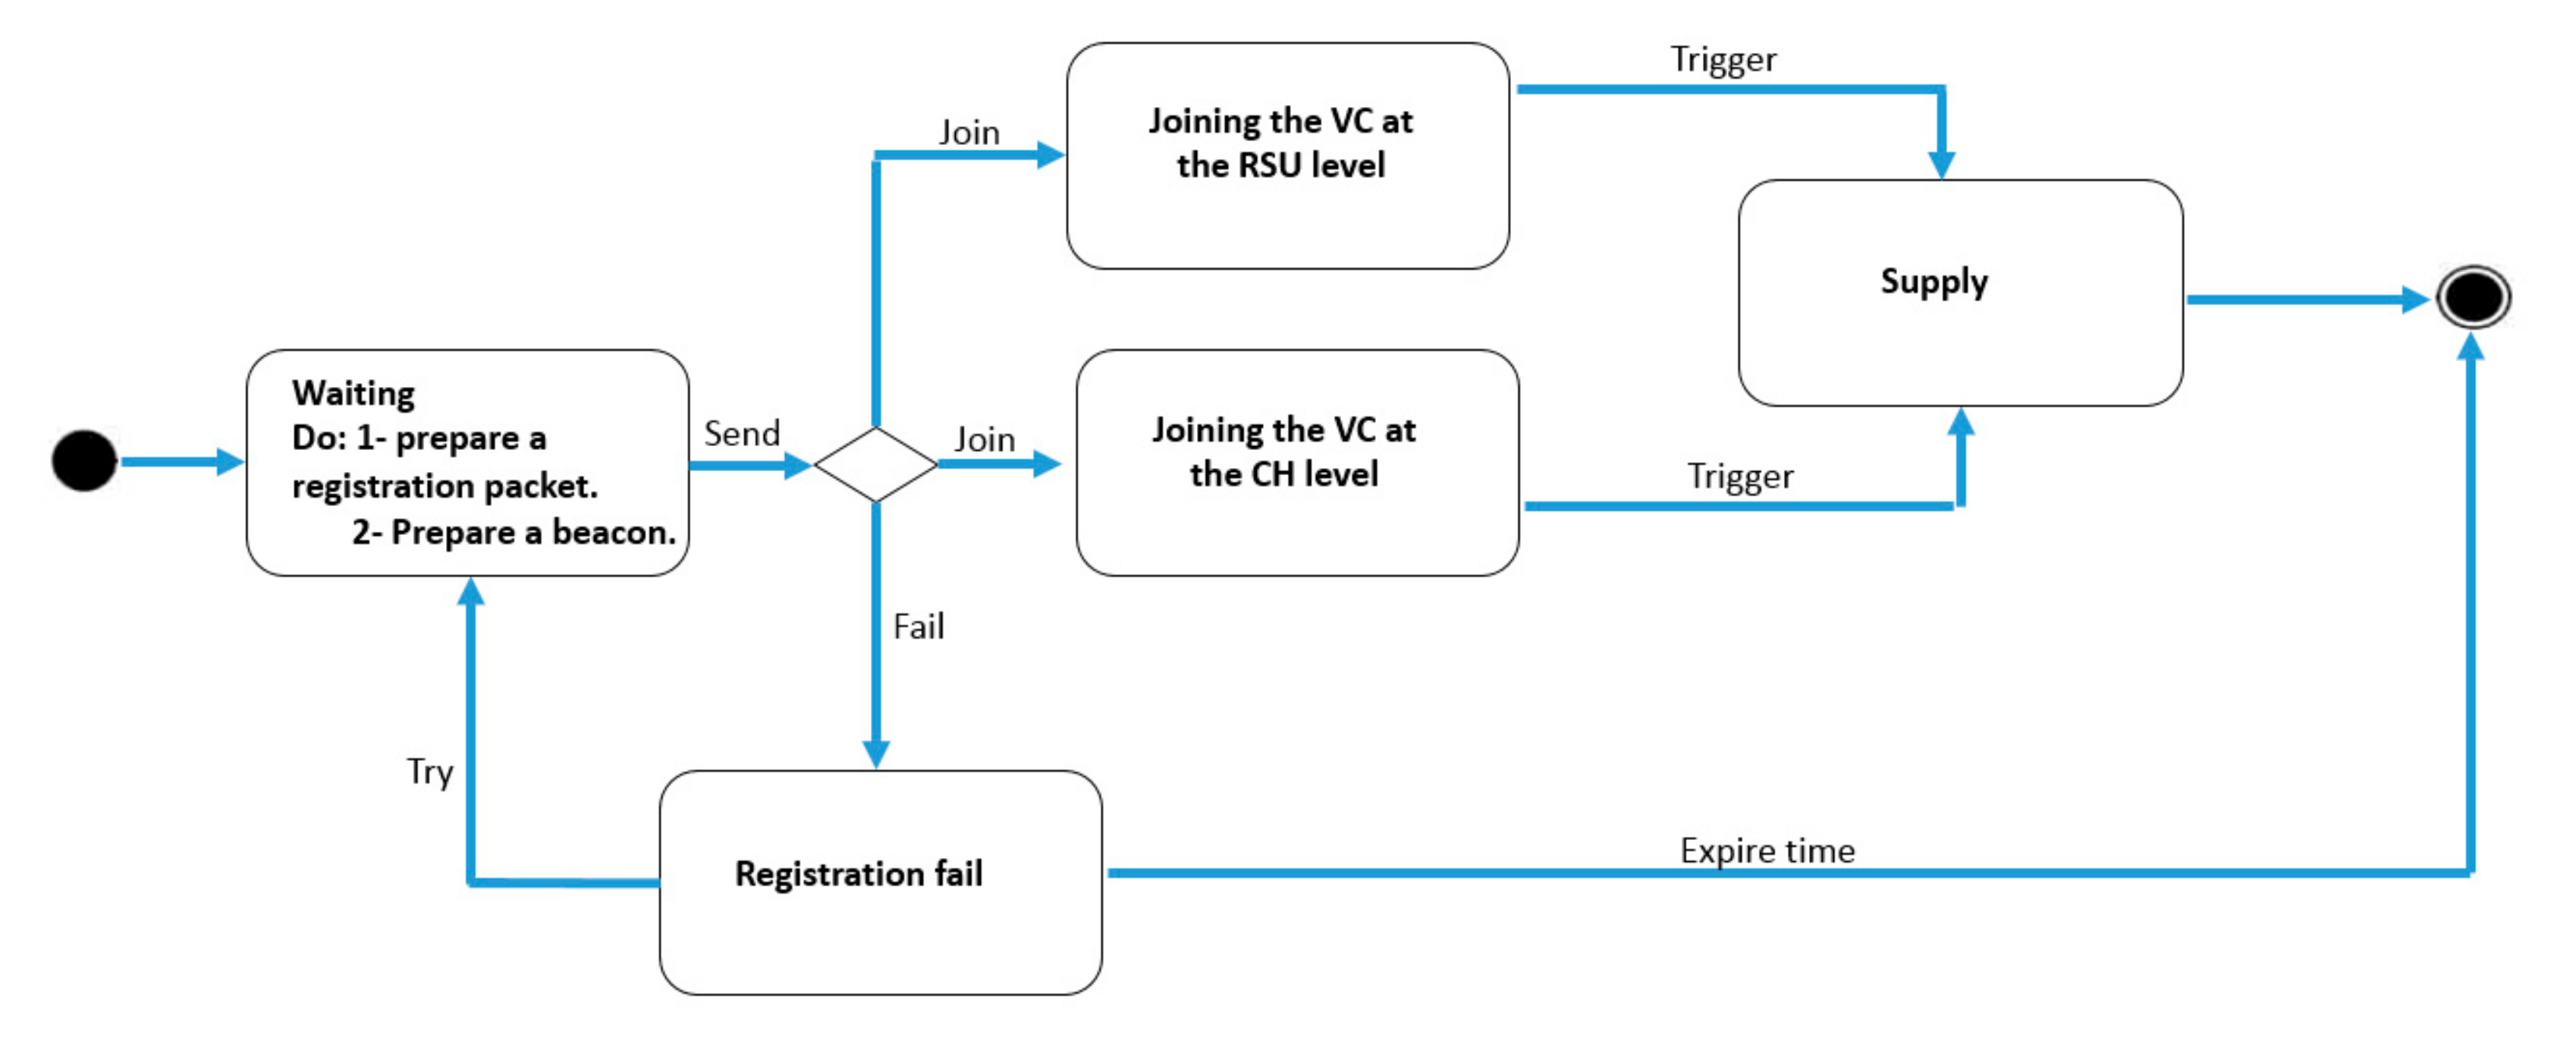
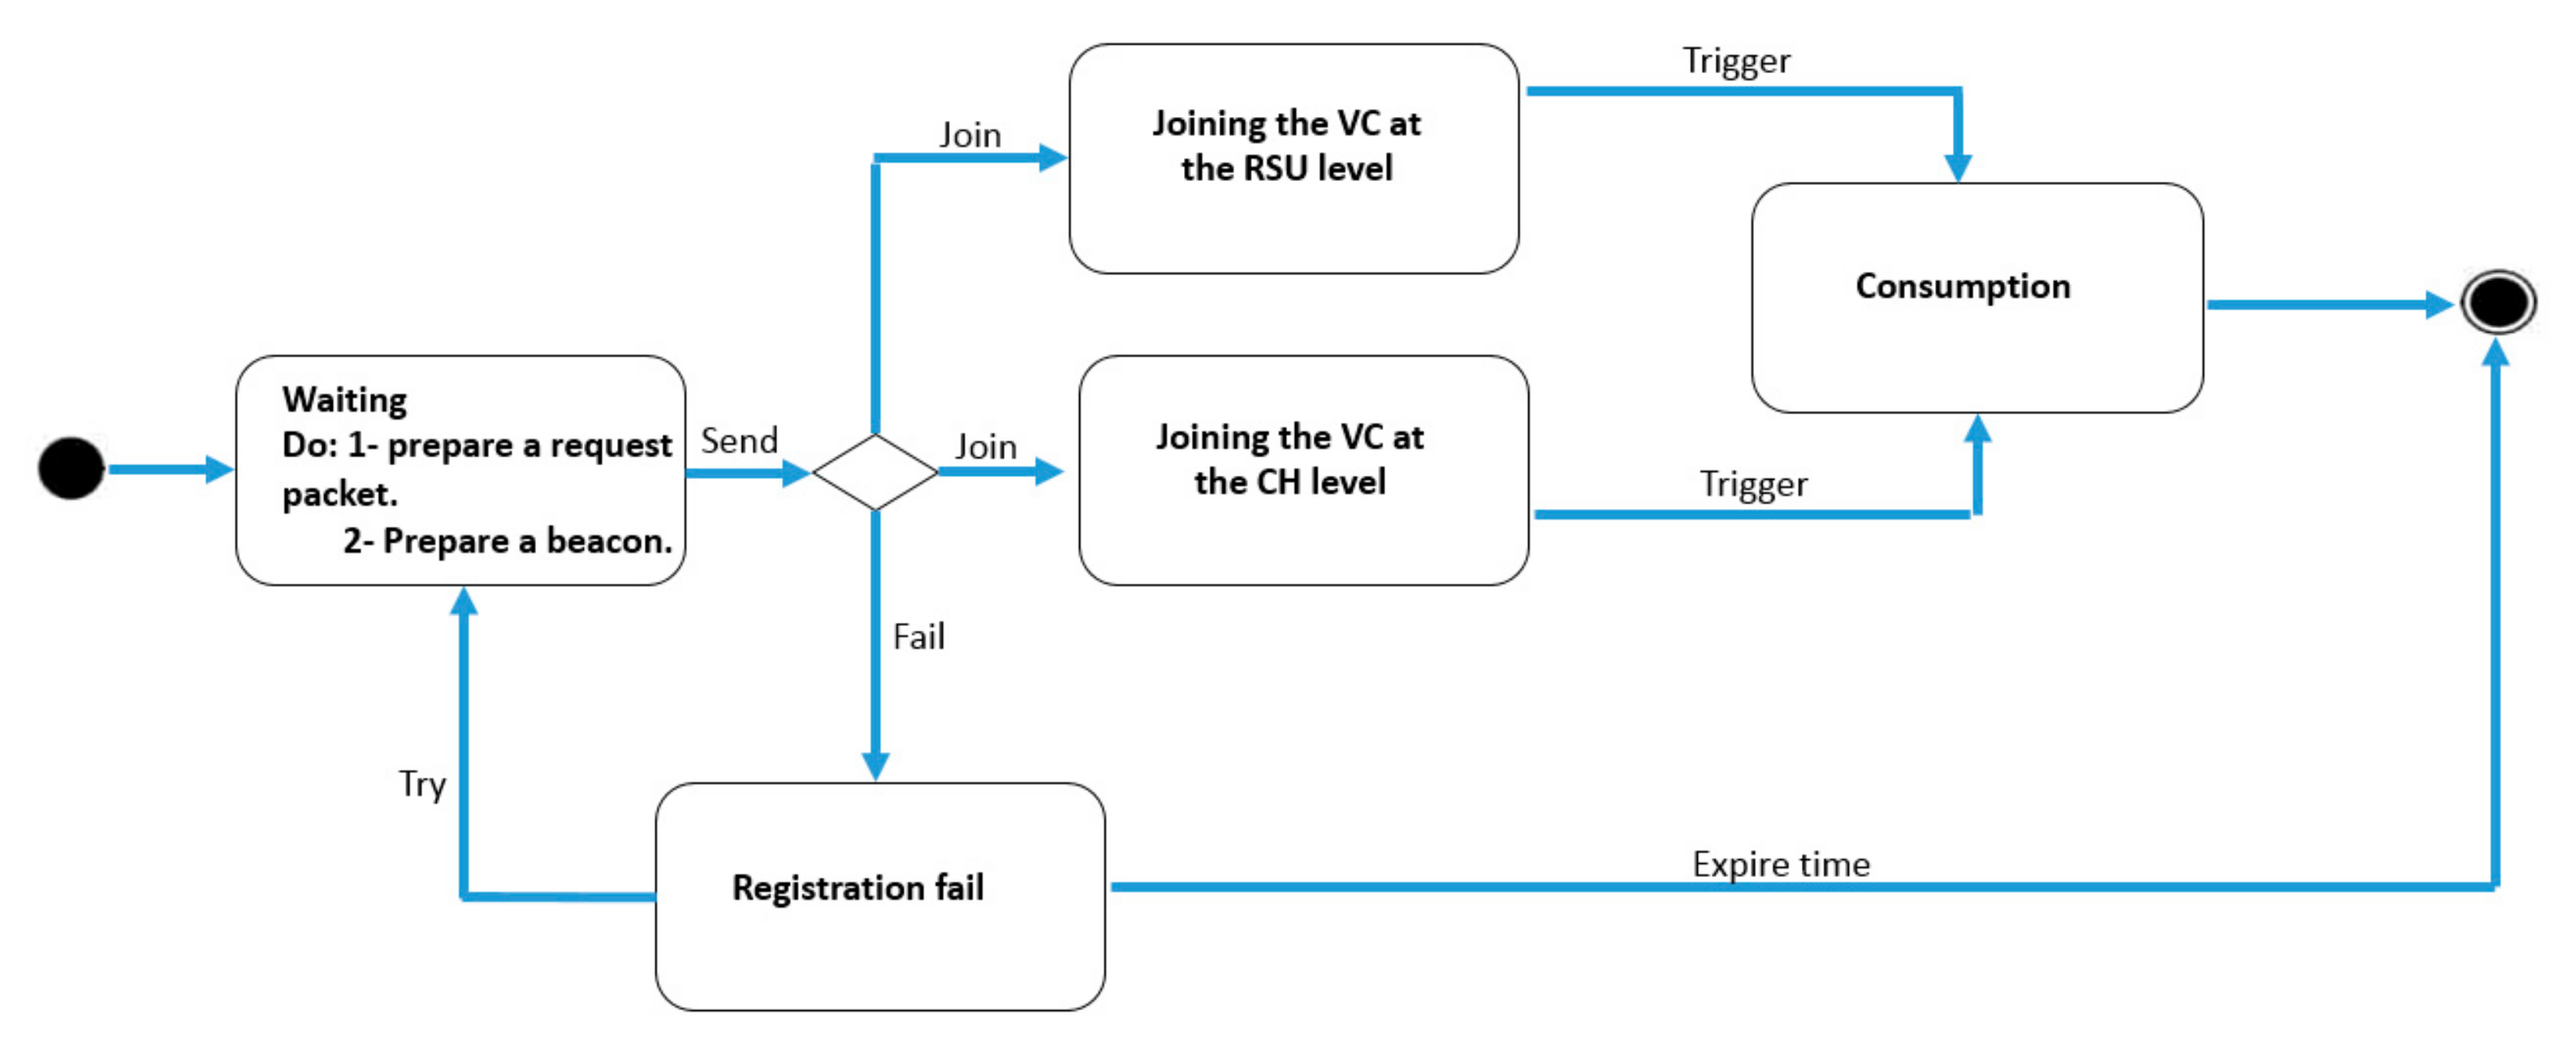
If Lc does not contain any SVs that can satisfy the CV’s request, or if SVs’ queues of this list are busy, then the RSU responds with a negative acknowledgement (NACK).
The user specifies the resources and their attributes of each resource that he needs. His vehicle prepares an SP for the supplier vehicle selected and sends it, using an RSU’s backbone. The service packet contains the CV’s ID and their requests, upon receipt of the CV’s service packet, the SV responds via SR to the user for payment method. The CV and the SV exchange data packets corresponding to the resources.
Figure 6 illustrates how all objects (vehicles and RSUs), orderly, interact with each other in RCVC by using the sequence of events according to packets sending and receiving. This diagram provides a better visualization of all RCVC operations.
The supply and consume operation begins by registering all packets at the RSUs level, whether it is an RGP registration packet or a REQP request packet, as shown in Figure 6. The RSUs create the clusters by informing the vehicles belonging to the cluster by this creation through sending CP packets, or else by creating VCs at their levels.
In the case of a cluster-based vehicular cloud, the CH has the role of managing the operation of consumption by sending the RP or NACK packets. In the second case of RSU-based vehicular cloud, the RSUs also continue to achieve the consumption operation by the RP or NACK packets. The rest of the operations is accomplished between vehicles using the SP, SR and data packets.
In order to prove that no deadlocks can occur, we used the state diagram to describe all possible states and to better understand the behavior of the objects. The state diagram, as shown in Figure 7 and Figure 8, is a set of a finite number of states that captures an abstract description of the behavior of SV and CV objects.
Table 1 and Table 2 illustrate all the possible states in which an SV and CV objects can be, respectively. The transition from the current state to the next state is triggered by the appropriate event. The sates of CV and SV objects are defined as follows:
(1).
Waiting: in this state, the object is waiting for the successful registration.
(2).
Joining the VC at the RSU level: it is the state where the object joined the VC at the RSU after a successful registration.
(3).
Joining the VC at the CH level: it is the state where the object joined the VC at the CH after a successful registration.
(4).
Supply: the object is in the state of providing services to CVs.
(5).
Consumption: the object is in the state of consuming services.
(6).
Registration fail: the registration attempt failed.

3.3. A Mathematical Model for Service Selection

We extended RCVC by adding a service selection method in the VC either at the RSUs level or the CHs’. Based on the collected data in real-time, the RSUs and CHs select the best services in VC by using the Simple Additive Weighting method (SAW) [24], which exploits the multi-criteria making. Table 3 illustrates the offered services’ attributes of any SV, such as quality criteria.
Note that the criteria are as performance values, and they are numbered from 1 to 9 with:
BandwidthNaaS =1; Duration_bandwidthNaaS =2; CostNaaS =3; StorageSaaS =4;
Duration_StorageSaaS =5; DaysSaaS =6; CostSaaS =7; DataDaaS =8; CostDaaS =9.
In each VC, we consider a set of candidate vehicles CondidSV = {SV1, SV2, SV3……. SVn} that leads to get a decision matrix MATDIC = (MATDICij; 1 ≤ in; 1 ≤ j ≤ 9). The MATDIC will experience a normalization operation. Therefore, the final score is calculated for each SV to be able to classify them. The browsing of the decreasing list, which is sorted by a score from highest to lowest, allows proposing to each CV such an SV that its queue contains less than five CVs, and it can satisfy the CV’s requirements.

3.3.1. Normalization

Before combining the performance values, a normalization operation is carried out to obtain a normalized decision matrix that allows all values to be compared. We applied Equation (6) to maximize the beneficial criteria of BandwidthNaaS, Duration_bandwidthNaaS, StorageSaaS, Duration_StorageSaaS and DataDaaS; Equation (7) is applied to minimize the non-beneficial criteria for CostNaaS, CostSaaS and CostDaaS; and to maximize the beneficial criterion DaysSaaS, we used the formula in Equation (8).
M A T D I C n o r m i j = M A T D I C i j M A T D I C j m i n M A T D I C j m a x   M A T D I C j m i n 1   e l s e M A T D I C j m a x   M A T D I C j m i n = 0 i f   M A T D I C j m a x   M A T D I C j m i n 0
M A T D I C n o r m i j = M A T D I C j m a x M A T D I C i j M A T D I C j m a x   M A T D I C j m i n 1   e l s e M A T D I C j m a x   M A T D I C j m i n = 0 i f   M A T D I C j m a x   M A T D I C j m i n 0
M A T D I C n o r m i j = l e n g h t ( M A T D I C i j ) M A T D I C j min . length M A T D I C j m a x . l e n g t h   M A T D I C j min . length 1   e l s e M A T D I C j m a x . l e n g t h   M A T D I C j min . length = 0 i f   M A T D I C j m a x . l e n g t h   M A T D I C j min . length 0
DaysSaaS can be seen as a character string that represents days. For example, 1453 means Sunday, Wednesday, Thursday and Tuesday. Where M A T D I C j m a x . l e n g t h and M A T D I C j m i n . l e n g t h are the max and the min length of the character string of days, respectively.

3.3.2. Performance Score

We assigned a weightage to all criteria to get a weighted normalized decision matrix. In our case, we allocated an equal weightage (Wj) to each criterion, where the sum of all weightage is equal to one. Then, we multiplied the weight of each criterion by its normalized performance values [25]. Finally, we added them for each alternative to get a performance score (PERF), as demonstrated by Equation (9).
P E R F S V i =   j = 1 9 M A T D I C n o r m i j W j   where   j = 1 9 W j = 1
Rankings can be assigned to all SVs’ services in the cloud, based on the performance score to classify all services from best to lowest.

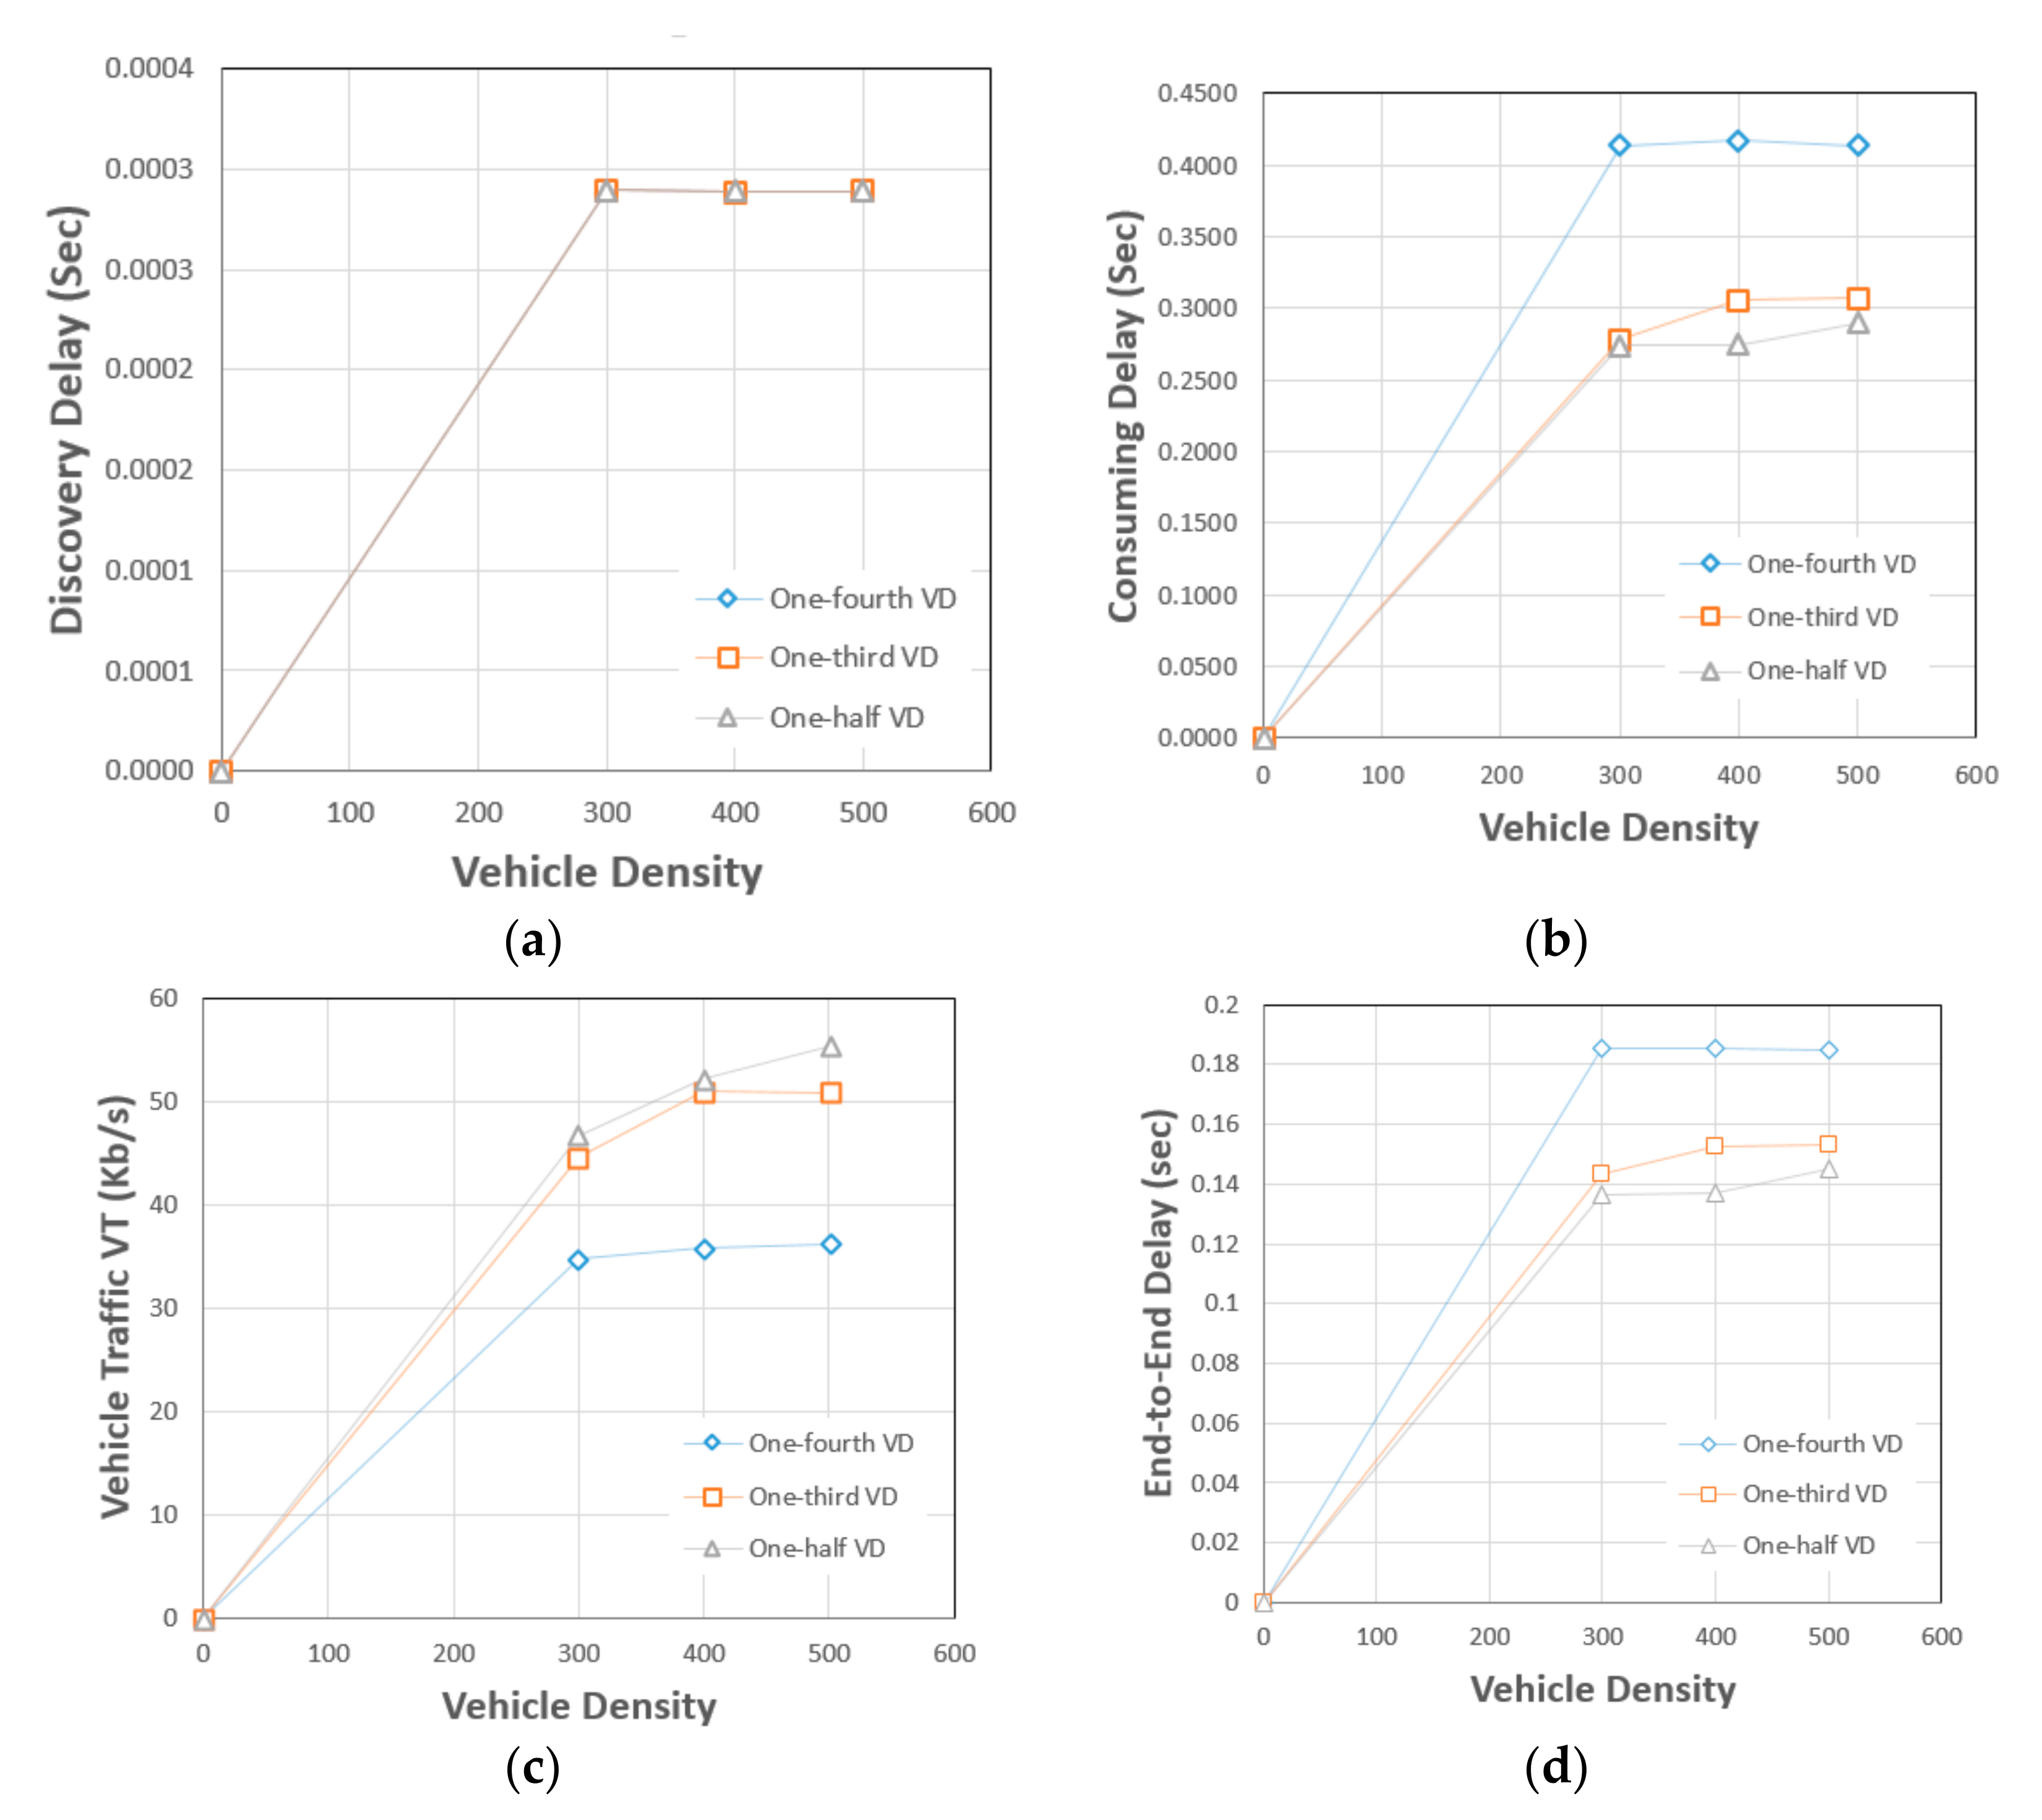
4. Experimental Analysis

4.1. Simulation Setup

To implement and evaluate our proposed protocol RCVC, we used OMNeT++ 5.3 [26] for the behavioral aspect and Sumo-0.32.0 [27] as a mobility simulator. RCVC is deployed in MANHATTEN grid 4 × 4 km2, which contains 16 junctions, where the distance between two junctions is 1 km. We covered this map by thirty (16) RSUs. The vehicle density (VD) is varied between 100 and 500 vehicles taking three ratios of supplier vehicle density: one-fourth, one-third and one-half of VD, in each time we vary the value of VD (100, 300, 400 and 500). The details of the simulation parameters are shown in Table 4.
Based on proven facts, the vehicle’s average speed in Manhattan city is almost 24 k/h [28], this allows determining the value of θ by taking into consideration the distance between the RSUs (equals 1 km). One vehicle that crosses all the distance between two RSUs, it must spend 2.5 min. Therefore, the observation of the following distribution, in Table 5, leads to calculating the median [29]. This allows having a realistic value of θ.
The threshold θ is the median of the distribution that equals 1.5 min.
For the scalability reasons, we have either the VC at the RSU level or the CH’s. The management of queues is accomplished by assigning a value Queue CV to each CV depending on two factors that are the number of vehicles and the number of SVs in the VC at the RSU level or the CH as shown in the formula in Equation (10).
Queue CV   =   N V N SV I f   N SV 1 3 N V 2 N SV I f   1 3 < N SV 1 2 0 O t h e r w i s e
where NV is the number of vehicles and NSV is the number of SVs in the VC.
The value of Numhops is scalable according to the number of vehicles in the cluster. Equation (11) defines its value:
N u m h o p s   = Nv 5
As shown in Table 6, the choice of number five (5) comes from several simulation experiments. If we have less than five (5) vehicles in the cluster, then Numhops = 1; if we have less than ten (10) vehicles and more than five (5) in the cluster, then Numhops = 2 and it makes sense compared to the average speed of vehicles in the MANHATTAN city (24 k/h). Taking the case where the number of vehicles thirty (30) vehicles, the Numhops = 6, and so on.
RCVC’s performance has been evaluated taking these metrics:
(1)
Discovery Delay (DD): the time delay between sending a request packet and receiving a response packet from RSU.
(2)
Consuming Delay (CD): the time delay between sending a request for resources to the SV and receiving three data packets.
(3)
Vehicle Traffic (VT): the average generated, received and forwarded amount of traffic by a vehicle.
(4)
End-to-End Delay (E2ED): the average time delay that a data packet takes to reach the CV from the SV through RSUs and CHs.
To prove the effectiveness of RCVC, we varied the number of supplier vehicles and performed a comparison in terms of DD, CD, VT and E2ED. Then, we compared it with four state-of-the-art protocols, which are the CROWN [12], DCCS-VC [14], FDCCS-VC [13] and TOPVISOR [20] taking the same performance metrics and simulation parameters.

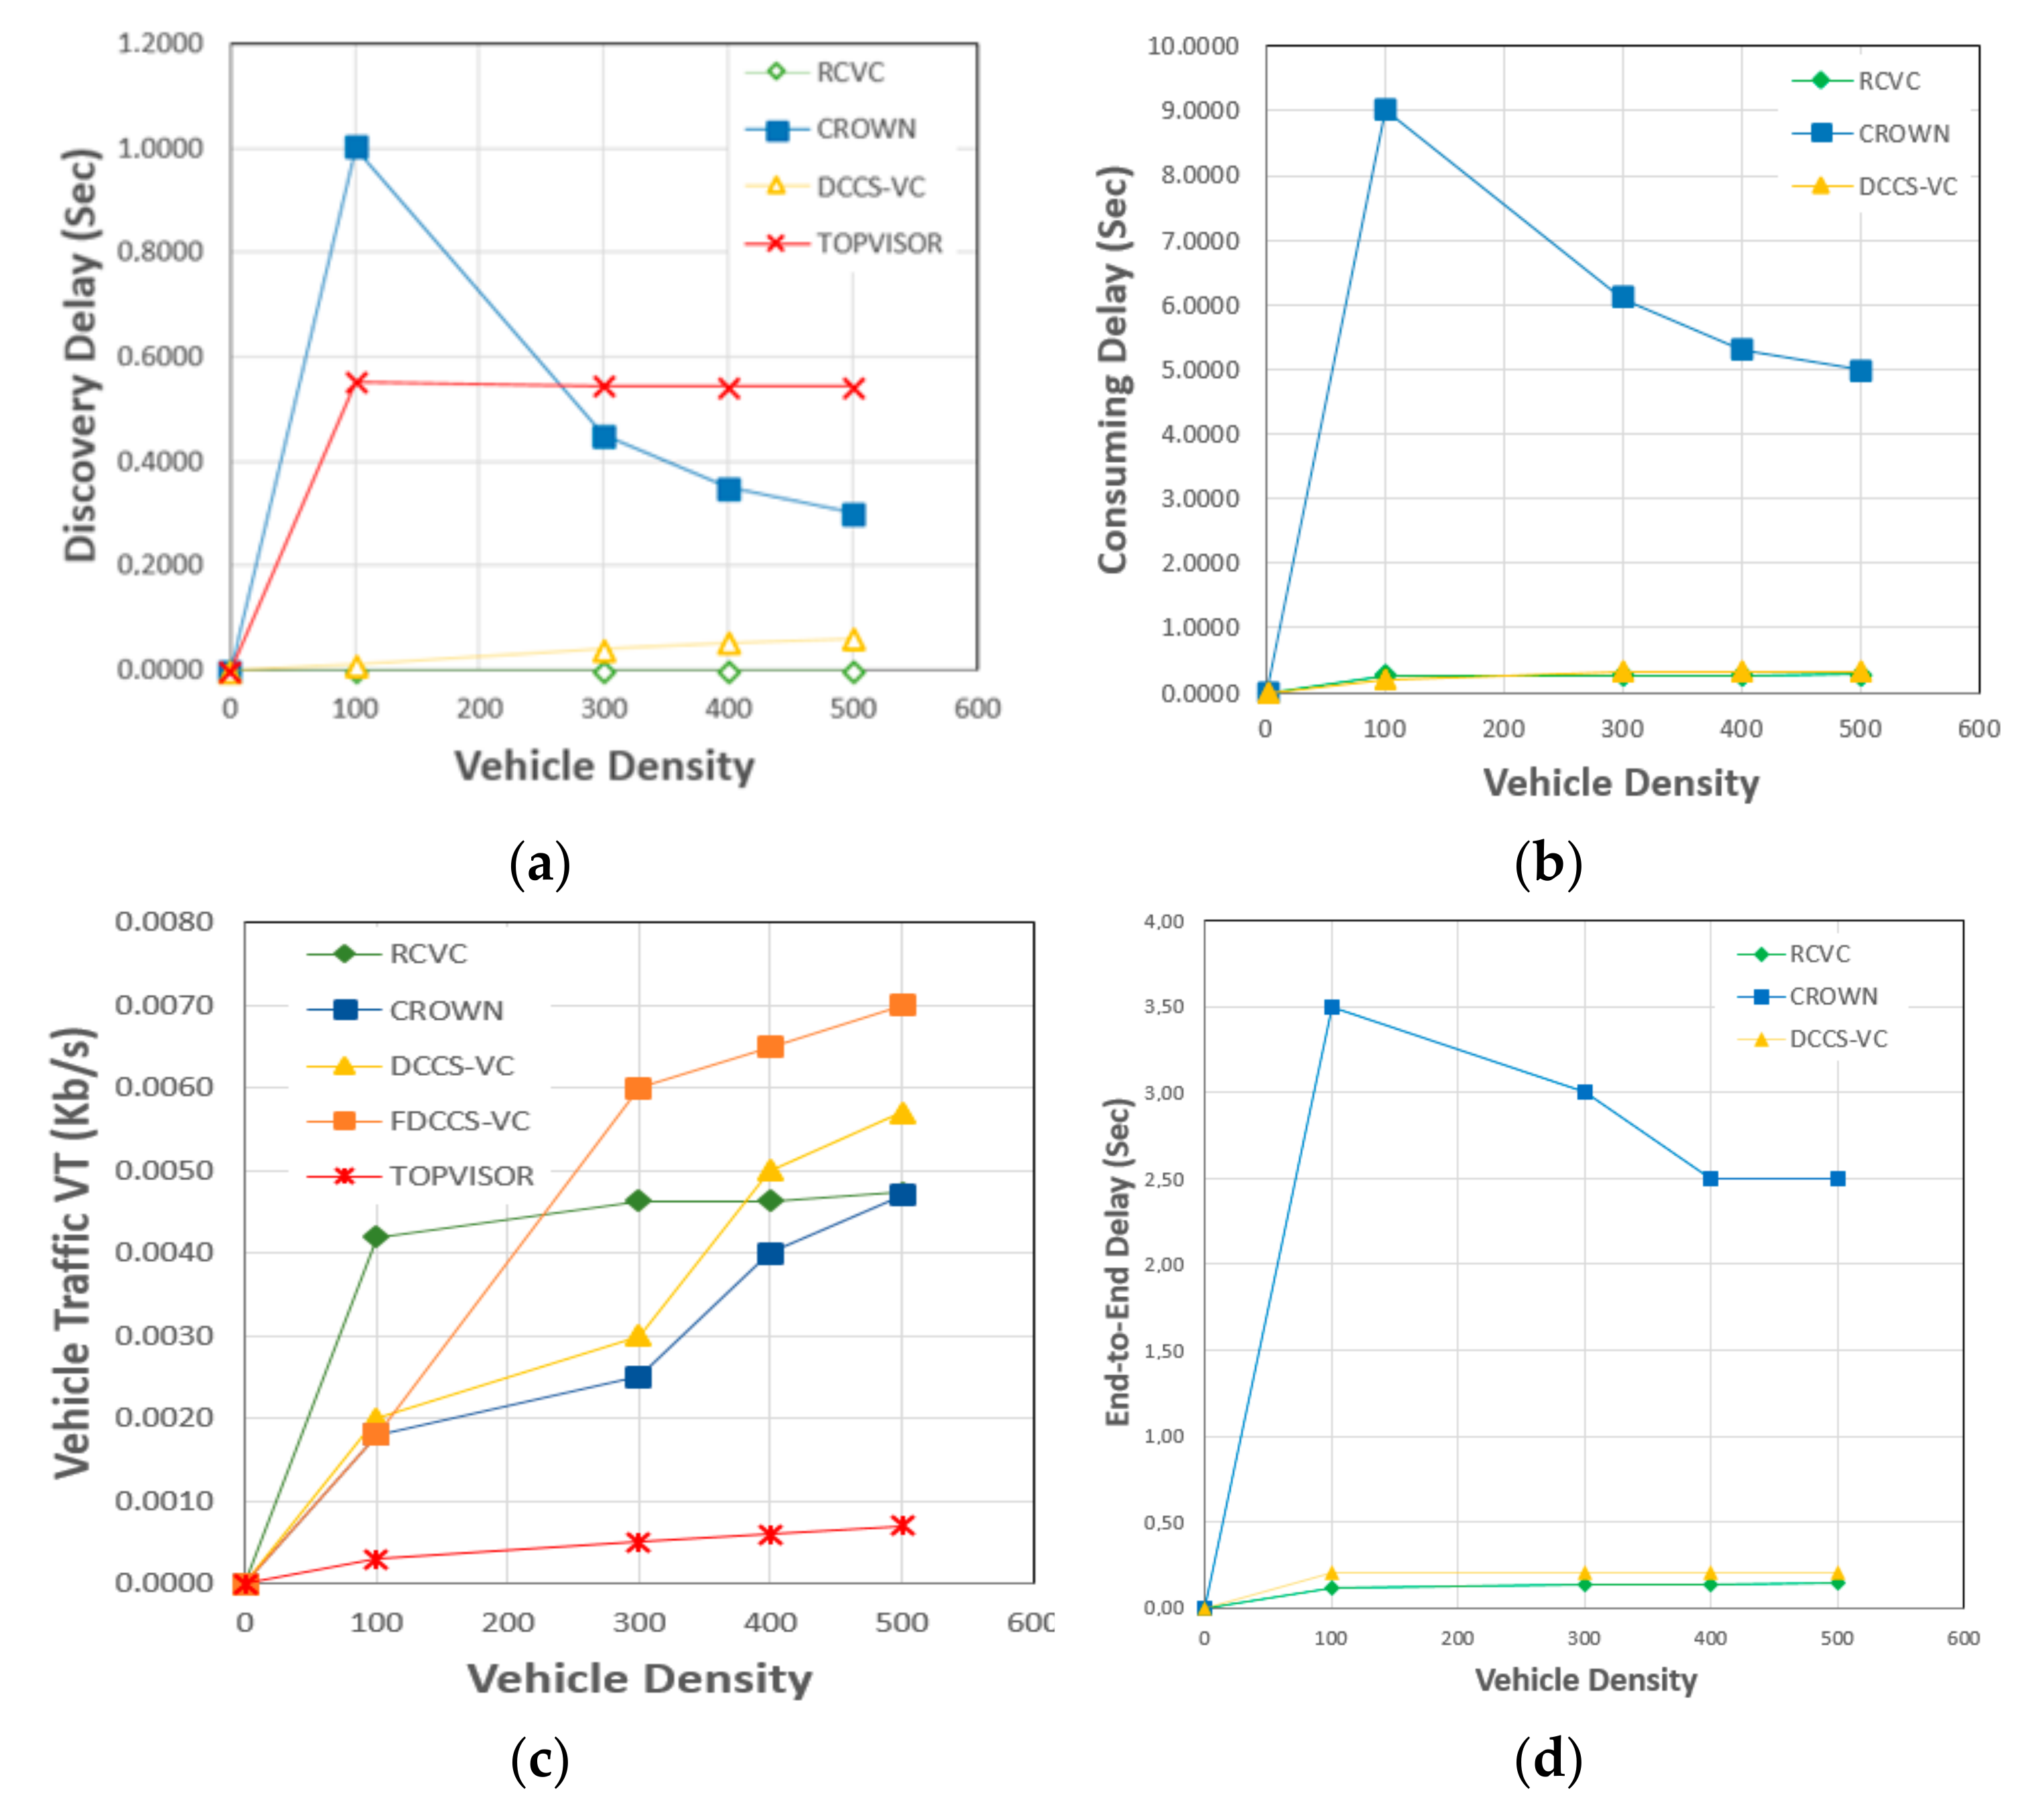
4.2. Results and Discussions

To evaluate the performance of RCVC, we compared three experimental scenarios (one-fourth, one-third and one-half VD), and at the level of each scenario, we take different VDs while using four performance measures.
The DD, CD, VT and E2ED performance metrics were almost stable. Figure 9a shows that varying the number of SVs did not affect the DD because all vehicles continued to send their request packets to the nearest RSUs every 10 s until the acknowledgement was achieved. Note that all request packets did not pass through the neighboring vehicles. We defined WT = 10 s because using a WT greater than that results in bypassing the nearest RSUs as vehicles move quickly, while using WT less than 10 s leads to generating more packets and flooding the network. This WT came for many simulation attempts.
In Figure 9b, the CD decreases when the number of SVs increases; this is attributed to the fact that when the number of SVs increases, there is more chance of finding resources faster. The VT has an ascending slope in Figure 9c, even during varying SV’s number. This fact can be substantiated by the non-relationship between this metric and the number of SVs; it depends on the density of all vehicles. As soon as we increased the VD, the VT increased because more packets were generated and transmitted. Figure 9d shows that the E2ED is strongly related to the number of SV.
RCVC yielded a better result than CROWN, DCCS-VC and TOPVISOR in terms of DD. This outcome can be justified by the use of the routing protocols to route packets between RSUs in the case of CROWN, which is called CAN DELIVER [30], and among buses in case of DCCS-VC that is presented in [31]. Moreover, RCVC has superior performance over TOPVISOR because this latter uses two control levels on top of the RSUs to advertise the VC, as shown in Figure 10a. For the same reason for the CD in Figure 10b, CROWN and DCCS-VC use routing protocols to route all packets from discovery to data consumption. Nevertheless, DCCS-VC has a good result that almost converges into the same RCVC’s outcome, which may be due to the efficiency of its routing protocol between buses.
RCVC provided some improvements to DD because it did not use any routing protocol. When an SV attempts to register their resources or a CV sends requests, they try each time (every 10 s) to find the nearest RSU in their vicinity. Once found, they send their packets that are acknowledged immediately. Even for the CD that yields good results, the reason is that the consumption is achieved either in the cluster that uses only one hop in minimum until six hops in maximum or between RSUs.
In Figure 10c, we measured the VT generated by vehicles through increasing vehicle densities. The objective is to evaluate the protocols by monitoring the stability of the VT, where the best performance is obtained by the protocol that maintains the least traffic generation. Up to 100 vehicles, all protocols generated traffic increasingly. The proposed RCVC protocol provided stable performance in case of density greater than 100 vehicles, unlike the rest of the protocols, they generated more packets. Over 400 vehicles, RCVC performed better than DCCS-VC and FDCCS-VC in terms of VT, and almost the same as CROWN. The reason behind this result is that the exchange of more packets between buses and vehicles by DCCS-VC and FDCCS-CV compared to RCVC, which only transmits packets inside clusters or across the RSUs backbone. Note that CROWN shares the same feature of using RSUs to route packets in case of discovery or consumption. However, TOPVISOR performed better than all protocols in terms of VT because it is dedicated to building the VC, and hence discovering the services it contains; it is not devoted to the consumption operation.
The obtained results, shown in Figure 10d, illustrate that RCVC is always better than CROWN and DCCS-VC in terms of E2ED, which can be justified by the same reason of CD; it is clear that E2ED is a part of the CD.
We can consider Table 7 as a decision matrix that allows applying SAW to select the best protocol among all available alternatives based on various criteria like DD, CD, VT and E2ED.
The normalized decision matrix is shown in Table 8.
The next step is to assign the weightage to each criterion. Here we assign an equal weightage to all criteria, which is 0.25%, and then to multiply each weight with its normalized performance values on solving, we get a weighted normalized decision matrix.
As shown in Table 9, RCVC compared to other protocols has a highest score, which proves better performances considering all metrics.

5. Conclusion

In this paper, we proposed a new protocol that allows building vehicular clouds in an urban area, focusing on Mobile cluster-based vehicular cloud and RSU-based vehicular cloud. This protocol makes the possibility to offer services by supplier vehicles to consumers for effective consumption in real-time. We extend our protocol with a mathematical model for service selection. The clustering mechanism that cooperates with the RSUs yielded a set of improvements in terms of performance evaluation metrics. RCVC’s outcomes were calculated, discussed and compared to four other protocols, which are CROWN, DCCS-VC, FDCCS-VC and TOPVISOR. Finally, the simulation results proved the performance of RCVC in terms of discovery delay, consuming delay, vehicle traffic and end-to-end delay. In addition, unlike the state-of-art solutions, our proposal shows a scalable behavior that is not affected by high vehicle densities. As future work, we will try to extend this protocol, by involving blockchain, UAVs and some security enhancements.

Author Contributions

The major contributions of all the authors are summarized as: The major contributions of all the authors are summarized as: conceptualization—M.B.b.; methodology—C.A.K.; software—M.B.b.; validation—A.K.; formal analysis—M.B.b.; investigation—M.B.b. and A.K.; resources—M.e.A.F.; writing, original draft preparation—M.B.b., A.K., and M.e.A.F.; writing, review, and editing—M.B.b. and C.A.K.; visualization—M.B.b.; supervision—A.K.; project administration—A.K. All authors have read and agreed to the published version of the manuscript.

Funding

This research received no external funding.

Data Availability Statement

The data that support the findings of this study are available from the corresponding author upon reasonable request.

Acknowledgments

The authors would like to thank the General Directorate of Scientific Research and Technological Development, Algeria (DGRSDT), for their support and encouragement.

Conflicts of Interest

The authors declare no potential conflict of interests.

References

  1. Li, L.; Liu, J.; Cheng, L.; Qiu, S.; Wang, W.; Zhang, X.; Zhang, Z. Creditcoin: A privacy-preserving blockchain-based incen-tive announcement network for communications of smart vehicles. IEEE Trans. Intell. Transp. Syst. 2018, 19, 2204–2220. [Google Scholar] [CrossRef] [Green Version]
  2. Hasrouny, H.; Samhat, A.E.; Bassil, C.; Laouiti, A. VANet security challenges and solutions: A survey. Veh. Commun. 2017, 7, 7–20. [Google Scholar] [CrossRef]
  3. Singh, P.K.; Nandi, S.K.; Nandi, S. A tutorial survey on vehicular communication state of the art, and future research direc-tions. Veh. Commun. 2019, 18, 100164. [Google Scholar]
  4. Elhalawany, B.M.; El-Banna, A.A.A.; Wu, K. Physical-Layer Security and Privacy for Vehicle-to-Everything. IEEE Commun. Mag. 2019, 57, 84–90. [Google Scholar] [CrossRef]
  5. Cheek, E.; Alghodhaifi, H.; Adam, C.; Andres, R.; Lakshmanan, S. Dedicated short range communications used as fail-safe in autonomous navigation. Available online: https://doi.org/10.1117/12.2558925 (accessed on 23 April 2020).
  6. Yogarayan, S.; Razak, S.F.A.; Azman, A.; Abdullah, M.F.A.; Ibrahim, S.Z.; Raman, K.J. A Review of Routing Protocols for Vehicular Ad-Hoc Networks (VANETs). In Proceedings of the 2020 8th International Conference on Information and Communication Technology (ICoICT), Yogyakarta, Indonesia, 24–26 June 2020; pp. 1–7. [Google Scholar]
  7. Skourletopoulos, G.; Mavromoustakis, C.X.; Mastorakis, G.; Batalla, J.M.; Dobre, C.; Panagiotakis, S.; Pallis, E. Big Data and Cloud Computing: A Survey of the State-of-the-Art and Research Challenges in Advances in Mobile Cloud Computing and Big Data in the 5G Era; Springer Science and Business Media LLC: Berlin/Heidelberg, Germany, 2017; pp. 23–41. [Google Scholar]
  8. Fernando, N.; Loke, S.W.; Rahayu, W. Mobile cloud computing: A survey. Futur. Gener. Comput. Syst. 2013, 29, 84–106. [Google Scholar] [CrossRef]
  9. Hagenauer, F.; Higuchi, T.; Altintas, O.; Dressler, F. Efficient data handling in vehicular micro clouds. Ad. Hoc. Netw. 2019, 91, 101871. [Google Scholar] [CrossRef]
  10. Brik, B.; Lagraa, N.; Lakas, A.; Ghamri-Doudane, Y. Finding a Public Bus to Rent out Services in Vehicular Clouds. In Proceedings of the 2015 IEEE 82nd Vehicular Technology Conference (VTC2015-Fall), Boston, MA, USA, 6–9 September 2015; pp. 1–7. [Google Scholar]
  11. Qureshi, K.N.; Bashir, F.; Iqbal, S. Cloud Computing Model for Vehicular Ad hoc Networks. In Proceedings of the 2018 IEEE 7th International Conference on Cloud Networking (CloudNet), Tokyo, Japan, 22–24 October 2018; pp. 1–3. [Google Scholar]
  12. Mershad, K.; Artail, H. Finding a STAR in a Vehicular Cloud. IEEE Intell. Transp. Syst. Mag. 2013, 5, 55–68. [Google Scholar] [CrossRef]
  13. Brik, B.; Lagraa, N.; Ghamri-Doudane, Y.; Lakas, A. Finding the most adequate public bus in Vehicular Clouds. In Proceedings of the 2016 International Conference on Wireless Networks and Mobile Communications (WINCOM), Fez, Morocco, 26–29 October 2016; pp. 67–74. [Google Scholar]
  14. Brik, B.; Lagraa, N.; Tamani, N.; Lakas, A.; Ghamri-Doudane, Y. Renting Out Cloud Services in Mobile Vehicular Cloud. IEEE Trans. Veh. Technol. 2018, 67, 9882–9895. [Google Scholar] [CrossRef]
  15. Arkian, H.R.; Atani, R.E.; Kamali, S. FcVcA: A fuzzy clustering-based vehicular cloud architecture. In Proceedings of the 2014 7th International Workshop on Communication Technologies for Vehicles (Nets4Cars-Fall), St. Petersburg, Russia, 6–8 October 2014; pp. 24–28. [Google Scholar]
  16. Arkian, H.R.; Atani, R.E.; Diyanat, A.; Pourkhalili, A. A cluster-based vehicular cloud architecture with learning-based re-source management. J. Supercomput. 2015, 71, 1401–1426. [Google Scholar] [CrossRef]
  17. Azizian, M.; Cherkaoui, S.; Hafid, A. An Optimized Flow Allocation in Vehicular Cloud. IEEE Access 2016, 4, 6766–6779. [Google Scholar] [CrossRef]
  18. Hussain, R.; Abbas, F.; Son, J.; Kim, D.; Kim, S.; Oh, H. Vehicle Witnesses as a Service: Leveraging Vehicles as Witnesses on the Road in VANET Clouds. In Proceedings of the 2013 IEEE 5th International Conference on Cloud Computing Technology and Science, Bristol, UK, 2–5 December 2013; pp. 439–444. [Google Scholar]
  19. Lin, Y.-W.; Shen, J.-M.; Weng, H.-C. Cloud-Supported Seamless Internet Access in Intelligent Transportation Systems. Wirel. Pers. Commun. 2013, 72, 2081–2106. [Google Scholar] [CrossRef]
  20. Kaleibar, F.J.; Abbaspour, M. TOPVISOR: Two-level controller-based approach for service advertisement and discovery in vehicular cloud network. Int. J. Commun. Syst. 2020, 33, e4197. [Google Scholar] [CrossRef]
  21. Nagel, R.; Eichler, S. Efficient and Realistic Mobility and Channel Modeling for VANET Scenarios using OMNeT++ and INET-Framework. In Proceedings of the 1st International Conference on Simulation Tools and Techniques for Communica-Tions, Networks and Systems & Workshops, Marseille, France, 3 March 2008; pp. 1–8. [Google Scholar]
  22. Bouhmala, N. How Good is the Euclidean Distance Metric for the Clustering Problem. In Proceedings of the 2016 5th IIAI International Congress on Advanced Applied Informatics (IIAI-AAI), Kumamoto, Japan, 10–14 July 2016; pp. 312–315. [Google Scholar]
  23. Kerrache, C.A.; Lagraa, N.; Calafate, C.T.; Lakas, A. TFDD: A trust-based framework for reliable data delivery and DoS de-fense in VANETs. Veh. Commun. 2017, 9, 254–267. [Google Scholar] [CrossRef] [Green Version]
  24. Hwang, C.L.; Kwangsun, Y. Multiple criteria decision making. Lect. Notes Econ. Math. Syst. 1981, 186, 58–191. [Google Scholar]
  25. Afshari, A.; Mojahed, M.; Yusuff, R.M. Simple additive weighting approach to personnel selection problem. Int. J. Innov. Manag. Technol. 2010, 1, 511. [Google Scholar]
  26. Omnet++ Network Simulation Framework. Available online: http://www.omnetpp.org (accessed on 12 May 2019).
  27. Sumo, Simulation for Urban Mobility. Available online: http://sourceforge.net/apps/mediawiki/sumo (accessed on 4 December 2019).
  28. Mavromatis, I.; Tassi, A.; Piechocki, R.J.; Sooriyabandara, M. On Urban Traffic Flow Benefits of Connected and Automated Vehicles. In Proceedings of the 2020 IEEE 91st Vehicular Technology Conference (VTC2020-Spring), Antwerp, Belgium, 25–28 May 2020; pp. 1–7. [Google Scholar]
  29. Qi, L.; Gonzalez, C. Math matters: Mathematical knowledge plays an essential role in Chinese undergraduates’ stock-and-flow task performance. Syst. Dyn. Rev. 2019, 35, 208–231. [Google Scholar] [CrossRef]
  30. Mershad, K.; Artail, H.; Gerla, M. We Can Deliver Messages to Far Vehicles. IEEE Trans. Intell. Transp. Syst. 2012, 13, 1099–1115. [Google Scholar] [CrossRef]
  31. Li, T.; Hazra, S.K.; Seah, W. A Position-Based Routing Protocol for Metropolitan Bus Networks. In Proceedings of the 2005 IEEE 61st Vehicular Technology Conference, Stockholm, Sweden, 30 May–1 June 2005; pp. 2315–2319. [Google Scholar]
Figure 1. Vehicular cloud types in RSU-aided Cluster-based Vehicular Cloud (RCVC).
Electronics 10 00193 g001
Figure 2. RCVC Registration/Request packets format.
Electronics 10 00193 g002
Figure 3. Registration and data requests process at the Road Site Unit (RSU) level to enable vehicular clouds.
Electronics 10 00193 g003
Figure 4. Section cluster.
Electronics 10 00193 g004
Figure 5. RCVC protocol packet format. CH, cluster head.
Electronics 10 00193 g005
Figure 6. Sequence diagram of packets exchanged by RCVC.
Electronics 10 00193 g006
Figure 7. State diagram of the supplier vehicle (SV) object.
Electronics 10 00193 g007
Figure 8. State diagram of the consumer vehicle (CV) object.
Electronics 10 00193 g008
Figure 9. Performance evaluation of RCVC while varying the SV density: (a) Discovery Delay. (b) Consuming Delay. (c) Vehicle Traffic. (d) End-to-End Delay.
Electronics 10 00193 g009
Figure 10. Performance evaluation comparisons of RCVC with: (a) CROWN, DCCS-VC and TOPVISOR in terms of Discovery Delay. (b) CROWN and DCCS-VC in terms of Consuming Delay. (c) CROWN, DCCS-VC, FDCCS-VC and TOPVISOR in terms of Vehicle Traffic. (d) CROWN, DCCS-VC in terms of End-to-End Delay.
Electronics 10 00193 g010
Table 1. State-transition table of the SV object.
Current StateEventActionNext State
Initial state Ready to registerWaiting
WaitingJoinRegistration successfulJoining at RSU level
JoinRegistration successfulJoining at CH level
FailRegistration failedRegistration fail
Joining at RSU levelTriggerReady to supply servicesSupply
Joining at CH levelTriggerReady to supply servicesSupply
Supply End of supplyFinal state
Registration failTryAttempt registrationWaiting
Expire timeCancel registrationFinal state
Final state Idle
Table 2. State-transition table of the CV object.
Current StateEventActionNext State
Initial state Attempt registrationWaiting
WaitingJoinRegistration successfulJoining at RSU level
JoinRegistration successfulJoining at CH level
FailRegistration failedRegistration fail
Joining at RSU levelTriggerTrigger consumptionConsumption
Joining at CH levelTriggerTrigger consumptionConsumption
Consumption End of consumptionFinal state
Registration failTryAttempt registrationWaiting
Expire timeCancel registrationFinal state
Final state Idle
Table 3. Quality criteria of SV.
CriteriaDefinitionType
BandwidthNaasAccess bandwidth.Double (bit/s)
Duration_bandwidthNaaSThe offered access bandwidth duration.Double (h)
CostNaaSThe offered bandwidth unit price.Double ($)
StorageSaaSOffered storage.Double (Mo)
Duration_StorageSaaSThe offered storage duration.Double (h)
DaysSaaSMaximum overall storage time.Double (Days)
CostSaaSThe offered storage unit price.Double ($)
DataDaaSData capacity.Double (Mo)
CostDaaSThe offered data unit price.Double ($)
Table 4. Simulation parameters.
ParameterValue
Simulation frameworkVeins (OMNeT++ and Sumo)
Mobility modelManhattan
Simulation time1000 s
Simulation area4 × 4 km2
Transmission range500 m
Transfer rate18 Mb/s
Vehicle density[100–500] vehicles
Vehicles speedUp to 70 km/h
Supplier vehicle density1/4, 1/3 and 1/2 of vehicle density
The size of registration and request packet128 Kbytes
Data Packet Size[1–5] Kbytes
Maximum number of offered services per supplierThree (3) services
Maximum number of requested services per consumerThree (3) services
Table 5. Distribution values of elapsed times to arrive to RSU.
The distance between the vehicle and the next RSU (meters). 200 400 600 800 1000
The elapsed time to arrive near to the next RSU (minutes).0.511.522.5
Table 6. Sufficient number of hops by varying Number of vehicles in a cluster.
Number of vehicles in a cluster 2 to 5 5 to 10 10 to 15 15 to 20 20 to 25 25 to 30
Sufficient number of hops123456
Table 7. A comparative ranking of RCVC with the existing state-of-the-art.
DDCDVTE2ED
RCVC1131
CROWN3323
DCCS-VC2242
FDCCS-VC--5-
TOPVISOR4-1-
Table 8. Normalized decision matrix.
DDCDVTE2ED
RCVC110.51
CROWN0.3300.750
DCCS-VC0.670.330.250.33
FDCCS-VC--0-
TOPVISOR0-0.8-
Table 9. Weighted normalized decision matrix.
Weightage0.25%0.25%0.25%0.25%100%
DDCDVTE2EDPerformance Score
RCVC0.250.250.1250.250.87%
CROWN0.0800.1900.27%
DCCS-VC0.170.080.060.080.40%
FDCCS-VC--0-0%
TOPVISOR0-0,2-0.2%
Publisher’s Note: MDPI stays neutral with regard to jurisdictional claims in published maps and institutional affiliations.

