Article

Multi-Objective Sizing Optimization of Hybrid Renewable Energy Microgrid in a Stand-Alone Marine Context

1
School of Power and Mechanical Engineering, Wuhan University, Wuhan 430072, China
2
Intelligent Power Equipment Technology Research Center, Wuhan University, Wuhan 430072, China
3
School of Electrical and Electronic Engineering, Hubei University of Technology, Wuhan 430068, China
*
Author to whom correspondence should be addressed.
Electronics 2021, 10(2), 174; https://doi.org/10.3390/electronics10020174
Submission received: 21 December 2020 / Revised: 6 January 2021 / Accepted: 11 January 2021 / Published: 14 January 2021
(This article belongs to the Section Systems & Control Engineering)

Abstract

:
Islands are the main platforms for exploration and utilization of marine resources. In this paper, an island hybrid renewable energy microgrid devoted to a stand-alone marine application is established. The specific microgrid is composed of wind turbines, tidal current turbines, and battery storage systems considering the climate resources and precious land resources. A multi-objective sizing optimization method is proposed comprehensively considering the economy, reliability and energy utilization indexes. Three optimization objectives are presented: minimizing the Loss of Power Supply Probability, the Cost of Energy and the Dump Energy Probability. An improved multi-objective grey wolf optimizer based on Halton sequence and social motivation strategy (HSMGWO) is proposed to solve the proposed sizing optimization problem. MATLAB software is utilized to program and simulate the optimization problem of the hybrid energy system. Optimization results confirm that the proposed method and improved algorithm are feasible to optimally size the system, and the energy management strategy effectively matches the requirements of system operation. The proposed HSMGWO shows better convergence and coverage than standard multi-objective grey wolf optimizer (MOGWO) and multi-objective particle swarm optimization (MOPSO) in solving multi-objective sizing problems. Furthermore, the annual operation of the system is simulated, the power generation and economic benefits of each component are analyzed, as well as the sensitivity.

1. Introduction

Under the multiple pressures of economic growth, energy shortage and environmental protection, marine resources will be an important guarantee for human survival and sustainable development in the coming century. The 13th Five-Year Plan for China’s Marine Economic Development [1] points out that the ocean is an important strategic space for China’s economic and social development. It is necessary to seize the great opportunity of the “21st Century Maritime Silk Road” [2], adhere to the basic principle of “green development and ecological priority”, strengthen the development and construction of islands, accelerate the development and utilization of marine renewable energy. China has more than 3.4 million km 2 of sea area and 7300 islands larger than 0.5 km 2 , including more than 400 inhabited islands, facing a serious shortage of water and electricity supply [3,4]. Islands are indispensable platforms for shipping industry, global trade, national security, scientific research and marine exploration. It has great significance to study and build a clean and reliable island microgrid. Nevertheless, the proper sizing of system components is a key factor for system’s techno-economic feasibility.
Governments and research institutes around the world have carried out a series of studies, demonstrations and experiments on sizing optimization of island hybrid renewable energy systems [5]. Eco-grid EU project had been built and studied on the Danish island of Bornholm for smart grid demonstration, including a hybrid wind, biogas, photovoltaic, cogeneration, diesel, fuel cell and storage bank energy system [6]. Literature [7] introduced the energy system integration of Maui Island, Hawaii, which consists of oil-fired power plants, large diesel-fueled units, biomass-fueled power plant, wind plants, grid-connected PV systems, and battery energy storage system. A large amount of wind power produced on Maui is curtailed because the power cannot be accommodated by the existing power grid. Literature [8] shared the real case of the Caribbean island of St. Eustatius, presented the design and performance results of a MW-sized photovoltaic (PV), battery storage system (BSS), and diesel genset hybrid system, which has been now in operation for over 2 years. Literature [9] analyzed the economic benefits of replacing pure diesel generators with a hybrid photovoltaic diesel system in a remote island of the Philippines and showed that the energy cost could be reduced by 70%. Research on sizing optimization and system construction of island hybrid energy microgrids had also been carried out by many other countries and regions according to the literature [10,11,12].
In terms of sizing optimization objectives and methods, Abo-Elyousr et al. presented a method for the optimal configuration of a hybrid microgrid system, which investigated a bi-objective based optimization algorithm to reduce cost, emissions, and a combined solution between cost and emissions [13]. Tawil et al. presented a case study of a hybrid microgrid on the island of Ouessant in France, including wind turbines, tidal turbines, diesel generators and pumped storage power stations. The main sizing constraint is to achieve a compromise between the hybrid system overall cost, for a period of 15 years, and the C O 2 emission minimization [14]. Mahesh et al. proposed a photovoltaic, wind, storage grid connected system, the genetic algorithm was used to solve the sizing optimization problem with the objective of minimizing the average energy cost [15]. Zhu et al. proposed a sizing optimization method based on improved grey wolf optimization algorithm for island hybrid energy microgrid. The optimization objective was to compromise the minimum annualized cost of system and the minimum deficiency of power supply probability [16]. Mahesh et al. proposed an advanced Pareto-front non-dominated sorting multi-objective particle swarm optimization method for optimal configuration (placement and sizing) of distributed generation (DG) in a radial distribution system [17]. Yilmaz et al. optimized a hybrid energy system composed of photovoltaic, diesel generator and battery bank by using the Homer software, and the optimal scale of the system was solved with the objective of minimum investment cost [18].
The existing research on sizing optimization and calculation method of island hybrid renewable energy systems has made significant progress but shows some limitations in the following aspects. Firstly, the present power supply of offshore islands mostly depends on diesel generators, which causes high cost of fuel transportation and serious environmental pollution. This is contrary to the principles of low-carbon development and ecological protection advocated worldwide [19]. Secondly, current sizing optimization methods of hybrid energy system mainly use single objective optimization, some use bi-objective optimization, few studies consider tri-objective optimization. Island energy system sizing is an extremely complex problem, which requires comprehensive consideration of various factors in order to adapt to local conditions and obtain the most appropriate optimization results. Thirdly, in marine conditions, in view of the special geographical environment of islands, few studies have considered the contradiction between the lack of land resources and the land demand for generation plants construction. Most of the current studies only consider solar energy, onshore wind energy, hydro energy, pumped storage energy, solar thermal energy, biomass energy and other conventional land-based energy, while ignoring the abundant marine energies, such as tidal current energy, which does not suffer the scarcity of land needed for building the generation plants [20]. Taking the South China Sea as an example, the area of most major islands in the South China Sea is no more than 0.5 km 2 . Many islands come from reclamation, having no possibility to build large-scale land-based power stations [21]. The strategic status of islands highlights its important roles in marine economy, marine exploration, scientific research and militarization. Precious land resources should be the key consideration in sizing optimization of island microgrid. With the improvement of marine energy technology and equipment manufacturing technology [22], marine energy holds the highest opportunity given the wide abundance of the energy source, and has become the best choice on the table for building island renewable energy microgrid.
In this paper, based on the current research results, land demand is taken as one of the key considerations of component selection in the energy system. An island hybrid renewable energy microgrid composed of wind turbines, tidal current turbines, and battery storage systems is constructed based on the abundant wind and tidal energy resources in the ocean. A tri-objective optimization model including minimizing the Loss of Power Supply Probability (LPSP), the Cost of Energy (COE) and the Dump Energy Probability (DEP) is established. An improved Multi-Objective Grey Wolf Optimizer based on Halton sequence and social motivation strategy (HSMGWO) is proposed to solve the proposed sizing optimization problem. MATLAB software is utilized to program and simulate the optimization problem of the hybrid energy system. A case study is carried out and analyzed to verify the feasibility of the sizing optimization method.
This paper is organized as follows. Section 2 describes the mathematical model of each component of the hybrid energy system. The energy management strategy, description of objective functions and constraints, and modeling of optimization problems are presented in Section 3. Section 4 is dedicated to the improvement of multi-objective grey wolf optimizer to solve the tri-objective optimization problem, and its performance verification. The simulation results are discussed in Section 5 to illustrate the performance of the proposed method, the benefit analysis and sensitivity analysis of each component are carried out. The conclusion is presented in the last section. The workflow of this paper is presented in Figure 1.

2. Selection and Modeling of System Components

In this paper, an island in Zhoushan Archipelago of China is taken as a case study to build an island hybrid renewable energy microgrid. The primary task is to select the appropriate energy combination scheme according to the natural renewable resources.

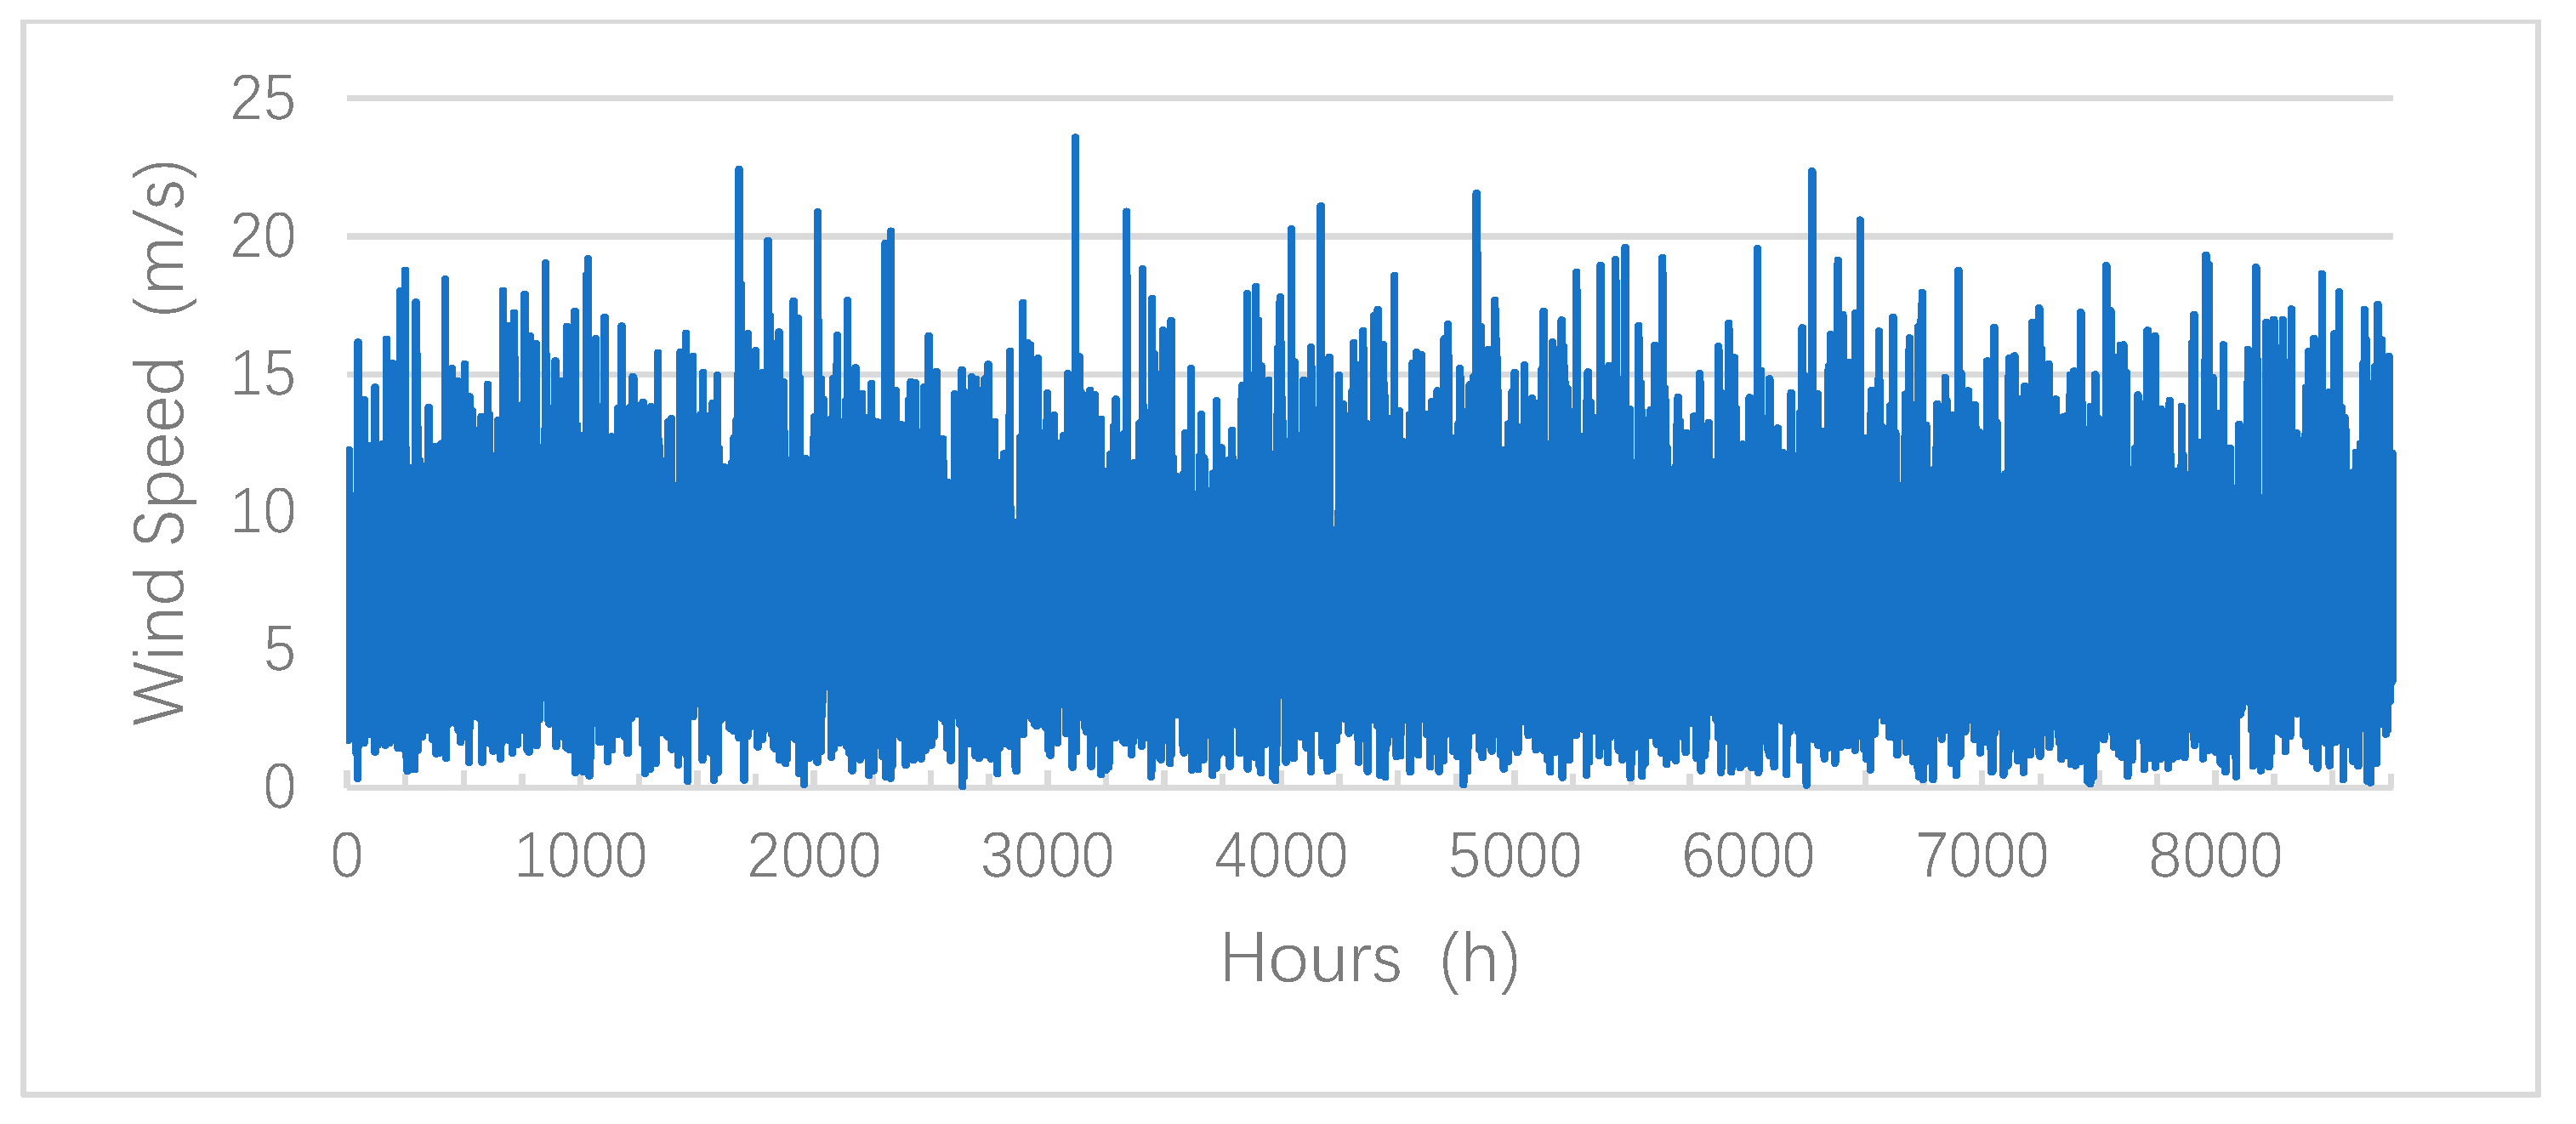
2.1. Resources Characterization and Components Selection

Figure 2 shows the map of the studied site [23]. Considering the limitation of the precious island land resources, the offshore generation components should be selected in the first instance. Therefore, land-based photovoltaic, solar thermal, hydropower, pumped storage, tidal energy and other conventional renewable energies that need a lot of land resources will not be given priority. The available marine renewable energy resources of the studied site mainly include solar energy, wind energy, tidal current energy and wave energy. According to the evaluation of references [24,25], the island is rich in wind energy resources with great wind energy quality. A large tidal energy reserve exists in the sea area, which has great exploration and utilization value. Figure 3 presents the annual wind speed curve of a typical year at the studied site. The historical data are obtained from the database of NOAA’s National Centers for Environmental Information [26]. Figure 4 presents the annual tidal current speed curve, which is simulated according to the historical data in reference [25]. It is worth mentioning that the solar energy and wave energy resources of the studied site have certain exploration and utilization value. However, offshore floating photovoltaic and wave energy generation would not be taken into consideration because of the low technology maturity and high energy cost [27].
In this study, offshore wind energy and tidal current energy are selected as distributed generation sources. Meanwhile, in order to avoid the continuous utilization of diesel generators, the mature battery storage system is selected to stabilize the fluctuation of renewable energy and improve the system reliability and resources utilization rate. The proposed island renewable energy microgrid is presented in Figure 2, which consists of offshore wind turbines (WT), tidal current turbines (TCT), battery storage systems (BSS) and other indispensable components such as inverters and transformers. The detailed modeling of the system major components is presented hereafter.

2.2. Wind Turbine Model

The model of power output generated by the wind turbine can be expressed as the following equation.
P w = 1 2 C p w ρ w v w 3 π r 2
where C p w is the power coefficient of the wind turbine, ρ w is the air density, r is the radius of wind turbine blades, v w is the wind speed. The relationship between the power output of wind turbine and wind speed can be expressed as a piecewise function, which is determined by different wind speed intervals. When the wind speed is in the range of cut-in speed and rated speed, the output power is the product of rated power and efficiency coefficient. When the wind speed is in the range of rated speed and cut-out speed, the wind turbine outputs rated power [28].
P wt = { 0 , 0 v v c i P r v     v c i v r     v c i , v c i v v r P r , v r v v c o 0 , v c o v
where v is the wind speed, v c i , v c o and v r are the cut-in wind speed, rated wind speed and cut-out wind speed, P r is the rated electrical power.

2.3. Tidal Current Turbine Model

The astronomical nature of tides is determined by the gravitational interaction between the earth, the moon and the sun. There are two flood tides, and two ebb tides every day. The spring tide and neap tide appear periodically. The strength of tides varies according to the distance, relative position and angle between the moon, the sun and the earth. The power generated by a tidal current turbine can be estimated by the following equation [29].
P t c t = 1 2 C p t ρ t A v t i d 3
where C p is the power coefficient of TCT, which is essentially the ratio of the mechanical power obtained by TCT, taking into account the conversion efficiency. ρ is the density of seawater, A is the cross-sectional area of TCT, v t i d is the tidal current velocity. The periodic variation of tidal current velocity v t i d can be simplified as the following equation.
v = V m ( 1   +   K 2 π t T ) sin 2 π t T
where T is the period between spring tide and neap tide, T is the period of tidal current, V m is the average velocity of tidal current calculated by ( V s   +   V n ) / 2 , V s and V n are the maximum velocity of spring tide and neap tide, K is the wave coefficient of tidal current, calculated by ( V s     V n ) / ( V s   +   V n ) .

2.4. Battery Storage System Model

Energy storage system can smooth the fluctuation of distributed generation, enhance the system schedulability and improve the reliability of system operation. BSS is the most flexible, reliable and mature system among various storage technologies. The capacity of the battery storage system can be expressed by the following equation [30].
P b s s = A d × P l η b s s × η i n v × D O D
where A d is the desired autonomy day, which means the maximum number of days that the battery can provide continuous energy without charging, P l is the daily power demand, η b a t is the battery efficiency, η i n v is the conversion efficiency of the inverter, D O D is the maximum allowable depth of discharge.
SOC is the battery state of charge, which is usually used to indicate the remaining capacity of the battery. The S O C ( t ) at time t is given by [31]:
S O C ( t ) = S O C ( t     1 ) ( 1     σ )   +   P b ( t ) × η b s s
where σ and η b a t are the self-discharge rate and efficiency, P b ( t ) is the difference between total generation power and the demand power P l considering the efficiency factor, given by:
P b ( t ) = ( P w t ( t )   +   P t c t ( t ) )     P l ( t ) η i n v

3. Objective Functions and Constrains

3.1. Optimization Objectives

The purpose of establishing renewable energy microgrid with WTs, TCTs and BSSs is to provide electricity for isolated islands and ensure that the energy system has high reliability level, low energy cost and high energy utilization rate. Review literatures [32] summarized the sizing optimization objectives and methods of hybrid energy microgrid, among which economy, reliability, energy utilization and pollution indexes are most commonly utilized. In this paper, the Loss of Power Supply Probability (LPSP), the Cost of Energy (COE) and the Dump Energy Probability (DEP) are selected as optimization objectives.

3.1.1. Loss of Power Supply Probability

Reliability is the basis of system operation. In this paper, the Loss of Power Supply Probability (LPSP) is used as the evaluation index of system reliability. LPSP indicates the extent to which power generation fails to match the load demand. LPSP can be defined as total power supply failure time divided by the total reporting time [33]:
LPSP = t = 1 T P l o s s ( t ) × Δ t T
where P l o s s ( t ) is the probability that the load exceeds the power supply at time t , Δ t is the step size that is usually taken as 1 h ; T is the total duration that is generally taken as 8760 h .

3.1.2. Cost of Energy

The Cost of Energy (COE) is the ratio of the annual cost of the system to the power generation. COE comprehensively considers the system investment, operation and maintenance costs, annual power generation, and economic factors such as annual interest rate. COE can reasonably reflect the economic benefits of the system. The mathematical model can be expressed as follows [34]:
C O E ( x ) = i = 1 n ( I C , i x i × C R F ( r , y )   +   R C , i x i × S F F ( r , y i )   +   O M C , i x i ) i = 1 n P O , i x i
where x i is the number of component i , n is the number of component types, I C , i is the annualized capital cost, R C , i is the annualized replacement cost, O M C , i is the annualized operation and maintenance cost, P O , i is the annual power generation. C R F is the capital recovery factor and S F F is the sinking fund factor calculated by the following equations.
C R F ( r , y ) = r ( 1   +   r ) y ( 1   +   r ) y     1
S F F ( r , y i ) = r ( 1   +   r ) y i     1
where r is the discount rate, which is calculated as 6.7% according to the interest rate of the PBOC, y is the lifespan of the project, which is 20 years in this paper, y i is the lifespan of the component.

3.1.3. Dump Energy Probability

Due to the inherent intermittently of renewable energy, excessive pursuit of reliability will lead to large-scale abandonment of wind energy and tide current energy. The more balanced way of optimization is to take the renewable energy utilization rate into consideration [35]. In this paper, it is measured by Dump Energy Probability (DEP), which can be calculated by the following equation.
DEP = 0 T P dp ( t ) 0 T P re ( t )
where P dp ( t ) is the dumped power of energy system at time t , P re ( t ) is the total power generated by energy system at time t .

3.2. Objective Function and Constraints

Based on the above discussion, the optimization objective function of island renewable energy system based on minimum LPSP, minimum COE and minimum DEP is as follows:
min { LPSP , COE , DEP }
The multiple objectives of sizing optimization are subjected to a number of constraints including supply-demand balance, generation unit boundaries and the BSS constraints. These constraints are explained in detail below.

3.2.1. Variable Constraints

The system variables, i.e., the number of system components (WT, TCT, BSS), should be defined with reasonable maximum value, expressed as:
{ 0 x w t x w t , m a x 0 x t c t x t c t , m a x 0 x b s s x b s s , m a x

3.2.2. Generation Unit Boundaries

The output of each generation unit at any time shall be within the range of minimum and maximum values, expressed as:
{ P w t , m i n P w t ( t ) P w t , m a x P t c t , m i n P t c t ( t ) P t c t , m a x

3.2.3. Supply-Demand Balance

The total power provided by the microgrid system should always match the load demand, expressed as:
P s u p ( t ) = P l ( t )

3.2.4. BSS Constraints

The SOC of the BBS remains between the minimum and maximum values, which can be expressed as:
S O C m i n S O C ( t ) S O C m a x
S O C m a x = C b a t
S O C m i n = ( 1     DOD ) × S O C m a x

3.3. Energy Management Strategy

The criteria for the establishment of island renewable energy microgrids include maximum utilization of renewable energy, reliable power supply, reduction of energy cost, etc. The inherent intermittently of renewable energy will lead to the mismatch between the total power generated by the system and the load demand. In some cases, the load demand may be exceeded, and in other cases, the load demand may not be matched. Energy management of hybrid energy system is the basic guarantee for economical operation. BSS can store the surplus energy when the power supply is excessive, and timely supplement the power shortage when the power supply is insufficient. The energy management strategy proposed in this paper is as follows.
  • Renewable energy power generation is enough to match the load demand.
  • If the BSS is not fully charged at this time, the excess power generation will charge the BSS.
  • If the BSS is fully charged at this time, the renewable energy output will be reduced to match the load. Record the dump energy.
2.
Renewable energy power generation is not enough to match the load demand.
  • If the BSS is available at this time, the BSS will discharge to match the load demand.
  • If the BSS is not available at this time, the unsatisfiable load will be cut off. Record the failure time of power supply.

4. Improved Multi-Objective Grey Wolf Optimizer

The sizing optimization of a hybrid energy system is a typical multi-objective optimization problem that contains mutually exclusive optimization objectives, multiple variables and constraints. Multi-objective optimization can be formulated as a maximization or minimization problem. The solution set of multi-objective optimization problem can be represented by Pareto optimal front, which is a set containing the corresponding objective values of Pareto optimal solutions. In order to obtain the Pareto optimal front of the multi-objective sizing optimization problems, an improved Multi-Objective Grey Wolf Optimizer based on Halton sequence and social motivation strategy (HSMGWO) is proposed.

4.1. Multi-Objective Grey Wolf Optimizer

Grey wolf optimizer (GWO) is a powerful meta-heuristic algorithm [36], which has competitiveness in terms of solution accuracy, minimum computational effort, and aversion of premature convergence. According to the social grade of grey wolf colony, GWO divides the wolf pack into four pyramid population hierarchies, namely, α , β , δ , and ω . The global optimization is realized by imitating the predatory behaviors of grey wolves such as searching, tracking, encircling, chasing and attacking. In the GWO, the position of a wolf is the vector of system variables, and the prey corresponds to the objective function. The algorithm simulates the hunting process by constantly updating the location of wolf pack (set of the variables) in each iteration to obtain the Pareto optimal front (non-dominated solutions set). The optimization process is mainly guided by the best three solutions ( α , β , and δ ). The mathematical model of predatory behaviors is expressed as follows:
D = C · X p ( t )     X ( t )
X ( t   +   1 ) = X p ( t )     A · D
A = 2 a · r 1     a
C = 2 r 2
a = 2     t × 2 M a x i t e r
where t is number of iterations, A and C are the coefficient vectors; X p is the position vector of the prey, X ( t ) is the position vector of the wolf, M a x i t e r is the total number of iterations allowed for the optimization, r 1 and r 2 are the random vector in [ 0 , 1 ] .
Figure 5 illustrates the location updating mechanism of grey wolf. The mathematical model can be expressed as follows:
D α = C 1 · X α     X ,     D β = C 2 · X β     X ,     D δ = C 3 · X δ     X
X 1 = X α     A 1 · D α ,     X 2 = X β     A 2 · D β ,     X 3 = X δ     A 3 · D δ
X ( t   +   1 ) = X 1   +   X 2   +   X 3 3
where X α , X β , X δ are the positions of α , β , δ , X represents the position of the wolf, D α , D β , D δ , respectively represent the distance between the current candidate and the three optimal wolves.
In order to solve the multi-objective optimization problem, Mirjalili et al. developed a multi-objective grey wolf optimizer (MOGWO) by integrating two new components into GWO algorithm [37]. The first component is the external archive, which stores the non-dominated Pareto optimal solutions obtained so far. The second component is the leader selection mechanism, which selects the appropriate leader from all the non-dominated optimal solutions obtained in the external archive by roulette. The probability of being selected can be calculated by the following equation.
P j = ( 1 N j ) C
where C is a constant greater than 1, and can be configured according to requirements, N j is the total number of individuals in this segment.

4.2. Improvement of MOGWO

MOGWO algorithm is essentially an intelligent algorithm based on population. The quality of initial population has a great impact on the optimization effect and solution set. However, population diversity cannot be guaranteed by random initialization. Meanwhile, the wolf pack location is updated strictly by the guidance of α , β , δ wolves, which makes the algorithm easy to fall into local optimum. Aiming at these weaknesses, this paper introduces Halton sequence initialization and social motivation strategy to propose an improved multi-objective grey wolf optimization algorithm (HSMGWO).

4.2.1. Halton Sequence Initialization

In this paper, Halton sequence is used to improve population initialization instead of the original random initialization. Halton sequence is a well-known multi-dimensional low-discrepant sequence which can generate evenly distributed set of points in the search space [38]. An M-dimensional Halton sequence can be expressed as follows:
H M ( n ) = { ϕ p 1 ( n ) ,   ϕ p 2 ( n ) ,   , ϕ p M ( n ) } ,   n = 1 ,   2 ,   ,   N
where p i is a prime number, ϕ p i ( n ) is the base inverse function of p i , which can be expressed as follows:
ϕ p i ( n ) = b 0 / p i   +   b 1 / p i 2   +     +   b m / p i m   +   1
For a grey wolf population with dimension M , the location range is [ x m i n , x m a x ], h m is a random number generated by Halton sequence, and the individual initial position can be expressed as follows:
x M ( 0 ) = x m i n   +   h m ( x m a x     x m i n )
The two-dimensional point sets generated by the random method and Halton sequence are shown in Figure 6. Compared with the random method, the individuals generated by Halton sequence are more evenly distributed without aggregation, and the numbers of individuals in different intervals are more average. The results show that Halton sequence can generate individuals with better distribution uniformity.

4.2.2. Social Motivation Strategy

In MOGWO, wolves are only guided by three leaders ( α , β , δ ). This monotonous location update strategy will lead to the loss of population diversity, poor global exploration ability and slow convergence speed. In this paper, social motivation strategy is introduced to update the position of the wolf pack in each iteration referring to the idea of Chimp optimization algorithm (ChOA) [39]. Social motivation includes social status competition and sexual motivation, which leads to the chaos of gray wolves. The wolves may not accept the guidance of the leaders and release their responsibilities during the hunt. This chaotic behavior helps the algorithm to improve the ability to jump out of local optimum and deal with high-dimensional problems. According to the evaluation of reference [40], the Gauss/mouse chaotic map with an initial value of 0.7 is selected to improve the algorithm, which can be expressed as follows:
x i   +   1 = { 1                                           x i = 0 1 m o d ( x i , 1 )                           o t h e r w i s e
In order to simulate this social motivation strategy, it is assumed that there is a 50% probability for wolves to choose between the normal update model and the chaotic update model in the optimization process. The mathematical model is represented by the following equation.
x ( t   +   1 ) = { X p ( t )     A · D                 μ < 0.5 X p ( t )     A · D m                         μ 0.5
D m = X p ( t )     m · X ( t )
where μ is a random number between [ 0 , 1 ] , m is the chaotic vector calculated based on the Gauss/mouse chaotic map.

4.3. Verification of HSMGWO

Two standard multi-objective test functions are selected to verify the performance of HSMGWO. The benchmark problems are provided as follows.
DTLZ 1 :
{ min f 1 ( x ) = 0.5 x 1 x 2 ( 1   +   g ( x ) ) min f 2 ( x ) = 0.5 x 1 ( 1     x 2 ) ( 1   +   g ( x ) ) min f 3 ( x ) = 0.5 ( 1     x 1 ) ( 1   +   g ( x ) ) g ( x ) = i = 3 12 ( x i     0.5 ) 2     cos ( 20 π ( x i     0.5 ) ) S . T . 0 x i 1 ( i = 1 , 2 , , 12 )
DTLZ 2 :
{ min f 1 ( x ) = ( 1   +   g ( x ) ) cos ( x 1 π 2 ) cos ( x 2 π 2 ) min f 2 ( x ) = ( 1   +   g ( x ) ) cos ( x 1 π 2 ) sin ( x 2 π 2 ) min f 3 ( x ) = ( 1   +   g ( x ) ) sin ( x 1 π 2 ) g ( x ) = i = 3 12 ( x i     0.5 ) 2 S . T . 0 x i 1 ( i = 1 , 2 , , 12 )
In order to evaluate the performance of the improved algorithm, the HSMGWO is compared to the MOGWO and the well-known algorithm MOPSO with the performance index of Inverted Generational Distance (IGD). IGD can reflect the convergence and coverage of the algorithm. The smaller value of IGD indicates that the calculation result of the algorithm is closer to the real Pareto front. The mathematical formula of this index is as follows.
I G D = i = 1 n d i n
where n is the number of true Pareto optimal solutions and d i indicates the Euclidean distance between the i th true Pareto optimal solution and the closest obtained Pareto optimal solution in the reference set.
The computational complexity of HSMGWO is of O   ( mn 2 ) where n is the number of individuals in the population and m is the number of objectives. The complexity is equal to MOGWO and MOPSO. The standard multi-objective test functions were independently calculated by HSMGWO, MOGWO and MOPSO for 30 times. The maximal number of the solutions in the approximate set produced by each algorithm were set to 200, The averages of IGD were taken as the performance indicators of the evaluation algorithm in order to restrict the influence of random effects. The simulation results obtained by three optimization algorithms are shown in Figure 7 and Figure 8.
Obviously, the improved HSMGWO shows better convergence and coverage than standard MOGWO and MOPSO. The Pareto optimal solutions of HSMGWO are closer to the true Pareto optimal front and highly distributed along all objectives. Although there are discontinuities on the Pareto optimal front of HSMGWO, the coverage of the whole front is broader on all the test functions. The solution sets provide superior convergence and uniform distribution, due to the improvement of the Halton Sequence Initialization and the social motivation strategy. The IGD results are listed in Table 1.
In the initialization stage of MOGWO, the position of wolf pack is generated randomly, which can easily lead to uneven population distribution, and seriously affect the solution quality and optimization efficiency. The population initialization method improved by the low-differential Halton sequence can obtain a more uniform initial population, significantly improve the population diversity and the optimization efficiency of the algorithm, effectively avoid falling into local optimization, and ensure the basic solution quality of the algorithm.
Improved by social motivation strategy, the position updating with a certain probability of chaotic state as the external performance prevents wolves from quickly becoming trapped in local optimum, improves the global exploration ability and convergence efficiency of the algorithm, and significantly improves the optimization effect of the algorithm for multi-dimensional complex optimization problems. In essence, social motivation strategy provides soft transition between global and local search ability. In this way, wolves tend to broadly discover promising regions of search space and exploit the best one. These superior results are based on the special form of the Gauss/mouse map. In early stage it has large and extremely variable amplitude, while its amplitude and variableness decrease severely in the final stages. Wolves change abruptly in the early stages of the hunting process and then gradually converge. However, there is no additional computational cost for the proposed algorithm.

4.4. Flowchart of Optimization

The flowchart of sizing optimization using HSMGWO is shown in Figure 9.
The detailed optimization process is as follows:
  • Input the load, wind speed, tidal current speed and other data of the studied island. Input the economic and technical parameters of the system components.
  • Determine the system optimization objectives and constraints. Determine the system variables and boundaries.
  • Initialize the algorithm, set the external archive, configure the algorithm parameters and the maximum number of iterations.
  • Initialize the wolf pack based on the Halton sequence.
  • Calculate the non-dominated solution of the contemporary population and update the external archive.
  • Select three leaders from the external archive by roulette method.
  • Implement the social motivation strategy, select the position updating method based on μ . Update the positions of all individuals.
  • Calculate objective function with the position variables of wolves. Select all the non-dominated solutions.
  • Add the non-dominated solutions to the archive according to the archiving rules and remove the dominated solutions. Remove the excess solutions when the population of external archive is full.
  • Use M a x i t e r to judge whether the algorithm should be terminated. The algorithm ends and all the non-dominated solutions are output if M a x i t e r is reached. Conversely, return to Step 6.

5. Simulation, Results and Discussion

5.1. Case Studies

The proposed sizing optimization method has been applied to analyze a hybrid renewable energy system of an island in Zhoushan Archipelago, China. The average load of the island microgrid is 200   kW , and the peak load is about 500   kW . The load curve is shown in Figure 10. At present, the traditional diesel generators are used to supply electricity to the island residents, causing serious environmental pollution. The stability of island energy system is seriously affected by diesel transportation.
The distributions of annual wind speed and tidal current speed are shown in Figure 11 according to the historical data. The available hours of wind and tidal energy at the study site are considerable, which account for 80.42% and 77.73% of the annual 8760 h, respectively. Wind and tidal current energy can be used to generate electricity for most of the year. Due to the high availability of resources, conventional offshore wind turbine and tidal current turbine can be selected as the main components of the energy system. As a special research object with low load level, island microgrid is vulnerable to marine natural disasters. In order to ensure the reliability of the system, components with appropriate rated capacity should be considered to avoid large-scale power outage caused by equipment failure. The selection of system components refers to the project data of State Grid Corporation of China, and is adjusted according to references [41,42]. The economic and technical parameters of the major components are shown in Table 2.

5.2. Results and Discussions

The sizing optimization of island renewable energy system based on HSMGWO has been implemented by the MATLAB (R2018b, MathWorks, Natick, MA, USA) simulation platform on an 8-core Lenovo computer (T490, Lenovo, Beijing, China) with 16 GB memory and 3.4 GHz CPU clock speed, running Windows 10 enterprise operating system (64-bit). The parameters of HSMGWO are shown in Table 3. The optimization process is carried out in hourly steps to simulate the annual operation of the energy system. Different sizing configurations correspond to different variable inputs.

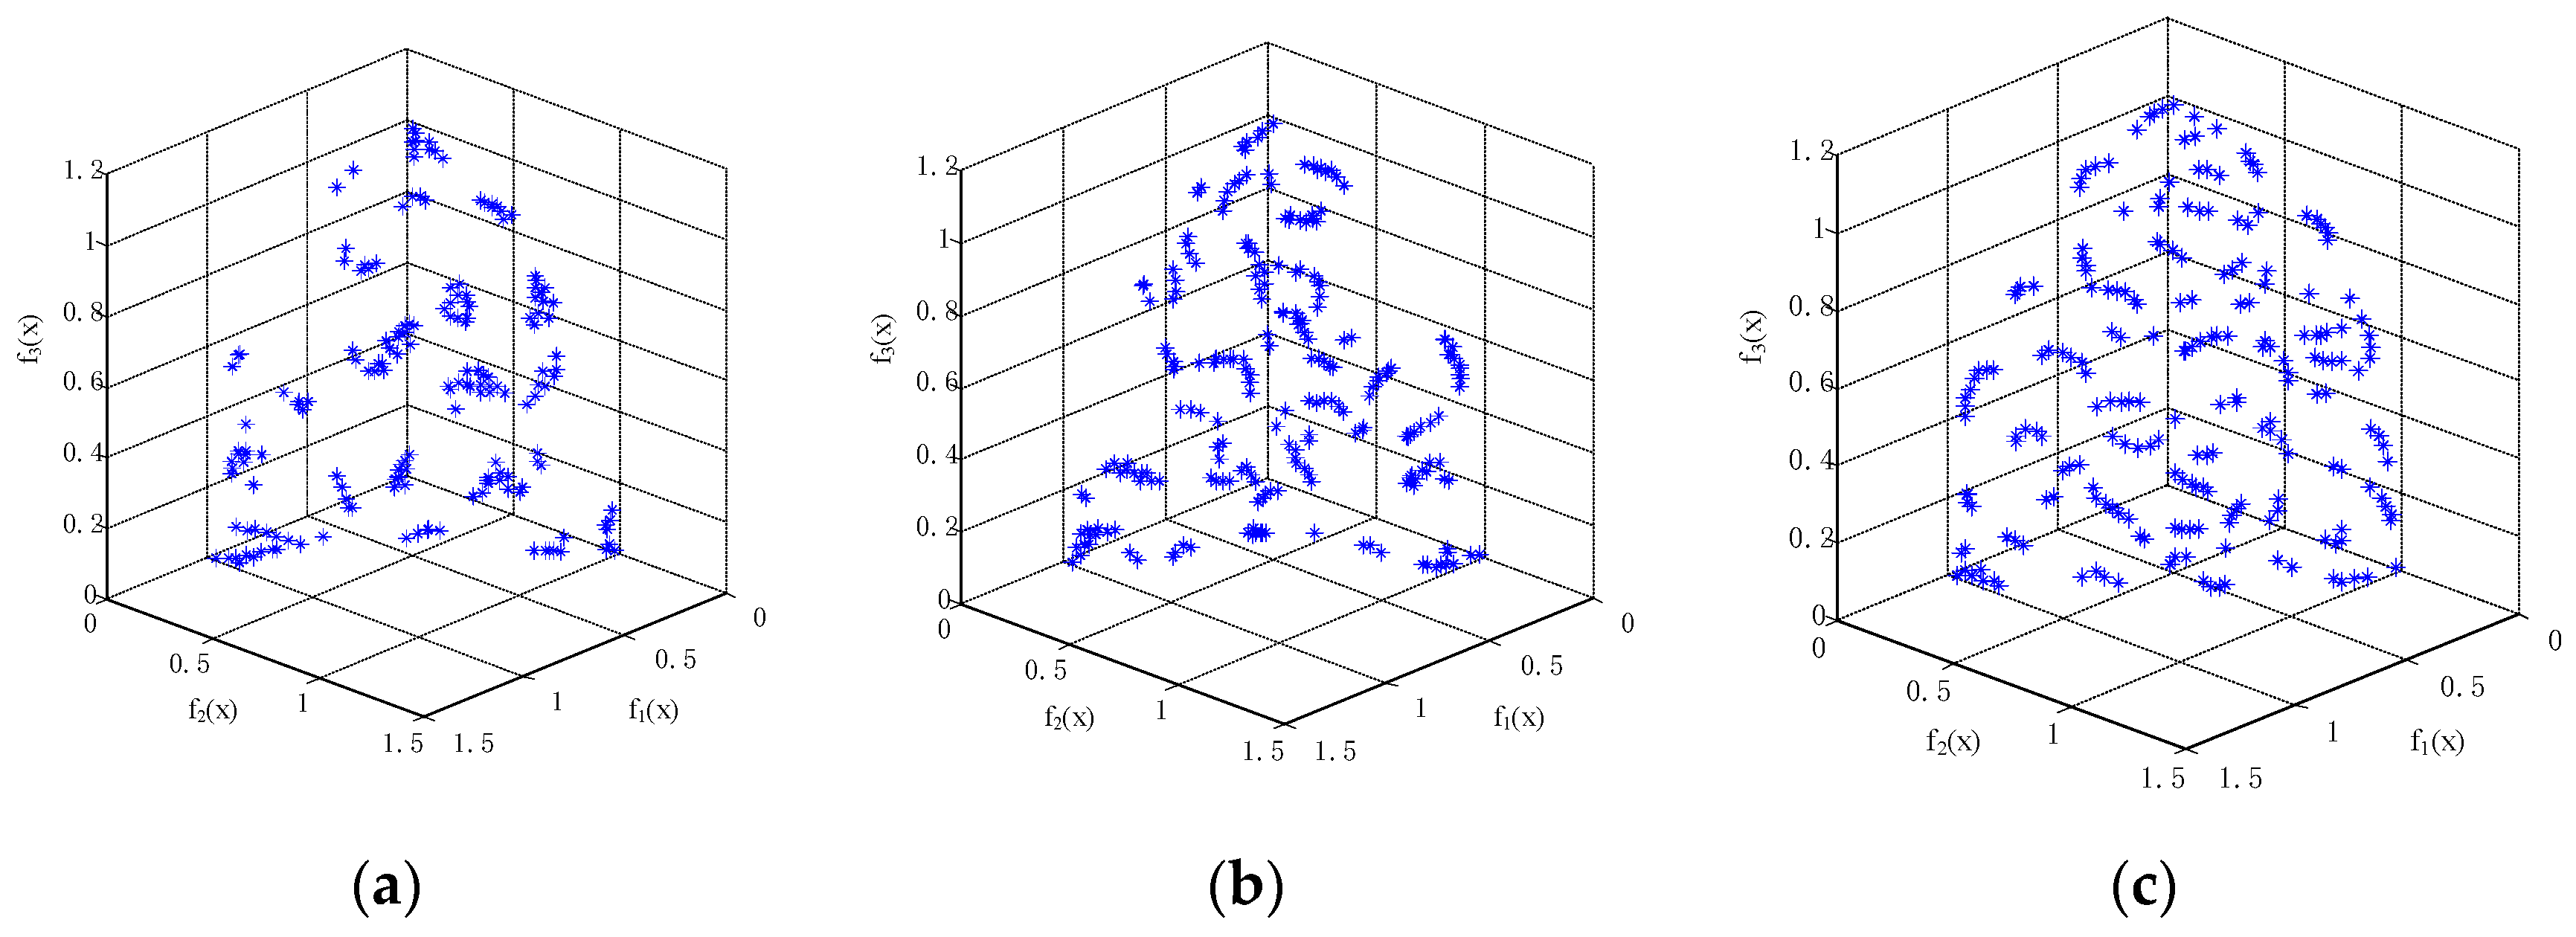
5.2.1. Comparison of Pareto Fronts

In order to further test the performance of the algorithm, HSMGWO, MOPSO and MOGWO algorithms are utilized to solve the optimization objectives. The Pareto fronts obtained by HSMGWO, MOPSO and MOGWO are shown in Figure 12 and Figure 13a,b. The proposed HSMGWO shows better convergence and coverage than standard MOGWO and MOPSO. The Pareto optimal front of HSMGWO is more distributed and broader than that of MOGWO and MOPSO. HSMGWO has obvious performance advantages in optimizing system size. The results indicate that the proposed HSMGWO has good performance in solving such kind of multi-objective problems.

5.2.2. Optimization Results

Figure 12 shows the relationship between LPSP, COE and DEP of the studied hybrid renewable energy system. Table 4 lists the optimal solutions of each objective and the optimal equilibrium solution of the system. The optimal equilibrium solution is the solution with the minimum value after normalizing all the non-dominated solutions, which is calculated by the following equation.
f i = n = 1 3 ( f i ( n )     f m i n ( n ) f m a x ( n )     f m i n ( n ) )
where f i is the normalized value of solution i , f i ( n ) is the function value of objective n of solution i , f m i n ( n ) denotes the minimum function value of objective n , f m a x ( n ) denotes the maximum function value of objective n .
Solution 1: The minimum LPSP is 5.1 % , the corresponding COE is 0.22   $ / kWh , the corresponding DEP is 36.2 % . Solution 2: The minimum COE is 0.16   $ / kWh , the corresponding LPSP is 19.6 % , the corresponding DEP is 13.5 % . Solution 3: The minimum DEP is 4.4 % , the corresponding LPSP is 26.3 % , the corresponding COE is 0.19   $ / kWh . Solution 4 (the optimal equilibrium solution): The LPSP is 9.8 % , the corresponding COE is 0.18   $ / kWh , the corresponding DEP is 16.6 % . Obviously, LPSP, COE and DEP are three contradictory objectives of energy system sizing. Reliability is guaranteed at the expense of high energy cost and resource dumping. In addition, this study simulated a microgrid of 100% renewable energy penetration, without diesel generators and conventional land-based power plants considering the scarcity of island land resources. Although it is in line with the principle of low-carbon and sustainable development, the reliability of the renewable energy system cannot reach the level of conventional power grid, which can be seen from the higher average value of LPSP in the results. Therefore, the accurate decision is based on the fully evaluation of the actual demand and the detailed analysis of Pareto solution set. From the perspective of decision makers, it is necessary to balance the weight of reliability, economy and resource utilization, further determine the appropriate type and size of system components to avoid excessive investment, substandard reliability, or energy dumping. Further analysis is based on Solution 4. In this case, the components of hybrid renewable energy system include four wind turbines, three tidal current turbines and five battery storage systems.

5.2.3. System Operation Analysis

Figure 14 demonstrates the annual operation simulation results of hybrid renewable energy system. Figure 15 demonstrate the zoomed version for one typical week. The result shows that TCTs provide stable power output, while WTs provide intermittent power output, which is determined by the characteristics of different resources. WTs provide higher peak of power output than TCTs. The BSS and distributed generation form an effective complementarity. When the distributed generation is sufficient, the BSS is charged to improve the utilization of renewable energy. When the distributed generation is insufficient, the BSS discharges to provide power output. The system realizes energy translation in time dimension. The energy management strategy fully matches the operation requirement of island microgrid and ensures reliable and sustainable power supply.
Figure 16 shows the total electricity generation of WTs and TCTs in each month, with the monthly load as reference. The results show that WTs provide more electricity than TCTs. Although the power curve demonstrates the volatility of wind energy, the monthly power generation of WTs is relatively average due to the abundant wind energy resources in the studied site. The TCTs provide stable power output, and the monthly power generation is uniformly distributed with its resource curve. The total power output of WTs and TCTs exceeds the load demand in each month. However, the renewable energy and load both have inherent randomness, the load cannot always be matched with the power output of energy system, which leads to lower reliability compared with grid-connected microgrid.

5.2.4. Components Sensitivity Analysis

Figure 17 shows the generation and investment percentages of different components in the system. WTs contributed 49.83% power output with 48.47% investment, TCTs contributed 29.21% power output with 35.07% investment and BSSs contributed 20.96% power output with 16.46% investment. Obviously, WTs and BSS have the best investment benefit, the investment benefit of TCTs is ordinary. The utilization of BSSs significantly improves the economy of the system.
In order to further study the impact of different components on different optimization objectives in isolated island microgrid, sensitivity analysis is carried out by changing the size of various components. The quantitative sensitivity analysis results of WTs, TCTs and BSSs are shown in Figure 18, Figure 19 and Figure 20, respectively.
The sensitivity analysis results show that LPSP decreases with the increase in all components sizes. For WTs, LPSP decreases from the maximum 52.56% to the minimum 3.91% as the size increases. For TCTs, LPSP decreases from the maximum 29.57% to the minimum 3.81% as the size increases. For BSSs, LPSP decreases from the maximum 29.59% to the minimum 8.24% as the size increases. The size of WTs has a great impact on LPSP, while the sizes of TCTs and BSSs have the relatively smaller impact on LPSP. This further reflects that WTs and TCTs provided the most basic and indispensable power output and have an incredible contribution to the reliability of renewable energy system. At the same time, BSSs can well suppress the fluctuation and randomness of renewable energy and reduce the risk of power shortage.
The size of WTs affects COE seriously. For renewable energy system without WTs, the COE can reach as high as 1.72 $/kWh. Once WTs is incorporated into the system, the COE will reduce greatly to 0.39 $/kWh and then decreases steadily to the minimum 0.16 $/kWh with the increase in size. On the contrary, the COE increases steadily from the minimum 0.12 $/kWh to the maximum 0.24 $/kWh as the size of TCTs increases, which is related to the high cost of tidal current power generation. With the development of technology and the policy guidance of new energy, the cost of tidal current power generation is expected to be reduced to the same level as offshore wind power generation. The size of BSSs has a tiny impact on COE with the minimum 0.17 $/kWh and the maximum 0.18 $/kWh. Taking 2 BSSs as the watershed, the COE of the system decreases slightly first and then increases slightly with the increase in the size of BSSs.
The results show that DEP increases with the increase in the sizes of WTs and TCTs. For WTs, DEP increases from the minimum 0.41% to the maximum 27.03% as the size increases. For TCTs, DEP increases from the minimum 2.11% to the maximum 42.28% as the size increases. Different characteristics of renewable energies determine the different impact on DEP. The size of TCTs contributes more to the increase in DEP than that of WTs due to the stability of tidal current energy. DEP decreases from the maximum 32.75% to the minimum 15.56% as the size of BSSs increases, which reflects that BSSs can greatly reduce energy dumping and improve the utilization of renewable energy.

6. Conclusions

In this paper, taking land demand as one of the key considerations of component selection, an island hybrid renewable energy microgrid, composed of wind turbines, tidal current turbines, battery storage systems, is established in a stand-alone marine context. A tri-objective sizing optimization method is proposed, comprehensively considering the economy, reliability and energy utilization indexes. Three optimization objectives are presented: minimizing the Loss of Power Supply Probability, the Cost of Energy and the Dump Energy Probability. An improved Multi-Objective Grey Wolf Optimizer based on Halton sequence and social motivation strategy (HSMGWO) is proposed to solve the sizing optimization problem. The system is modeled and simulated by MATLAB software. The major conclusions in this paper are listed as follows:
  • The simulation results verify the feasibility of the proposed optimization method. The optimal size of the island renewable energy system is obtained. WT, TCT, and BBS are closely complementary base on an effective and reliable energy management strategy.
  • The simulation results verify the feasibility and advancement of the proposed HSMGWO in solving the multi-objective sizing optimization problem of renewable energy system. The HSMGWO shows better convergence and coverage of Pareto front compared with MOGWO and MOPSO.
  • The case study proves that it is feasible to construct an island micro grid composed of offshore renewable energy components on the basis of specific resource evaluation, taking valuable land resources as one of the primary considerations.
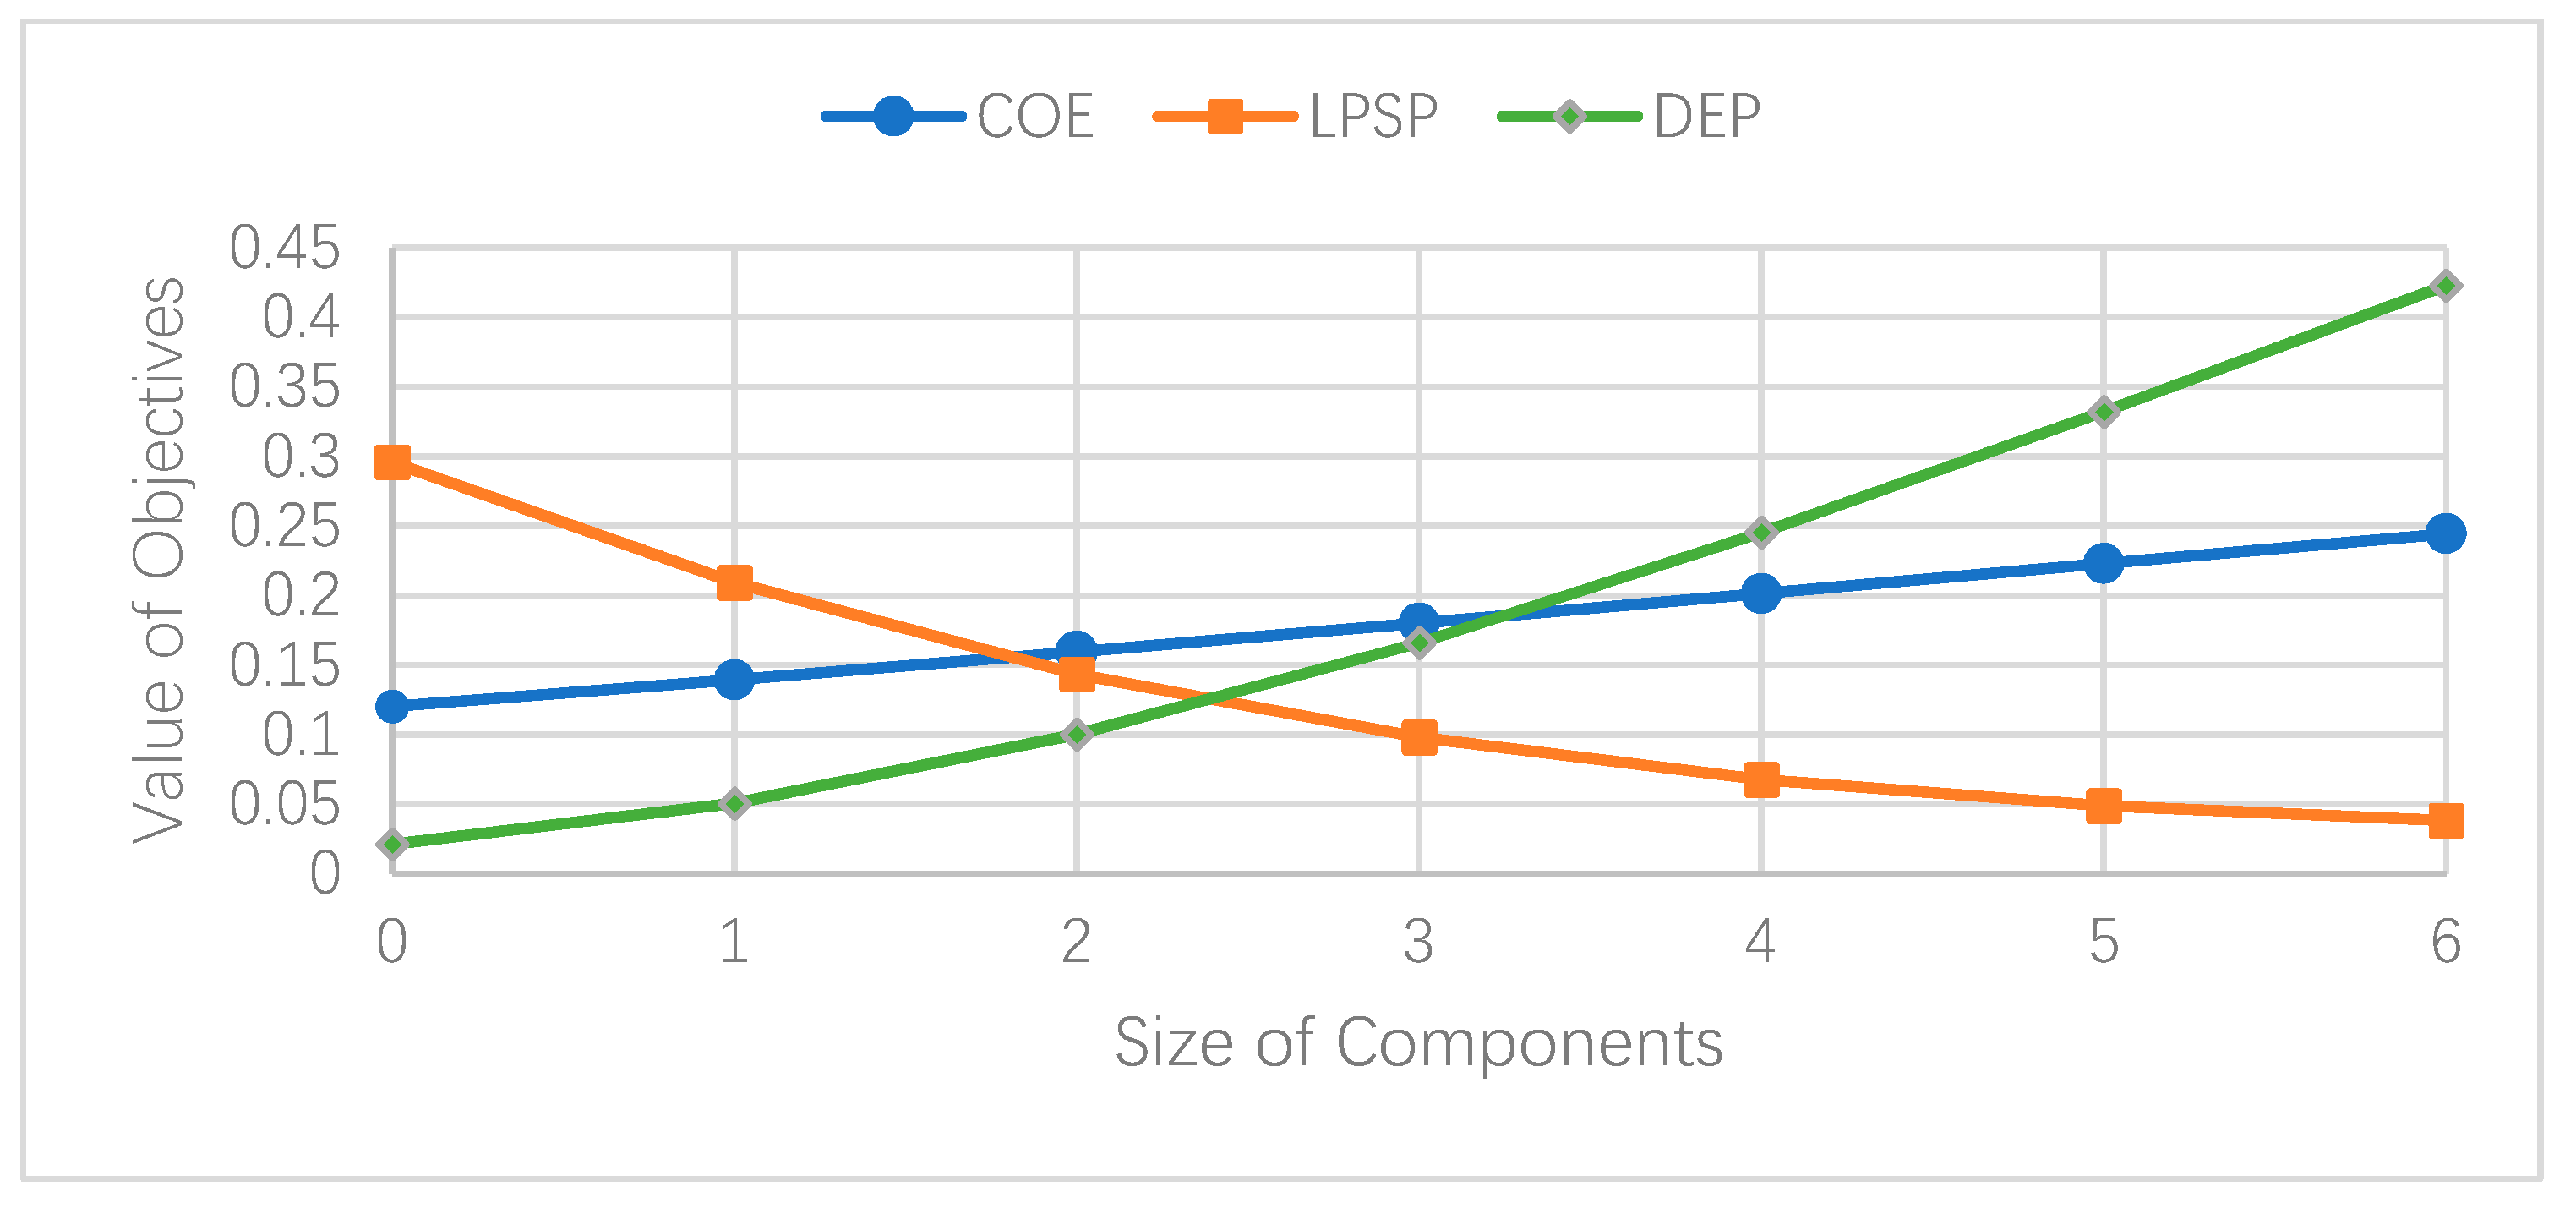
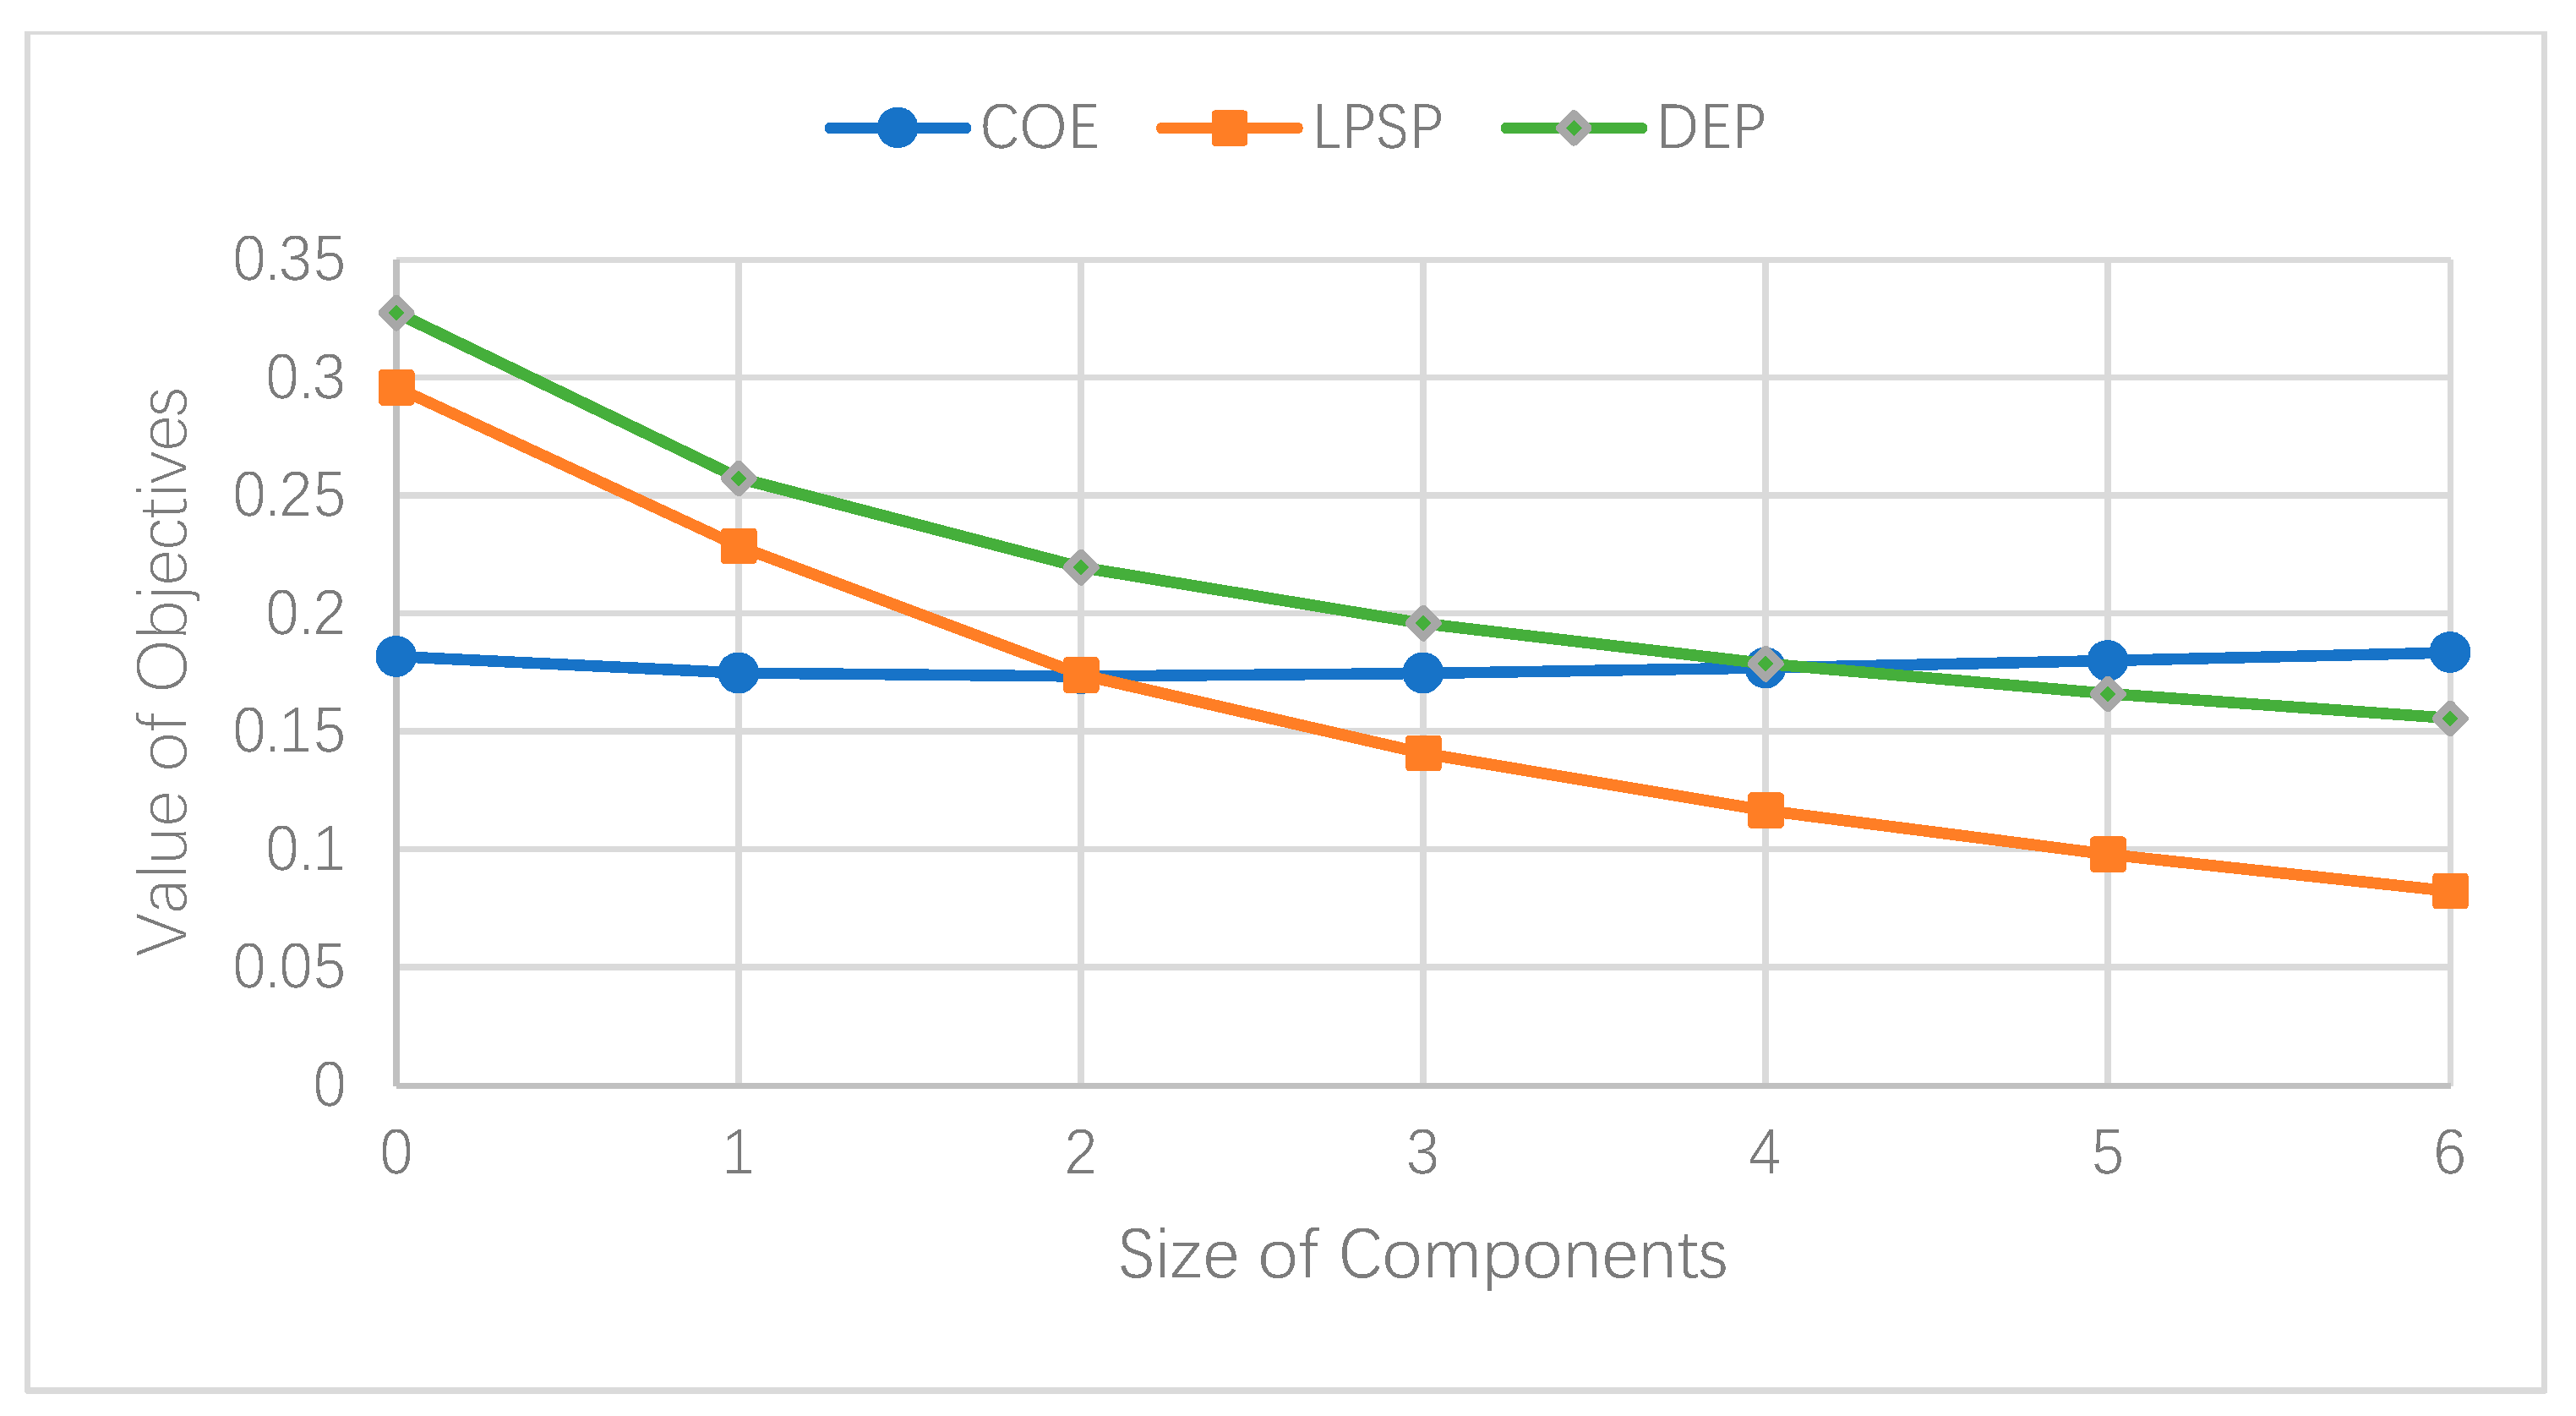
  • The results of operation and sensitivity analysis indicate that in the studied area, the investment and power generation of various components of the microgrid are relatively balanced. WTs provide the most power and have the greatest impact on the economy and reliability indexes. TCTs and BSSs have a great impact on the reliability index. BSSs can well shift the system’s generation and steadily improve the reliability and resource utilization.
The multi-objective sizing optimization method of island renewable system proposed in this paper is also applied to other similar optimization problems of isolated microgrid. This paper has presented a methodological study, further investigation of operation strategy should be carried out to improve the system reliability and reduce energy cost.

Author Contributions

Conceptualization, W.Z. and G.Z.; methodology, W.Z. and G.Z.; software, W.Z. and G.Z.; validation, W.Z.; investigation, W.Z.; resources, W.Z.; data curation, W.Z.; writing—original draft preparation, W.Z.; writing—review and editing, W.Z. and J.G. All authors have read and agreed to the published version of the manuscript.

Funding

This research received no external funding.

Data Availability Statement

The data presented in this study are available on request from the corresponding author. The data are not publicly available due to the confidentiality of involved data.

Conflicts of Interest

The authors declare no conflict of interest.

Abbreviations

BSSBattery storage system
ChOA Chimp optimization algorithm
CRFCapital recovery factor
COECost of Energy
DEPDump Energy Probability
DODDepth of discharge
LPSPLoss of Power Supply Probability
HSMGWOImproved Multi-Objective Grey Wolf Optimizer based on Halton sequence and social motivation strategy
IGDInverted Generational Distance
MOGWOMulti-objective grey wolf optimizer
MOPSOMulti-objective particle swarm optimization
PVPhotovoltaic
SFFSinking fund factor
SOCState of charge
TCTTidal current turbine
WTWind turbine

References

  1. The 13th Five-Year Plan for China’s Marine Economic Development. Available online: http://www.mofcom.gov.cn/article/b/g/201709/20170902640261.shtml (accessed on 16 August 2020).
  2. National Energy Administration (NEA). Vision and Actions on Energy Cooperation in Jointly Building Silk Road Economic Belt and 21st-Century Maritime Silk Road. Available online: http://www.nea.gov.cn/2017-05/12/c_136277473.htm (accessed on 23 August 2020).
  3. Ministry of National Resources (MONR). National Island Protection Plan. Available online: http://g.mnr.gov.cn/201701/t20170123_1428738.html (accessed on 23 August 2020).
  4. Dan, Z.; Jie, W. Research on Construction and Development Trend of Micro-Grid in China. Power Syst. Technol. 2016, 2, 451–458. [Google Scholar]
  5. Wang, C.S.; Wang, S.X. The Role and Challenge of Smart Mircogrid in the Integration of Distributed Energy Resources. Bull. Chin. Acad. Sci. 2016, 2, 232–240. [Google Scholar]
  6. Ray, G.L.; Larsen, E.M.; Pinson, P. Evaluating price-based demand response in practice—With application to the EcoGrid EU Experiment. IEEE Trans. Smart Grid 2018, 9, 2304–2313. [Google Scholar]
  7. Asano, M. Hawai’i’s Grid Architecture for High Renewables: Developing the State’s Modernization Strategy. IEEE Power Energy Mag. 2019, 17, 40–46. [Google Scholar] [CrossRef]
  8. Garralaga, R.E.; Sadri, H.; Krueger, W. Case study of MW-sized power generation at St. Eustatius island combining photovoltaics, battery storage, and gensets. Prog. Photovolt. Res. Appl. 2020, 28, 562–568. [Google Scholar] [CrossRef]
  9. Lozano, L.; Querikiol, E.M.; Abundo, M.L.S.; Bellotindos, L.M. Techno-economic analysis of a cost-effective power generation system for off-grid island communities: A case study of Gilutongan Island, Cordova, Cebu, Philippines. Renew. Energ 2019, 140, 905–911. [Google Scholar] [CrossRef]
  10. Salehin, S.; Ehsan, M.M.; Noor, S.; Sadrul Islam, A.K.M. Modeling of an Optimized Hybrid Energy System for Kutubdia Island, Bangladesh. Appl. Mech. Mater. 2016, 819, 518–522. [Google Scholar] [CrossRef]
  11. Chen, A.A.; Stephens, A.J.; Koon, R.K.; Ashtine, M.; Koon, K.M.K. Pathways to climate change mitigation and stable energy by 100% renewable for a small island: Jamaica as an example. Renew. Sust. Energ. Rev. 2020, 121, 109671. [Google Scholar] [CrossRef]
  12. Mohammed, O.H.; Amirat, Y.; Benbouzid, M.; Haddad, S.; Feld, G. Optimal sizing and energy management of hybrid wind/tidal/PV power generation system for remote areas: Application to the Ouessant French Island. In Proceedings of the IECON 2016—42nd Annual Conference of the IEEE Industrial Electronics Society, Florence, Italy, 23–26 October 2016; IEEE: Florence, Italy, 2016. [Google Scholar]
  13. Abo-Elyousr, F.K.; Elnozahy, A. Bi-objective economic feasibility of hybrid micro-grid systems with multiple fuel options for islanded areas in Egypt. Renew. Energy 2018, 128, 37–56. [Google Scholar] [CrossRef]
  14. Tawil, T.E.; Charpentier, J.F.; Benbouzid, M. Sizing and rough optimization of a hybrid renewable-based farm in a stand-alone marine context. Renew. Energy 2018, 115, 1134–1143. [Google Scholar] [CrossRef]
  15. Mahesh, A.; Sandhu, K.S. A genetic algorithm based improved optimal sizing strategy for solar-wind-battery hybrid system using energy filter algorithm. Front. Energy 2020, 14, 139–151. [Google Scholar] [CrossRef]
  16. Zhu, W.; Guo, J.; Zhao, G.; Zeng, B. Optimal Sizing of an Island Hybrid Microgrid Based on Improved Multi-Objective Grey Wolf Optimizer. Processes 2020, 8, 1581. [Google Scholar] [CrossRef]
  17. Mahesh, K.; Nallagownden, P.; Elamvazuthi, I. Advanced Pareto Front Non-Dominated Sorting Multi-Objective Particle Swarm Optimization for Optimal Placement and Sizing of Distributed Generation. Energies 2016, 9, 982. [Google Scholar] [CrossRef]
  18. Yilmaz, S.; Dincer, F. Optimal design of hybrid PV-Diesel-Battery systems for isolated lands: A case study for Kilis, Turkey. Renew. Sustain. Energy Rev. 2017, 77, 344–352. [Google Scholar] [CrossRef]
  19. Rogelj, J.; Elzen, M.; Höhne, N.; Fransen, T.; Fekete, H.; Winkler, H.; Meinshausen, M. Paris Agreement climate proposals need a boost to keep warming well below 2 degrees. Nature 2016, 534, 631–639. [Google Scholar] [CrossRef] [Green Version]
  20. Uihlein, A.; Magagna, D. Wave and tidal current energy—A review of the current state of research beyond technology. Renew. Sustain. Energy Rev. 2016, 58, 1070–1081. [Google Scholar] [CrossRef]
  21. Guo, X.S.; Zhang, J.Y.; Lin, X.N.; Ding, S.Y. Layout Optimization and Power Generation Potential Exploration of Multi-energy Reef Power Station for Pelagic Island. Autom. Electr. Power Syst. 2019, 43, 1–10. [Google Scholar]
  22. Francisco, T.; Paulo, R.; Tiago, F. Marine renewable energy. Renew. Energy 2020, 150, 1160–1164. [Google Scholar]
  23. Ministry of Civil Affairs (MCA). National Administrative Division Information Inquiry Platform. Available online: http://xzqh.mca.gov.cn/map (accessed on 19 August 2020).
  24. Xiao, J.J.; Li, Z.Q.; Guo, F.F.; Ma, H. Analysis of China Sea Wind Energy Based on CCMP Satellite Data. Mar. Forecast. 2017, 34, 9–18. [Google Scholar]
  25. Wang, W.Y.; Yang, J. Assessment of Tidal Current Energy Resources in Zhoushan Sea Area. Ocean Dev. Manag. 2017, 3, 54–60. [Google Scholar]
  26. National Oceanic and Atmospheric Administration (NOAA). Data Access of National Centers for Environmental Information. Available online: https://www.ncei.noaa.gov/ (accessed on 20 August 2020).
  27. Wan, Y.; Zhang, J.; Meng, J.M.; Wang, J. Wave Energy Resource Assessment along Bohai Sea, Yellow Sea and East China Sea. Acta Energ. Sol. Sin. 2017, 38, 1711–1716. [Google Scholar]
  28. Shin, J.; Lee, J.H.; Realff, M.J. Operational planning and optimal sizing of microgrid considering multi-scale wind uncertainty. Appl. Energy 2017, 195, 616–633. [Google Scholar] [CrossRef]
  29. Soudan, B. Community-scale baseload generation from marine energy. Energy 2019, 189, 116–134. [Google Scholar] [CrossRef]
  30. Suresh, M.; Meenakumari, R. An improved genetic algorithm based optimal sizing of Solar Photovoltaic/Wind Turbine Generator/Diesel Generator/Battery connected Hybrid Energy Systems for standalone applications. Int. J. Ambient Energy 2019, 1, 20. [Google Scholar] [CrossRef]
  31. Ogunjuyigbe, A.S.O.; Ayodele, T.R.; Akinola, O.A. Optimal allocation and sizing of PV/Wind/Split-diesel/Battery hybrid energy system for minimizing life cycle cost, carbon emission and dump energy of remote residential building. Appl. Energy 2016, 171, 153–171. [Google Scholar] [CrossRef]
  32. Al-falahi, M.D.A.; Jayasinghe, S.D.G.; Enshaei, H. A review on recent size optimization methodologies for standalone solar and wind hybrid renewable energy system. Energy Convers Manag. 2017, 143, 252–274. [Google Scholar] [CrossRef]
  33. Javed, M.S.; Ma, T. Techno-economic assessment of a hybrid solar-wind-battery system with genetic algorithm. Energy Procedia 2019, 158, 6384–6392. [Google Scholar] [CrossRef]
  34. Khatib, T.; Ibrahim, I.A.; Mohamed, A. A review on sizing methodologies of photovoltaic array and storage battery in a standalone photovoltaic system. Energy Convers. Manag. 2016, 120, 430–448. [Google Scholar] [CrossRef]
  35. Behravesh, V.; Akbari Foroud, A.; Keypour, R. Optimal sizing methodology for photovoltaic and wind hybrid rooftop generation systems in residential low voltage distribution networks. Sol. Energy 2018, 173, 17–33. [Google Scholar] [CrossRef]
  36. Mirjalili, S.; Mirjalili, S.M.; Lewis, A. Grey Wolf Optimizer. Adv. Eng. Softw. 2014, 69, 46–61. [Google Scholar] [CrossRef] [Green Version]
  37. Mirjalili, S.; Saremi, S.; Mirjalili, S.M.; Coelho, L.D.S. Multi-objective grey wolf optimizer: A novel algorithm for multi-criterion optimization. Expert Syst. Appl. 2016, 47, 106–119. [Google Scholar] [CrossRef]
  38. Wang, B.; Liu, L.S.; Han, S.C.; Zhu, S.X. Hybrid multi-objective grasshopper optimization algorithm based on fusion of multiple strategies. J. Comput. Appl. 2020, 40, 2670–2676. [Google Scholar]
  39. Khishe, M.; Mosavi, M.R. Chimp optimization algorithm. Expert Syst. Appl. 2020, 149, 113338. [Google Scholar] [CrossRef]
  40. Saremi, S.; Mirjalili, S.; Lewis, A. Biogeography-based optimisation with chaos. Neural Comput. Appl. 2014, 25, 1077–1097. [Google Scholar] [CrossRef]
  41. Astariz, S.; Vazquez, A.; Iglesias, G. Evaluation and comparison of the levelized cost of tidal, wave, and offshore wind energy. J. Renew. Sustain. Energy 2015, 7, 053112. [Google Scholar] [CrossRef]
  42. International Renewable Energy Agency (IRENA). Renewable Power Generation Cost in 2019. Available online: https://www.irena.org/publications (accessed on 20 August 2020).
Figure 1. The workflow of this paper.
Electronics 10 00174 g001
Figure 2. The map of the studied site in Zhoushan Archipelago.
Electronics 10 00174 g002
Figure 3. Annual wind speed of the studied site.
Electronics 10 00174 g003
Figure 4. Annual tidal current speed of the studied site.
Electronics 10 00174 g004
Figure 5. The location updating mechanism of GWO.
Electronics 10 00174 g005
Figure 6. Point sets generated by (a) random method; (b) Halton sequence.
Electronics 10 00174 g006
Figure 7. Pareto fronts of DTLZ 1 obtained by (a) MOPSO; (b) MOGWO; (c) HSMGWO.
Electronics 10 00174 g007
Figure 8. Pareto fronts of DTLZ 2 obtained by (a) MOPSO; (b) MOGWO; (c) HSMGWO.
Electronics 10 00174 g008
Figure 9. Flowchart of optimization using HSMGWO.
Electronics 10 00174 g009
Figure 10. Annual load demand of the studied location.
Electronics 10 00174 g010
Figure 11. Distributions of (a) annual wind speed; (b) tidal current speed.
Electronics 10 00174 g011
Figure 12. The Pareto front obtained by HSMGWO.
Electronics 10 00174 g012
Figure 13. The Pareto front obtained by (a) MOPSO; (b) MOGWO.
Electronics 10 00174 g013
Figure 14. Annual electricity generation of renewable energy system.
Electronics 10 00174 g014
Figure 15. Weekly electricity generation of renewable energy system.
Electronics 10 00174 g015
Figure 16. Components monthly electricity generation.
Electronics 10 00174 g016
Figure 17. (a) The generation percentages; (b) The investment percentages.
Electronics 10 00174 g017
Figure 18. Sensitivity analysis results of WTs.
Electronics 10 00174 g018
Figure 19. Sensitivity analysis results of TCTs.
Electronics 10 00174 g019
Figure 20. Sensitivity analysis results of BSS.
Electronics 10 00174 g020
Table 1. Test results for IGD.
NamesAverage
HSMGWOMOGWOMOPSO
DTLZ 10.08360.17510.2629
DTLZ 20.10190.25860.4004
Table 2. Parameters of the major components.
SourcesParametersValuesUnits
WTLifespan20Year
Rated capacity80kW
Efficiency95%
Initial cost3900$/kW
Running cost3%
Cut-in speed2.5m/s
Cut-out speed18m/s
Rated speed12m/s
TCTLifespan20Years
Rated capacity70kW
Efficiency95%
Initial cost4300$/kW
Running cost3%
Cut-in speed1m/s
Cut-out speed5m/s
Rated speed2.5m/s
BSSLifespan5Years
Rated capacity100kWh
Efficiency90%
Initial cost280$/kW
Replacement cost280$/kW
Running cost2%
Table 3. HSMGWO Parameters.
ParametersValuesParametersValuesParametersValues
Wolves_num200alpha0.1nGrid10
MaxIt1000beta4μ[0, 1]
Archive_size100gamma2mChaotic
Table 4. Optimal solutions of each objective and the optimal equilibrium solution.
SolutionsWTTCTBSSLPSP (%) COE ( $ / k W h ) DEP (%)
15465.10.2236.2
232419.60.1613.5
322326.30.194.4
44359.80.1816.6
Publisher’s Note: MDPI stays neutral with regard to jurisdictional claims in published maps and institutional affiliations.

