Article

Characterization of the Potential Effects of EMC Filters for Power Converters on Narrowband Power Line Communications

1
Department of Communications Engineering, Bilbao Faculty of Engineering, University of the Basque Country UPV/EHU, 48013 Bilbao, Spain
2
Department of Applied Mathematics, Bilbao Faculty of Engineering, University of the Basque Country UPV/EHU, 48013 Bilbao, Spain
*
Author to whom correspondence should be addressed.
Electronics 2021, 10(2), 152; https://doi.org/10.3390/electronics10020152
Submission received: 30 November 2020 / Revised: 7 January 2021 / Accepted: 8 January 2021 / Published: 12 January 2021

Abstract

:
Electromagnetic Compatibility (EMC) filters are one of the main solutions for dealing with the disturbances generated by power inverters. However, they show series/parallel resonances that introduce variations in the impedance seen from the grid. Consequently, in some cases, these filters have low impedances at resonance frequencies, which can affect Narrowband Power Line Communications (NB-PLC) due to notching effects. For that reason, the potential effects of four EMC filters on NB-PLC have been studied. Laboratory trials in a controlled environment have been carried out, in which the attenuation and the Signal-to-Noise Ratio (SNR) thresholds that define the communication’s quality have been studied. The results presented in this paper show that, although the variations of the channel frequency response are not selective enough to degrade the communication thresholds, the attenuation measured when the filter is connected near the receiver might be sufficiently high to be critical for the communications in some situations. Therefore, EMC filters might have a negative impact on NB-PLC that had not been previously considered.

1. Introduction

Power electronics is a key technology for the efficient conversion, control and conditioning of electric energy from the source to the load. For the last decades, a wide adoption of energy-efficient power converters has been observed in several application fields such as buildings and lighting, power supplies, smart electricity grid (including integration of distributed renewable energy sources and electric vehicle), and industrial drives [1,2].
However, the use of energy-efficient power converters implies some associated issues, including Electromagnetic Interference (EMI). Typical sources of interference are, for example, Insulated Gate Bipolar Transistor (IGBT) inverters for motor control and switched power supplies. Both devices generate voltages and currents with steep edges in their operation. For frequencies at hundreds of kHz, the interference is spread the same way as the power supply voltage, i.e., current flows in the loop formed by the phase and neutral conductors. Such noise is called differential-mode noise [3].
The use of passive filters is one of the most spread solutions for electromagnetic interference suppression [4]. An optimally designed mains filter can perform a double function. First, the filter protects an electronic control circuit from voltage spikes in the mains supply, which may be generated, for example, by electromechanical switches and relays. Simultaneously, the same filter also acts in the opposite direction, attenuating the interference generated in the unit towards the power supply line.
However, the use of Electromagnetic Compatibility (EMC) filters might also lead to an undesired effect on Narrowband Power Line Communications (NB-PLC) signals. Due to the parallel and/or series resonances of EMC filters, notching effects can affect communication signals, which are more likely to be disturbed when the output impedance of the filter is low in comparison with the impedance of the grid [5].
It is well known that common low voltage electrical cables are designed with low impedance in order to reduce the losses associated with energy delivery. Moreover, the connection of electrical devices to the grid results in an access impedance that is dependent on location and variable in time [6,7]. The introduction of EMC filters, thus, might become an additional source of impedance mismatch between NB-PLC equipment and the electrical networks.
In order to try to overcome impedance mismatching effects, NB-PLC modems incorporate impedance matching techniques, but with limited success due mainly to the time variability of the access impedance. A review on impedance matching techniques in Power Line Communications is provided in [8]. As stated in the paper, achieving an impedance matching solution is a difficult challenge, and relies on accurate impedance measurements.
Furthermore, loads connected to the low voltage network have an influence on the channel frequency response, affecting the transmission losses between transmitter and receiver in NB-PLC [7,9].
This paper analyses the potential effect of passive EMC filters for power converters on NB-PLC according to PRIME v1.4 standard, in the frequency range from 42 to 472 kHz. This study is based on laboratory trials that include four types of filters and several configurations of the NB-PLC signals and communication channels.

2. Materials and Methods

In order to test the potential effect of EMC filters on the quality of NB-PLC, two indicators have been calculated.
First, signal attenuation due to the load under test is obtained. This attenuation is calculated as the difference of the modulus of the channel frequency response when the corresponding EMC filter is connected to the setup and the modulus of the channel frequency response when no filter is connected.
Second, Frame Error Rate (FER), i.e., the ratio of frames received with errors to total frames received, is calculated and then represented as a function of SNR in the receiver. A frame is defined as a set of Orthogonal Frequency Division Multiplexing (OFDM) symbols and Preamble, which constitutes a single Physical Protocol Data Unit (PPDU) [10]. The SNR threshold for an FER of 5% is calculated for comparison purposes, as this FER is the acceptability limit for NB-PLC [11].

2.1. Measurement Equipment and EMC Filters under Test

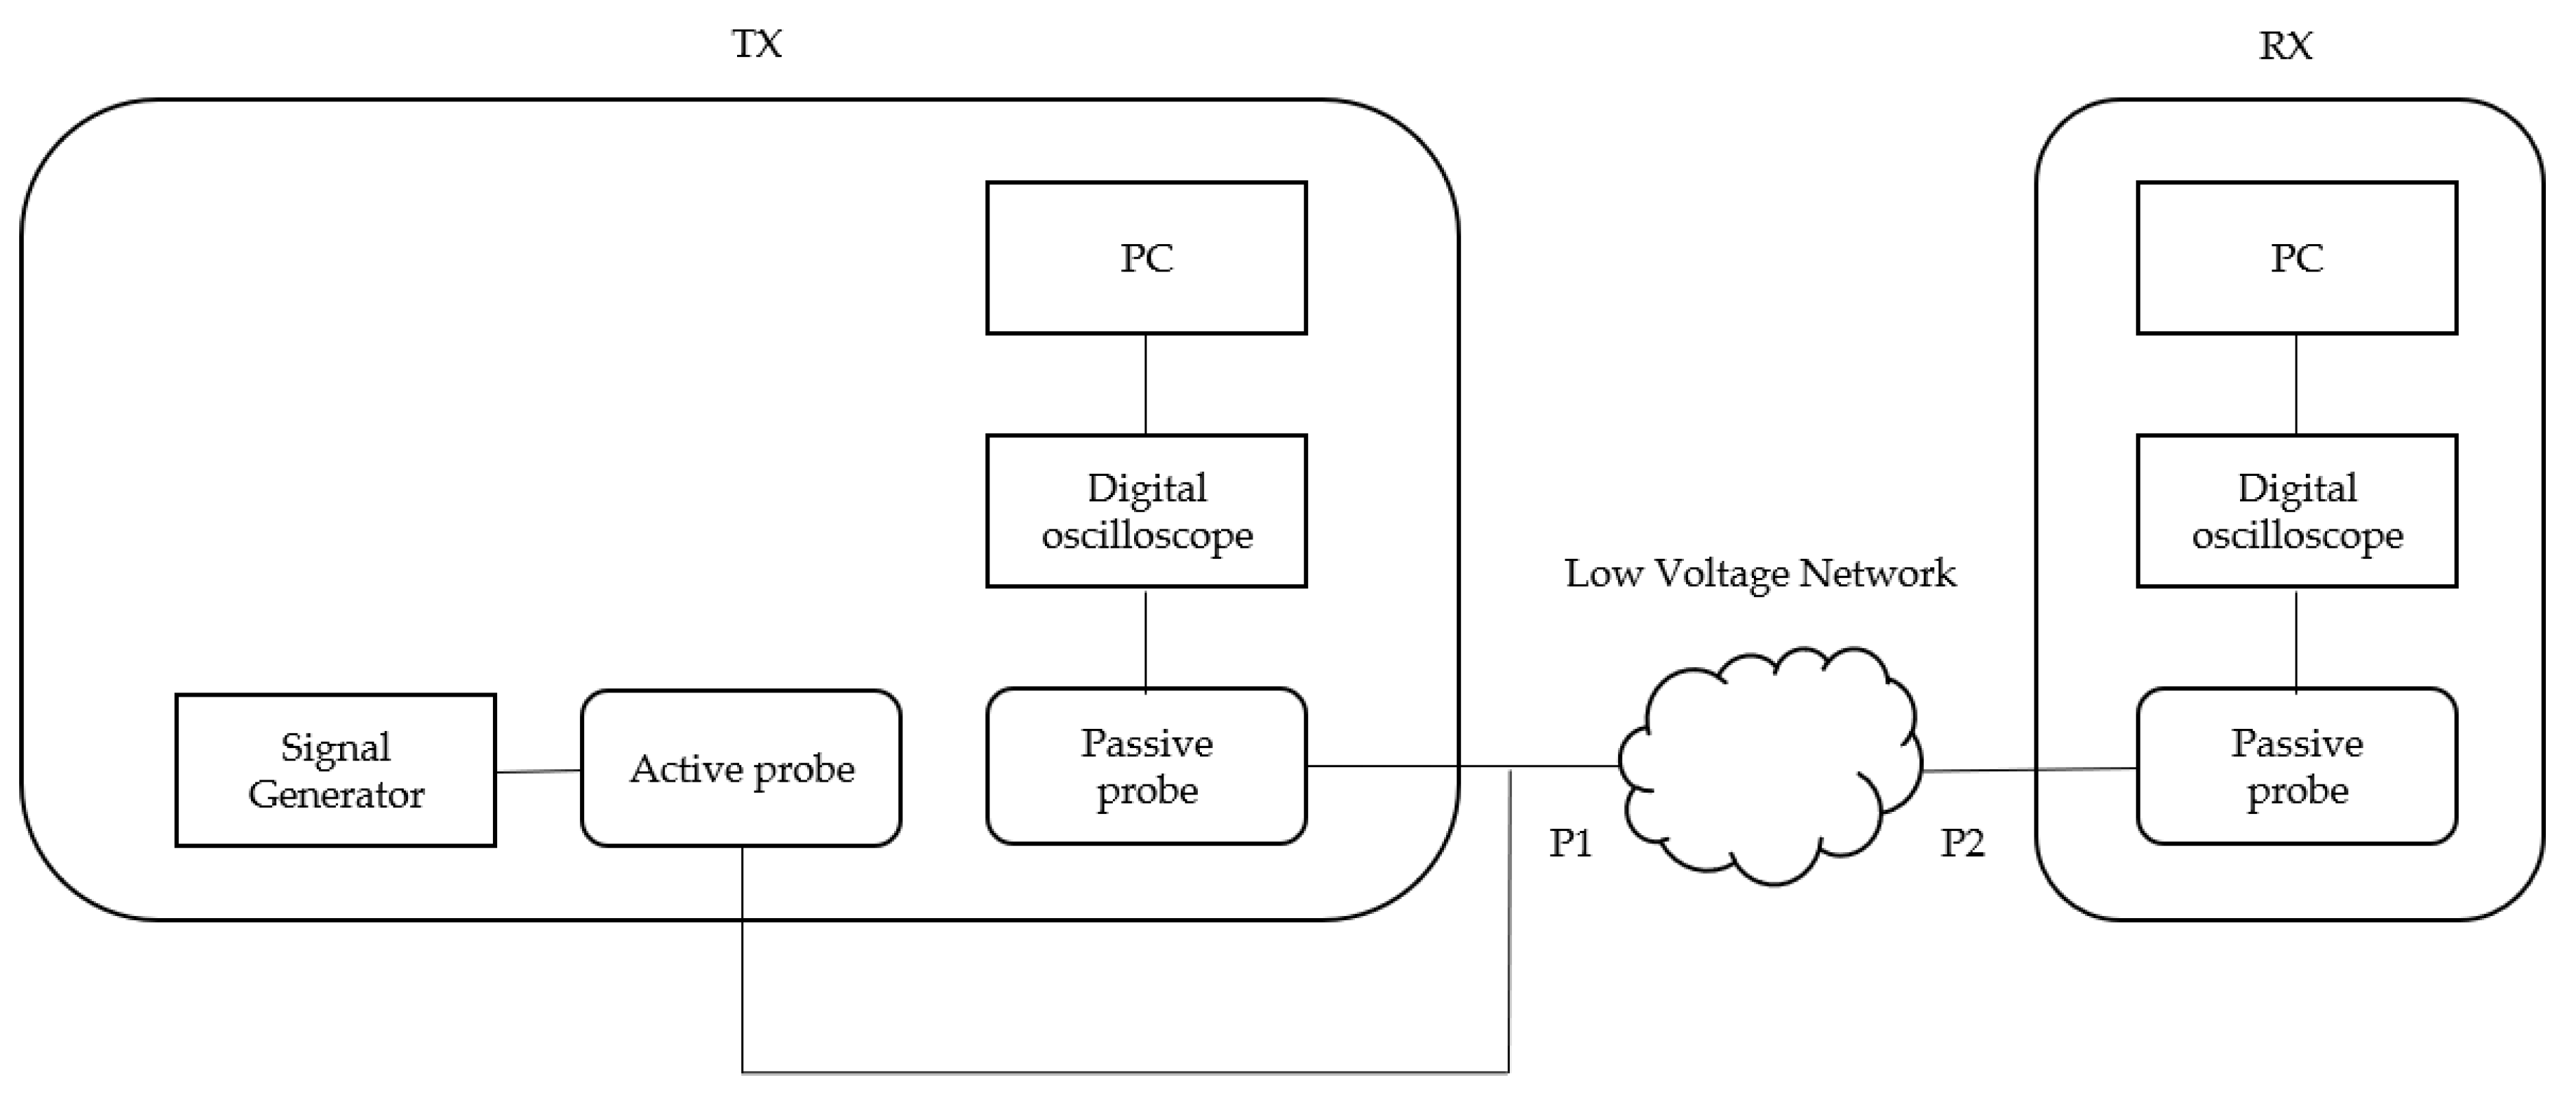
2.1.1. Channel Frequency Response Measurement System

The equipment and methodology for the channel frequency response measurements are based on the system presented in [12]. The system presented here is an improved version of the previous system, where an ad-hoc signal is injected instead of an NB-PLC signal. Therefore, the characterization is performed for the whole frequency range of interest, without frequency gaps.
The channel frequency response measurement system calculates the transmission losses, in modulus and phase, between two electrical points, P1 and P2. The channel frequency response is calculated as the difference between the level of the signal injected at point P1 and the level of the signal measured at point P2. Between these two points, there can be a controlled environment, as the one presented in this paper, or a section of the real low voltage network. Figure 1 shows the measurement system for the channel frequency response.
The system is composed of 3 voltage probes, two of them connected at point P1, and one at point P2. One of the probes connected at point P1 is an active probe [13], which is responsible for injecting a sweep in the frequency range 5–530 kHz and for filtering the 50 Hz signal of the network, so that it does not affect the signal generator. The second probe located at point P1 is a passive probe, which decouples the injected signal from the grid in order to measure its actual level. Finally, the probe located at point P2 decouples the received signal. Voltage measurements are digitized with two high-resolution oscilloscopes with a sampling resolution of 16 bits. A dedicated software in the laptop configures and processes the oscilloscope recordings following these three main steps—signal windowing, Fourier analysis and attenuation assessment.
First, a sliding windowing in time is applied to the recorded voltage values. More precisely, a rectangular window with a 1/50 s duration is used with 93% of overlapping between consecutive windows. Afterwards, a FFT (Fast Fourier Transform) is performed using the above-mentioned parameters. Besides, data processing procedure includes a Signal-to-Noise ratio adjustment when the power of the recorded signal is not 10 dB higher than the recorded noise power.

2.1.2. Microchip PL360G55CF-EK Evaluation Kit
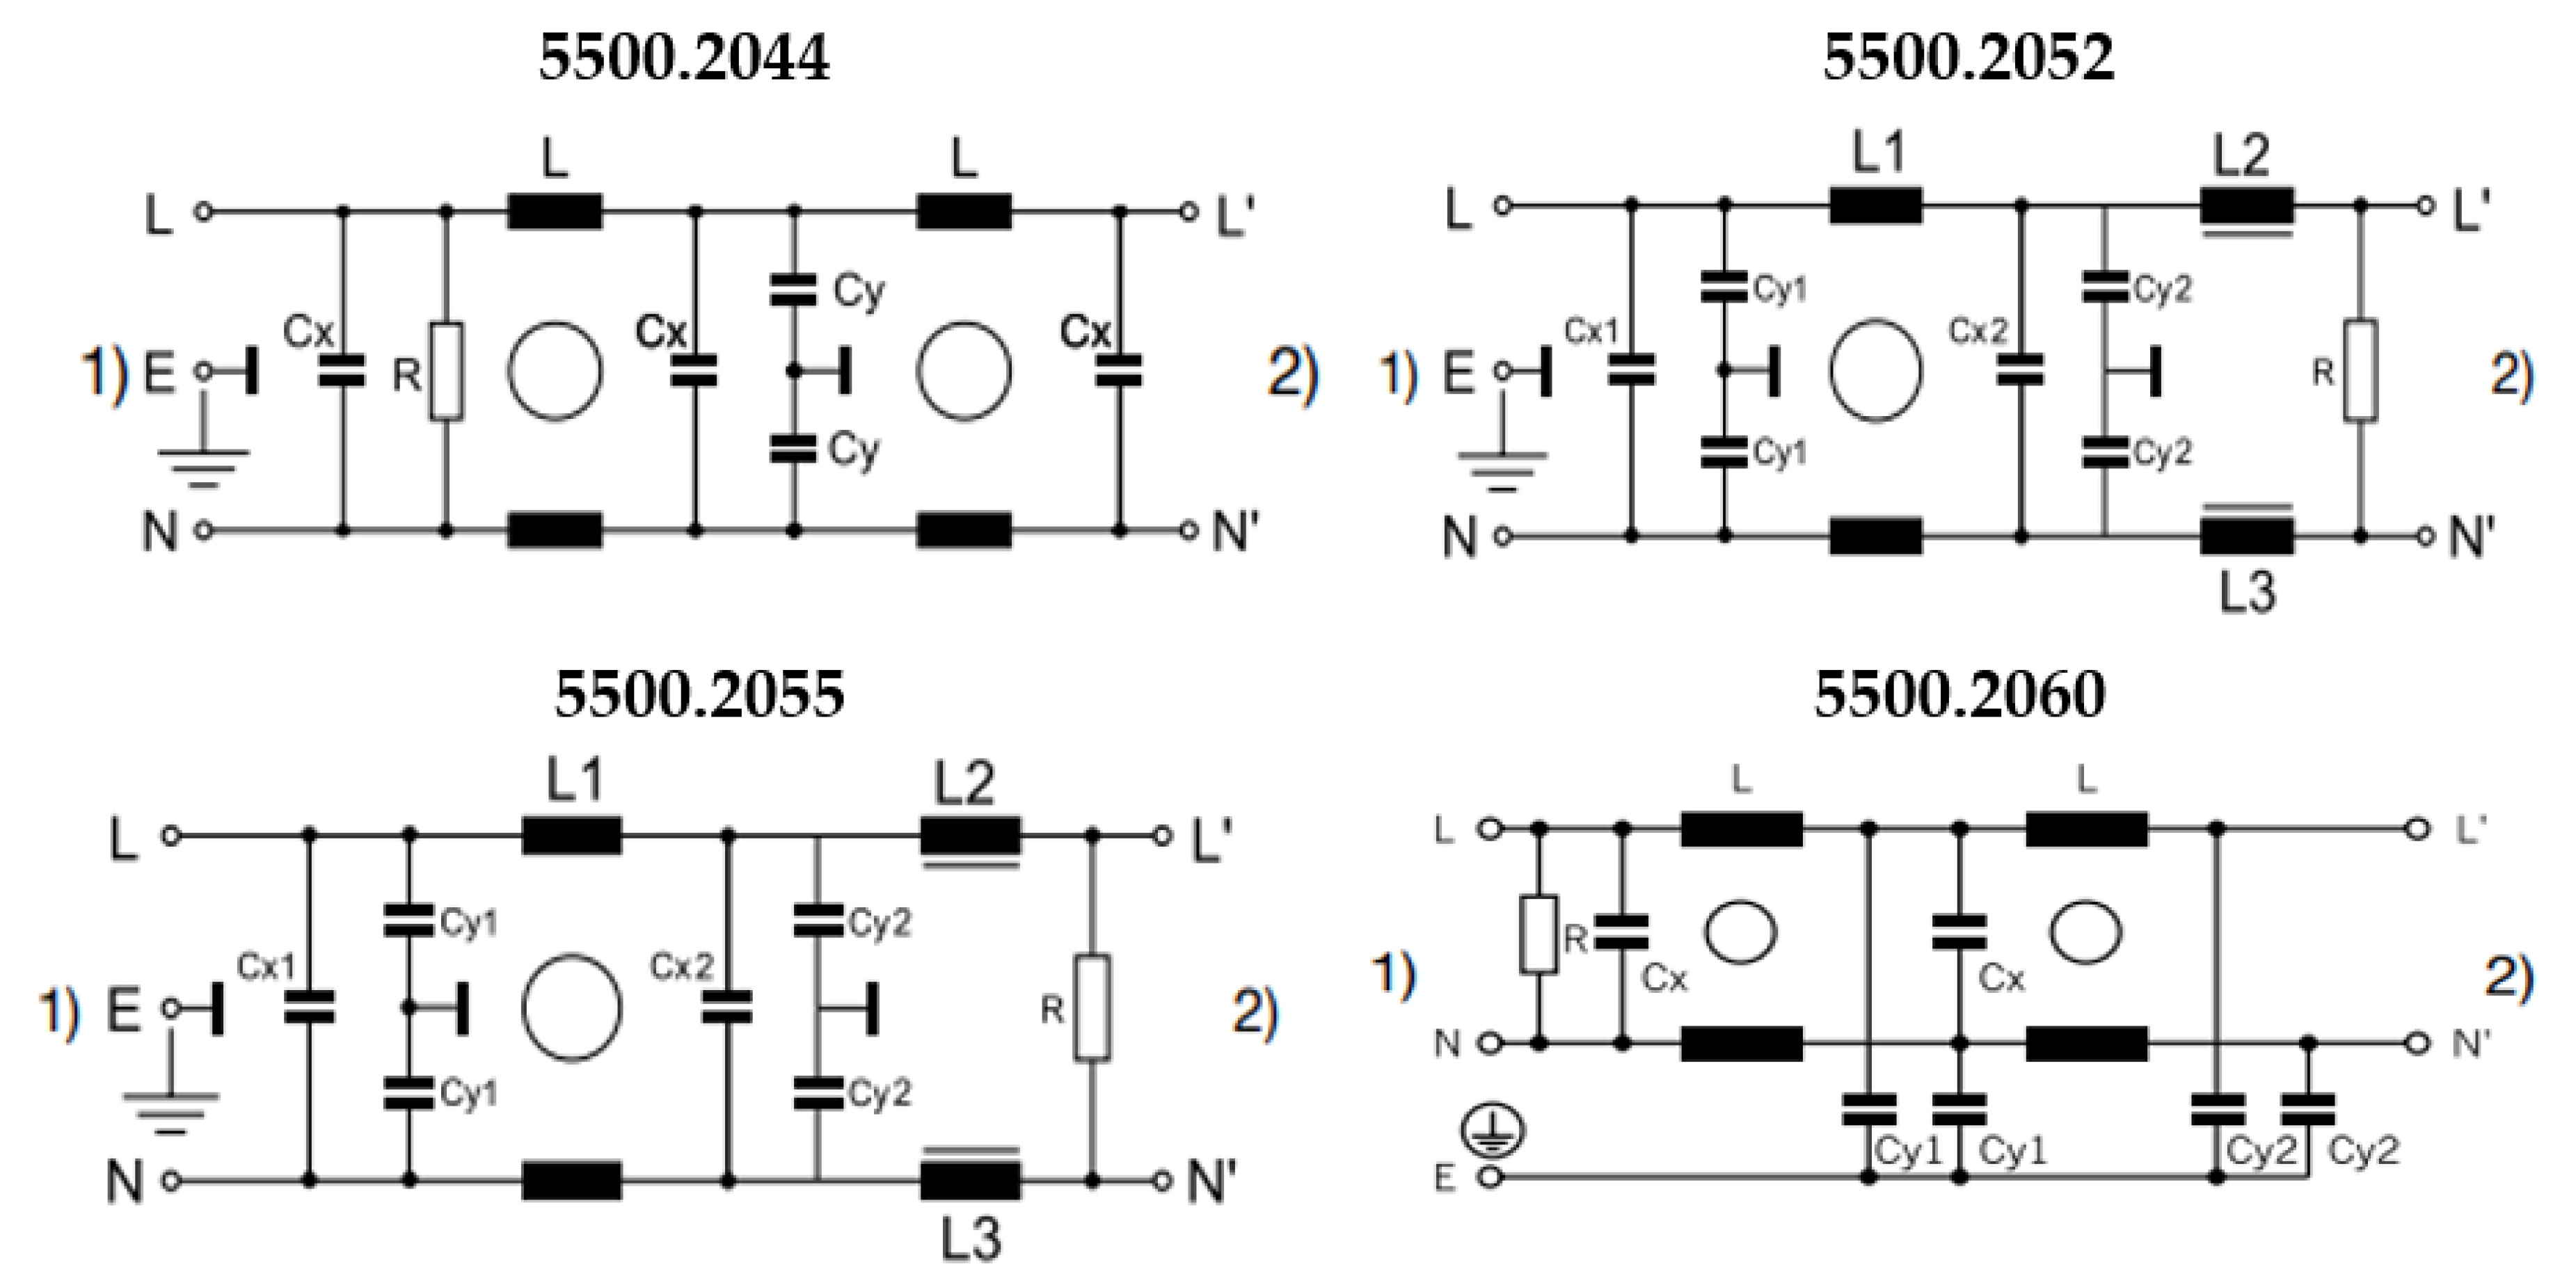
PLC according to PRIME v1.4 standard are established by means of two Microchip PL360G55CF-EK evaluation kits, in such a way that one is configured to act as a transmitter and the other acts as the receiver.
PRIME v1.4 specification uses the frequency band from 42 to 472 kHz. This range is divided into eight channels [10]. However, the communication modules of the boards are not prepared for transmission on channel 2. For this reason, this study considers channels 1 and 3 to 8.
In PRIME v1.4 specification, three types of frames are considered—Type A/PRIME v1.3.6 frames, designed for networks with devices that are only compatible with version 1.3.6, Type B, for PRIME 1.4 networks and, finally, Type BC, for networks composed of mixed equipment. The results shown in Section 3 have been carried out with Type B frames. In this way, the standard offers the possibility of transmitting using Differential Binary Phase Shift Keying (DBPSK), Differential Quadrature PSK (DQPSK) and Differential 8PSK (D8PSK) modulations with and without Forward Error Correction, as well as the two robust modes Robust DBPSK (R_DBPSK) and Robust DQPSK (R_DQPSK), which include a repetition by four.
A fixed message composed of 256 bytes is transmitted [14]. According to [11], the number of sent messages shall be at least 500 for each measurement of FER. In our case, for a certain measurement setup and signal configuration, 1000 frames are sent from the transmitter. In the receiver side, FER is calculated as the ratio of erroneous frames to total frames. An FER of 5 × 10 2 is used as the reference to obtain the threshold SNR, as it is considered that error ratios below this value will be solved by higher layers, thus leading to an NB-PLC without failures [11,14].
The receiver estimates the SNR for each frame as the reciprocal of the Error Vector Magnitude (EVM) plus 3 dB due to differential decoding. The EVM indicates the difference between actual received symbols and the ideal symbols in the in-phase/quadrature (IQ) constellation [10].

2.1.3. EMC Filters

In this paper, we analyse four EMC filters, designed according to IEC 60939-Passive filters for suppressing electromagnetic interference [15], whose characteristics are given in Table 1. The schematics and component values are shown in Figure 2 and Table 2. The references of the filters are 5500.2044, 5500.2052, 5500.2055 and 5500.2060 [16].
These filters show a wide range of impedance values along the PLC frequency band, mainly due to the resonance effects they cause at specific frequencies. The frequency-dependent impedance of these filters, in terms of magnitude and phase, can be found in previous publications from the authors [17,18].

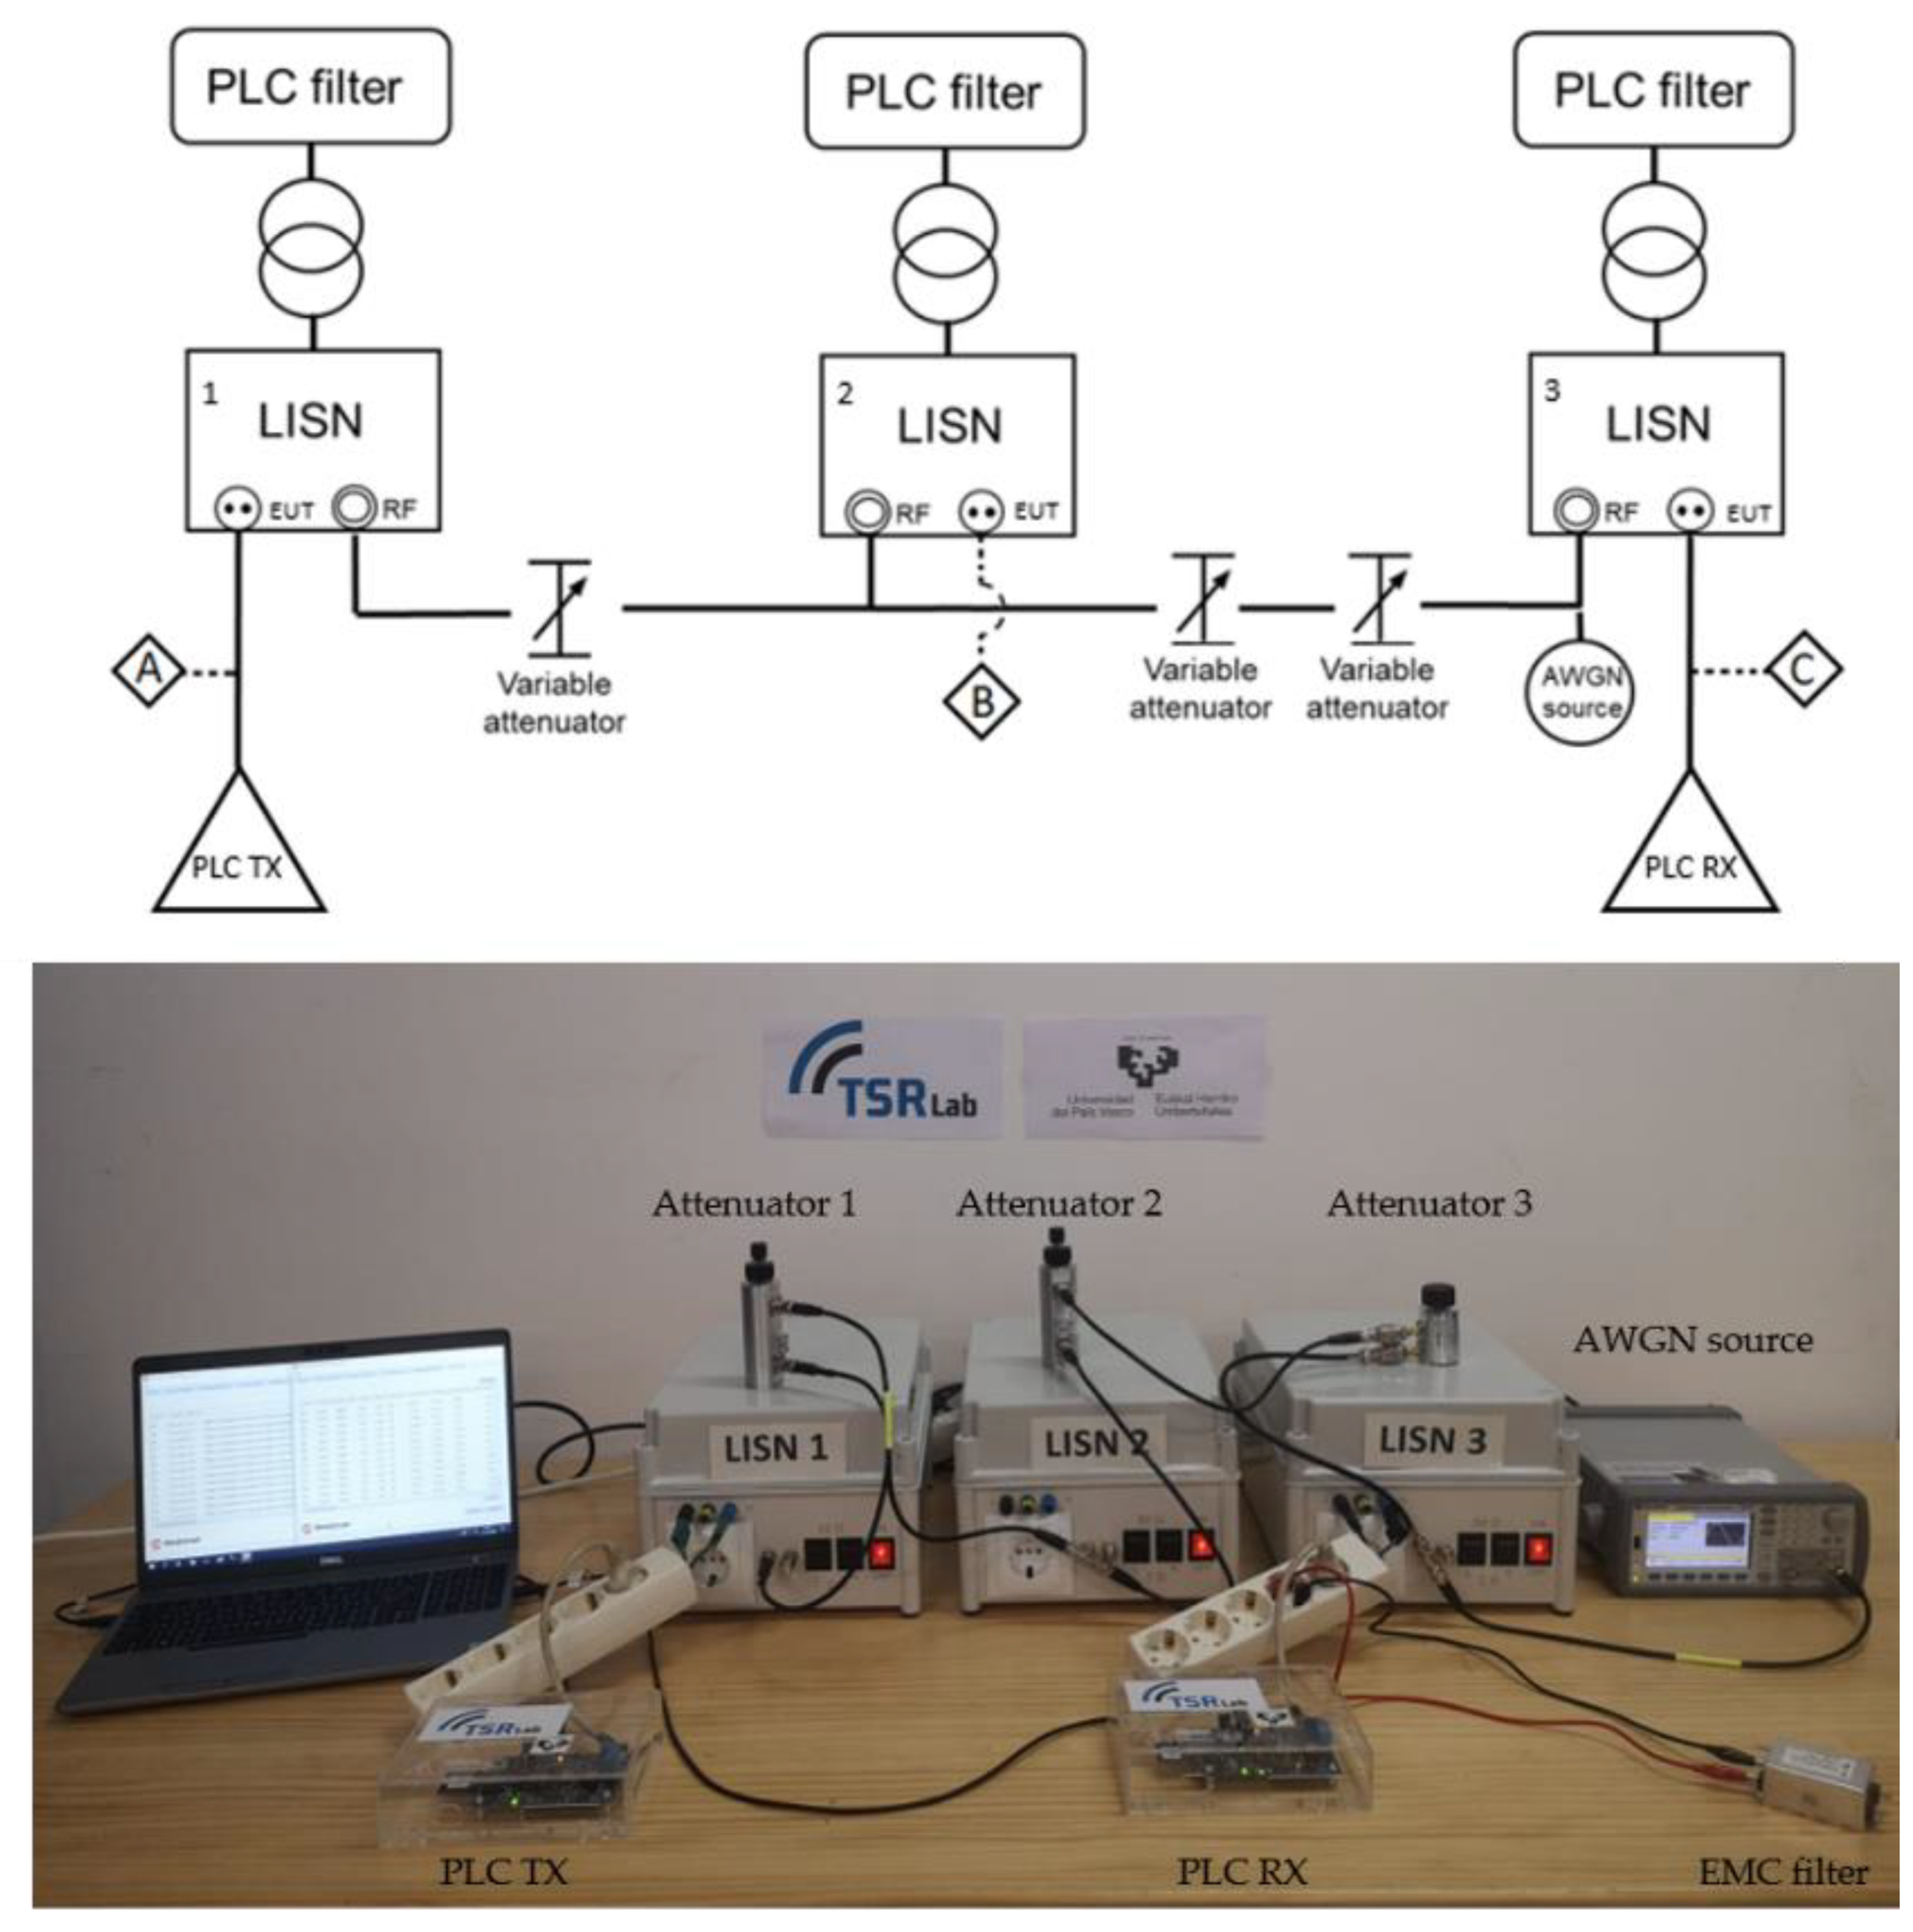
2.2. Measurement Setup

Three Line Impedance Stabilization Networks (LISNs) are used in the measurement setup. The main function of an LISN is to provide a precise impedance to the power input of the equipment under test (EUT). It also prevents the high-frequency noise of the power source from coupling in the system and provides a radio frequency (RF) noise measurement port. In our trials, the RF port acts as the communication channel for the NB-PLC signals.
In the measurement setup, the electric supply of the LISNs includes a PLC filter to avoid external communication signals to interfere with the tests, and a transformer for safety purposes. The LISN model used in the setup, whose characteristic impedance is 2 Ω, is designed according to the definition included in the PRIME specification [10]. Figure 3 shows the spectral variation of the actual characteristic impedance of the LISN, measured by the impedance measurement system described in [18].
Figure 4 shows the complete measurement setup. For evaluating the effects of EMC filters on NB-PLC, as described in Section 2.1, two communication boards according to PRIME v1.4 specification [10] are used. One acts as a transmitter and is connected to the first LISN, and the other acts as a receiver and is connected to the third LISN. The second LISN is used to connect the EMC filters under test in the communication channel between the transmitter and the receiver in some of the trials.
As one of the purposes of the tests is to evaluate the effect of passive EMC filters on SNR, the objective is that the variations on SNR are only related to the variations in the received signal due to the insertion of the devices under test. This is to say, the results of the tests should not be affected by the characteristics of noise. If no additional source of noise was included to the setup, the only source of noise would be the internal noise of the receiver, i.e., the noise which is generated internally within the receiver. This kind of noise cannot be characterized and it might have frequency-dependent characteristics. Moreover, under real scenarios, the level of noise of the LV network is always higher than the internal noise of the receiver, which is considered to be negligible. Therefore, in order to provide a fixed, low level of noise, and flat in terms of frequency, an external Additive White Gaussian Noise (AWGN) is injected by a signal generator into the RF port of the third LISN. The level of injected AWGN is higher than the internal noise of the receiver, so that the tests are not affected by the noise of the communication device.
In order to reduce SNR and calculate the corresponding FER, the attenuation of the two variable attenuators placed between the second and third LISN are sequentially increased. The first two attenuators allow the introduction of variations of 1 and 10 dB with a maximum attenuation of 110 dB. The third is a 1 dB attenuator with 0.1 dB increments. The variable attenuator located between the first and the second LISN is fixed at 3 dB, except when it is not possible to reach a FER of 5%. In that case, a 2 dB attenuation is selected.
The EMC filters are connected at either Point A, B or C, considering two different configurations—an open-circuit configuration, i.e., when no external load is connected to the filter in L’-N’ [17,18], and a loaded configuration, when a passive load composed of a 50 Ω resistor connected in series with a 560 nF capacitor is connected in L’-N’. For the latter configuration, a 50 Ω resistance is observed for the load of the EMC filters in the frequency band of interest.
For the measurenment of the channel frequency response using the measurement system described in Section 2.1, the signal isinjected at point A and measured at point C. This is to say, P1 and P2 from Figure 1 correspond to point A and point C in Figure 4, respectively.

2.3. Summary of Performed Tests

A comprehensive set of laboratory trials has been planned and performed.
Regarding the channel frequency response measurements, first, the channel frequency response when no device under testing is connected is measured as a reference, covering the whole frequency range of interest. Then, with the objective of evaluating the influence of the location of the filters, the channel frequency response is measured when each EMC filter is connected in the EUT port of each of the three LISNs. The trials are carried out for the two configurations of the EMC filters—open-circuit and with a passive load.
With regards to the potential effects of EMC filters on NB-PLC systems, and starting from a reference in which no device under testing is connected to the setup, the FER-SNR curves are represented for seven communication channels as defined by PRIME v1.4 specification. Then, FER-SNR curves are obtained for the four EMC filters under test connected at Points A, B and C and for the two configurations mentioned above. Finally, five modulations from PRIME v1.4 specification are considered in order to analyze their robustness against channel variability—DBPSK, DBPSK_C, DQPSK_C, R_DBPSK and R_DQPSK.

3. Results

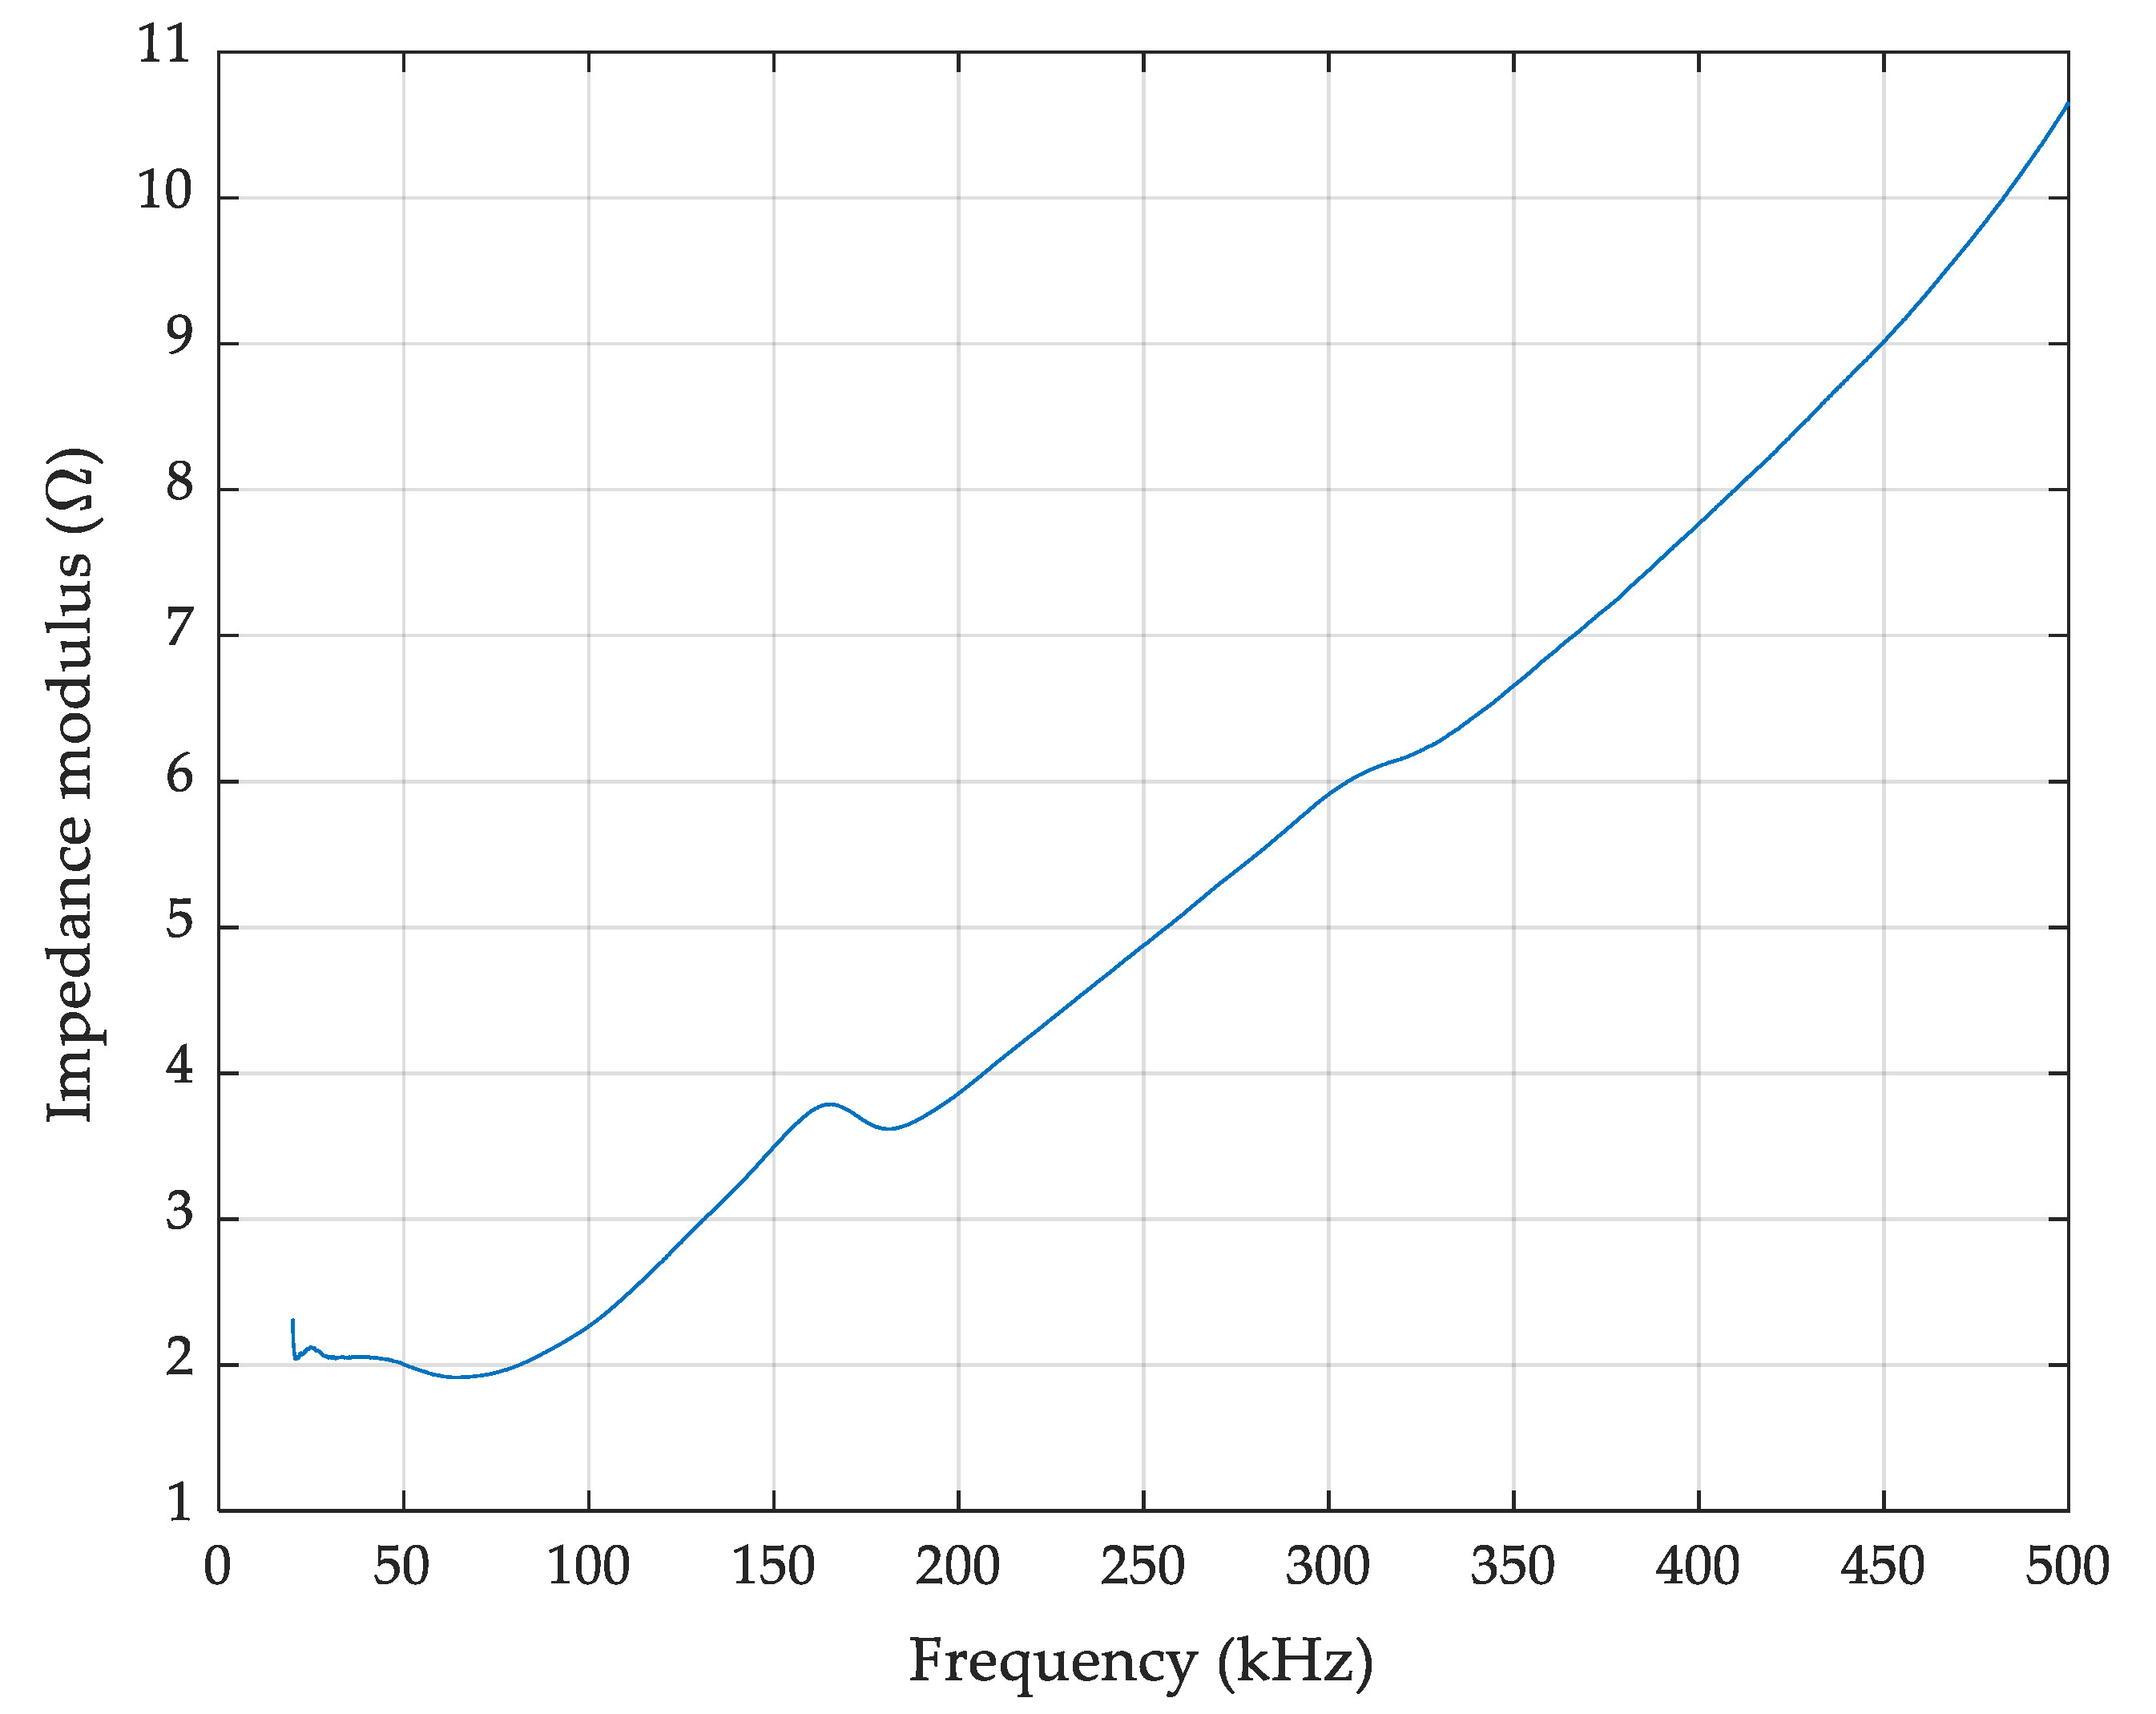
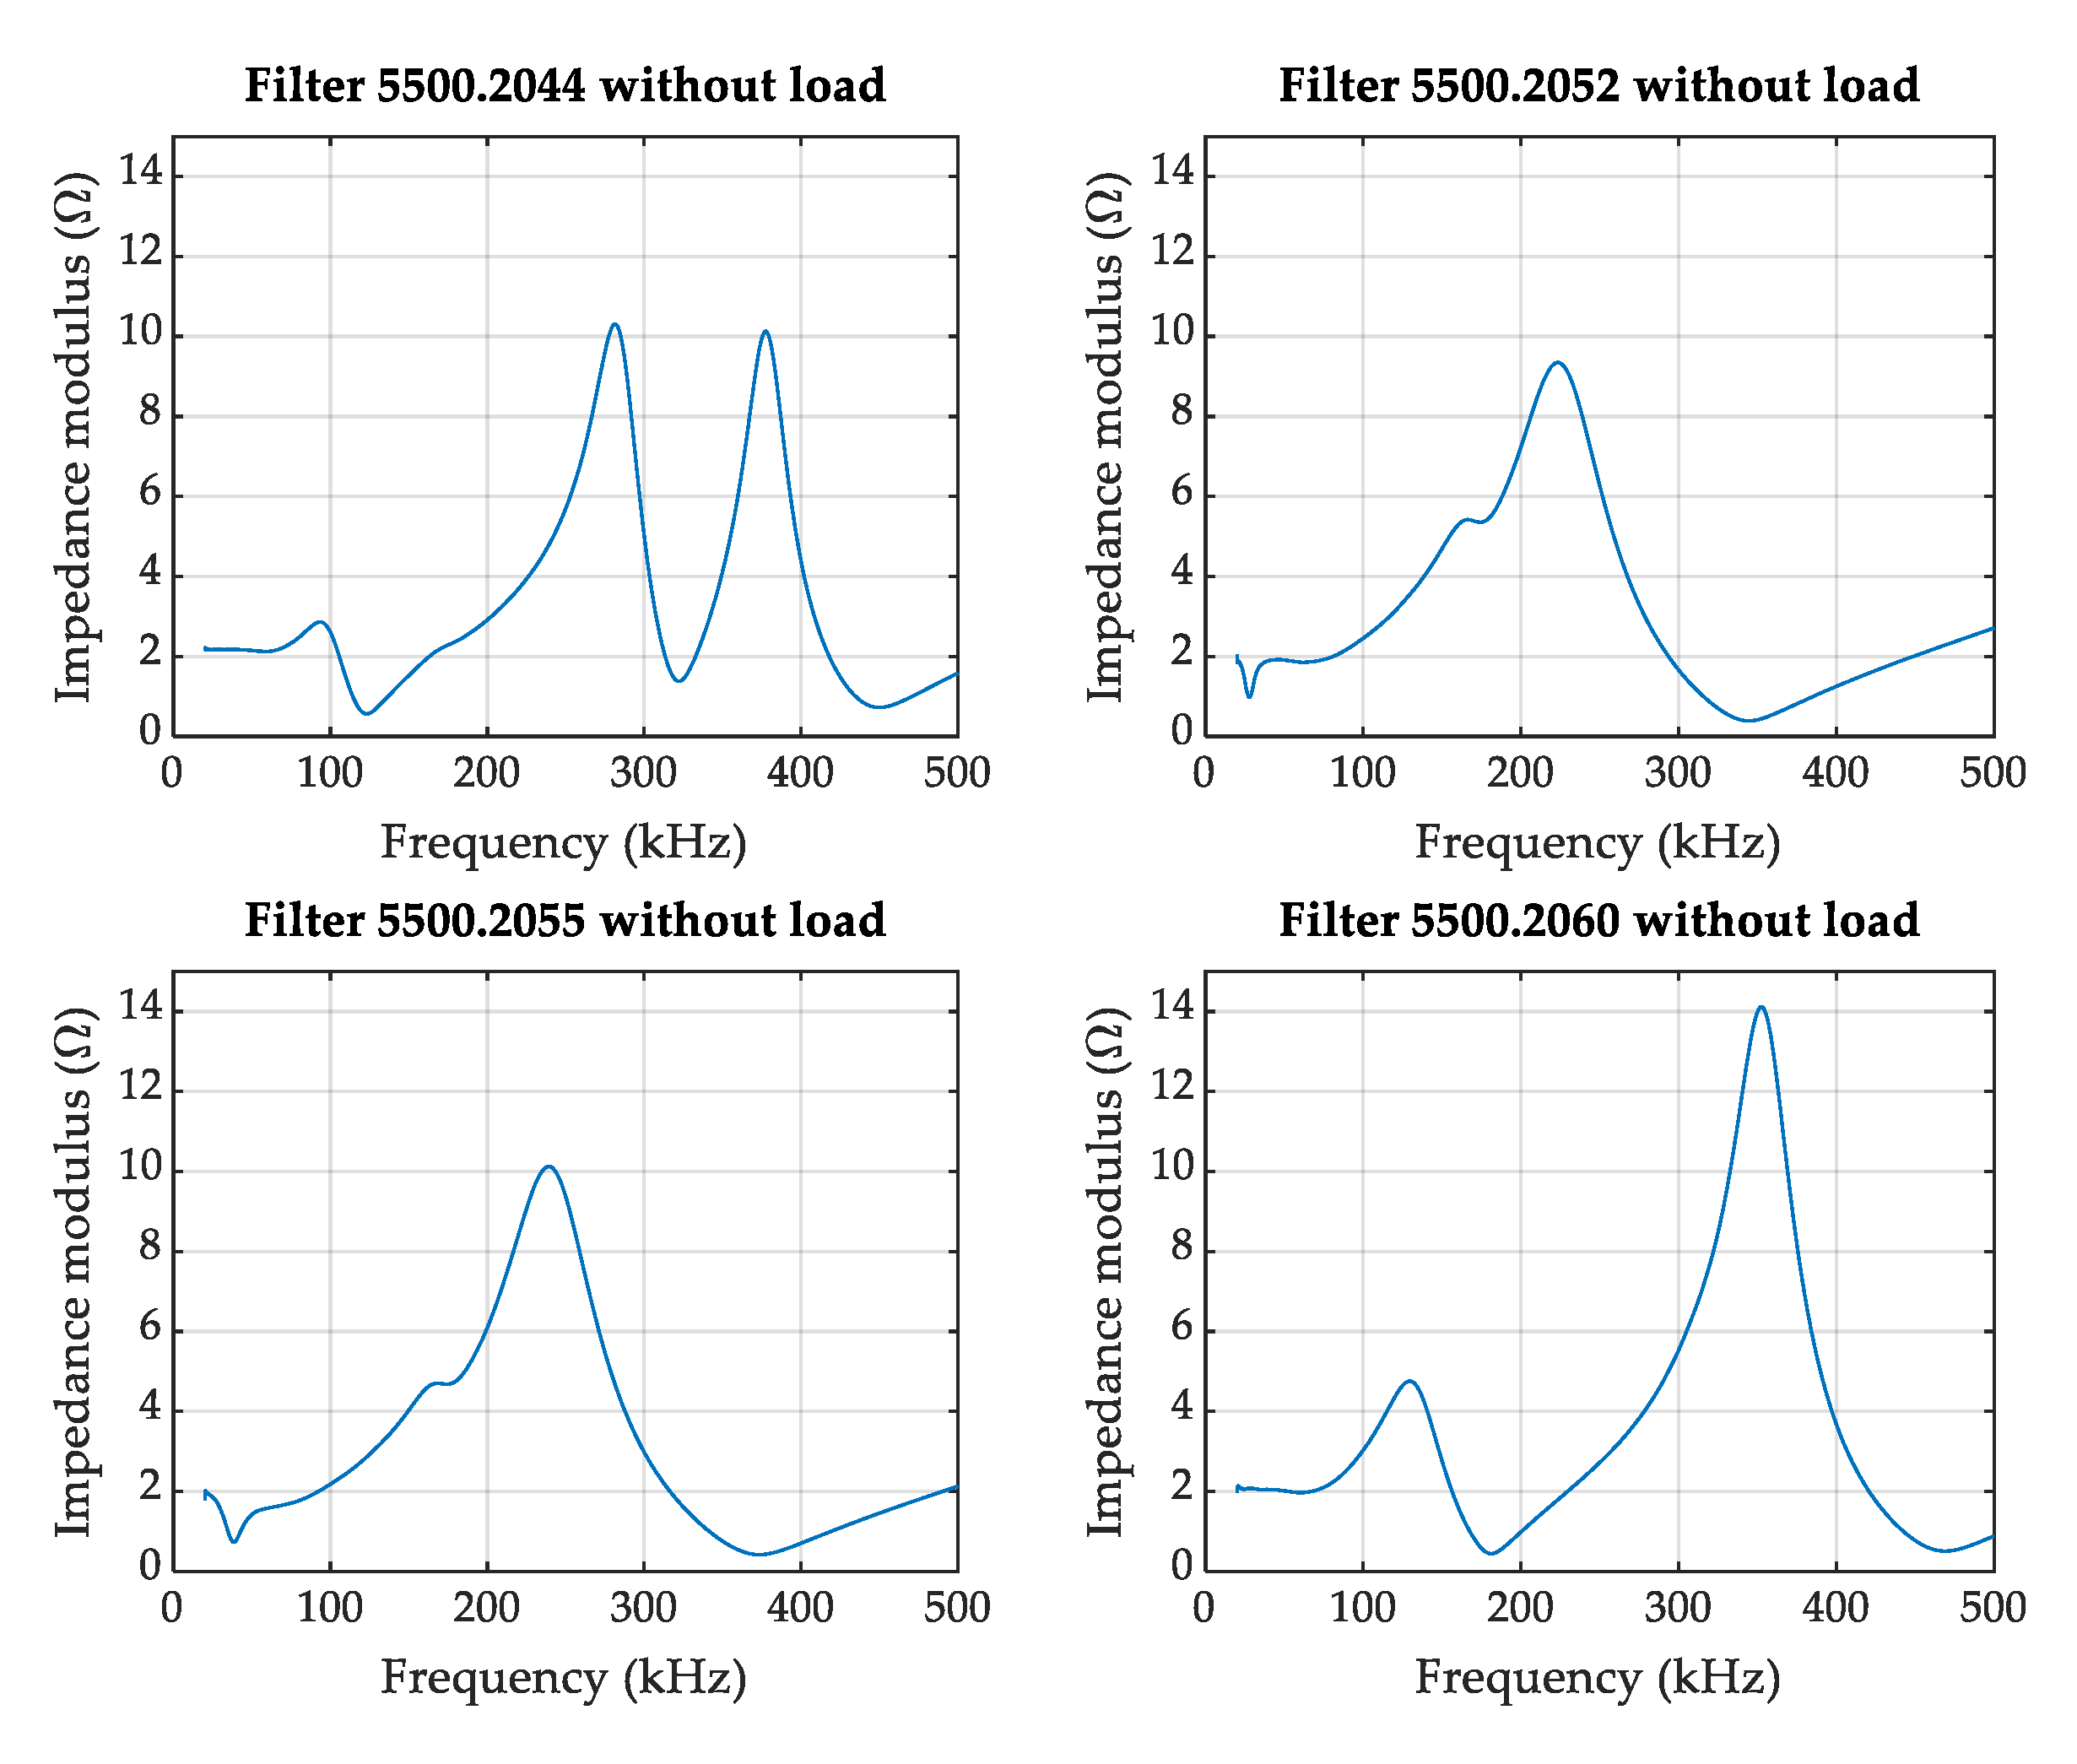
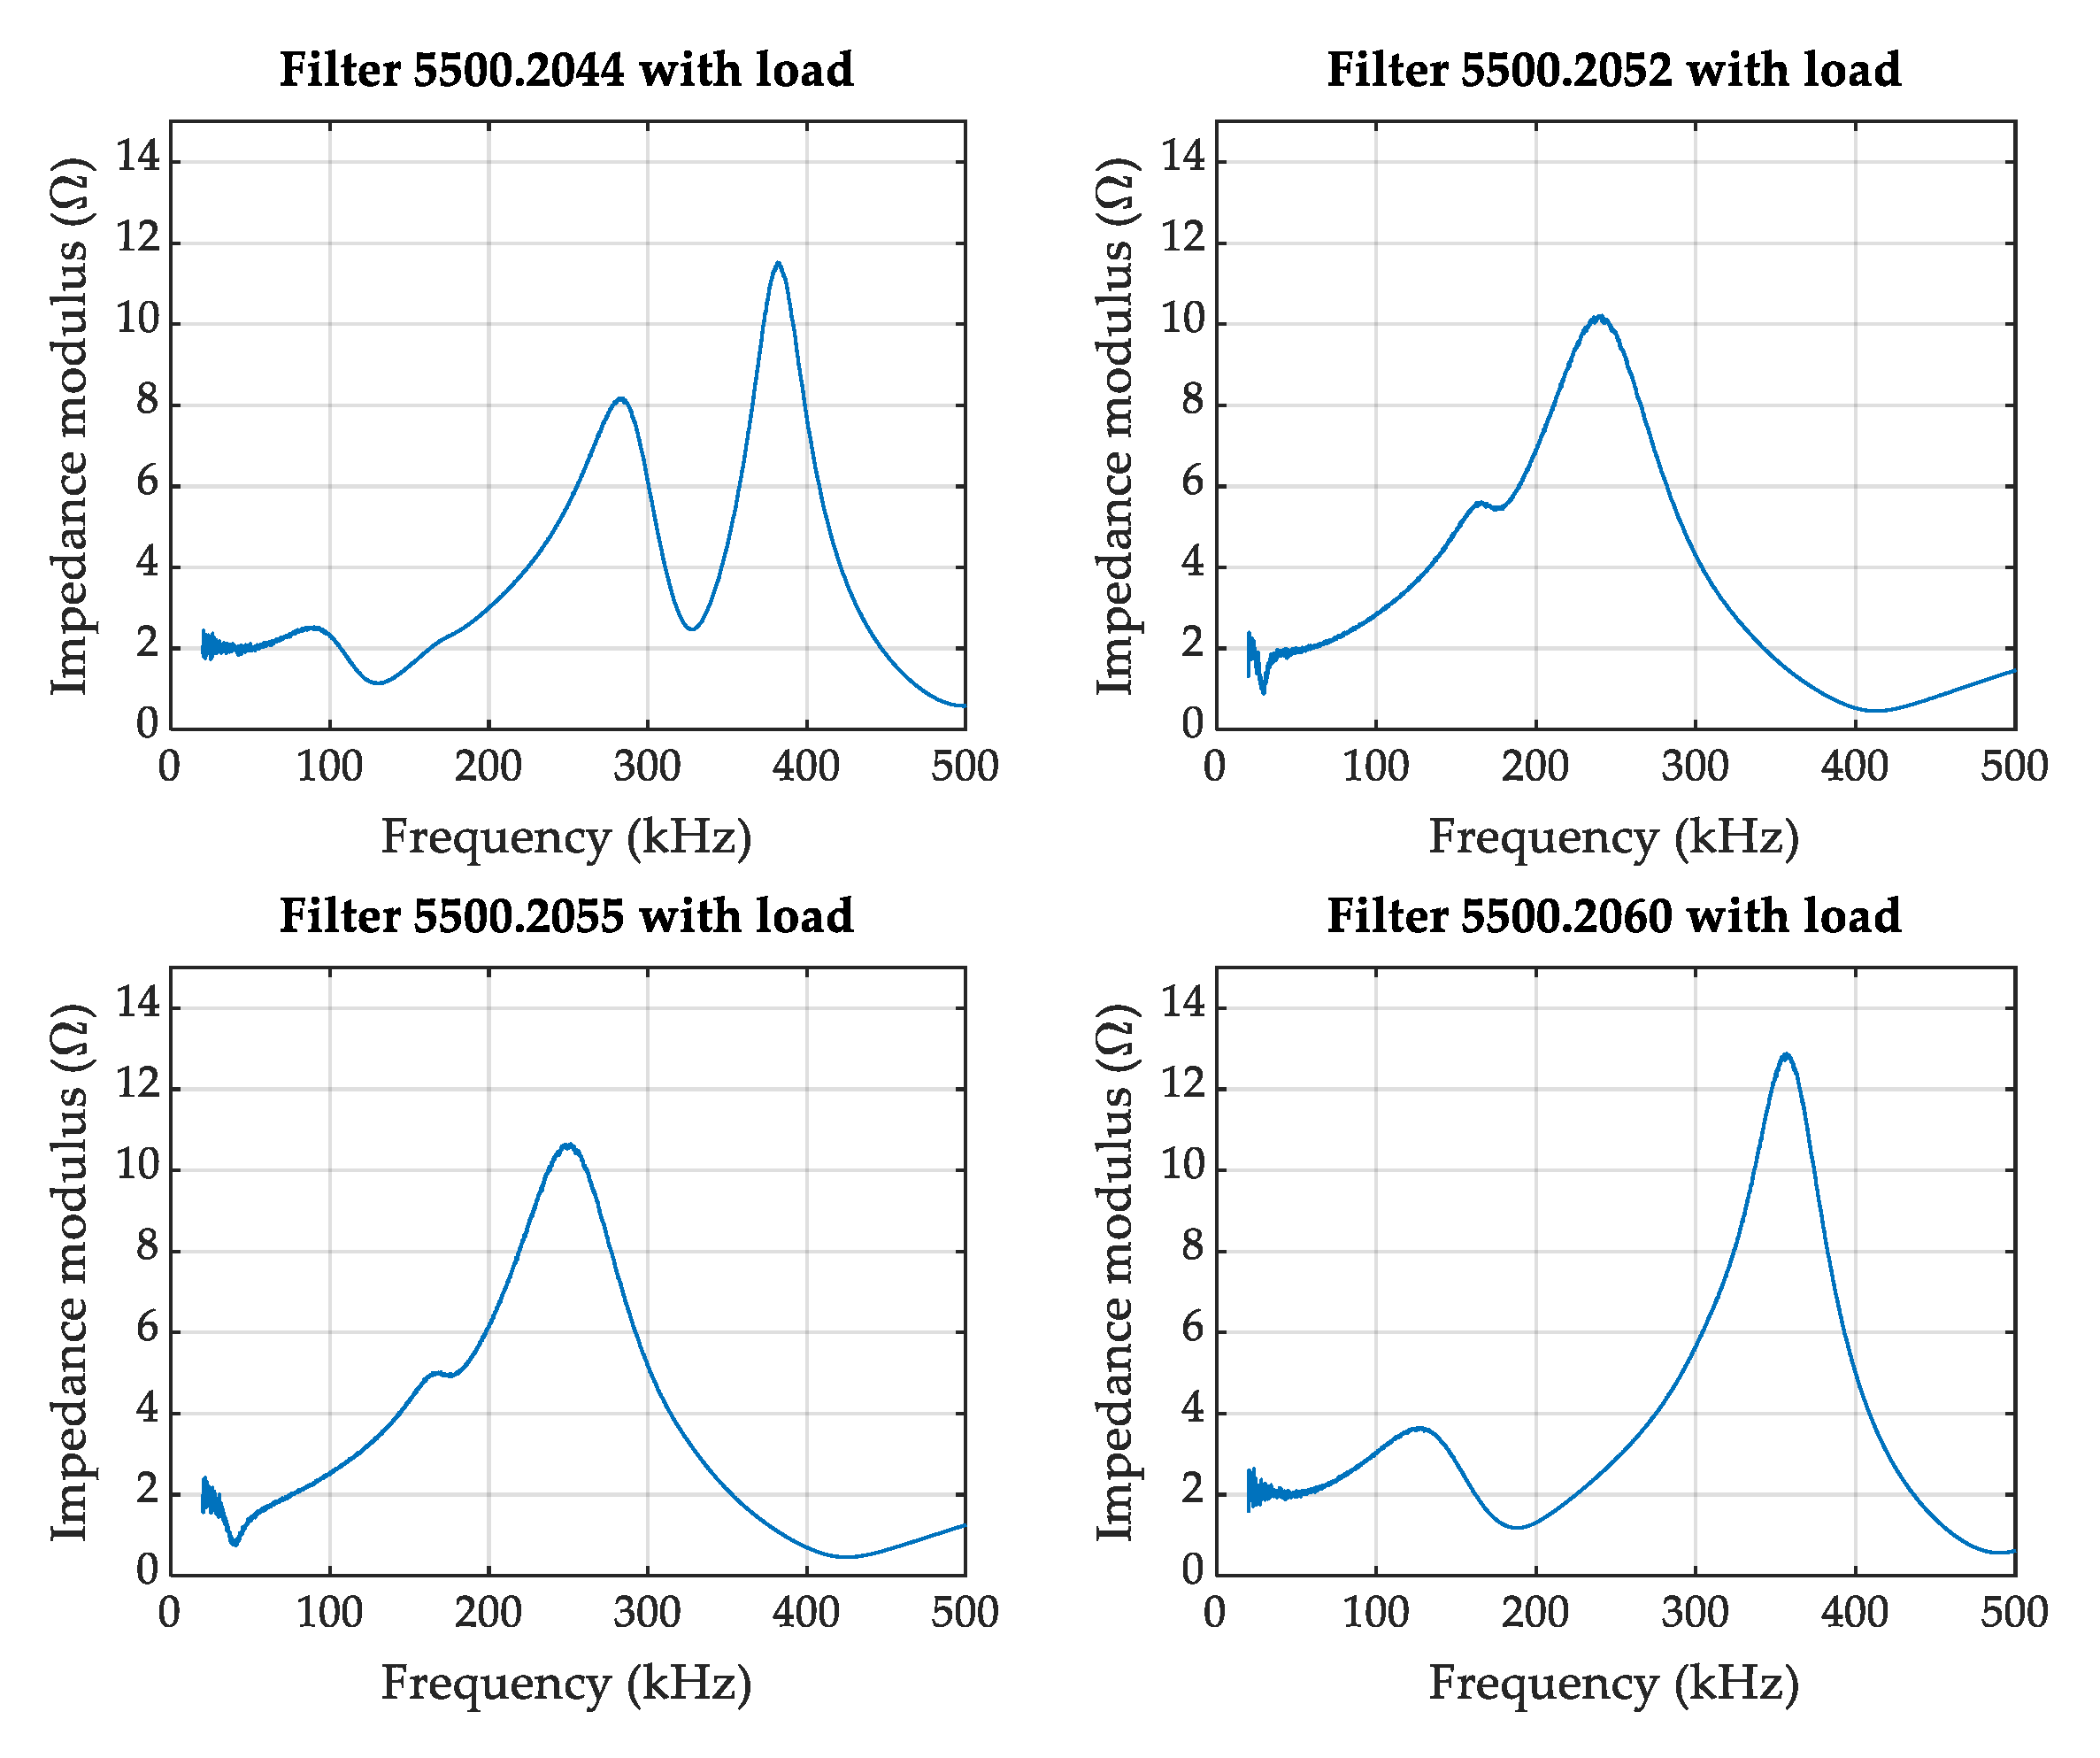
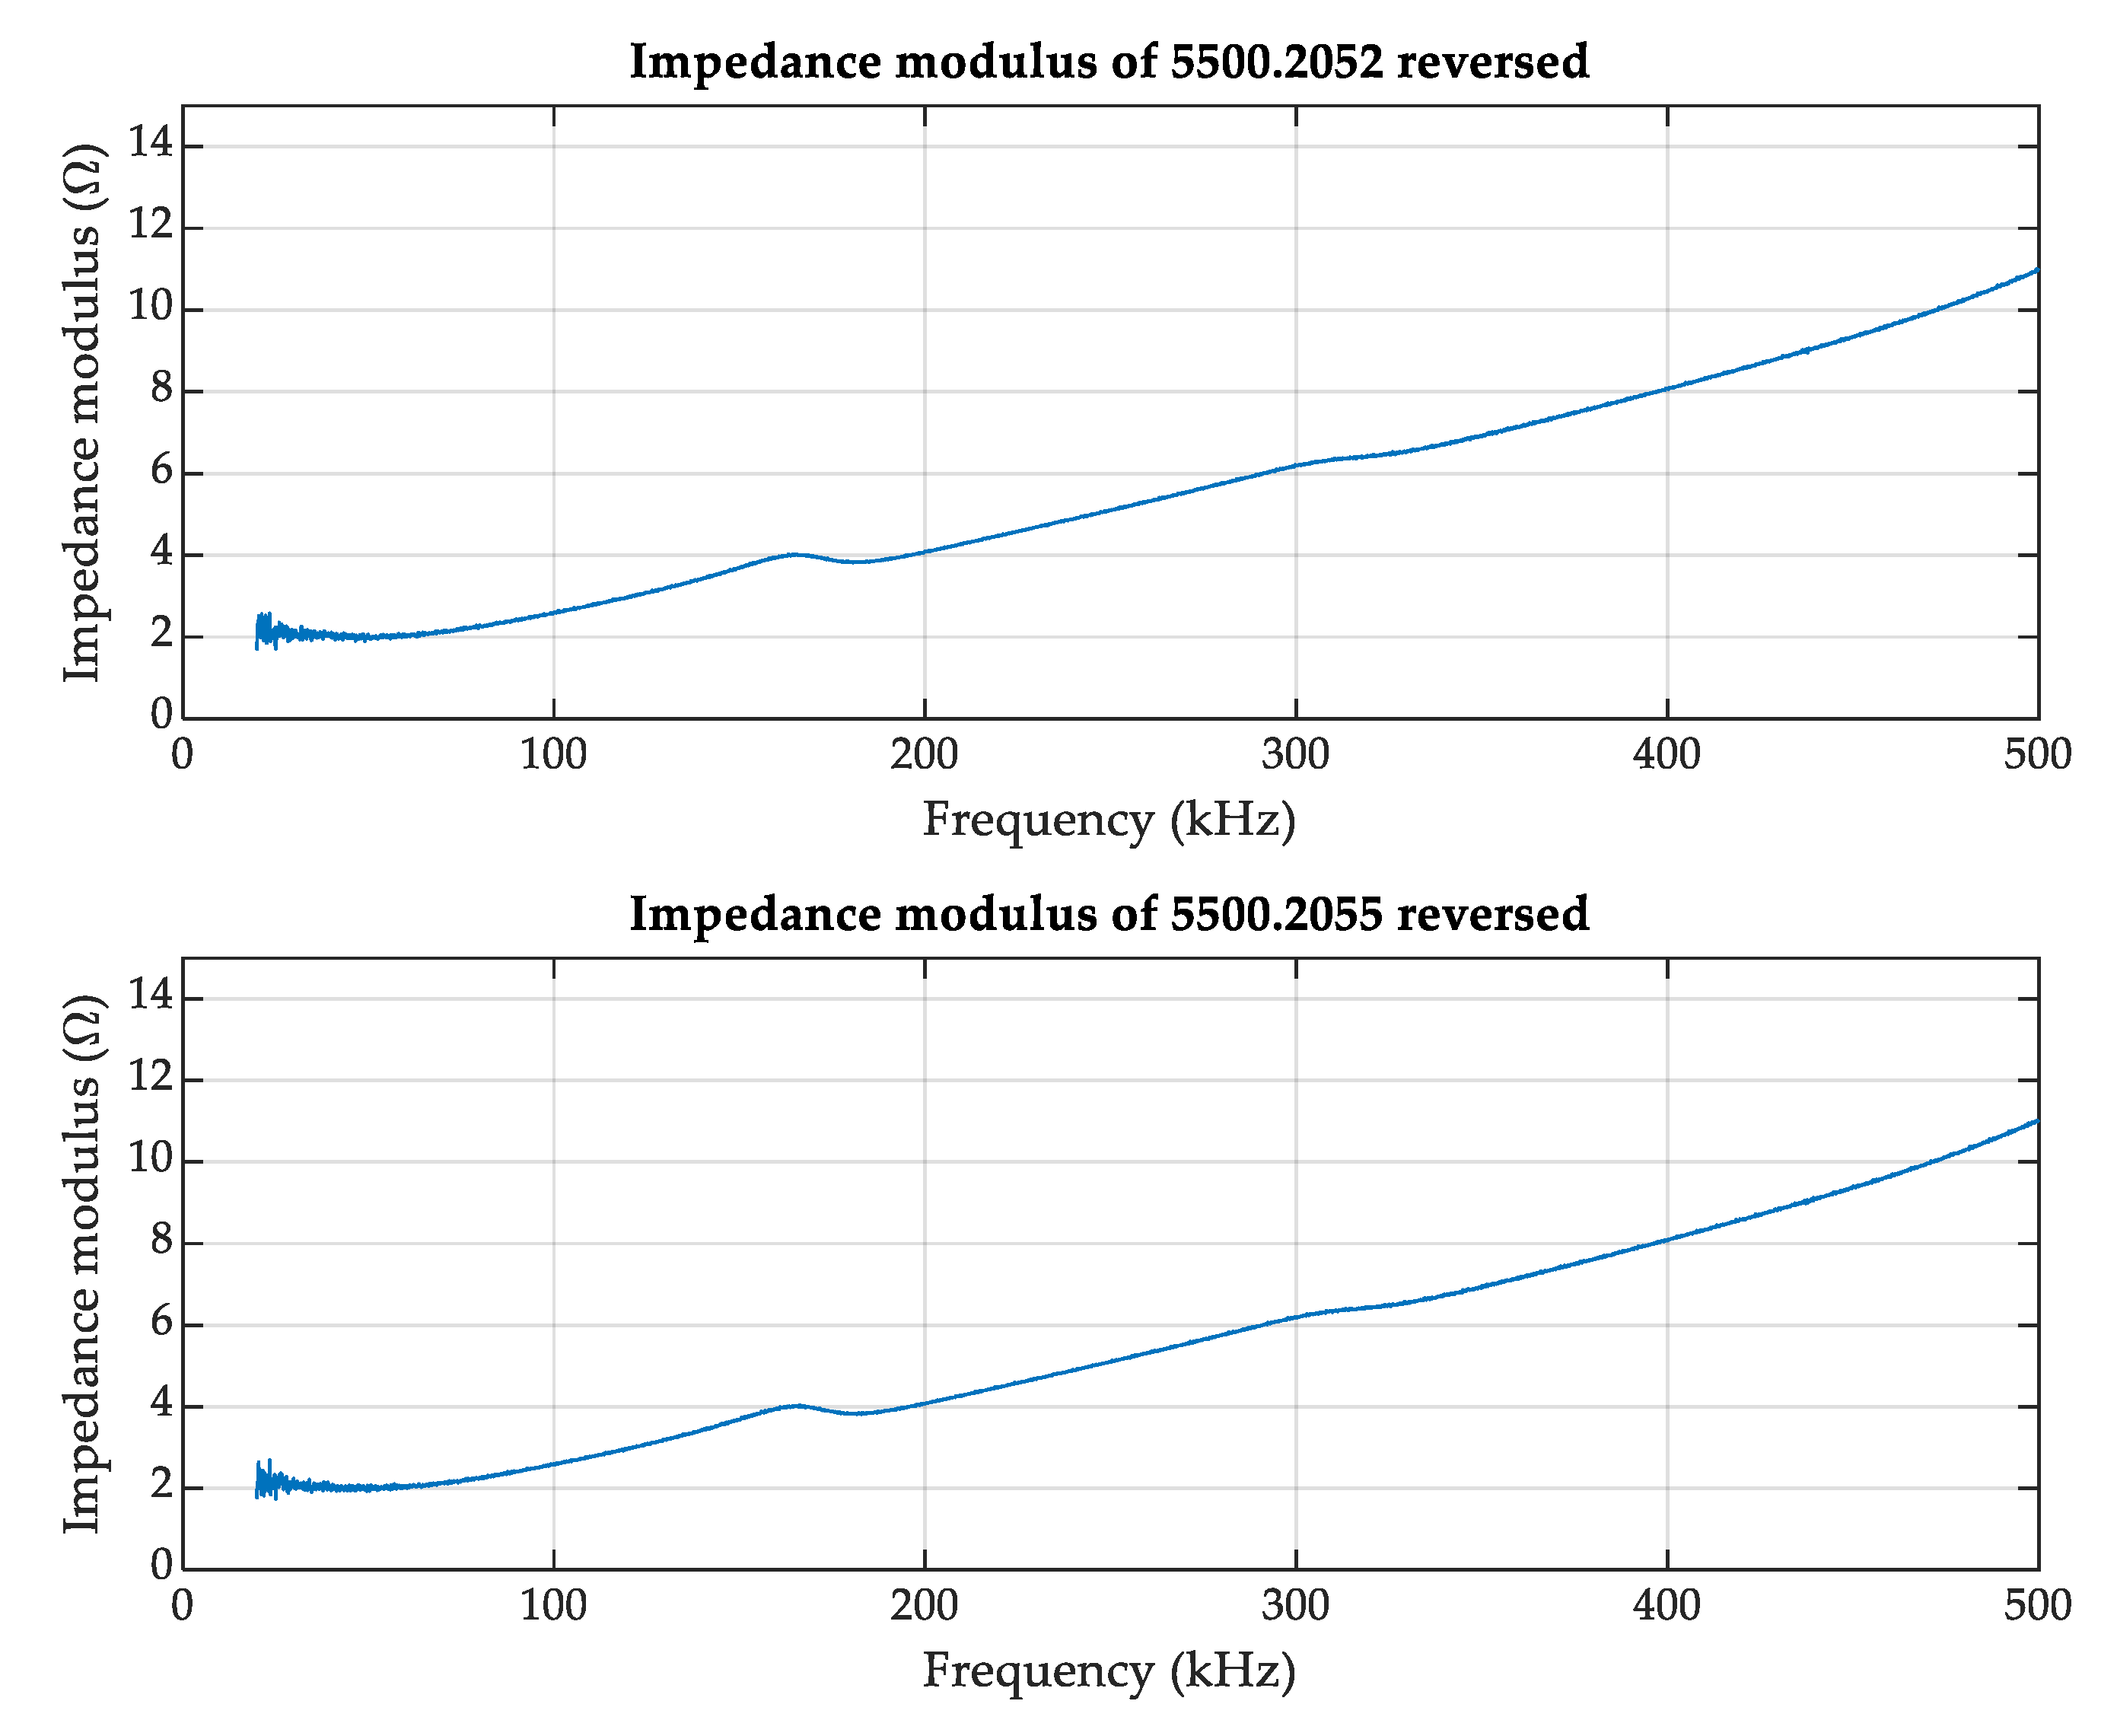
3.1. Impedance Variations Due to the EMC Filters

Figure 5 shows the impedance measured at the EUT port of the first LISN when the different filters are connected at this same point in the open-circuit configuration. For that purpose, the impedance measurement system described in [18] has been used.
Similarly, Figure 6 shows the impedance modulus of each EMC filter when connecting L-N ports to the setup and L’-N’ to the load.
As it can be seen, the EMC filters introduce important impedance variations within the frequency band of interest. The variations shown in Figure 5 are the result of the combination of the impedance of each EMC filter and the components of the LISN, as can be observed if compared to the offline impedance measurement of the filters found in [18]. If Figure 5 and Figure 6 are compared, it is observed that the connection of a passive load to the EMC filters results in some minor variations in the impedance magnitude, while the overall frequency characteristics are maintained.
Table 3 and Table 4 gather the mean value and the standard deviation of the impedance measured when the EMC filters are connected to the setup, calculated for seven communication channels defined in [10], for the open-circuit and the loaded configurations, respectively. The statistical characterization of the impedance is provided as an estimation in order to relate the characteristics of the impedance with the attenuation suffered by the PLC signal and the potential degradation of the communications on each communication channel.

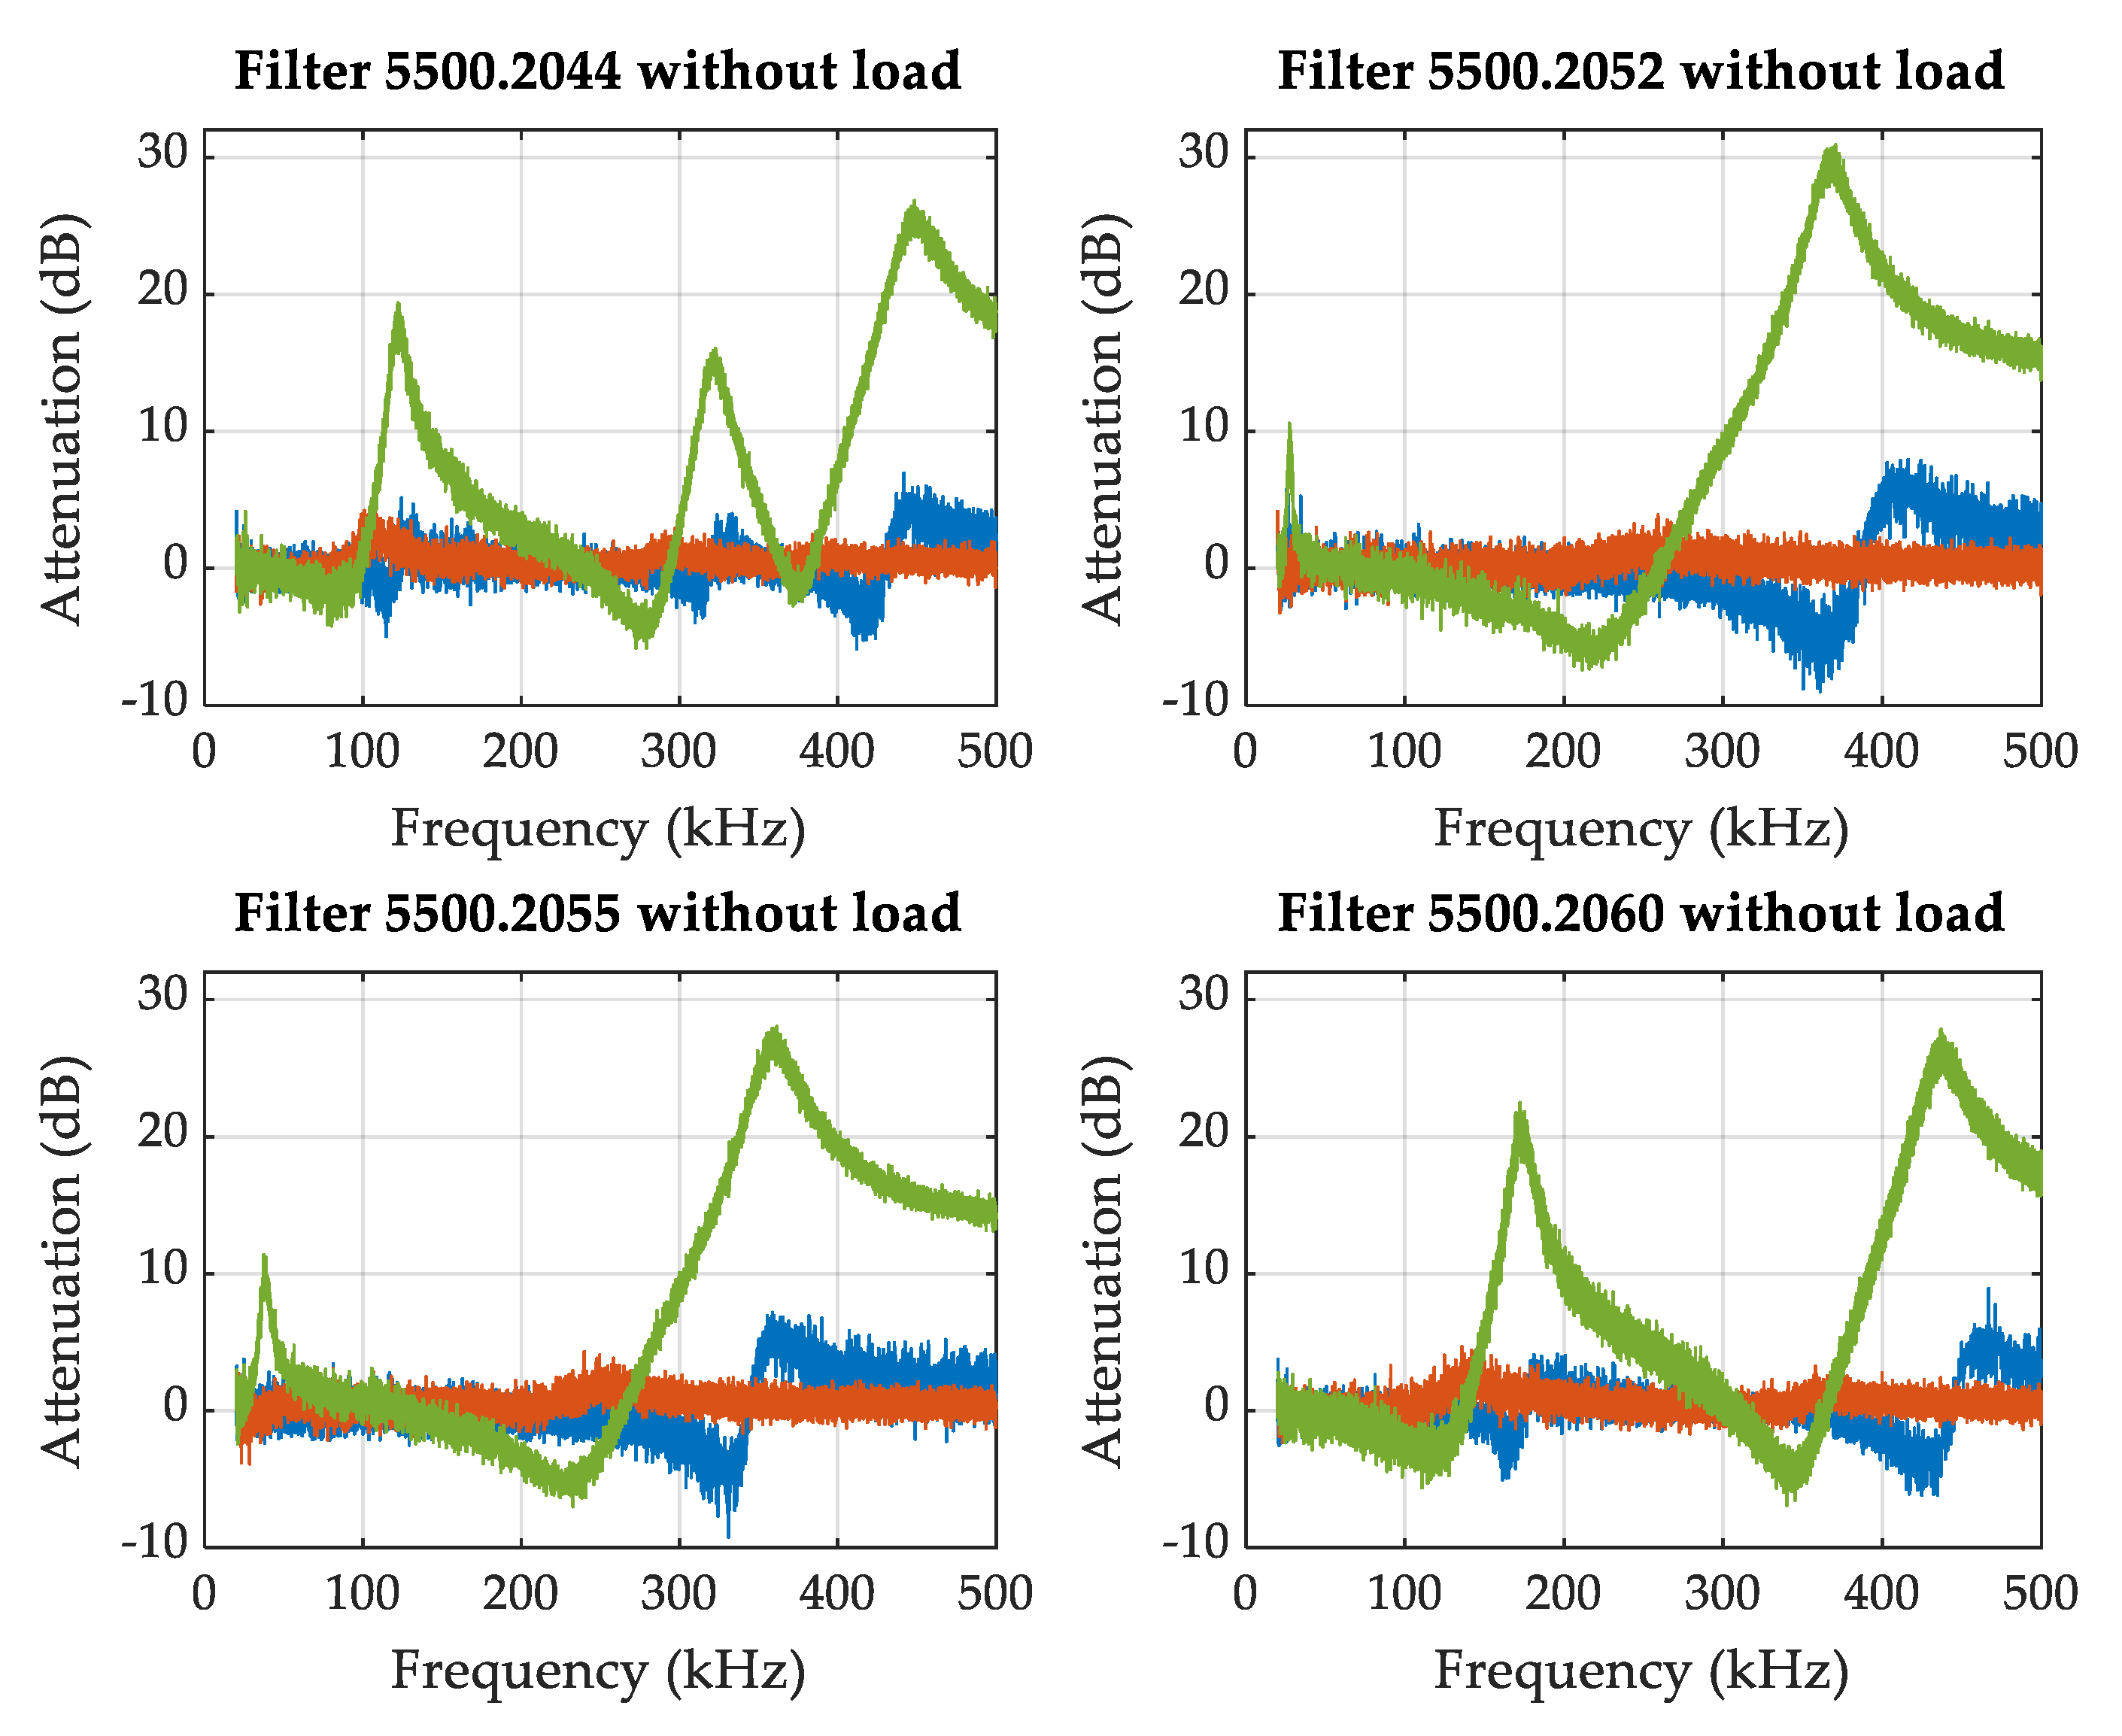
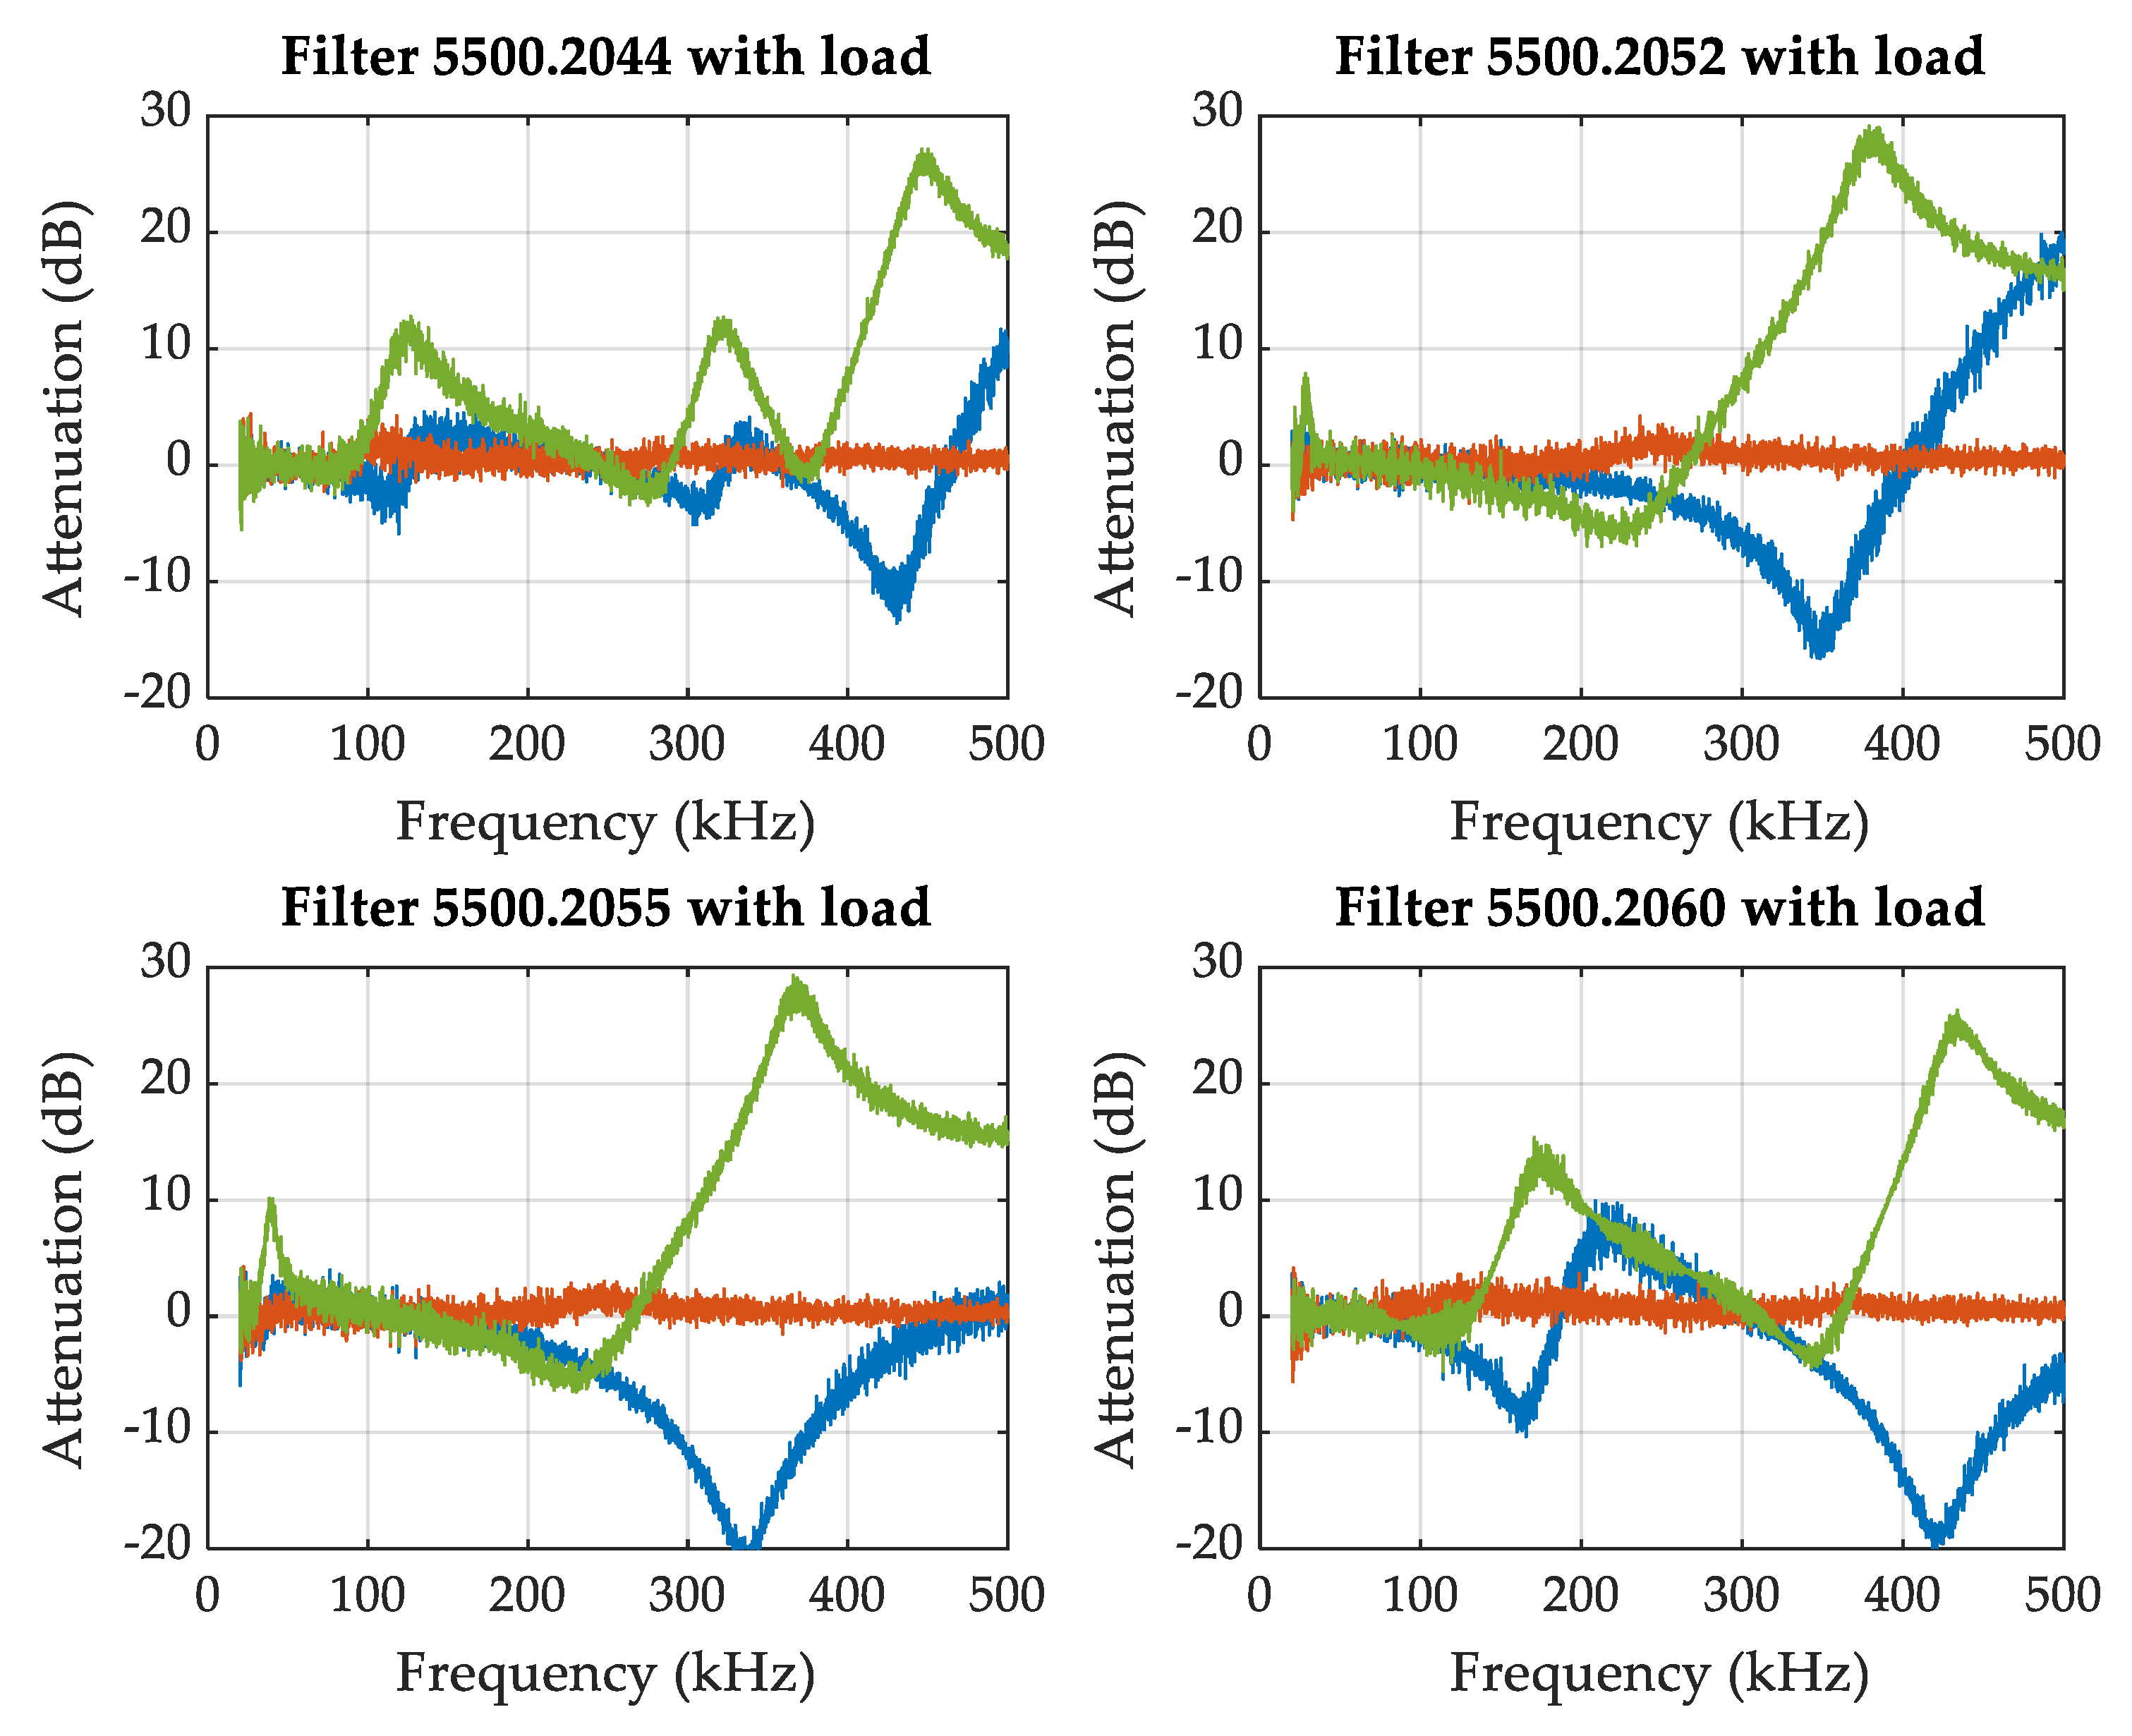
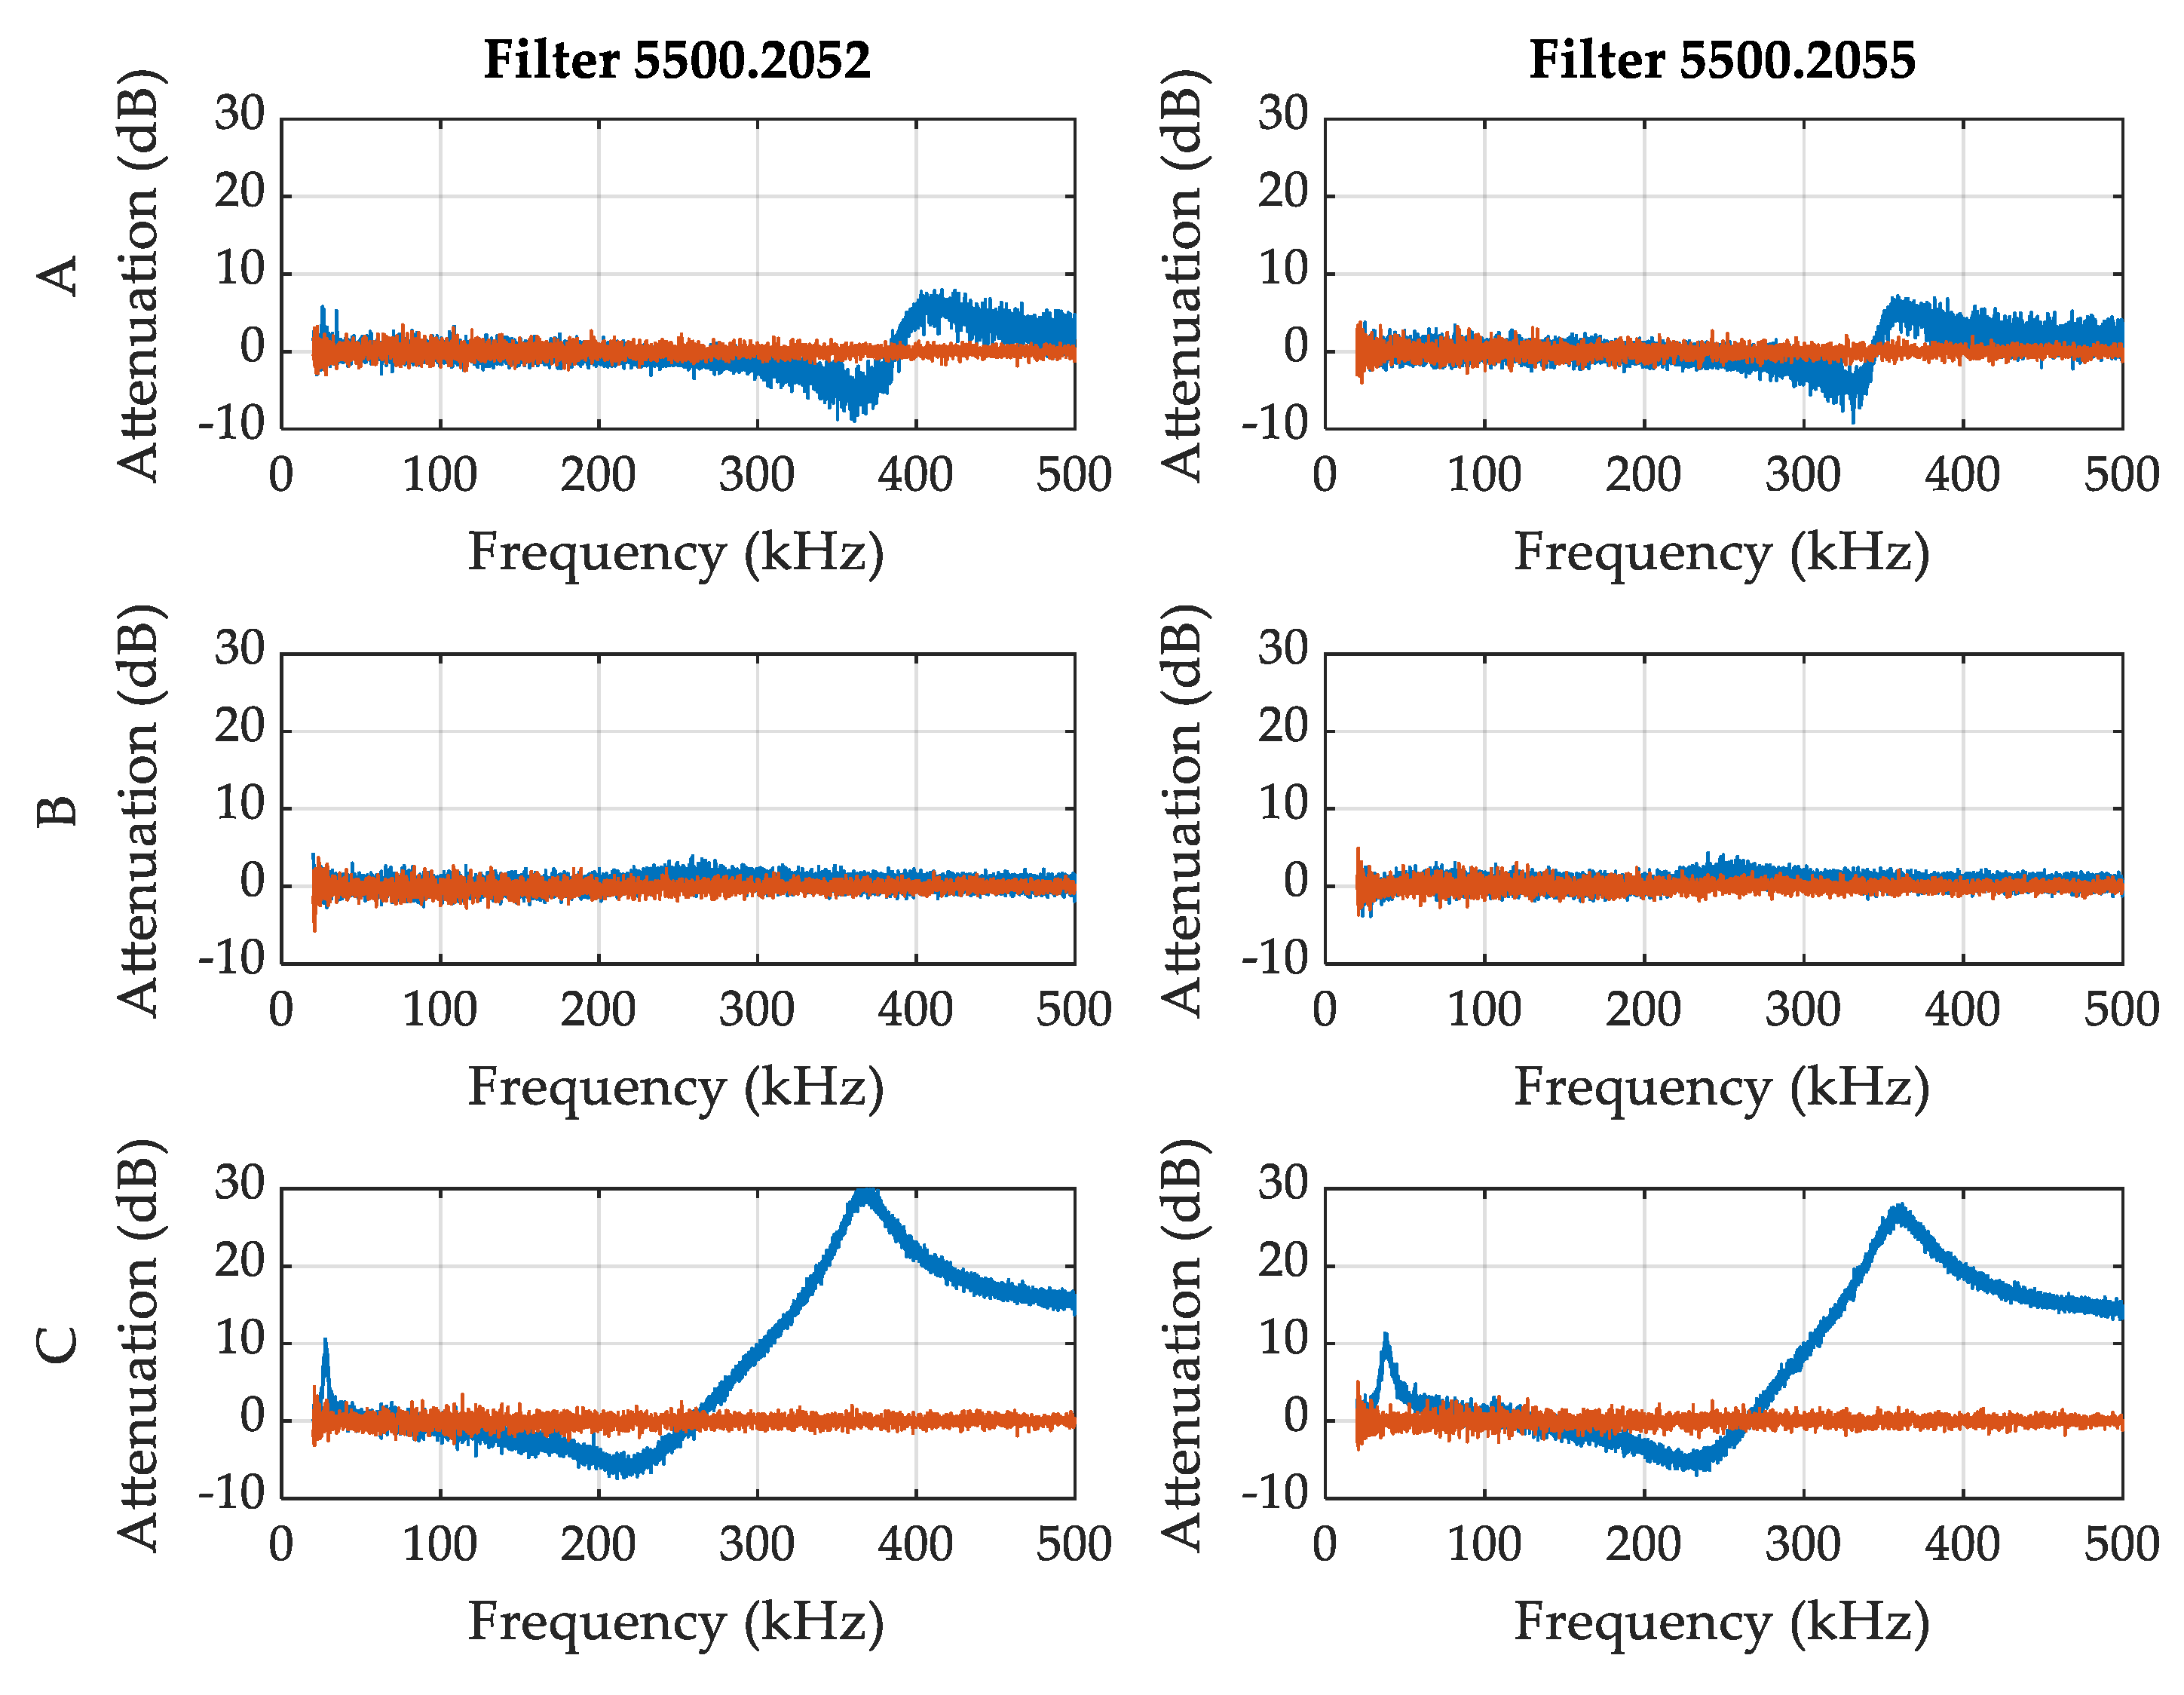
3.2. Signal Attenuation Due to the EMC Filters
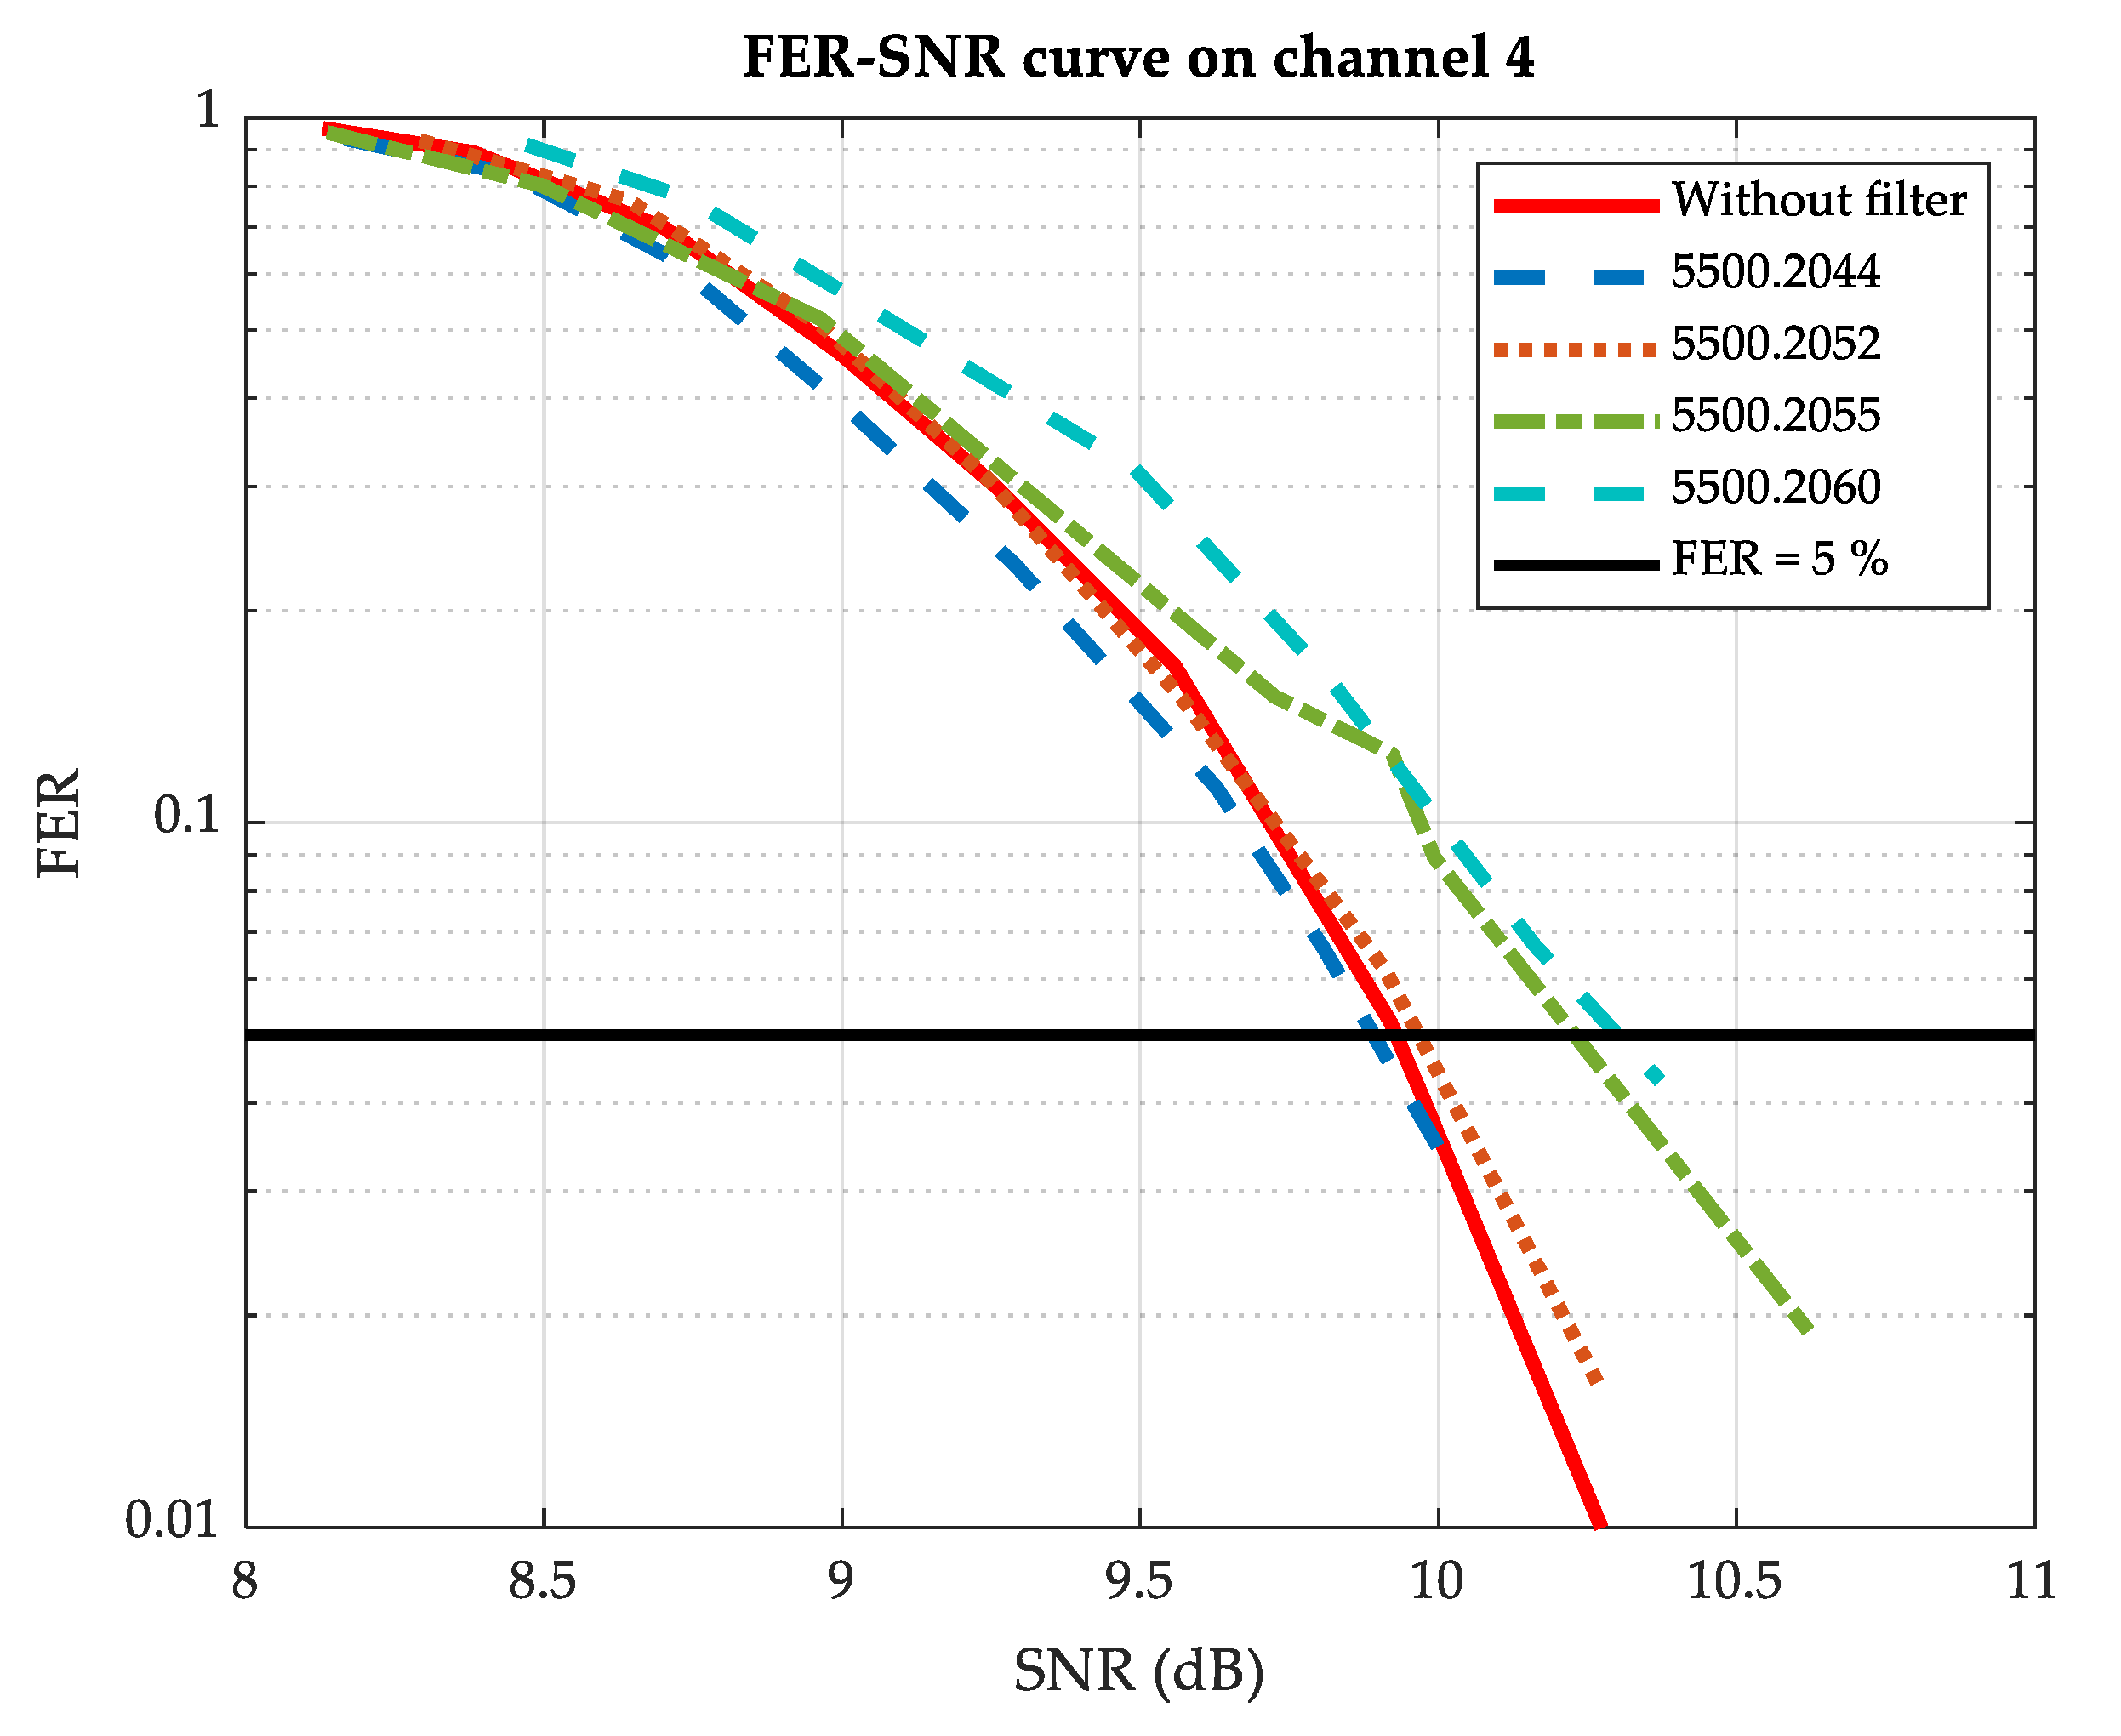
As a result of the impedance variations introduced by the EMC filters, the resulting channel frequency response also varies. In this section, the attenuation introduced by each of the EMC filters is analyzed. For this purpose, using the measurement system explained in Section 2.2, the channel frequency response is calculated when a filter is connected and in absence of it. The signal attenuation due to the filter is defined as the difference between both channel frequency responses. Figure 7 shows the signal attenuation due to the four EMC filters when connected at points A, B and C in the open-circuit configuration.
As shown in the figure, the attenuation introduced by the filters greatly depends on the point of connection. Attenuation measured when the filter is connected at points A or B is very low, being practically 0 dB when connecting them in the EUT port of the second LISN. By contrast, the attenuation introduced by the filters when connected at the same electrical port as the receiver is very high on some frequency channels. Therefore, the impact is considerably more noticeable when the filter is connected near the communications equipment, especially if it works as a receiver. It should be taken into account that the communication equipment deployed in the field performs both transmitting and receiving functions. Therefore, in practice, an EMC filter near a communication equipment might imply an additional problem for NB-PLC, especially when receiving frames from other equipment. Previous works had also shown that the channel characteristics are mainly dominated by appliances not very distant from the measurement location, and that channel characteristics are not necessarily symmetric [19,20]. This is also observed in our case when connecting the EMC filter at A and C and obtaining different results. The asymmetry found in the characteristics of the transmission channel is precisely due to the couplers used for NB-PLC equipment [21].
It should also be noted that there are also some negative values that are due to the parallel and/or series resonances introduced by the EMC filters. These negative values do not represent an amplification of the signal. They reflect that, in some cases, there is a better situation of impedance matching when an EMC filter is connected with respect to the situation where no filter is connected to the setup.
Similar results are obtained when measuring the attenuation introduced by each filter when an external load is included, as shown in Figure 8.
In order to analyze the characteristics of attenuation in detail, Table 5 and Table 6 gather the mean value and the standard deviation of the attenuations measured when the EMC filters are connected at point C, for the different communication channels defined in PRIME [10], and for the open-circuit and loaded configurations respectively.
As shown in the tables, the mean value of the attenuation can be even higher than 20 dB for some filters and frequency channels. This implies that NB-PLC can be greatly affected or even interrupted if the receiver is working near its sensitivity threshold and one of these components is connected nearby. Comparing the results of Table 5 and Table 6 with the measured impedance values of Table 3, it seems that low impedance values that are maintained along the communication channel, that is, with low standard deviation, are more critical in terms of attenuation than abrupt drops on the impedance frequency response. More precisely, all the mean attenuation values higher than 15 dB are due to mean impedance values lower than 3 Ω. For example, when connecting filter 5500.2052 at point C in open-circuit configuration, in channel 7, the attenuation is very high, 24.20 dB. For this configuration, the mean value of the resulting impedance is 0.44 Ω and the standard deviation is 0.08 Ω.
Moreover, the standard deviation values of Table 5 and Table 6 indicate that there are important variations of the attenuation within certain communication channels, which might lead to degradations of the quality of NB-PLC. This aspect is analyzed in the following section.

3.3. FER-SNR Curves

In the previous section, we proved that the introduction of the filter is highly influential when connected near to the receiver. For that reason, FER-SNR curves will only be represented when the filter is connected at point C.
The analysis of the influence of the filters on PLC is carried out through the representation of FER-SNR curves. For each configuration, SNR is calculated as the mean value of the SNRs of the total number of transmitted frames.
Initially, the idea was to obtain results for different modulations, DBPSK, DBPSK_C, DQPSK_C, R_DQPSK and R_DBPSK, in order to evaluate the influence of the EMC filters in modulations with and without error correction and repeating codes.
As an example, Figure 9 shows the FER-SNR curves obtained when no filter is connected and when the four EMC filters are connected in an open-circuit configuration near to the receiver for DBPSK modulation.
The SNRs required in each channel to obtain a FER = 5% using DBPSK modulation, shown in Table 7 and Table 8, are similar to those simulated in [14] with a flat channel and AWGN. It can be clearly observed that these thresholds are very similar in the absence of a filter and when each of the four EMC filters are connected, either in an open-circuit configuration or when a load is included to the filters. The maximum difference is 0.6 dB, which corresponds to connecting the filter 5500.2055 in channel 3. These small differences are considered to be the result of the intrinsic limitations of the proposed methodology, which is based on laboratory trials with hardware equipment.
In [14], it is concluded that frequency-selective channels are very critical to modulations without FEC. However, in the scenario shown in Figure 9 where DBPSK modulation is used, the EMC filters do not introduce significant changes in the thresholds. This implies that in a better situation, that is, when using more robust modulations, the FER-SNR curves will not be affected.
As a consequence, it can be concluded that the channel frequency responses due to the filters are not sufficiently selective to degrade NB-PLC in terms of the SNR thresholds. This implies that the estimation and equalization processes defined for PRIME v1.4 perform properly under these circumstances, not being affected by the channel characteristics caused by the introduction of the EMC filters.

4. Discussion

The results presented in the previous section show that, even though the introduction of the EMC filters does not modify the thresholds that define the quality of the communications, the attenuation suffered by the PLC signal when connecting the EMC filters near the receiver is very high on some frequency channels.
The schematics presented in Figure 2 show that the four EMC filters have capacitors in parallel to the L-N ports. However, if the filter presented a high-impedance inductive interface, it would decouple its capacitive load from the network, which could reduce the transmission losses. For that reason, we repeated the tests connecting the filters 5500.2052 and 5500.2055 reversed, that is, connecting the L’-N’ ports to the setup, so that the first elements are inductive (L2 and L3). The impedances measured when connecting the two filters reversed are shown in Figure 10.
The results lead to conclude that, if the filters are connected reversed, the impedance measured corresponds to the impedance of the LISN without significant influence by the filter, as observed when comparing Figure 3 and Figure 10. Hence, in this situation, the PLC signal should not be attenuated by the introduction of the EMC filter. In order to analyze the attenuation in this case, each graph in Figure 11 shows the attenuation when the filters are connected to the setup through ports L-N (blue lines) and L’-N’ (red lines). The column indicates the filter under study: the first column corresponds to 5500.2052 and the second column to 5500.2055. The row indicates the location of the EMC filter: A, B and C.
Figure 11 clearly shows how, regardless of their location, the attenuation introduced by the filters when connected to the setup through the L’-N’ ports can be considered negligible. Thus, it is demonstrated that the attenuation introduced by the EMC filters is mainly due to the capacitive burden they present in the network interface.

5. Conclusions

This article discusses the effect of EMC filters for power converters on NB-PLC. For this purpose, on the one hand, the attenuation introduced by the EMC filters in the different locations of the proposed scenario is measured for open-circuit and loaded configurations. On the other hand, FER-SNR curves are represented for the different channels specified by PRIME using DBPSK modulation, in order to know if the channel response variations due to the filters are critical enough to degrade the communication thresholds.
The results presented in Section 3 lead to the conclusion that the EMC filters used in the study do not introduce abrupt variations in the channel frequency response, so that thresholds that set the quality of communications are not affected. However, they do present considerable signal attenuations when they are connected near the receiver equipment. These attenuations could cause communications to fail if the noise level is high or if the received signal power is close to the sensitivity limit of the receiving equipment. This implies that the EMC filters used for power converters have an unintended side effect of attenuating communication signals that had not been analyzed before this work. These high attenuations are due to the capacitive interface of the filters with the grid.

Author Contributions

Conceptualization and methodology, I.A. and J.G.-R.; software and hardware development, I.F.; validation, A.A.; formal analysis and writing—original draft preparation, I.A. and J.G.-R.; writing—review and editing, A.A.; supervision, I.A.; project administration, D.d.l.V.; funding acquisition, D.d.l.V. All authors have read and agreed to the published version of the manuscript.

Funding

This research was funded by the BASQUE GOVERNMENT, grant number IT1234-19 and SPANISH GOVERNMENT, grant number RTI2018-099162-B-I00 (MCIU/AEI/FEDER-UE).

Data Availability Statement

The data presented in this study are available on request from the corresponding author. The data are not publicly available due to ongoing further studies.

Conflicts of Interest

The authors declare no conflict of interest.

References

  1. Popović-Gerber, J.; Oliver, J.A.; Cordero, N.; Harder, T.; Cobos, J.A.; Hayes, M.; O’Mathuna, C.; Prem, E. Power Electronics Enabling Efficient Energy Usage: Energy Savings Potential and Technological Challenges. IEEE Trans. Power Electron. 2011, 27, 2338–2353. [Google Scholar] [CrossRef]
  2. Fernández, I.; Uribe-Pérez, N.; Eizmendi, I.; Angulo, I.; de la Vega, D.; Arrinda, A.; Arzuaga, T. Characterization of Non-intentional Emissions from Distributed Energy Resources up to 500 kHz: A Case Study in Spain. Int. J. Electr. Power Energy Syst. 2019, 105, 549–563. [Google Scholar] [CrossRef]
  3. Basics in EMC/EMI and Power Quality–Introduction, Annotations, Applications; Schaffner: Luterbach, Swizerland, 2013.
  4. López, G.; Moreno, J.I.; Sánchez, E.; Martínez, C.; Martín, F.; Moreno, J.I. Noise Sources, Effects and Countermeasures in Narrowband Power-Line Communications Networks: A Practical Approach. Energies 2017, 10, 1238. [Google Scholar] [CrossRef] [Green Version]
  5. Roggo, D. Spectral Grid Impedance and Electromagnetic Interferences in the 150 kHz Frequency Range. Int. J. Distrib. Energy Resour. Smart Grids 2018, 11, 143–151. [Google Scholar]
  6. Rasool, B.; Rasool, A.; Khan, I. Impedance Characterization of Power Line Communication Networks. Arab. J. Sci. Eng. 2014, 39, 6255–6267. [Google Scholar] [CrossRef]
  7. Cortés, J.A.; Sanz, A.; Estopiñán, P.; García, J.I. Analysis of narrowband power line communication channels for advanced metering infrastructure. EURASIP J. Adv. Signal Process. 2015, 2015, 18. [Google Scholar] [CrossRef] [Green Version]
  8. Wang, B.; Cao, Z. A Review of Impedance Matching Techniques in Power Line Communications. Electronics 2019, 8, 1022. [Google Scholar] [CrossRef] [Green Version]
  9. Lampe, L.; Han Vinck, A.J. On Cooperative Coding for Narrow Band PLC Networks. Int. J. Electron. Commun. 2011, 65, 681–687. [Google Scholar] [CrossRef]
  10. PRIME Alliance. Specification for PoweRline Intelligent Metering Evolution v1.4; PRIME Alliance: Brussels, Belgium, 2014. [Google Scholar]
  11. ETSI Technical Committee. Power Line Telecommunications (PLT) Narrow Band Transceivers in the Range 9 kHz to500 kHz Power Line Performance Test Method Guide ETSI Technical Committee Powerline Communications TechnicalSpecification; ETSI TS 103 909 V1.1.1 (2012-12); ETSI: Sophia Antipolis, France, 2012. [Google Scholar]
  12. Fernández, I.; Angulo, I.; Arrinda, A.; de la Vega, D.; Arechalde, I.; Uribe-Pérez, N.; Arzuaga, T. Characterization of the Frequency-dependent Transmission Losses of the Grid up to 500 kHz. In Proceedings of the 25th International Conference on Electricity Distribution (CIRED 2019), Madrid, Spain, 3–6 June 2019. [Google Scholar]
  13. Fernández, I.; Alberro, M.; Montalbán, J.; Arrinda, A.; Angulo, I.; de la Vega, D. A New Voltage Probe with Improved Performance at the 10 kHz-500 kHz Frequency Range for Field Measurements in LV Networks. Measurement 2019, 145, 519–524. [Google Scholar]
  14. Llano, A.; Angulo, I.; Angueira, P.; Arzuaga, T.; De La Vega, D. Analysis of the Channel Influence to Power Line Communications Based on ITU-T G.9904 (PRIME). Energies 2016, 9, 39. [Google Scholar] [CrossRef] [Green Version]
  15. Passive Filter Units for Electromagnetic Interference Suppression—Part 1: Generic Specification. Available online: https://standards.iteh.ai/catalog/standards/clc/9904f02f-5746-42d9-95f4-a68df5292edc/en-60939-1-2010 (accessed on 15 October 2010).
  16. Schurter Manufacturer. Available online: https://www.schurter.com/en/choose-country-region?coming-from=/en/Home (accessed on 16 December 2020).
  17. Capponi, L.; Fernández, I.; Roggo, D.; Arrinda, A.; Angulo, I.; de la Vega, D. Comparison of Measurement Methods of Grid Impedance for Narrow Band-PLC up to 500 kHz. In Proceedings of the IEEE 9th International Workshop on Applied Measurements for Power Systems (AMPS), Bologna, Italy, 26–28 September 2018. [Google Scholar]
  18. Fernandez, I.; De La Vega, D.; Roggo, D.; Stiegler, R.; Capponi, L.; Angulo, I.; Meyer, J.; Arrinda, A. Comparison of Measurement Methods of LV Grid Access Impedance in the Frequency Range Assigned to Nb-Plc Technologies. Electronics 2019, 8, 1155. [Google Scholar] [CrossRef] [Green Version]
  19. Berger, L.T.; Schwager, A.; Pagani, P.; Schneider, D. MIMO Power Line Communications: Narrow and Broadband Standards, EMC, and Advanced Processing, 1st ed.; CRC Press: Boca Raton, FL, USA, 2017. [Google Scholar]
  20. Farias, L.D.R.; Monteiro, L.F.; Leme, M.O.; Stevan, J.S.L. Empirical Analysis of the Communication in Industrial Environment Based on G3-Power Line Communication and Influences from Electrical Grid. Electronics 2018, 7, 194. [Google Scholar] [CrossRef] [Green Version]
  21. Passerini, F.; Tonello, A.M. Secure PHY Layer Key Generation in the Asymmetric Power Line Communication Channel. Electronics 2020, 9, 605. [Google Scholar] [CrossRef] [Green Version]
Figure 1. Measurement system for the assessment of the transmission losses.
Electronics 10 00152 g001
Figure 2. Schematics of the four EMC filters—5500.2044 (upper left), 5500.2052 (upper right), 5500.2055 (bottom left), 5500.2060 (bottom right) [16].
Electronics 10 00152 g002
Figure 3. Measured impedance modulus of the Line Impedance Stabilization Network (LISN) model for the frequency band of interest.
Electronics 10 00152 g003
Figure 4. Measurement setup. EMC filters are connected at either points A, B or C. For the measurement of channel frequency response, the signal is injected at point A and measured at point C.
Electronics 10 00152 g004
Figure 5. Impedance modulus of the four EMC filters connected to the setup, without connecting a load in L’-N’.
Electronics 10 00152 g005
Figure 6. Impedance modulus of the four EMC filters connected to the setup, when a load is connected in L’-N’.
Electronics 10 00152 g006
Figure 7. Attenuation due to the EMC filters under study in an open-circuit configuration. Blue lines indicate that the filter is connected at point A, red lines indicate connection point B, and green lines indicate connection point C.
Electronics 10 00152 g007
Figure 8. Attenuation due to the EMC filters under study, when a load is connected at ports L’-N’. Blue lines indicate that the filter is connected at point A, red lines indicate connection point B, and green lines indicate connection point C.
Electronics 10 00152 g008
Figure 9. FER-SNR curve on channel 4 for DBPSK without filter and when filters are connected at point C in an open-circuit configuration.
Electronics 10 00152 g009
Figure 10. Impedance modulus of the filters 5500.2052 and 5500.2055 reversed.
Electronics 10 00152 g010
Figure 11. Attenuation of the EMC filters 5500.2052 and 5500.2055 reversed.
Electronics 10 00152 g011
Table 1. Characteristics of the four Electromagnetic Compatibility (EMC) filters [16].
DescriptionRated CurrentLeakage CurrentApplications
5500.20442-stage line filter, high attenuation6 A<0.5 mA (standard version)Suitable for use in equipment according to IEC/UL 62368-1
5500.20522-stage line filter, very high attenuation, broadband2 A0.25 mA (standard version)Suitable for use in equipment according to IEC/UL 62368-1
Especially suitable for use in switching power supplies e.g., in electronic designs with high repetitive switching frequency
5500.20552-stage line filter, very high attenuation, broadband6 A1.4 mA (industrial version)Suitable for use in equipment according to IEC/UL 62368-1
Especially suitable for use in switching power supplies e.g., in electronic designs with high repetitive switching frequency
5500.20602-stage line filter, very high symmetrical and asymmetrical attenuation6 A0.25 mA (standard version)Suitable for use in equipment according to IEC/UL 62368-1
Especially designed for industrial applications such as: Frequency Converters, Stepper Motor Drives, UPS-Systems, Inverters
Especially suitable for use in switching power supplies
Table 2. Components of the four EMC filters [16].
EMC FilterL (mH)R (MΩ)Cx (µF)Cy (µF)Cx1 (µF)Cx2 (µF)Cy1 (µF)Cy2 (µF)L1 (mH)L2 (mH)L3 (mH)
20442 × 0.80.51004.7-------
2052-1--0.10.471.512 × 100.40.4
2055-1--0.10.68104.72 × 60.5-
20602 × 0.810.11.5--1.51---
Table 3. Mean and standard deviation of the impedance measured when EMC filters are connected to the setup, without connecting a load in L’-N’.
Impedance of 5500.2044 (Ω)Impedance of 5500.2052 (Ω)Impedance of 5500.2055 (Ω)Impedance of 5500.2060 (Ω)
ChannelMeanStandard DeviationMeanStandard DeviationMeanStandard DeviationMeanStandard Deviation
CH 12.350.501.910.111.580.232.080.16
CH 32.330.405.430.494.820.441.060.61
CH 44.660.909.390.759.151.192.110.49
CH 58.272.214.861.355.331.614.690.92
CH 63.111.691.570.491.550.5311.262.27
CH 76.892.850.440.080.490.095.062.09
CH 80.940.431.040.201.170.200.990.40
Table 4. Mean and standard deviation of the impedance measured when EMC filters are connected to the setup, connecting a load in L’-N’.
Impedance of 5500.2044 + load (Ω)Impedance of 5500.2052 + load (Ω)Impedance of 5500.2055 + load (Ω)Impedance of 5500.2060 + load (Ω)
ChannelMeanStandard DeviationMeanStandard DeviationMeanStandard DeviationMeanStandard Deviation
CH 12.210.182.150.201.750.352.240.22
CH 32.280.365.650.395.070.361.620.47
CH 44.340.749.320.819.021.282.170.45
CH 57.090.985.861.437.081.694.650.87
CH 63.741.312.210.562.680.6610.281.99
CH 78.662.290.670.200.860.286.352.25
CH 82.100.760.780.170.630.141.570.56
Table 5. Mean and standard deviation of signal attenuation due to the EMC filters in open circuit configuration.
Attenuation of 5500.2044 (dB)Attenuation of 5500.2052 (dB)Attenuation of 5500.2055 (dB)Attenuation of 5500.2060 (dB)
ChannelMeanStandard DeviationMeanStandard DeviationMeanStandard DeviationMeanStandard Deviation
CH 1−1.110.850.140.652.341.45–0.781.03
CH 34.811.49−3.300.85−1.990.8615.234.16
CH 40.771.23−4.381.46–4.490.846.661.55
CH 5−0.243.656.053.135.623.482.231.47
CH 69.764.6520.914.9921.424.78−2.921.10
CH 76.225.2524.203.0420.762.2111.845.22
CH 823.042.3317.350.9215.760.7223.572.06
Table 6. Mean and standard deviation of signal attenuation due to the EMC filters when connecting a load to L’-N’.
Attenuation of 5500.2044 + Load (dB)Attenuation of 5500.2052 + Load (dB)Attenuation of 5500.2055 + Load (dB)Attenuation of 5500.2060 + Load (dB)
ChannelMeanStandard DeviationMeanStandard DeviationMeanStandard DeviationMeanStandard Deviation
CH 1−0.080.510.230.552.301.56−0.260.56
CH 3−4.931.30−3.100.70−2.130.7311.101.88
CH 41.220.99−4.880.87−4.740.686.681.15
CH 50.412.994.112.904.393.252.381.20
CH 67.573.3316.173.6918.734.56−2.191.03
CH 75.384.8525.322.0722.832.6511.094.95
CH 823.252.3118.731.0017.000.7922.511.91
Table 7. SNR required for FER = 5% in each signal configuration when filters are not loaded.
SNR (dB) for FER = 5%
ChannelWithout Filter5500.20445500.20525500.20555500.2060
CH 111.010.910.910.610.9
CH 310.510.510.511.110.6
CH 49.99.910.010.310.3
CH 510.29.89.89.910.2
CH 610.510.510.710.310.8
CH 710.09.710.19.89.5
CH 811.011.411.110.510.4
Table 8. SNR required for FER = 5 % in each signal configuration when filters are loaded.
SNR (dB) for FER = 5 %
ChannelWithout Filter5500.2044 + Load5500.2052 + Load5500.2055 + Load5500.2060 + Load
CH 111.011.211.010.711.1
CH 310.510.810.710.710.7
CH 49.99.910.110.110.1
CH 510.29.99.99.810.1
CH 610.510.710.610.610.5
CH 710.09.910.110.010.1
CH 811.010.911.111.211.2
Publisher’s Note: MDPI stays neutral with regard to jurisdictional claims in published maps and institutional affiliations.

