Article

Impact of Revised Time of Use Tariff on Variable Renewable Energy Curtailment on Jeju Island

1
School of Electrical Engineering, Korea University, Seoul 02841, Korea
2
Department of Information and Electronic Engineering, Mokpo National University, Muan 58554, Korea
3
School of Electrical and Electronic Engineering, Gwangju University, Gwangju 61743, Korea
*
Author to whom correspondence should be addressed.
Electronics 2021, 10(2), 135; https://doi.org/10.3390/electronics10020135
Submission received: 2 December 2020 / Revised: 29 December 2020 / Accepted: 4 January 2021 / Published: 10 January 2021

Abstract

:
Jeju Island announced the “Carbon Free Island (CFI) Plan by 2030” in 2012. This plan aims to replace conventional generators with distributed energy resources (DERs) up to a level of 70% by 2030. Akin to Jeju Island, as DERs have been expanded in islanded power systems, variable renewable energy (VRE) has become a significant component of DERs. However, VRE curtailment can occur to meet power balance, and VRE curtailment generally causes energy waste and low efficiency, so it should be minimized. This paper first presents a systematic procedure for estimating the annual VRE curtailment for the stable operation of the islanded power systems. In this procedure, the VRE curtailment is estimated based on the power demand, the grid interconnection, the capacity factor of VRE, and conventional generators in the base year. Next, through the analysis of the hourly net load profile for the year in which the VRE curtailment is expected to occur, a procedure was proposed to find the season and hour when VRE curtailment occurs the most. It could be applied to revised Time-of-Use (ToU) tariff rates as the most cost-effective mitigation method of VRE curtailment on the retail market-side. Finally, price elasticity of electricity demand was presented for applying the revised ToU tariff rate scenarios in a specific season and hour, which found that VRE curtailment occurred the most. Considering self- and cross-price elasticity of electricity, revised ToU tariff rate scenarios were used in a case study on Jeju Island. Eventually, it was confirmed that VRE curtailment could be mitigated when the revised ToU tariff rates were applied, considering the price elasticity of demand.

1. Introduction

Many countries around the world are striving to reduce greenhouse gas (GHG) emissions and the use of fossil fuels due to the adoption of the Kyoto Protocol and the Paris Agreement, by increasing their use of variable renewable energy (VRE) sources such as wind power and photovoltaics (PVs) [1,2]. On Jeju Island, the largest island in South Korea, wind power and PV generators are rapidly being installed with the aim of energy self-sufficiency and GHG emission reduction. Jeju Special Self-Governing Province, a local government encompassing Jeju Island in the south of the Republic of Korea, announced the “Carbon Free Island (CFI) Plan by 2030” in 2012 [3]. According to the plan, Jeju aims to become a more environmentally friendly island by reducing the use of fossil fuels by 2030, and this plan intends to reduce GHG emissions while maintaining a stable energy supply and demand structure. One of the strategies of the plan is to quickly replace conventional power generation with VRE sources such as wind and solar energy [4,5].
The replacement of conventional generators with VRE sources can help to create a less fossil-fuel-dependent power supply environment. However, VRE sources cannot always produce the energy required in periods of high electricity demand, unlike conventional generators [6]. The output of VRE cannot always be controlled by power system operators, and its output can vary significantly from time to time. VRE sources typically have uncertainty issues because it is difficult to accurately forecast their outputs, so these sources need to include more reserve resources to meet the power balance [7]. Moreover, PV energy generally has a variable output because of its intensive generation during the daytime; therefore, PV energy requires other generators that can ramp up quickly to meet the power balance [8]. Power system operators must ensure a power balance between electricity supply and demand at all times, and power systems are usually designed to handle the variable nature of loads. The variability and uncertainty of VRE can induce new challenges for power system operators [9]. In particular, high levels of VRE can be difficult to integrate into islanded power systems because of limitations in variability and predictability. Additionally, increasing penetration levels of VRE can lead power systems to encounter operational constraints, resulting in system operators accepting less VRE than is available [10]. Thus, high penetrations of VRE sources on power systems result in increasing VRE curtailment, and infrastructure and operational changes to power systems may be required [11]. VRE curtailment is therefore defined as the act of reducing the supply from VRE sources to the power grid. Not all the energy produced is used, so it can be classified as some kind of inefficiency. It is usually thought that VRE curtailment leads to respectable energy wastage, and although VRE curtailment can be helpful to ensure power balance, mitigation measures to reduce VRE curtailment in the future should be addressed [12]. In addition, it is necessary to predict the time period in which the VRE curtailment occurs to apply measures to mitigate VRE curtailment, and case studies for different mitigation scenarios should be carried out at that time period. However, there have been limited studies on the hour-by-hour estimation of VRE curtailment in islanded power systems. Therefore, a method has been proposed in this study to calculate the long-term estimation of the amount of VRE curtailment.
There have been technical methods proposed to mitigate VRE curtailment by ensuring the flexibility of the power systems. The main method used is adjusting the maximum and minimum operating levels of conventional generators [12,13]. However, there are not many existing generators in islanded power systems, so the plan may not be sufficiently effective.
Another method of mitigation is to have plenty of flexible resources to maintain the stability of power systems. Energy storage systems (ESSs) are an effective means of mitigating VRE curtailment among several flexible resources because ESS can store the VRE output during high levels of VRE generation and discharge it when required [14]. If the PV penetration rate increases, the net load, which is the value excluding the VRE value from the power demand, decreases significantly in the afternoon, and attenuation of the conventional power generator increases, leading to economic loss [15]. However, ESSs are not yet economically suitable as resources to mitigate VRE curtailment, and geographic conditions and environmental issues make it difficult to build additional pump storage in the islanded power systems.
A further method is to improve the interconnection of the power grid for electricity transmission [16]. This is one of the main methods used in countries in Europe, as there is intensive grid interconnection between districts. Conversely, islanded power systems have the problem of distance from other regions, and the infrastructure for transmitting electricity between different regions is limited. Other possible methods include introducing negative bidding for VRE and improving the next-day forecasting of VRE generation [17]. The introduction of negative bids can encourage VRE producers to store electricity without selling electricity or sending it to other regions at certain times. However, power systems are required to have a suitable price bidding generation pools for negative biddings of VRE sources. Islanded power systems do not usually have a price bidding generation pool for VRE sources. Improving the next-day forecasting of VRE allows for better scheduling of daily generation plans with other conventional generation resources. However, power systems in the island region do not have many conventional generation resources.
The methods described above are a way to increase the flexibility of the power system so that it meets the demand and supply of power and allows a high level of VRE to be used in the power system. However, owing to the geographical and environmental characteristics of islanded power systems, it may be expensive to apply these methods. In [17], methods to increase power system flexibility due to the expansion of renewable energy are classified according to cost. The cheapest method to increase power system flexibility in terms of the electricity market is to adjust the electricity demand by improving the energy market design. Therefore, this paper proposes a systematic procedure for mitigating VRE curtailment by changing the electricity demand through price changes of the time-of-use (ToU) tariffs in the electricity market. This revised ToU tariff rate is suggested by [18] and applied with the price elasticity of electricity demand. Similar to a study on coordination of the charging of electric vehicles by applying the ToU tariffs to reduce wind-energy curtailment, the ToU tariffs can be applied to mitigate VRE curtailment [19,20]. However, there has been no research on easing future VRE curtailment by analyzing the change in power demand considering price elasticity from a long-term perspective. Accordingly, the objective of this study is to estimate the amount of future VRE curtailment and thereby mitigate the estimated VRE curtailment by applying a systematic procedure for analyzing the impacts of the revised ToU tariff.
A case study has been carried out on the power system of Jeju Island to illustrate the impact of the revised time-of-use tariff on VRE curtailment. All actual datasets of the hourly supplies and demands of the Jeju power system were obtained from the Korea Power Exchange (KPX) and Korea Electric Power Corporation (KEPCO). According to Jeju’s VRE expansion plan [21,22], the first VRE curtailment in South Korea occurred in Jeju in August 2015, and VRE curtailment in Jeju has been increasing every year [23]. The high penetration of planned VRE in recent years necessitates changes to energy policies as well as revisions to the infrastructure to integrate a large amount of VRE and mitigate VRE curtailment, as stated in the Carbon Free Island (CFI) plan 2030 for Jeju [5]. The mitigation of curtailment, thereby enhancing the power system efficiency, is the aim of the power system operator.
In this paper, there are two main contributions. First, by applying a systematic procedure to estimate the annual VRE curtailment for the stable operation of the islanded power systems, islanded power systems operators can grasp the amount of energy waste due to VRE curtailment in advance and seek proactive countermeasures. Secondly, this paper presents the impact of revised ToU tariffs on VRE curtailment for islanded power systems. From the retail market aspect, the most cost-efficient method to increase power system flexibility is to adjust the electricity demand by the revised ToU tariff rates. Therefore, a method for mitigating VRE curtailment by increasing the electricity demand through price decrease scenarios of the ToU tariff rates is suggested. Scenarios are applied by the self and cross-price elasticity of electricity demand in a case study on Jeju Island. As a result, this procedure makes grid operators stabilize their islanded power system by improving the efficiency of the demand response program which mitigates VRE curtailment, based on the revised ToU tariff rates.
This paper is organized as follows: Section 2 describes the power system, VRE curtailment cases, and the ToU tariff for Jeju. A systematic procedure for analyzing the impacts of the revised ToU tariff on VRE curtailment is given in Section 3. This procedure consists of three parts: estimation of the VRE curtailment, analysis of the net load profile for applying the revised ToU tariff and the price elasticity of electricity demand for the revised ToU tariff. The case study on the impacts of the revised ToU tariff on VRE curtailment is given in Section 4, followed by the conclusions in Section 5.

2. Variable Renewable Energy Curtailment and Time-of-Use Tariff in Jeju

2.1. Power System and VRE Curtailment Cases of Jeju Island

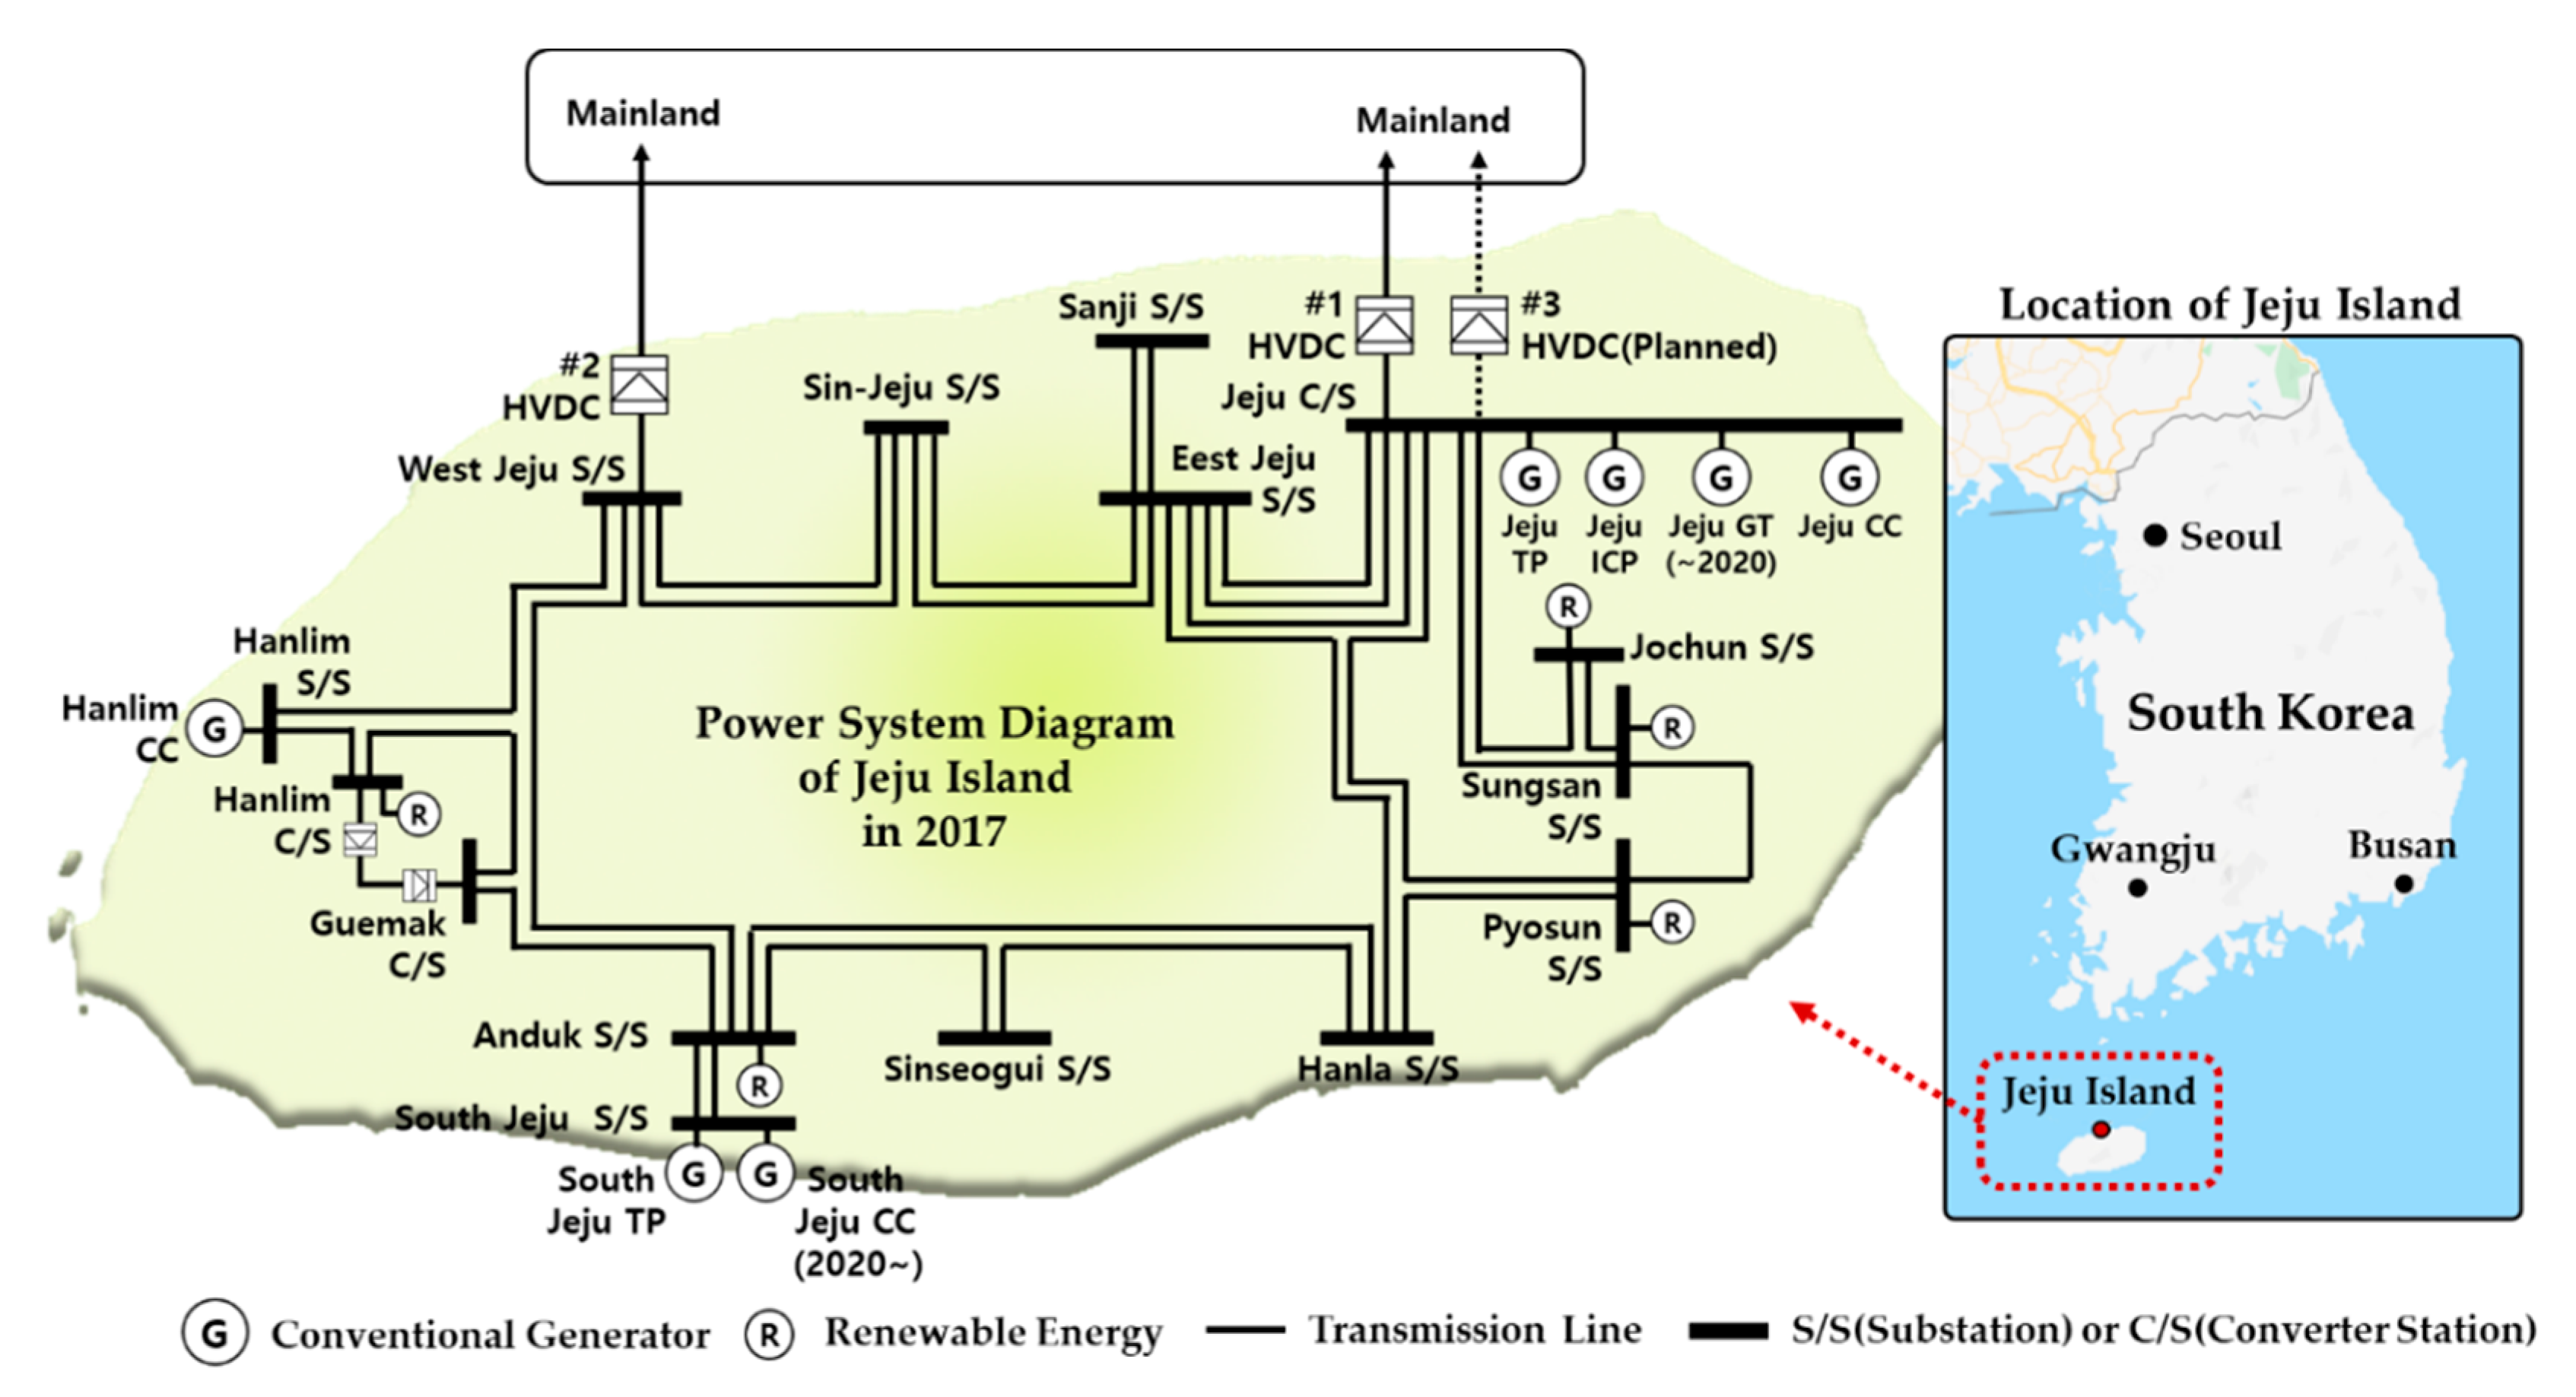
The integration of distributed energy resources (DERs) into the Jeju power grid is an essential part of one of the detailed CFI plans and Jeju Special Self-Governing Province aims to replace conventional generators with VRE such as wind and solar power for up to 70% of power generation by 2030 [5]. Figure 1 shows the power system diagram of Jeju Island in 2017 and the location of Jeju Island in South Korea [24].
Jeju Island, the largest island in South Korea, had a population of about 678,000 in 2017 and is well known for its natural tourist attractions. The administration of Jeju Island has active policies and plans to replace existing fossil fuels with DERs, specifically PV and wind energy, to maintain a clean natural environment. Jeju Island is popular with tourists, and with the development of various industries, the population grew from 641,355 in 2015 to 678,772 in 2017. Therefore, Jeju Island is a suitable example of an island power system for analyzing the impact of ToU tariff rates on power systems with high levels of renewable resources.
The Jeju Island power system is composed of conventional generators, high-voltage direct current (HVDC) grid interconnection, transmission lines, and renewable energy sources. Conventional generators using Liquefied Natural Gas (LNG) and oil as fuel are classified as controllable generators that are available for output control by power dispatch instructions. PV and wind power generators were classified as VRE. Renewable energy generators of other types, such as hydro, bioenergy, and waste energy, are classified as noncontrollable generators. HVDC #1–#3 transmission lines are classified as grid interconnections.
Table 1 shows the generation capacity and power generation on Jeju Island from 2015 to 2017. The total power generation increased from 4791.5 GWh in 2015 to 5422.0 GWh in 2017, and the total generation capacity increased from 1287 MW in 2015 to 1511 MW in 2017. The generation capacity of the grid interconnection is 400 MW based on supply capacity, which was the same in both 2015 and 2017. However, the power generation ratio of grid interconnections increased from 36.4% in 2015 to 42.4% in 2017. The power generation ratio of PV increased from 1.8% in 2015 to 2.6% in 2017, and the power generation ratio of wind energy increased from 7.0% in 2015 to 9.9% in 2017. Renewable energy sources other than PV and wind energy are noncontrollable generators, and their power generation ratio increased from 0.5% in 2015 to 0.7% in 2017. On the other hand, the ratio of the generation ratio of controllable generators that use LNG and oil as fuels decreased from 54.3% in 2015 to 44.5% in 2017. This indicates that the generation ratio of renewable energy and grid interconnection in Jeju Island is increasing and the generation ratio of controllable generators is decreasing.
The VRE output is not easily controlled by the power system operator because its output can vary greatly from minute to minute. The variable power supply of VRE can cause problems, such as the risk of VRE curtailment, because the power system operator is required to ensure the balance between supply and demand of the electricity at all times.
Table 2 below shows the statistical data for wind-energy curtailment in Jeju from 2015 to 2017 [23]. The data were divided by season and day/night. Since there were not enough solar energy facilities connected to the power conversion systems, only wind generators were able to limit the power output to balance power supply and demand.
In 2015, wind-energy curtailment occurred three times, all at night. However, wind-energy curtailment occurred eight times during the day and eight times at night, respectively, in 2017. The amount of annual wind-energy curtailment increased from 152 MWh in 2015 to 1301 MWh in 2017. In addition, the wind-energy curtailment ratio was 0.04% in 2015 but increased to 0.23% in 2017.
In particular, it can be seen that the amount of wind-energy curtailment sharply increased in the daytime during spring and autumn, from 0 MWh in 2015 to 710 MWh in 2017. The reason for this is that although the power demand in spring and autumn is lower than in other seasons, the power supply from PV and wind energy is high, resulting in VRE curtailment during these times. When controllable generators have reached a minimum level, VRE curtailment occurs to ensure the supply–demand balance of the electricity. This means that there is less flexibility of the power system and potentially higher curtailment can occur on days when the VRE exceeds requirements.
Power system operators need to estimate future VRE curtailment, and systematically establish an energy mix plan for renewable energy resources, existing suppliers, and demand resources. However, there are not many studies dealing with VRE curtailment in islanded power systems, such as Jeju Island, despite the need for appropriate power suppliers and the requirement of operational plans for islanded power systems. In addition, there have been limited studies analyzing how much VRE curtailment will occur in islanded power systems.
In this study, to calculate the amount of annual VRE curtailment, all the hourly demand and supply data in the Jeju power system are known so that VRE curtailment could be estimated using a systematic process.

2.2. Revised ToU Tariff Rates to Reduce VRE Curtailment on the Demand Side

The various demand resources are classified according to the type of electricity tariffs on the demand side. The electricity tariffs in South Korea, including Jeju, differ by contract type, season, and hour. Users are allowed to choose from different rates offered for different types of loads. The policy of differentiated tariff rates involves applying different rates to various contract types based on the cost of supplying electricity for each type.
In its basic supply agreement, KEPCO lists the types of contracts: residential, general, educational, industrial, agricultural, public lighting, and midnight. Table 3 summarizes the tariff rates for each type of contract, electricity used, and average revenues in Jeju for 2017 according to the statistics provided by KEPCO [25].
In particular, ToU tariff rates by season and hour involve charging higher rates for peak seasons/hours and lower rates for off-peak seasons/hours. Higher rates are applied in the summer and winter and at peak hours. In spring and autumn, the subpeak and off-peak hours are subjected to lower tariff rates. The price differential in ToU tariffs gives customers an incentive to shift their electricity consumption to lower-priced hours, providing bill saving opportunities, and an associated potential reduction in overall power system costs. Table 4 summarizes the time range for the current seasonal ToU tariff in South Korea [26].
If a large amount of VRE is introduced without implementing any type of mitigation solutions such as management of other power supply and demand resources, energy storage systems, or expansion of grid interconnection, then there is a possibility of VRE curtailment. Several solutions [12,13,14,15,16,17] have been suggested to reduce the VRE curtailment for power systems. As mentioned in [17], the cheapest solution is to adjust the power demand by revising the design of the energy market. Moreover, from Table 2 above, it can be seen that curtailment during the daytime sharply increased in Jeju in 2017. This is due to the rapid increase in PV power generation facilities. If the ToU tariff rates for the daytime period when the curtailment occurs can be adjusted, the power demand for the daytime period can be relatively increased by the self-elasticity. The power demand for the other time periods can then be relatively decreased by the cross-elasticity.
In this paper, a systematic procedure is proposed to mitigate VRE curtailment by changing the power demand through changing the price of the ToU tariffs in the energy market. Accordingly, the objective of this study is to predict the amount of future VRE curtailment in islanded power systems and to mitigate the predicted VRE curtailment by applying a systematic procedure to analyze the impact of the revised ToU tariff.

3. Systematic Procedure for Analyzing the Impacts of the Revised ToU Tariff on VRE Curtailment

3.1. Estimation of VRE Curtailment of Islanded Power Systems

Islanded power systems operators can seek proactive countermeasures and grasp the amount of energy waste due to VRE curtailment in advance by applying a systematic procedure to estimate the annual VRE curtailment for the stable operation of the islanded power systems. To estimate the amount of future annual VRE curtailment for a specific year, it is necessary to know the electric power demand, the amount of renewable energy generation, the minimum generation level of the thermal power generator, and the maximum amount of grid interconnection for a specific year. The estimation procedure for calculating the amount of curtailment is as follows:
C V R E , t y e a r = [ ( P V R E , t y e a r + P m i n , t y e a r H V D C m a x , t y e a r ) D t y e a r ] ,   t = 1 ,   2 ,   ,   T
where the unit of t is hour and t has a value from 1 to T ; T is the end-time of the year; C V R E , t y e a r is the amount of VRE curtailment at time t of the year; P V R E , t y e a r is the amount of VRE at time t of the year; P m i n , t y e a r is the minimum generation level of the thermal power generators at time t of the year; H V D C m a x , t y e a r is the maximum power transmission of the HVDC connections at time t of the year; D t y e a r is the power demand at time t of the year.
P V R E , t y e a r = C F V R E , t b a s e × C A P V R E , t y e a r (   C F V R E , t b a s e = P V R E , t b a s e C A P V R E , t b a s e ) ,   t = 1 ,   2 ,   ,   T
where C F V R E , t b a s e is the capacity factor of VRE at time t of the base year, C A P V R E y e a r is the VRE capacity for the year, P V R E , t b a s e is the VRE generation amount at time t of the base year, and C A P V R E b a s e is the VRE capacity of the base year.
D t y e a r = D t b a s e × 1 2 ( D m a x y e a r D m a x b a s e + G t o t a l y e a r G t o t a l b a s e ) ,   t = 1 ,   2 ,   ,   T
where D t b a s e is the electric power demand at time t of the base year, D m a x y e a r is the maximum amount of electric power demand for the year, D m a x b a s e is the maximum electric power demand for the base year, G t o t a l y e a r is the sum of the total generation of the year, and G t o t a l b a s e is the sum of the total generation amounts for the base year.
C V R E y e a r = t = 1 T C V R E , t y e a r > 0 , t = 1 ,   2 ,   ,   T
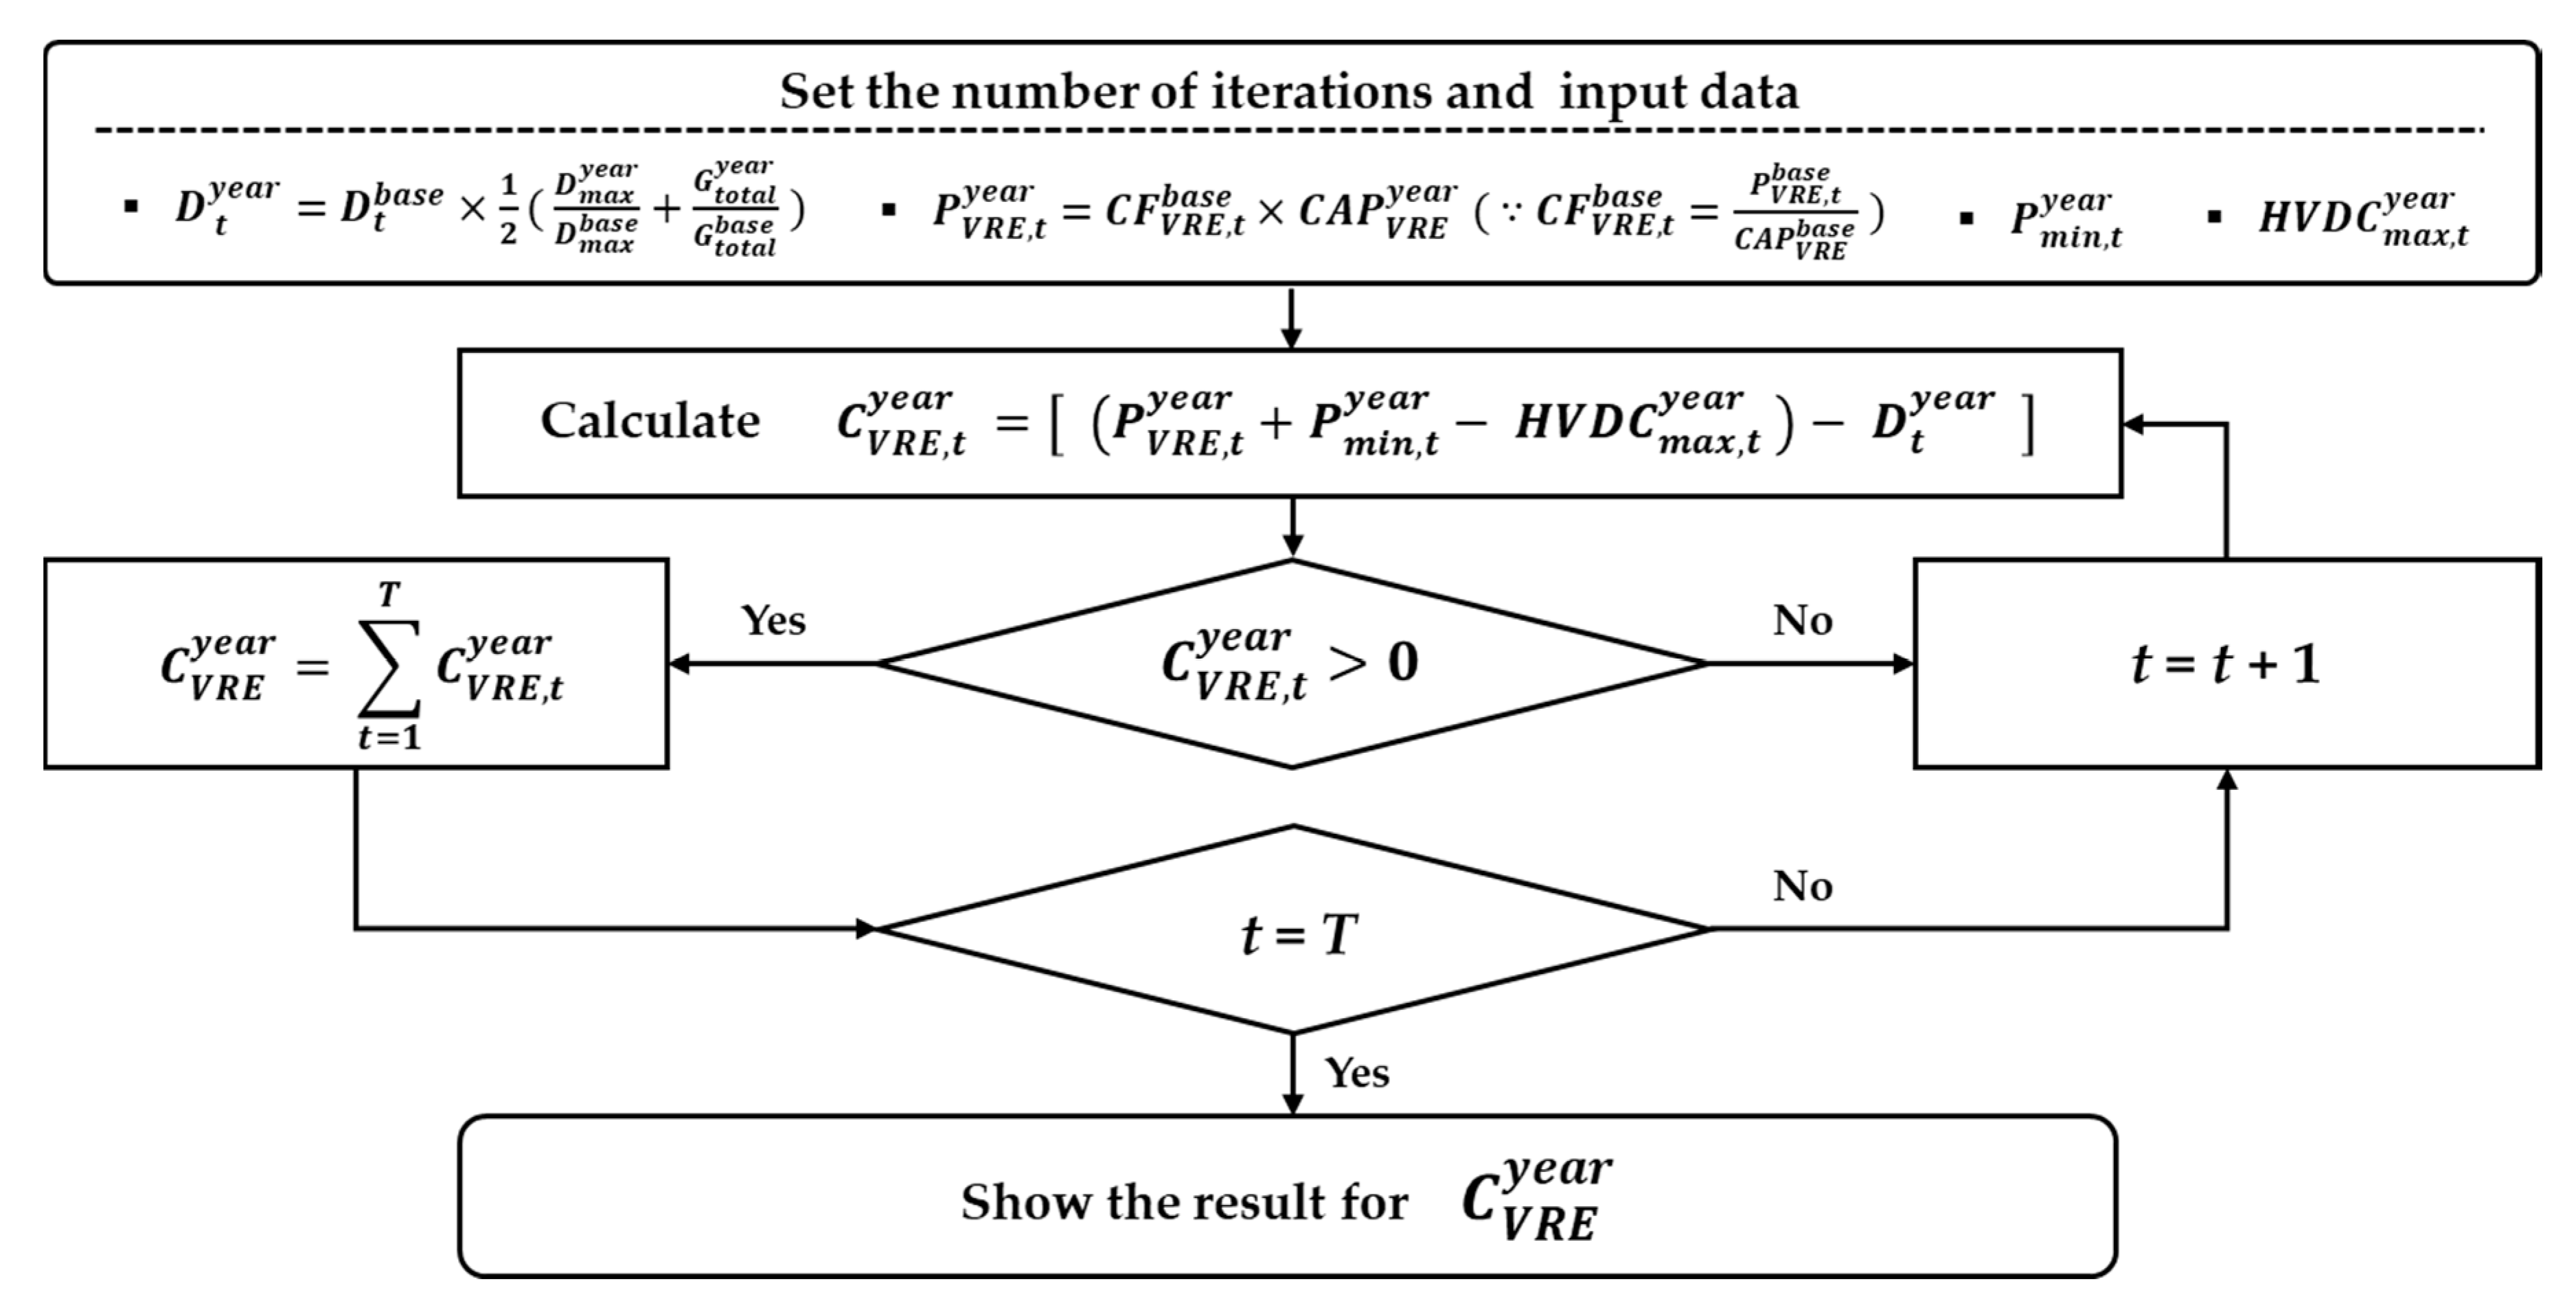
where C V R E y e a r is the total VRE curtailment for the year and is calculated only when the value of C V R E , t y e a r is a positive number. The total VRE curtailment for each year can be calculated as the sum of the values of C V R E , t y e a r for the year. Figure 2 shows a flowchart that estimates the amount of VRE curtailment based on the systematic procedure of calculating the VRE curtailment of the islanded power systems for the entire year.
In order to determine the appropriateness of the method of forecasting the VRE curtailment, Table 5 compares the actual VRE curtailment in 2017, 2018, and 2019 with the estimated VRE curtailment according to the flowchart in Figure 2. The error between the actual values and the estimated values of VRE curtailment was 0.295% in 2017, 0.518% in 2018, and 0.713% in 2019, which are all within 1% which can be seen as a high prediction accuracy. Therefore, future VRE curtailment has been estimated up to 2030 through the process described in Section 3.

3.2. Analyzing Net Load Profile for Applying Revised ToU Tariff

The net load is the difference between the predicted load and the expected electricity production from the VRE [27,28,29]. The increase or decrease in the net load curve is dependent on the power generation output of the VRE and the electricity demand. When VRE curtailment occurs in islanded power systems, the amount of VRE curtailment can be mitigated if the power demand can be increased by providing a lower electricity price signal than the price of the unrevised ToU tariff rates. Therefore, a revised ToU tariff is proposed to mitigate the VRE curtailment by changing the electricity demand. This revised ToU tariff rate is proposed by applying the concept of price elasticity of electricity demand, which has been widely used to assess consumer behavior in the electricity market. The price elasticity of demand can be used to design appropriate ToU tariffs to manage the load in an islanded power system. A process to create the revised ToU tariff rates is summarized as follows:
N e t l o a d t y e a r = D t y e a r P V R E , t y e a r ,   t = 1 ,   2 ,   ,   T
where N e t l o a d t y e a r is the net load at time t of the year; D m a x y e a r is the maximum electric power demand during the year; D t y e a r and P V R E , t y e a r are taken from Equations (2) and (3). In addition, to analyze the value of N e t l o a d t y e a r , the value of N e t l o a d t y e a r is separated according to the current ToU tariff time period to which time t belongs.
N e t l o a d t y e a r = N e t l o a d s , p , t y e a r   ( t = 1 ,   2 ,   ,   T ;   s = 1 ,   2 ,   3 ;   p = 1 ,   2 ,   3 )
where s = 1 refers to spring and autumn, s = 2 is summer, s = 3 is winter; p = 1 is the peak period, p = 2 is the medium period, and p = 3 is the off-peak period. Through the separation of the net load, N e t l o a d t y e a r is divided into nine time periods, consisting of three time periods per season (spring and autumn, summer, and winter).
If the ToU tariff rates for the time period where the most VRE curtailment occurred for each season is lowered, a lower price signal is sent to consumers. Consumers will then increase their electricity consumption during that time period, and the amount of VRE curtailment can be mitigated. Therefore, it is necessary to determine the time period for which the ToU tariff rates should be changed.
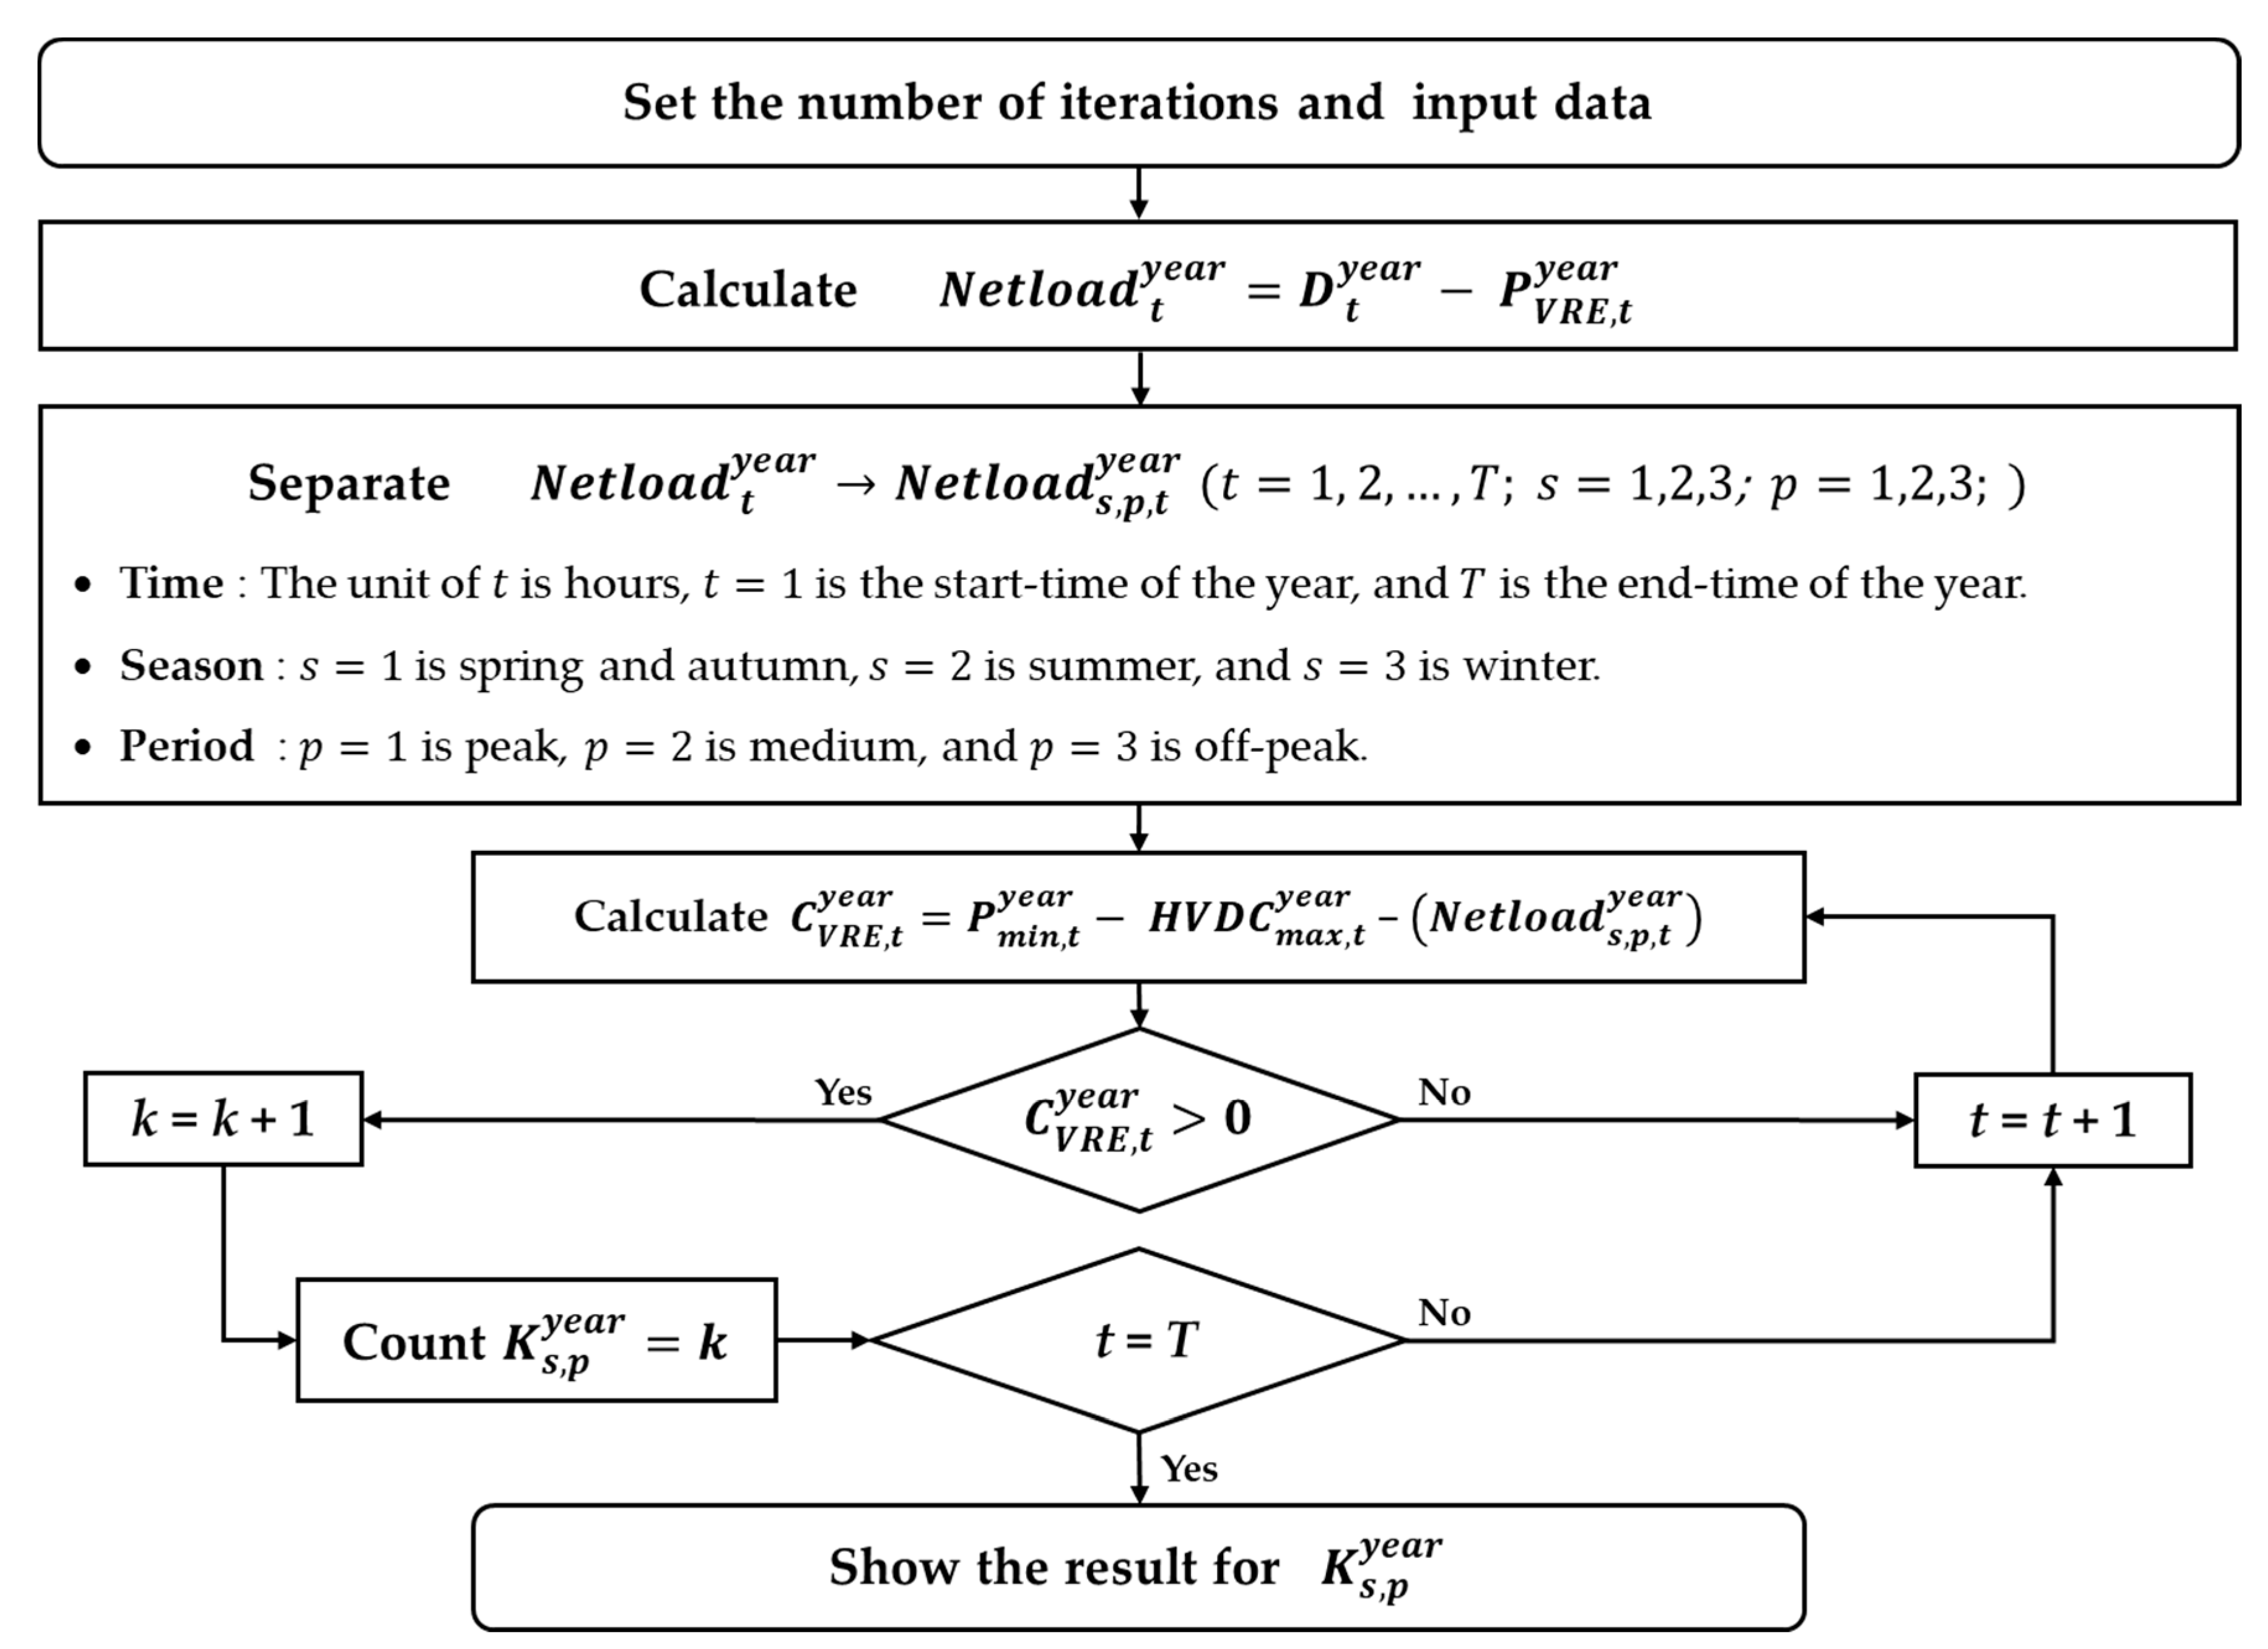
To determine the period for which the ToU tariffs rate is revised, the number of VRE curtailments that have occurred for each of the three periods within the same season are compared. The period with the highest VRE curtailment is that for which the ToU tariff rates should be reduced. K s , p y e a r is the number of VRE curtailments for each season and period. There are three periods (peak, medium, and off-peak) in each season, and the numbers of VRE curtailments ( K s , p y e a r ) are compared for each period. During the period in which the number of VRE curtailments ( K s , p y e a r ) is the greatest, the ToU tariff rates plan will be revised to be lower than the original plan. The flowchart for counting the number of VRE curtailments is shown in Figure 3.

3.3. Price Elasticity of Electricity Demand for Revised ToU Tariff

The concept of price elasticity of power demand is crucial for the proper design or revision of ToU tariff rates. Decreasing the price of a product, even by a small amount, will clearly increase demand. To determine the amount of change, we can use the derivative d ( D e m a n d ) d ( P r i c e ) of the demand curve. The price elasticity of electricity demand has defined the ratio of the relative change in demand to the relative price change [30].
ε = Δ D e m a n d D e m a n d / Δ P r i c e P r i c e = P r i c e D e m a n d × Δ D e m a n d Δ P r i c e
In the short run, the price elasticity of the demand for electricity is low because consumers do not have enough choice. However, in the long run, the price elasticity of the demand for electricity will be much higher because consumers have enough time to choose other selections. In addition, the elasticity of the power demand depends in part on the availability of substitutes. When dealing with substitutes and elasticity, the timescale for substitutions should be clearly defined. If two different electricity demands in two different periods are complementary, a change in the demand for one will be accompanied by a similar change in the demand for the other.
In the case of transition of electricity demand from period A to period B, the electricity consumption changes in certain hours of periods A and B depend on the changes in the price Δ P r i c e A for period A. That is, if the price for period A is lowered, the electricity demand during period A may increase, but that of period B may decrease correspondingly.
The ratio of the relative demand change in period A according to the price change in period A is defined as self-elasticity ε S , and the ratio of the relative demand change in period B according to the price change in period A is defined as cross-elasticity ε C .
While the elasticity of a product to its own price (its self-elasticity) is always negative, cross-elasticities between substitute products are positive because a decrease in the price of one will spur a demand for the other. The self-elasticity ε S , A A and cross-elasticity ε C , B A in periods A and B can be described by the following equation:
ε S , A A = Δ D e m a n d A A D e m a n d A , 0 / Δ P r i c e A P r i c e A , 0 ,   ( Δ D e m a n d A A = D e m a n d A , 1 D e m a n d A , 0 Δ P r i c e A = P r i c e A , 1 P r i c e A , 0 )
ε C , B A = Δ D e m a n d B A D e m a n d B , 0 / Δ P r i c e A P r i c e A , 0 ,   ( Δ D e m a n d B A = D e m a n d B , 1 D e m a n d B , 0 Δ P r i c e A = P r i c e A , 1 P r i c e A , 0 )
where ε S , A A is the self-elasticity, which is the ratio of the relative demand change in period A according to the price change in period A; ε C , B A is the cross-elasticity, which is the ratio of the relative demand change in period B according to the price change in period A; Δ P r i c e A is the change in price of ToU tariff rates in period A; P r i c e A , 0 is the initial price of ToU tariff rates in period A; P r i c e A , 1 is the change in the price of the revised ToU tariff rates in period A; Δ D e m a n d A A and Δ D e m a n d B A are the changes in the electricity demand in periods A and B, respectively; D e m a n d A , 0 and D e m a n d B , 0 are the initial values of the electricity demand in periods A and B, respectively; D e m a n d A , 1 and D e m a n d B , 1 are the changed values of the electricity demand in periods A and B, respectively.
If the self-elasticity ε S , A A and cross-elasticity ε C , B A are known, the amount of change in electricity demand for each period (A and B) can be calculated. Equations (8) and (9) above can be expressed as the changed demand value Δ D e m a n d A A and Δ D e m a n d B A as follows:
Δ D e m a n d A A = ε S , A A × P r i c e A , 1 P r i c e A , 0 P r i c e A , 0 × D e m a n d A , 0
Δ D e m a n d B A = ε C , B A × P r i c e A , 1 P r i c e A , 0 P r i c e A , 0 × D e m a n d B , 0
Reference [18] attempted to estimate the electricity demand function and obtain quantitative values on the price elasticity of the electricity demand to derive long-run and short-run elasticities using the time-series data from 1991 to 2014 in South Korea. The short-run price elasticity of the electricity demand is estimated to be −0.142 and the long-run price elasticity of the electricity demand is calculated to be −0.210. Since the price elasticity is considered from a long-term perspective, the value of long-run price elasticity was taken from reference [18] in this study. A conceptual illustration of the ability of the revised ToU tariffs to mitigate the VRE curtailment is shown in Figure 4 below.

4. Case Study

4.1. Jeju Power System from 2022 to 2030

To analyze the VRE curtailment due to the expansion of renewable energy in Jeju in the future, the predictions of the capacity and generation mix for the Jeju power system are based on the data from [21,22].
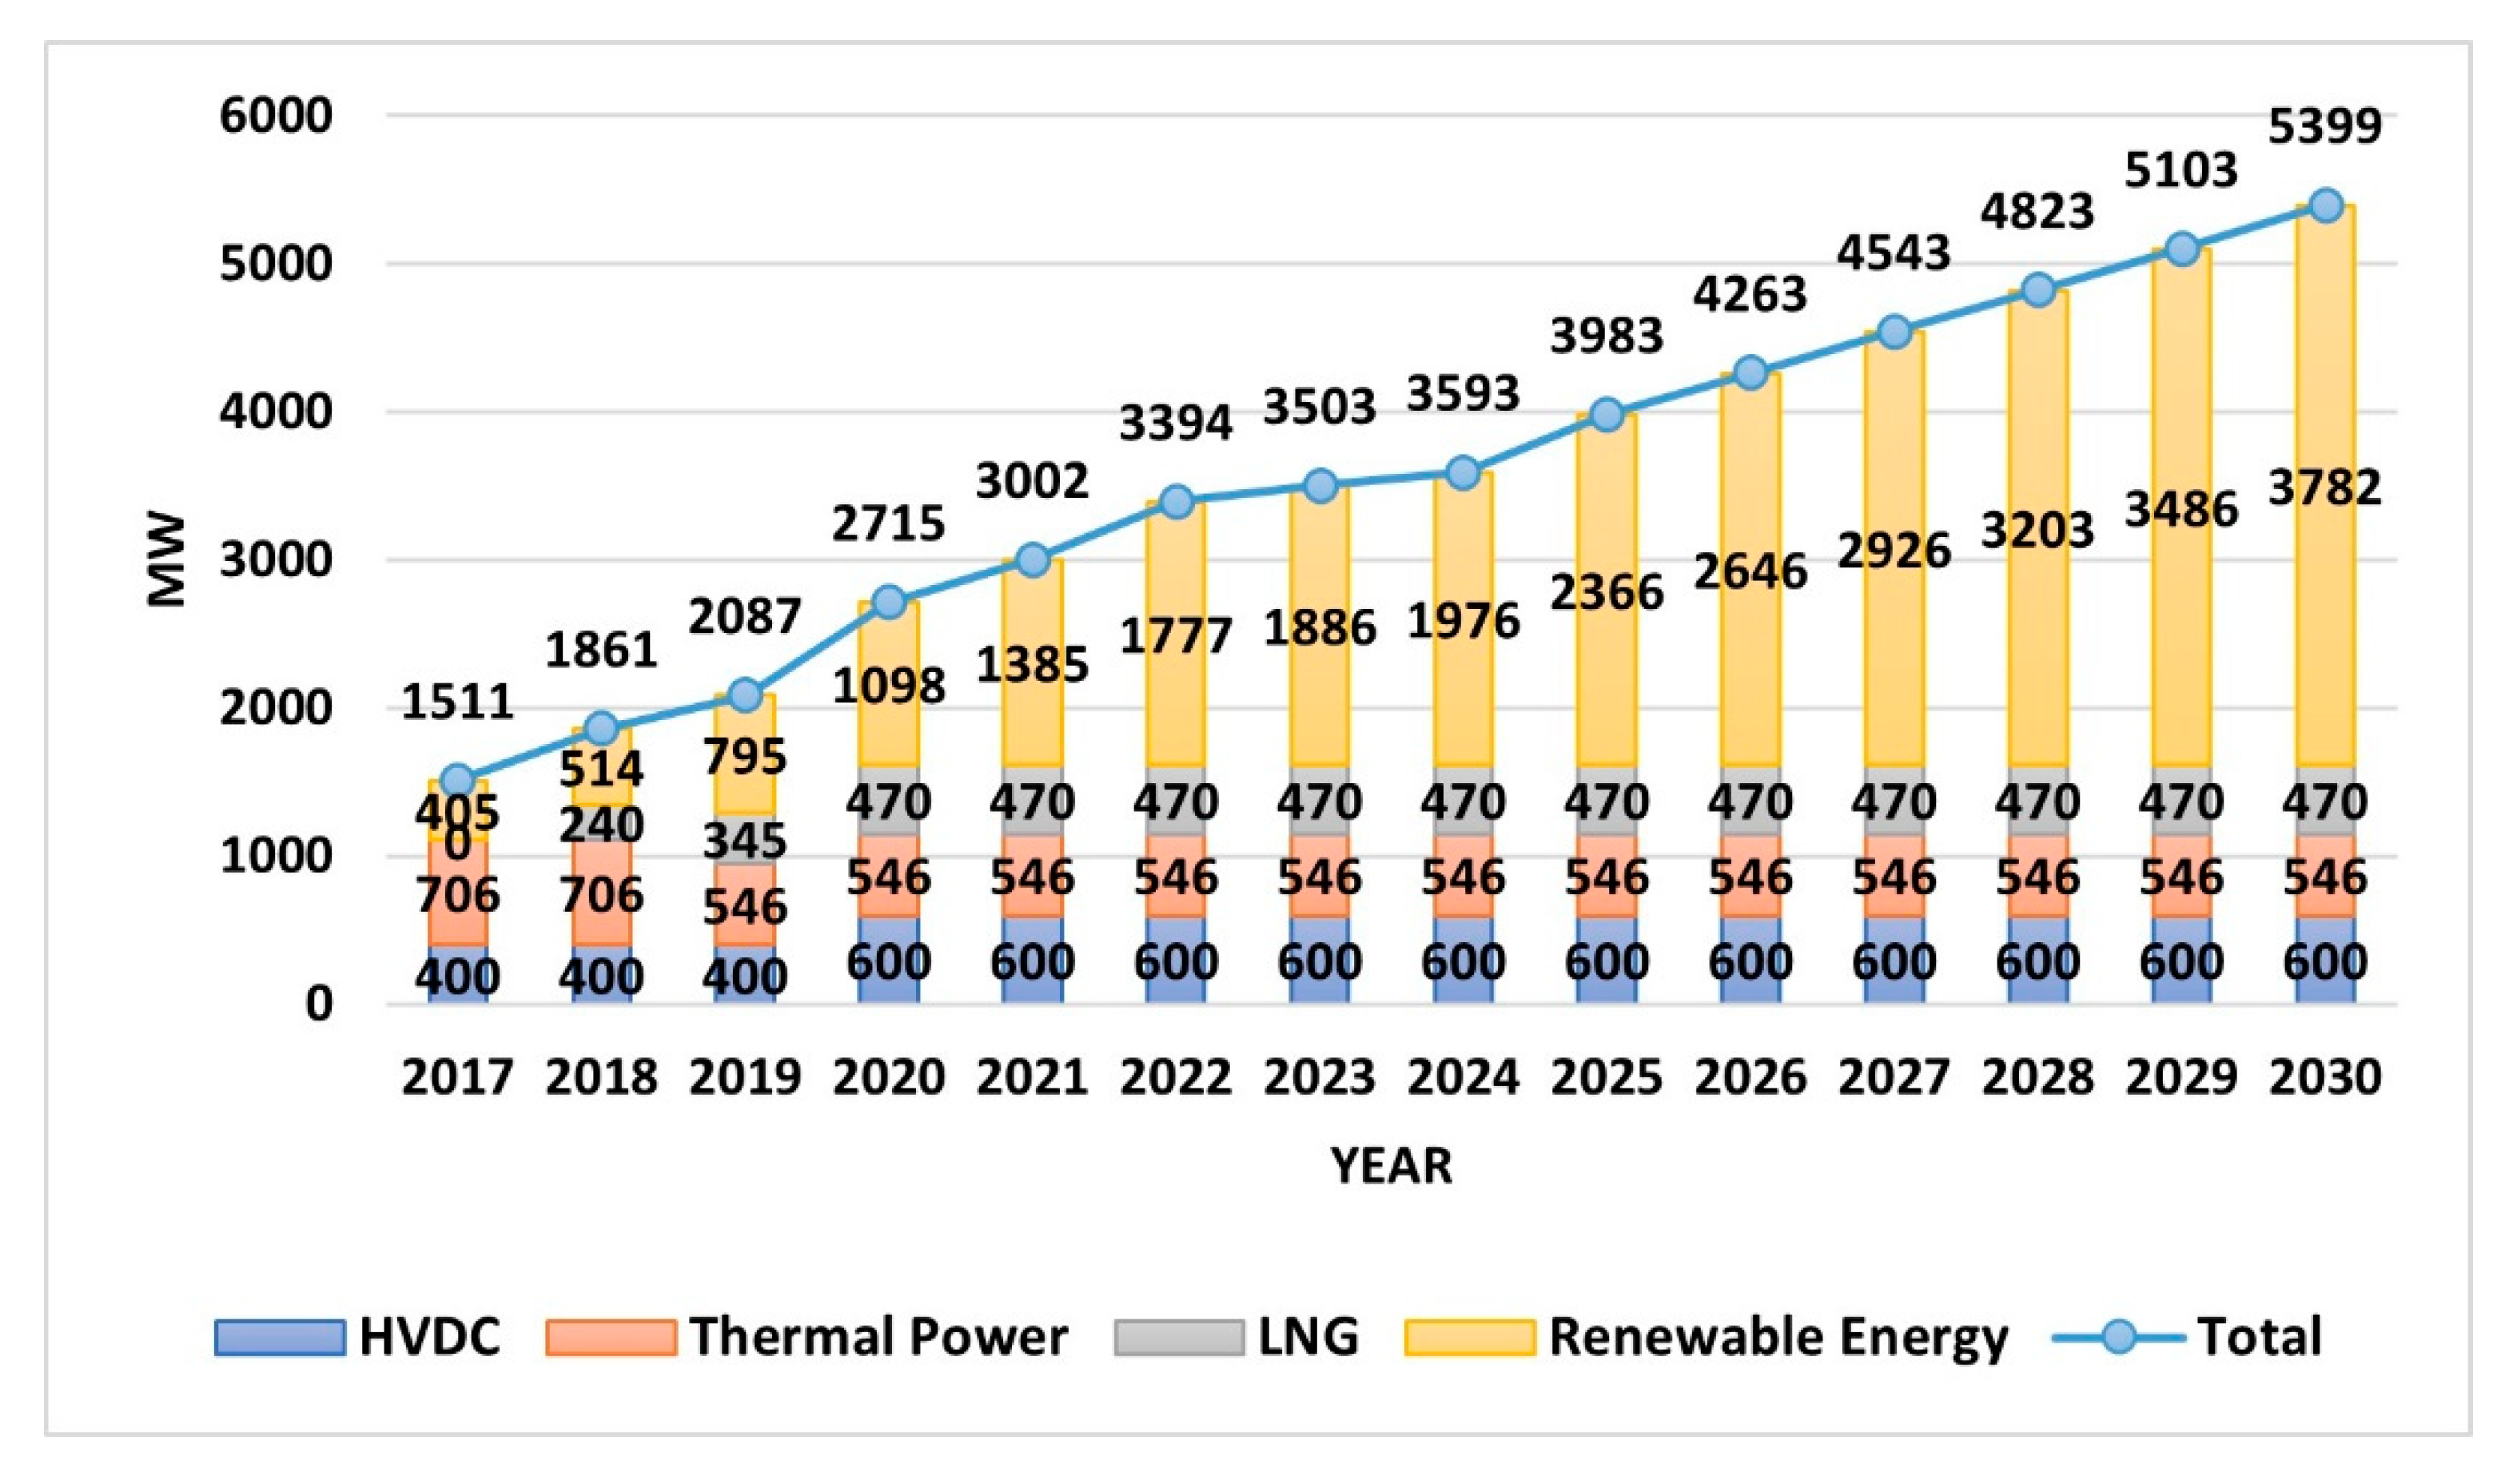
The main dataset is the hourly supply and demand breakdown for Jeju from 2015 to 2017 obtained from KPX and KEPCO. The data used in this study are composed of all the demand and power generation sources for each hour. It is hypothesized that VRE curtailment will rapidly worsen as penetration of VRE continues to augment in line with the Jeju CFI 2030 plan, unless appropriate actions to mitigate the VRE curtailment are introduced in the Jeju power system. Figure 5 shows the projected installed capacity for Jeju until 2030 [21].
In 2017, the installed capacity consisted of 400 MW from HVDC, 706 MW from conventional generators, and 405 MW from renewable energy, but by 2030, increases to 600 MW for HVDC, 1016 MW for conventional generators, and 3782 MW for renewable energy are expected. In particular, the installed capacity of VRE will increase rapidly according to the 2030 plan, and the amount of renewable energy that exceeds the demand of Jeju Island is planned to be sent to the main grid of South Korea via the HVDC system. The HVDC system on Jeju Island is a submarine cable interconnection between the Korean peninsula and Jeju. Two HVDCs, the 180 kV/300 MW HVDC #1 and ±250 kV/400 MW HVDC #2 [31,32], were constructed by KEPCO to support Jeju Island and integrate the large amount of renewable energy. Furthermore, KEPCO is planning to construct one additional ±150 kV/200 MW HVDC #3 between the mainland and Jeju Island in 2022 [33].
It was planned for HVDC #3 to transfer power from Jeju to the mainland in case the power of renewable energy and the minimum power generation of other thermal power generators exceeded the demand of Jeju Island. HVDC #1 and HVDC #2 are currently in operation to support a stable power supply from the mainland to Jeju. It is planned for #3 HVDC begin operation between the mainland and Jeju in 2022. Moreover, Jeju Special Self-Governing Province proposed an upgrade to enable reverse transmission of all HVDCs by 2022 as one of the renewable energy expansion plans [34]. The reverse transmission of HVDC interconnections from Jeju to the mainland is important in estimating the VRE curtailment in Jeju Island, as it accounts for about 40% of the total power generation. A systematic procedure was applied in this study to estimate the future VRE curtailment in the Jeju Island power system with #3 HVDC installed.

4.2. Estimation of VRE Curtailment in Jeju from 2022 to 2030

The reason for estimating the VRE curtailment from 2022 is to consider #3 HVDC entering after 2022 from the currently established power resource forecast on Jeju Island [33]. The renewable energy capacity of Jeju Island will continue to increase to occupy 70% of the total capacity in 2030. In the case of generation of wind power and PV, they are expected to account for 74.5% of the total generation in 2030 based on the capacity factor for the year 2017. Each value is indicated in Table 6.
The power demand ( D t y e a r ) was generated by time in 2017 based on the maximum power demand and the total generation amount in [21]. The amount of VRE generation at time t of the year ( P V R E , t y e a r ) was calculated based on the capacity factor of renewable energy by 2017, reflecting the Jeju CFI plan [5].
The total minimum generation capacity of the thermal power generators ( P m i n , t y e a r ) combines the minimum power generation capacity of four thermal generators based on the current must-run generators of Jeju Island, comprising South Jeju #1, Jeju Thermal #2, Jeju CC #1, and Jeju CC #2, considering overhaul periods. The sum of the minimum power generation capacities of these four generators is 55 + 46 + 67 + 67 = 235 MW. Table 7 shows the values of minimum generation capacity and maximum generation capacity of all generators in Jeju [35].
The amount of maximum power transmission of HVDC ( H V D C m a x , t y e a r ) was calculated based on the sum of the HVDC maximum reverse supply capacity considering the HVDC N-1 contingency (300 MW), the minimum operation capacity (40 MW), and overhaul periods. The maximum amount of reversal transmission of each HVDC is 120 MW for #1 HVDC, 240 MW for #2 HVDC, and 200 MW for #3 HVDC. This means that 560 MW of maximum power transmission of HVDC can be transferred from Jeju to the main grid via HVDC.
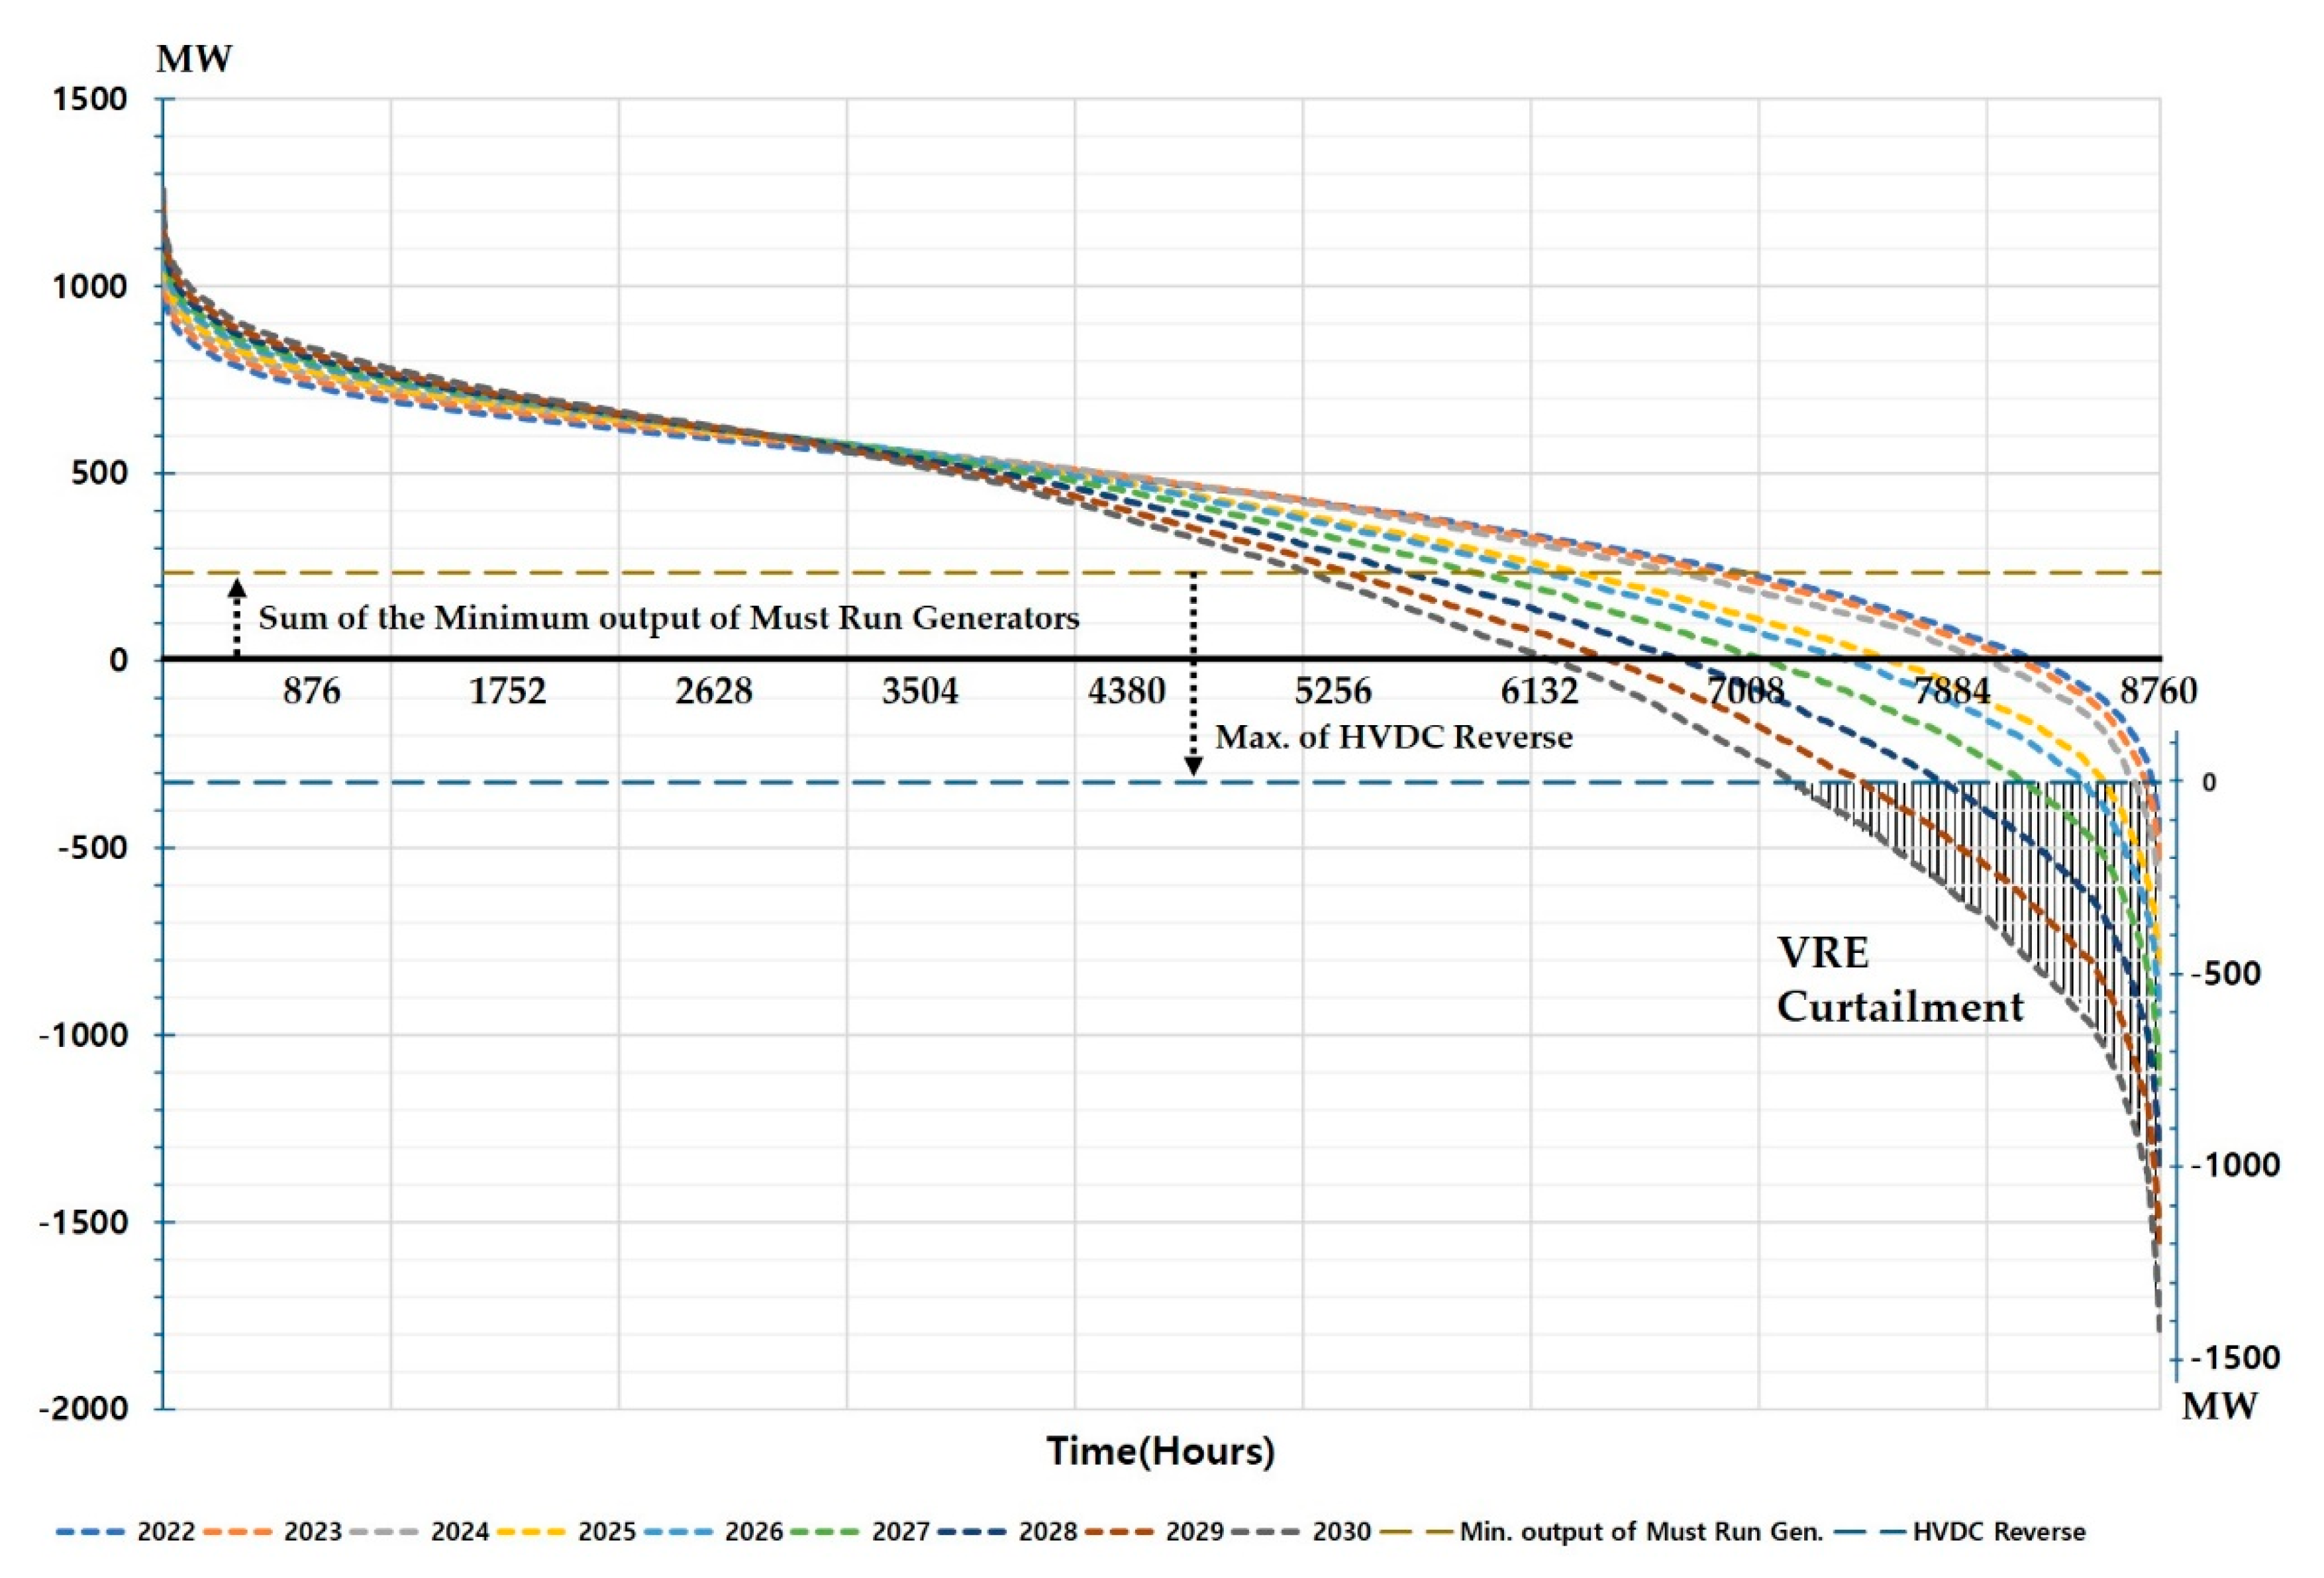
To determine the net load of a specific year in islanded power systems, we combined the values of the power demand with values of the seasonal VRE generation provided by KPX. The numerical result analysis shows the amount of total generation, the amount of VRE generation, and the amount of VRE curtailment each year. It also shows the VRE curtailment time and the VRE curtailment rate. The rate of VRE curtailment is expected to exceed 1% of the annual VRE generation from 2025. In 2030, the rate of VRE curtailment is expected to exceed approximately 10%. Figure 6 and Table 8 show the estimation of VRE curtailment results.
As shown in Figure 6 and Table 8 above, the estimation of the annual VRE curtailment increases noticeably. VRE curtailment causes waste of VRE and low efficiency, which should be mitigated. The mitigation of VRE curtailment in terms of the electricity retail market by adjusting the electricity demand when VRE curtailment occurs is proposed in Section 4.3.

4.3. Mitigation of VRE Curtailment by the Revised ToU Tariff

A mitigation procedure for VRE curtailment in Jeju Island was calculated based on 2022 conditions. The reason for this is to consider the reverse transmission of the grid interconnection line after #3 HVDC enters the Jeju power system.
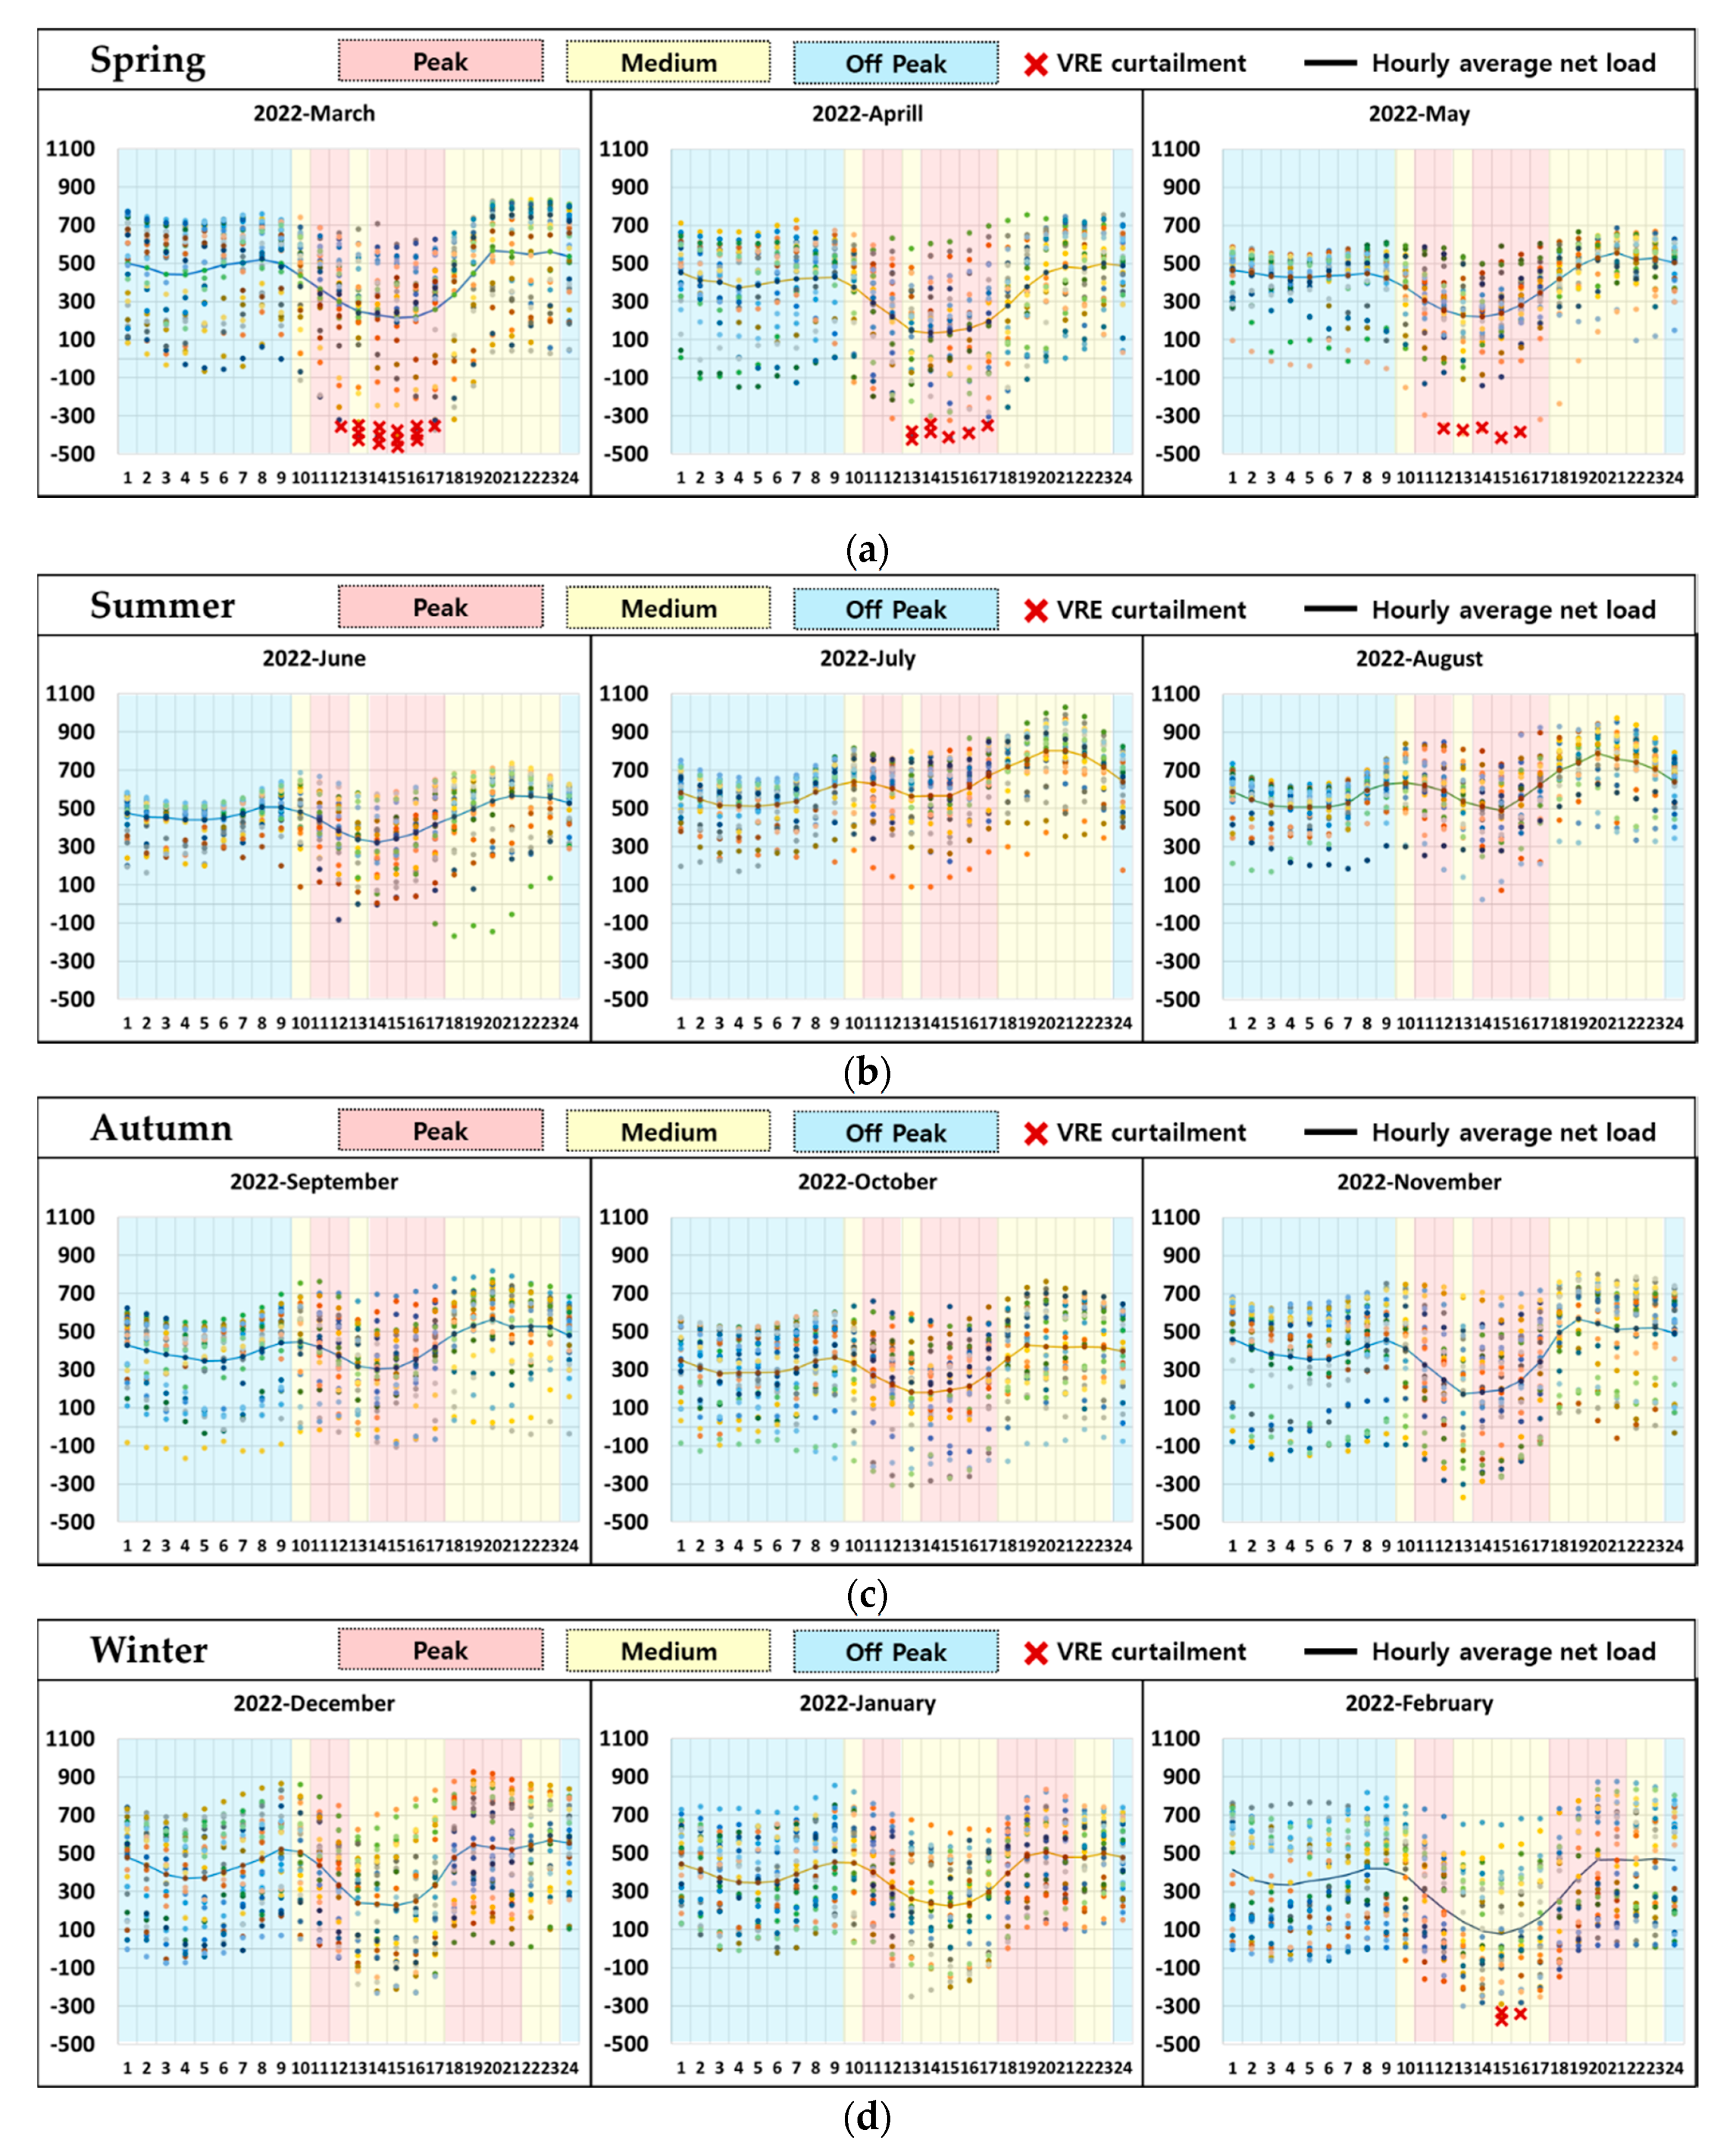
As suggested earlier in Section 3, to determine the period for which the ToU tariff rates should be revised, the numbers of VRE curtailments that have occurred for each of the three periods within the same season are compared. The ToU tariff rates will be reduced for the period with the highest VRE curtailment. In order to examine the number of VRE curtailments, the predicted seasonal monthly net load curve and the predicted number of times of VRE curtailment per hour in Jeju during 2022 are shown in Figure 7 and Figure 8 below.
The period with the highest number of estimated VRE curtailments will have its ToU tariff rates reduced. K s , p 2022 is the number of VRE curtailments for each season and period. The analysis results of the number of estimated VRE curtailments for each season and period in Jeju for 2022 are shown in Table 9.
As of 2017, the proportion of electricity used that was covered by the ToU tariff rates in Jeju Island was 52.6% from Table 3. It is difficult to know the exact proportion of ToU tariff users for any specific time in the estimated year. In this study, the proportion of ToU tariff users in 2017, 52.6%, was applied. In addition, the comparison between the current ToU tariff and the revised ToU tariff rates is shown in Table 10.
The number of occurrences of VRE curtailment for Period 1 ( K 1 , 1 2022 ) in spring and autumn was the highest at 20 times in 2022. The time of Period 1 in the spring and autumn is 10:00–12:00 am and 13:00–17:00 pm (6 h). Similar to the systematic procedure described above in Section 3, the ToU tariff rates of Period 1 in the spring and autumn seasons were lowered by price scenarios. The composition of scenarios for applying the revised ToU tariff rates is shown in Table 11.
During the peak periods in the spring and autumn seasons, a decrease in ToU tariff rates from 10:00 to 12:00 am (2 h) was assumed to be a factor for increasing demand from 07:00 to 09:00 am (2 h) during the off-peak period. In addition, a decrease in ToU tariff rates from 13:00 to 17:00 pm (4 h) was assumed to be a factor for increasing demand from 18:00 to 22:00 pm (4 h) in the medium-peak period. In addition, we forecasted changes in electricity demand when long-term price elasticity was applied to ToU tariff rate users.
The ToU tariff rates for the on-peak period in the spring and autumn seasons where the VRE curtailment occurred the most were changed by 5%, 10%, 20%, and 30% in different pricing scenarios. The long-run price elasticity of the electricity demand was calculated by [18] in these scenarios. The self-elasticity ( ε S , A A ) is −0.21, which is the ratio of change in relative demand for periods A 1 and A 2 to price changes in periods A 1 and A 2 , respectively. In contrast, the cross-elasticity ( ε C , B A ) is +0.21, which is the ratio of change in relative demand for periods B 1 and B 2 to price changes in periods A 1 and A 2 , respectively. According to Equations (10) and (11), the changed demand values D e m a n d A , 1 and D e m a n d B , 1 can be calculated by applying price scenarios as follows:
D e m a n d A , 1 = ( ε S , A A × P r i c e A , 1 P r i c e A , 0 P r i c e A , 0 × D e m a n d A , 0 ) + D e m a n d A , 0
D e m a n d B , 1 = ( ε C , B A × P r i c e A , 1 P r i c e A , 0 P r i c e A , 0 × D e m a n d B , 0 ) + D e m a n d B , 0
Table 12 shows the amount of annual VRE curtailment, time of annual VRE curtailment, and rate of annual VRE curtailment according to the revised ToU rates proposed for the mitigation scenarios.
The rate changes of mitigation in the VRE curtailment between no mitigation and the mitigation procedure of the revised ToU tariff rates show how much the VRE curtailment was decreased due to the application of the revised ToU tariff rates. These results can affect the operation of a stable islanded power system by improving the efficiency of the revised ToU tariff rates applied by power market operators and grid operators based on the ToU rate tariff rates plan.

5. Conclusions

Although VRE curtailment can be effective to ensure power balance, mitigating VRE curtailment to improve system efficiency should be the goal of the power system operator. Moreover, the ToU tariff rates are the form of rate design most widely used to generate incentives for customers to switch to usage at a better time for a stable islanded power system. This paper explains how much VRE curtailment can be mitigated as the scenarios, when the electricity price of specific seasons and hours changes, within existed time schemes of ToU tariff rates. In other words, it only changes the price by specific season and hour, while maintaining the existing seasons and hours schemes of ToU tariff. Therefore, reasonable and cost-effective schemes of ToU tariff rates that can mitigate the VRE curtailment in islanded power systems is to adjust the price at specific seasons and hours. We suggest that islanded power system operators find these specific seasons and hours when VRE curtailment occurs the most by analyzing the net load profile and following the procedures listed above.
The aim of this paper is to propose a systematic procedure for mitigating VRE curtailment by changing the electricity demand through price changes of the ToU tariffs rates in the Jeju electricity market. The procedure is based on a load profile comparison of customers, such as general, educational, and industrial, using ToU tariffs. A case study of mitigating the VRE curtailment in Jeju in 2022 through the procedure described above is presented, and we forecast changes in electricity demand when applying long-term price elasticity to ToU tariffs users. The ToU tariff rates for the periods where the VRE curtailment occurred most were changed by 5%, 10%, 20%, and 30%, and a reduced amount of VRE curtailment was shown in the results. These results can affect the operation of a stable power system by improving the efficiency of the demand response program applied by power market operators and grid operators based on the ToU rate tariff rate plan. For future work, to provide greater validity to the values of the revised ToU tariffs, this study needs to be widened to a synthesis of nation-level research by embodying the national power demand and the price elasticity of electricity demand.

Author Contributions

Conceptualization, J.L. (Jinyeong Lee), J.L. (Jaehee Lee) and Y.-M.W.; methodology, J.L. (Jinyeong Lee); data curation, J.L. (Jinyeong Lee); writing—original draft preparation, J.L. (Jinyeong Lee); writing—review and editing, J.L. (Jinyeong Lee) and J.L. (Jaehee Lee); supervision, Y.-M.W. All authors have read and agreed to the published version of the manuscript.

Funding

This research received no external funding.

Institutional Review Board Statement

Not applicable.

Informed Consent Statement

Not applicable.

Data Availability Statement

The data are not publicly available due to confidential issue.

Acknowledgments

This work was supported by a National Research Foundation of Korea (NRF) grant funded by the Korea government (MSIT) (NRF-2020R1C1C1013228). This work was supported by the Korea Institute of Energy Technology Evaluation and Planning (KETEP) and the Ministry of Trade, Industry and Energy (MOTIE) of the Republic of Korea (No. 20181210301430). This work was supported by the Korea Institute of Energy Technology Evaluation and Planning (KETEP) and the Ministry of Trade, Industry and Energy (MOTIE) of the Republic of Korea (No. 20173010013610).

Conflicts of Interest

The authors declare no conflict of interest.

References

  1. Ellabban, O.; Abu-Rub, H.; Blaabjerg, F. Renewable energy resources: Current status, future prospects and their enabling technology. Renew. Sustain. Energy Rev. 2014, 39, 748–764. [Google Scholar] [CrossRef]
  2. Panwar, N.L.; Kaushik, S.C.; Kothari, S. Role of renewable energy sources in environmental protection: A review. Renew. Sustain. Energy Rev. 2011, 15, 1513–1524. [Google Scholar] [CrossRef]
  3. Jeju Special Self-Governing Province. Carbon Free Island Jeju by 2030. Available online: http://www.ksga.org/down/down.asp?file=Carbon%20Free%20Island%20Jeju%20by%202030.pdf (accessed on 28 October 2020).
  4. The Centre of Excellence (COE) for the Sustainable Development of Small Island Developing States. The Path to a Carbon-Free Island, Jeju—Republic of Korea, 2019. Available online: http://www.sustainablesids.org/wp-content/uploads/2019/01/COE-Case-Study-in-Sustainable-Energy-The-Path-to-a-Carbon-free-Island-Jeju-Republic-of-Korea-2019.pdf (accessed on 28 October 2020).
  5. Korea Energy Economics Institute (KEEI). Modified CFI 2030 Plan to Implement Energy Self-Reliance Island; KEEI: Ulsan, Korea, 2019. [Google Scholar]
  6. Nguyen, N.; Mitra, J. Reliability of Power System with High Wind Penetration Under Frequency Stability Constraint. IEEE Trans.Power Syst. 2018, 33, 985–994. [Google Scholar] [CrossRef]
  7. Baharvandi, A.; Aghaei, J.; Niknam, T.; Shafie-Khah, M.; Godina, R.; Nojavan, S. Bundled Generation and Transmission Planning Under Demand and Wind Generation Uncertainty Based on a Combination of Robust and Stochastic Optimization. IEEE Trans. Sustain. Energy 2018, 9, 1477–1486. [Google Scholar] [CrossRef]
  8. Ueckerdt, F.; Brecha, R.J.; Luderer, G. Analyzing major challenges of wind and solar variability in power systems. Renew. Energy 2015, 81, 1–10. [Google Scholar] [CrossRef]
  9. Bird, L.; Milligan, M.; Lew, D. Integrating Variable Renewable Energy: Challenges and Solutions; National Renewable Energy Laboratory (NREL): Golden, CO, USA, 2013.
  10. Sigrist, L.; Lobato, E.; Echavarren, F.M.; Egido, I.; Rouco, L. Island Power Systems, 1st ed.; CRC Press: Boca Raton, FL, USA, 2016; pp. 1–26. [Google Scholar]
  11. Lew, D.; Bird, L.; Milligan, M.; Speer, B.; Wang, X.; Carlini, E.M.; Estanqueiro, A.; Flynn, D.; Gomez-Lazaro, E.; Menemenlis, N.; et al. Wind and Solar Curtailment. In Proceedings of the International Workshop on Large-Scale Integration of Wind Power into Power Systems, London, UK, 22–24 October 2013. [Google Scholar]
  12. Bunodiere, A.; Lee, H.S. Renewable Energy Curtailment: Prediction Using a Logic-Based Forecasting Method and Mitigation Measures in Kyushu, Japan. Energies 2020, 13, 4703. [Google Scholar] [CrossRef]
  13. Lee, J.; Lee, J.; Wi, Y.-M.; Joo, S.-K. Stochastic Wind Curtailment Scheduling for Mitigation of Short-Term Variations in a Power System with High Wind Power and Electric Vehicle. Appl. Sci. 2018, 8, 1684. [Google Scholar] [CrossRef] [Green Version]
  14. Sabera, H.; Moeini-Aghtaie, M.; Ehsan, M.; Fotuhi-Firuzabada, M. A scenario-based planning framework for energy storage systems with the main goal of mitigating wind curtailment issue. Int. J. Electr. Power Energy Syst. 2019, 104, 414–422. [Google Scholar] [CrossRef]
  15. Han, Y.R. State of Duck Curve in California, USA and Response Policy. Electr. World Mon. Mag. 2018, 493, 35–41. [Google Scholar]
  16. Brenna, M.; Foiadelli, F.; Longo, M.; Zaninelli, D. Improvement of Wind Energy Production through HVDC Systems. Energies 2017, 10, 157. [Google Scholar] [CrossRef] [Green Version]
  17. Cochran, J.; Miller, M.; Zinaman, O.; Milligan, M.; Arent, D.; Palmintier, B.; O’Malley, M.; Mueller, S.; Lannoye, E.; Tuohy, A.; et al. Flexibility in 21st Century Power Systems; National Renewable Energy Lab.: Golden, CO, USA, 2014.
  18. Ahn, S.Y.; Jin, S.J.; Yoo, S.H. Estimation of the electricity demand function using a lagged dependent variable model. J. Energy Eng. 2016, 25, 37–44. [Google Scholar] [CrossRef] [Green Version]
  19. Liu, P.; Yu, J.; Fan, S.; Bi, K.; An, Q. PEV Charging Coordination Using Adaptive Time-of-use Tariffs to Reduce Wind Energy Curtailment. In Proceedings of the 2018 IEEE Transportation Electrification Conference and Expo, Asia-Pacific (ITEC Asia-Pacific), Bangkok, Thailand, 6–9 June 2018. [Google Scholar]
  20. Jeon, W.; Cho, S.; Lee, S. Estimating the Impact of Electric Vehicle Demand Response Programs in a Grid with Varying Levels of Renewable Energy Sources: Time-of-Use Tariff versus Smart Charging. Energies 2020, 13, 4365. [Google Scholar] [CrossRef]
  21. Ministry of Trade, Industry and Energy (MOTIE). The 8th Basic Plan for Long-Term Electricity Supply and Demand (2017~2031); MOTIE: Sejong, Korea, 2017.
  22. Ministry of Trade, Industry and Energy (MOTIE). The 3rd Basic Plan for Long-Term Energy Supply and Demand (2020~2040); MOTIE: Sejong, Korea, 2019.
  23. Myung, H.S.; Kim, H.C.; Kang, N.H.; Kim, Y.H.; Kim, S.H. Analysis of the Load Contribution of Wind Power and Photovoltaic Power to Power System in Jeju. J. Korean Solar Energy Soc. 2018, 38, 13–24. [Google Scholar]
  24. Kim, S.; Lee, H.; Kim, H.; Jang, D.H.; Kim, H.J.; Hur, J.; Cho, Y.S.; Hur, K. Improvement in policy and proactive interconnection procedure for renewable energy expansion in South Korea. Renew. Sustain. Energy Rev. 2018, 98, 150–162. [Google Scholar] [CrossRef]
  25. Korea Electric Power Corporation. Statistics of Electric Power in Korea, June 2018. Available online: https://home.kepco.co.kr/kepco/cmmn/fms/FileDownSecure.do?atchFileId=ebc971a9521982009dab568591f3135dcd127129c9ad22a4aed6e67d7c1a57dfd4&fileSn=96d2f7b28d01c0ba8073192bc050ecd7e7 (accessed on 28 October 2020).
  26. Korea Electric Power Corporation. Electric Rates Table in South Korea, July 2019. Available online: http://cyber.kepco.co.kr/ckepco/front/jsp/CY/E/E/CYEEHP00201.jsp (accessed on 28 October 2020).
  27. Holttinen, H.; Kiviluoma, J.; Estanquerio, A.; Gomez-Lazaro, E.; Rawn, B.; Dobschinski, J.; Meibom, P.; Lannoye, E.; Aigner, T.; Wan, Y.H.; et al. Variability of load and net load in case of large-scale distributed wind power. In Proceedings of the 10th International Workshop on Large-Scale Integration of Wind Power into Power Systems as Well as on Transmission Networks for Offshore Wind farms, Aarhus, Denmark, 25–26 October 2011. [Google Scholar]
  28. Zhang, L.; Shi, J.; Wang, L.; Xu, C. Electricity, Heat, and Gas Load Forecasting Based on Deep Multitask Learning in Industrial-Park Integrated Energy System. Entropy 2020, 22, 1355. [Google Scholar] [CrossRef] [PubMed]
  29. Li, T.; Qian, Z.; He, T. Short-Term Load Forecasting with Improved CEEMDAN and GWO-Based Multiple Kernel ELM. Complexity 2020, 2020, 1–20. [Google Scholar] [CrossRef]
  30. Kirschen, D.S.; Strbac, G. Fundamentals of Power System Economics; John Wiley & Sons: Hoboken, NJ, USA, 2004. [Google Scholar]
  31. Jang, G.; Oh, S.; Han, B.M.; Kim, C.K. Novel reactive power compensation scheme for the Jeju-Haenam HVDC system. IEE Proc. Gener. Transm. Ditrib. 2005, 152, 514–520. [Google Scholar] [CrossRef]
  32. Market, P.E.; Skliutas, J.P.; Sung, P.Y.; Kim, K.S.; Kim, H.M.; Sailer, L.H.; Young, R.R. New synchronous condensers for Jeju island. In Proceedings of the 2012 IEEE Power & Energy Society General Meeting, San Diego, CA, USA, 22–26 July 2012. [Google Scholar]
  33. Korea Institute of Energy Technology Evaluation and Planning (KETEP). Green Energy New Deal Briefs, September 2020. Available online: http://energytransitionkorea.org/sites/default/files/2020-09/%EA%B7%B8%EB%A6%B0%EC%97%90%EB%84%88%EC%A7%80%EB%89%B4%EB%94%9C%20%EB%B8%8C%EB%A6%AC%ED%94%84%209%EC%9B%94%ED%98%B8.pdf (accessed on 28 October 2020).
  34. Jeju Special Self-Governing Province. 6th Local Energy Plan for the CFI, January 2020. Available online: http://www.prism.go.kr/homepage/researchCommon/downloadResearchAttachFile.do;jsessionid=F5062C5E781CAB59E07A9A515CE89D8A.node02?work_key=001&file_type=CPR&seq_no=001&pdf_conv_yn=Y&research_id=6500000-202000092 (accessed on 28 October 2020).
  35. Kim, Y.H.; Kim, S.H. Increasing Effect Analysis of the Wind Power Limit Using Energy Storage System in Jeju-Korea. J. Korean Solar Energy Soc. 2014, 34, 81–90. [Google Scholar] [CrossRef] [Green Version]
Figure 1. Power system diagram of Jeju Island in 2017 and the location of Jeju Island in South Korea.
Electronics 10 00135 g001
Figure 2. Flowchart of the long-term estimation of the amount of variable renewable energy (VRE) curtailment.
Electronics 10 00135 g002
Figure 3. Flowchart for counting the number of VRE curtailments for each season and period.
Electronics 10 00135 g003
Figure 4. Conceptual illustration of the mitigation of the VRE curtailment by revised ToU tariffs.
Electronics 10 00135 g004
Figure 5. Projected installed capacity for Jeju until 2030.
Electronics 10 00135 g005
Figure 6. The duration curve of the net load in Jeju from 2022 to 2030.
Electronics 10 00135 g006
Figure 7. Estimated seasonal monthly net load curve in Jeju 2022: (a) spring; (b) summer; (c) autumn; (d) winter.
Electronics 10 00135 g007
Figure 8. The number of times of estimated VRE curtailment per hour in Jeju 2022.
Electronics 10 00135 g008
Table 1. Generation capacity and power generation on Jeju Island from 2015 to 2017.
YearGeneration Capacity [MW]Power Generation [GWh]
201520162017201520162017
Grid Interconnection400.0
(31.1%)
400.0
(26.9%)
400.0
(26.5%)
1742.2
(36.4%)
2002.5
(39.1%)
2297.3
(42.4%)
Controllable Generators
(LNG, Oil, etc.)
590.0
(45.8%)
706.0
(47.5%)
706.0
(46.7%)
2602.1
(54.3%)
2535.5
(49.4%)
2410.3
(44.5%)
VRE (PV)71.7
(5.6%)
88.2
(5.9%)
125.0
(8.3%)
88.3
(1.8%)
116.3
(2.3%)
141.0
(2.6%)
VRE (Wind)215.0
(16.7%)
271.0
(18.2%)
273.0
(18.1%)
334.9
(7.0%)
441.5
(8.6%)
535.0
(9.9%)
Noncontrollable Generators10.3
(0.8%)
20.8
(1.4%)
7.0
(0.5%)
24.0
(0.5%)
31.7
(0.6%)
38.4
(0.7%)
Total1287.0
(100%)
1486.0
(100%)
1511.0
(100%)
4791.5
(100%)
5127.5
(100%)
5422.0
(100%)
Table 2. Wind-energy curtailment in Jeju from 2015 to 2017.
Number of Instances of Wind-Energy Curtailment201520162017
DayNightDayNightDayNight
Spring001122
Summer010000
Autumn020466
Winter000000
Total031588
Amount of
wind-energy curtailment [MWh]
Day: 0Night: 152Day: 2Night: 250Day: 710Night: 591
Total: 152Total: 252Total: 1301
Total generation of
wind energy [MWh]
352,183470,576542,526
Rate of curtailment [%]0.040.050.23
Table 3. Tariff rates, electricity used, average revenues by type of contract in Jeju 2017.
TypeTariff RatesElectricity Used
[kWh (%)]
Average Revenues
[Won/kWh]
Residential3-Stage Progressive Tariff810,678,777 (16.2%)108.50
GeneralTime-of-Use (ToU) Tariff1,913,259,060 (38.2%)130.42
Educational130,395,448 (2.6%)103.07
Industrial593,234,772 (11.8%)107.41
AgriculturalFlat Tariff1,390,704,857 (27.7%)47.57
Public LightingA (fixed),
B (metric)
52,182,047 (1.0%)113.48
MidnightA (heat),
B (air-conditioning)
123,089,730 (2.5%)67.48
Table 4. The time range for the current seasonal Time-of-Use (ToU) tariff in South Korea.
SeasonsTypeTime
Spring
(March, April, May)
and Autumn
(September, October, November)
Off-Peak00:00~09:00 am/23:00~24:00 pm
Medium09:00~10:00 am/12:00~13:00 pm/17:00~23:00 pm
Peak10:00~12:00 am/13:00~17:00 pm
Summer
(June, July, August)
Off-Peak00:00~09:00 am/23:00~24:00 pm
Medium09:00~10:00 am/12:00~13:00 pm/17:00~23:00 pm
Peak10:00~12:00 am/13:00~17:00 pm
Winter
(December, January, February)
Off-Peak00:00~09:00 am/23:00~24:00 pm
Medium09:00~10:00 am/12:00~17:00 pm/20:00~22:00 pm
Peak10:00~12:00 am/17:00~20:00 pm/22:00~23:00 pm
Table 5. Error between actual and estimated VRE curtailment for 2017, 2018, and 2019 in Jeju.
Number of VRE Curtailment DaysTotal VRE Curtailment [MWh]
Year201720182019201720182019
Actual VRE curtailment
[days]
161646130113669223
Estimated VRE curtailment
[MWh]
1616461297.161358.929216.42
Error [%]0000.2950.5180.713
Table 6. The estimated power demand and the amount of VRE capacity of Jeju.
Year202220232024202520262027202820292030
Max. Demand [MW]111111381161118212041227125212821321
Total Generation [GWh]621264546696693571717403763178538068
VRE (Wind) [MW]97510151075126513651565181520852345
VRE (PV) [MW]659.9780.3911.7103411211202127013371411
Total RE Capacity [MW]163517951987229924862767308534223756
Table 7. The minimum and maximum of generation capacity of all conventional generators in Jeju.
GeneratorsMin.Max.
South Jeju #1, #255103
Jeju Thermal #2, #34679
Jeju CC #1, #2 (2019~)67102
Hanlim CC (Hanlim GT)43 (28)104 (74)
Jeju Internal Combustion Engine #1, #22840
South Jeju CC90125
Jeju GT #31649
Table 8. Amount of curtailment for each year.
YearTotal
generation
[GWh]
VRE GenerationVRE Curtailment
Wind
[GWh]
PV
[GWh]
Total
[GWh]
Curtailment
[MWh]
Time
[Hour]
Rate of
Curtailment [%]
202262121941.13627.572568.701820.73300.07
202364542020.76742.082762.845079.92630.18
202466962140.21867.043007.2512,532.101090.42
202569352518.49983.353501.8341,043.242461.17
202671712717.581066.093783.6663,971.863371.69
202774033115.751143.124258.87126,844.755972.98
202876313613.481207.794821.27249,186.039455.17
202978534151.021271.515422.53432,456.0413017.98
203080684668.651341.886010.54646,447.13160910.76
Table 9. Analysis results of the number of VRE curtailment K s , p 2022 in Jeju 2022.
Season K s , p 2022 of Period 1
(On-Peak)
K s , p 2022 of Period 2
(Medium)
K s , p 2022 of Period 3
(Off-Peak)
Spring and Autumn K 1 , 1 2022 = 20 K 1 , 2 2022 = 7 K 1 , 3 2022 = 0
Summer K 2 , 1 2022 = 0 K 2 , 2 2022 = 0 K 2 , 3 2022 = 0
Winter K 3 , 1 2022 = 0 K 3 , 2 2022 = 3 K 3 , 3 2022 = 0
Table 10. Comparison between current ToU tariff and revised ToU tariff rates.
Average
(Max.~Min.)
[Won/kWh]
Current ToU Tariff RatesRevised ToU Tariff Rates
Spring and AutumnSummerWinterSpring and AutumnSummerWinter
Peak91.9
(68.1~114.8)
157.7
(114.2~196.6)
137.3
(106.7~172.2)
Scenarios157.7
(114.2~196.6)
137.3
(106.7~172.2)
Medium70.2
(58.0~84.1)
101.0
(80.4~114.5)
98.0
(78.0~114.7)
70.2
(58.0~84.1)
101.0
(80.4~114.5)
98.0
(78.0~114.7)
Off-Peak55.4
(43.8~62.7)
55.4
(43.8~62.7)
62.3
(47.6~71.4)
55.4
(43.8~62.7)
55.4
(43.8~62.7)
62.3
(47.6~71.4)
Table 11. The composition of scenarios for applying the revised ToU tariff rates.
Season and Period
(The Highest Number of
VRE Curtailment)
[Time Interval]
Period
(Demand Changed)
[Time Interval]
Price
Elasticities
Scenarios
PriceDemand
ε S , A A ε C , B A Period A Δ D e m a n d A A Δ D e m a n d B A
Spring
and
Autumn
A 1 [10~12] A 1 [10~12]−0.21-5% DownUPDown
B 1 [07~09]-+0.2110% DownUPDown
A 2 [13~17] A 2 [13~17]−0.21-20% DownUPDown
B 2 [18~22]-+0.2130% DownUPDown
Table 12. Results of annual VRE curtailment by mitigation scenarios.
ScenariosVRE
Generation
[GWh]
VRE CurtailmentRate of
Mitigation
[%]
Curtailment
[MWh]
Time
[Hour]
Rate of
Curtailment [%]
No Mitigation2568.701820.73300.0710
5% Down2568.701736.67300.0684.62
10% Down2568.701653.97290.0649.16
20% Down2568.701497.07280.05817.78
30% Down2568.701345.12280.05226.12
Publisher’s Note: MDPI stays neutral with regard to jurisdictional claims in published maps and institutional affiliations.