Article

A Segmented Preprocessing Method for the Vibration Signal of an On-Load Tap Changer

College of Information Science & Engineering, Huaqiao University, Xiamen 361021, China
*
Author to whom correspondence should be addressed.
Electronics 2021, 10(2), 131; https://doi.org/10.3390/electronics10020131
Submission received: 8 December 2020 / Revised: 4 January 2021 / Accepted: 5 January 2021 / Published: 9 January 2021

Abstract

:
The vibration signal of an on-load tap changer (OLTC) consists of a series of sharp vibration bursts, and its fault feature in certain periods is easily missed. This study considered that preprocessing the vibration signal of the OLTC in segments could effectively solve the aforementioned problem. First, the collection of the signal is discussed, the waveform characteristics of the vibration signal when the OLTC was in normal action was described, and the selection of the signal was analyzed. Second, the time domain characteristics and frequency spectrum analyses were carried out to demonstrate the necessity of segmented preprocessing. Further, the segmented preprocessing method for the vibration signal of the OLTC was presented. Finally, the main mechanical faults of the OLTC were simulated, and the vibration signals were collected to carry out the fault diagnosis experiment on the OLTC. The experimental results showed that the accuracy of the fault diagnosis increased from 94.30% of the nonsegmented preprocessing to 98.46% of the segmented preprocessing. The increase was greater, especially for contact wear faults. The method was successfully applied to the actual project.

1. Introduction

An on-load tap changer (OLTC) is one of the most error-prone parts in a transformer. When a fault occurs, it threatens the safe and stable operation of the power transformer [1]. OLTC failure is one of the leading causes of high-voltage power transformer failure [2]. Statistics show that transformer accidents caused by the OLTC account for more than 20% of such incidents, and they are mainly mechanical faults [3,4]. Vibration analysis is a noninvasive and advanced diagnostic technique suitable for detecting mechanical faults [5]. In recent years, vibration analysis has been adopted in some utilities for online condition monitoring of the OLTC of a power transformer [6].
However, the vibration signals of the OLTC are highly time-varying and nonstationary, making it very difficult to precisely extract effective features for mechanical fault diagnosis [7]. Therefore, the effective extraction of the features of the vibration signal and the finding of a method that can accurately identify the mechanical failure of the OLTC have attracted the attention of the academic community. Wang et al. [8] proposed a signal feature extraction method combining singular value decomposition denoising and wavelet packet (WP) denoising, and the method was successfully applied to the analysis of the actual vibration signal of OLTC. Lu and Cui [9] analyzed the vibration signal of the OLTC while closing contact to obtain its WP energy and entropy, based on which the fault characteristic signal could be easily found. Duan et al. [10] proposed a new method based on a multiresolution feature extraction algorithm and a genetic optimization support vector machine (GA-SVM). The kernel function parameters and penalty factors of the SVM were optimized by GA to improve the accuracy of the OLTC fault classifier. Gao et al. [11] used WP energy entropy to describe the information comprising the vibration signal in the switch process of an OLTC, and they proposed a fuzzy weighted least squares support vector machine model based on the cuckoo search algorithm to identify mechanical fault types. It could deal with a small sample and nonlinear prediction problems well. Yue et al. [12] proposed an improved Hilbert–Huang transform comprising the ensemble empirical mode decomposition and Hilbert marginal spectrum analysis, combined with the Volterra model of chaotic time series, to aid with mechanical fault feature extraction of OLTCs. Compared with other methods, the proposed method achieved a higher fault recognition accuracy. Duan et al. [13,14,15] proposed an improved empirical mode decomposition (EMD) with the masking signals of multiple frequencies added, a narrowband, noise-assisted, multivariate empirical mode decomposition method, and a method combining an optimized Hilbert–Huang transform (HHT) algorithm and Lorentz information measure to analyze the vibration signals of the OLTC during a contact switch. These methods had obvious superiority in aliasing reduction compared with the conventional methods. Xu et al. [16] proposed a method combining ensemble EMD, the Volterra model, and a decision acyclic graph support vector machine to improve adaptability, feature resolution, and identification accuracy when diagnosing mechanical faults in the OLTC of a transformer. The method could not only solve the nonstationary problem of signals, but also greatly relieve the computational complexity and improve the computing speed. Liu et al. [17] applied the variational mode decomposition to the decomposition of an OLTC mechanical vibration signal, thus effectively avoiding the phenomenon of modal aliasing and enhancing the accuracy of feature extraction. Li et al. [18] investigated a novel strategy based on a hidden Markov model for the mechanical fault diagnosis of an OLTC. A feature vector extraction methodology was presented for discrete power spectra with partition, normalization, and vector quantization of the power spectral density of the obtained vibration signals. The method, to the farthest extent, could retain the unique features and differences in various mechanical condition modes. Wang et al. [19] presented a mechanical fault diagnosis model of the OLTC based on the combination of phase space fusion of a Bayes estimation and improved support vector data description (SVDD), considering the chaos dynamic features of the vibration signals of the OLTC. The model had a high diagnostic accuracy and calculation efficiency. Zeng et al. [20] presented a fault recognition method for the OLTC based on the convolutional neural network, considering the texture features of the recurrence plot for vibration signals during the switching process of the OLTC. The recognition rate of the slight fault improved greatly. Wang et al. [21] proposed a feature extraction method based on improved variational mode decomposition and weight divergence, and they used the harmony search to optimize the parameter selection of the relevance vector machine. The proposed integrated model exhibited a high fault diagnosis accuracy.
Some achievements have been made in fault diagnosis of the OLTC based on vibration signals, but room for improvement still exists. It may be a good idea to preprocess the vibration signal of the OLTC in segments. The decision to process in segments determines the quality of the feature extraction and also whether the final detection result is correct, to a large extent. Zhang et al. [22,23,24] pointed out that selecting the specific period of the OLTC vibration signal might highlight state features, and they proposed the OLTC vibration signal stage division method based on the Teager energy operator double threshold method. However, they put too much emphasis on the accuracy of the segmentation, complicating the algorithm and reducing the practicability.
Therefore, compared with the study by Zhang, the present study was more focused on application, pursuing simplicity, and practicality. It demonstrates the necessity of preprocessing the vibration signal of the OLTC in segments and presents the corresponding method. The rest of this manuscript is organized as follows. In Section 2, the collection of the signal is discussed, the waveform characteristics of the vibration signal when the OLTC is in normal action is described, and the selection of the signal is analyzed. In Section 3, analyses of the time domain characteristics and frequency spectrum, performed to demonstrate the necessity of preprocessing the signal in segments, are described. Furthermore, the segmented preprocessing method for the vibration signal of the OLTC is presented. Section 4 validates the accuracy and efficiency of the method. Finally, conclusions are drawn, and potential areas for future research are highlighted in Section 5.

2. Vibration Signals of the OLTC

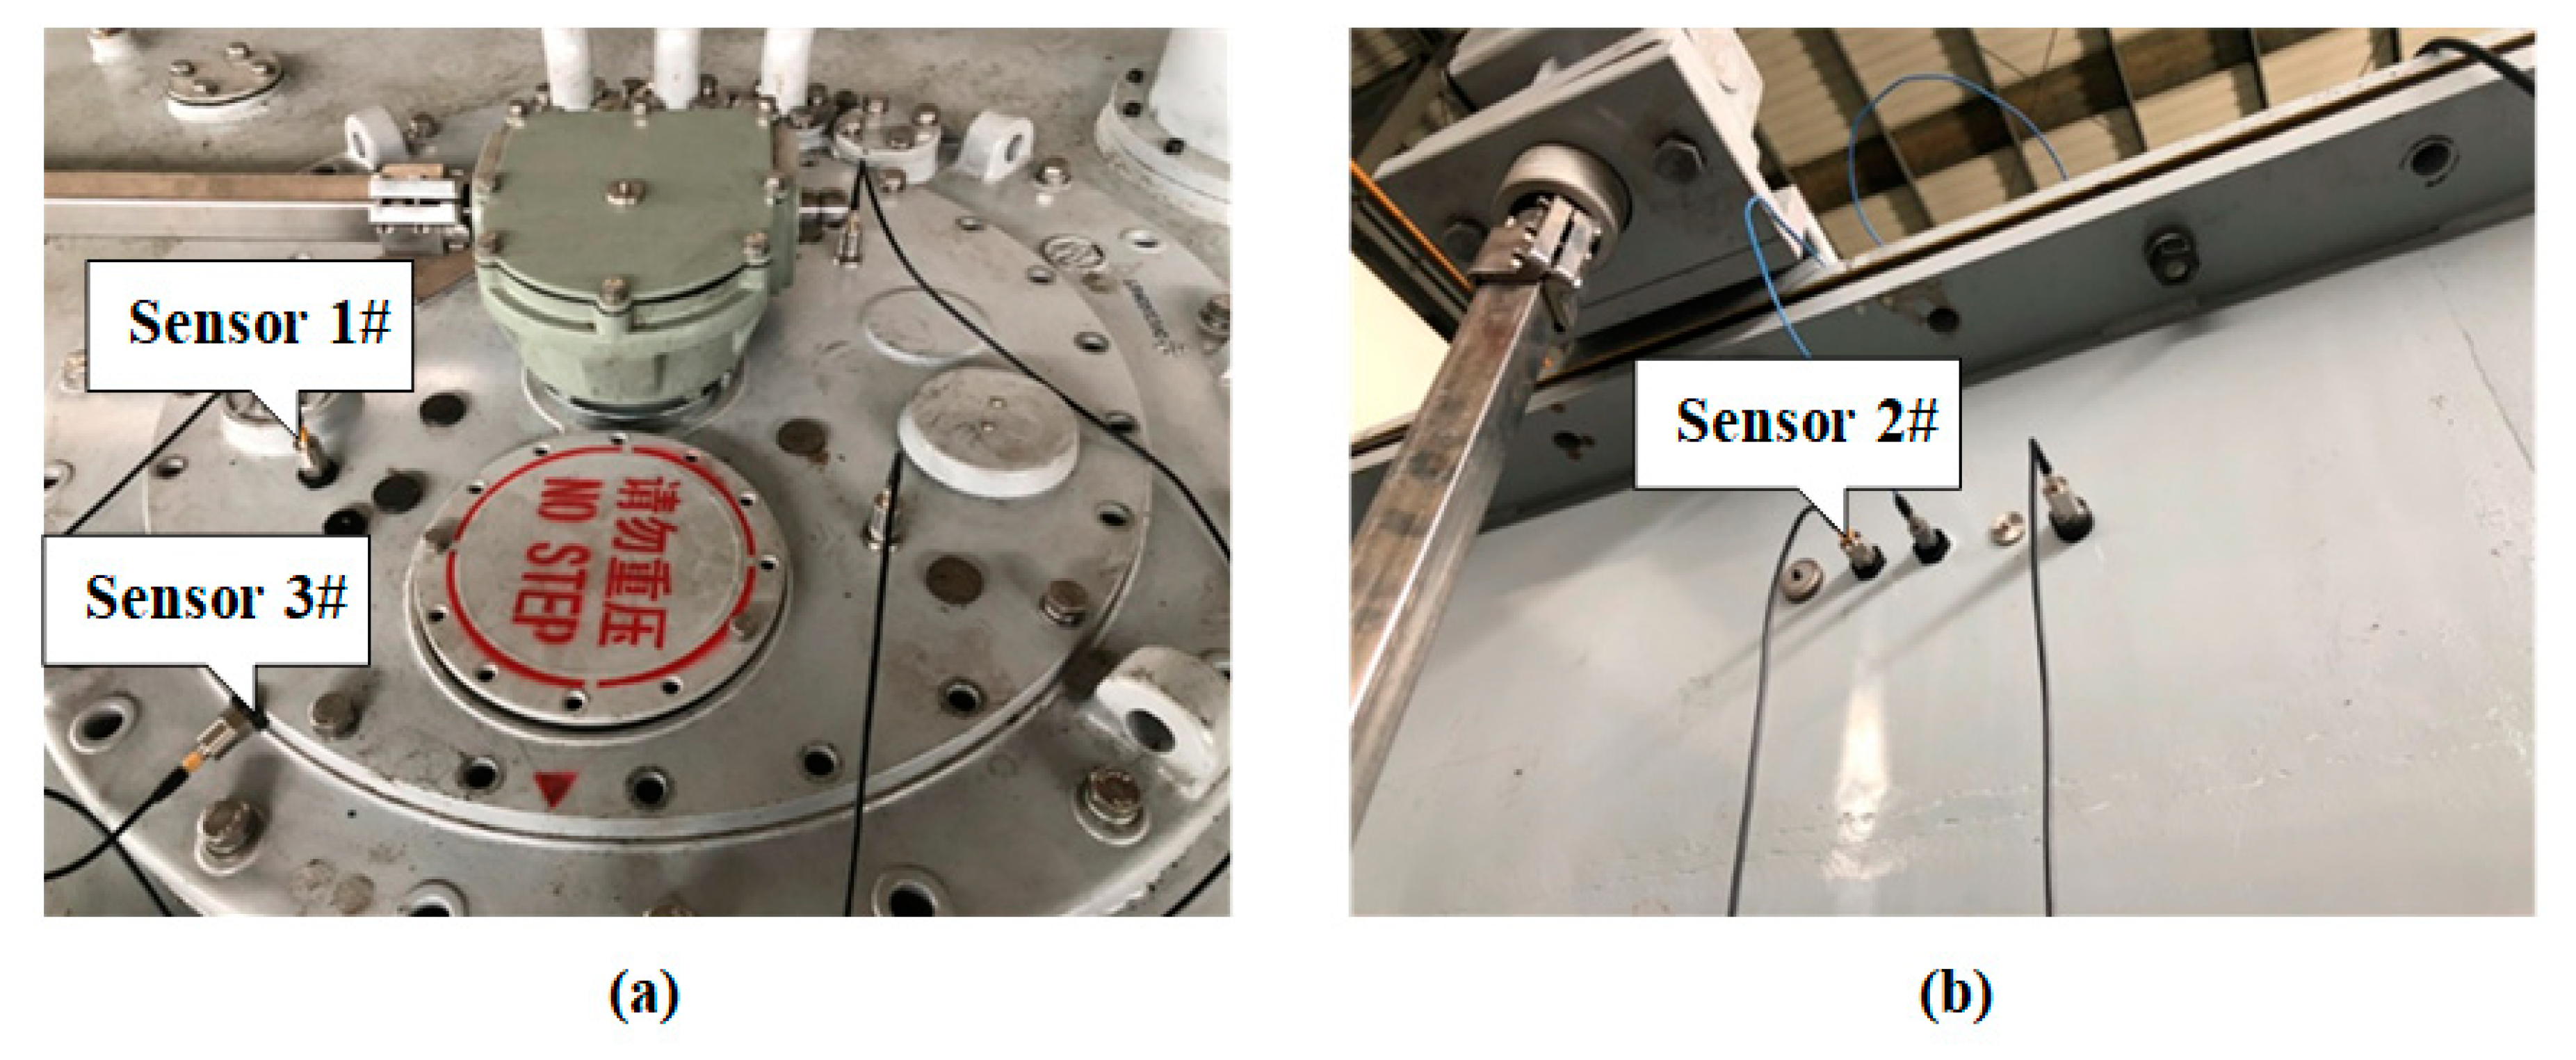
2.1. Collection of the Signal

An OLTC comprises the following elements: a tap selector, a diverter switch, and a motor [25,26]. A typical vibration signal is caused by the tap changer’s action [27]. General vibration signal sensors include displacement sensors, speed sensors, and acceleration sensors. Acceleration sensors are generally used to collect the mechanical vibration signal of the OLTC. This is because the vibration signal is a response to the internal excitation source of the equipment and changes according to the change in the mechanical state of the OLTC. Its essence is the superposition of a series of transient acceleration signals. The sampling rate of the vibration signal should not be lower than 10 kSa/s, because the main vibration signal spectrum is within 2000 Hz when the OLTC is in action. In addition, considering the limitation of the sensor’s frequency range and the pressure of data transmission, calculation, and storage, the sampling frequency at this stage is preferably not higher than 100 kSa/s.
Multi-sensor signal collection can significantly improve fault detection performance [28]. In this study, three channels were selected to collect vibration signals. The installation method and the location of the sensor needed to be carefully selected due to the structural limitations of the transformer and the safety limitation of the electrical equipment, which further impacted the application of the vibration analysis of the OLTC in the field [29]. Vibration sensors are generally only allowed to be installed on the exposed top cover of the OLTC or the side wall of the transformer tank. Sensor 1# was vertically installed in the middle of the OLTC’s top cover, and Sensor 3# was horizontally installed on the side edge of the OLTC’s top cover, as shown in Figure 1a. In this way, the vibration signal could be directly transmitted to the sensor through the OLTC’s shell, and the maximum signal amplitude and the energy characteristics can be obtained, thereby obtaining the most realistic spectrum characteristics. Sensor 2# was installed on the side wall of the transformer, away from the OLTC, to eliminate the interference caused by the vibration of the transformer through correlation analysis, as shown in Figure 1b.

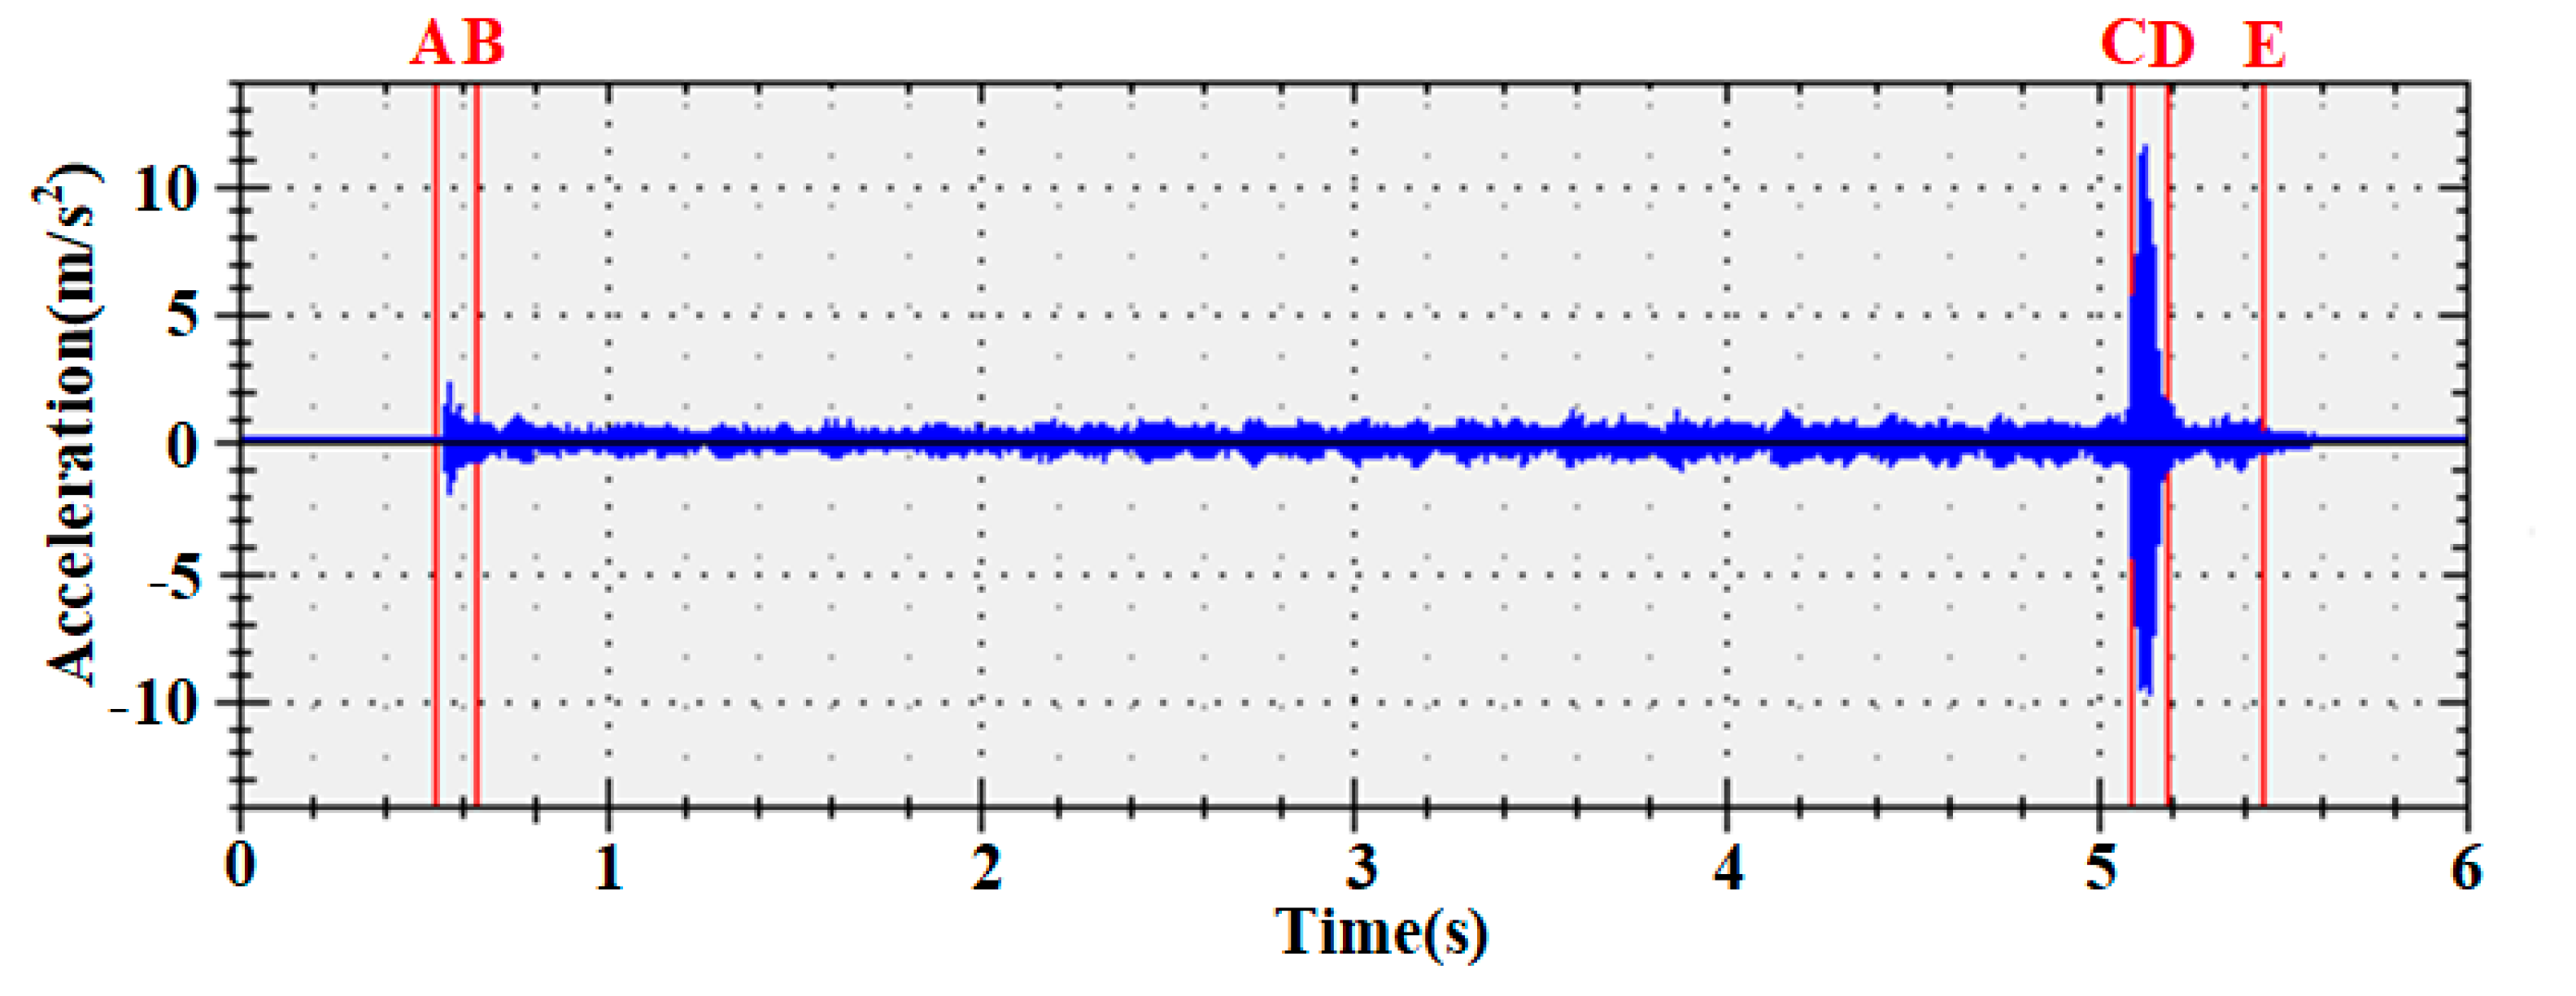
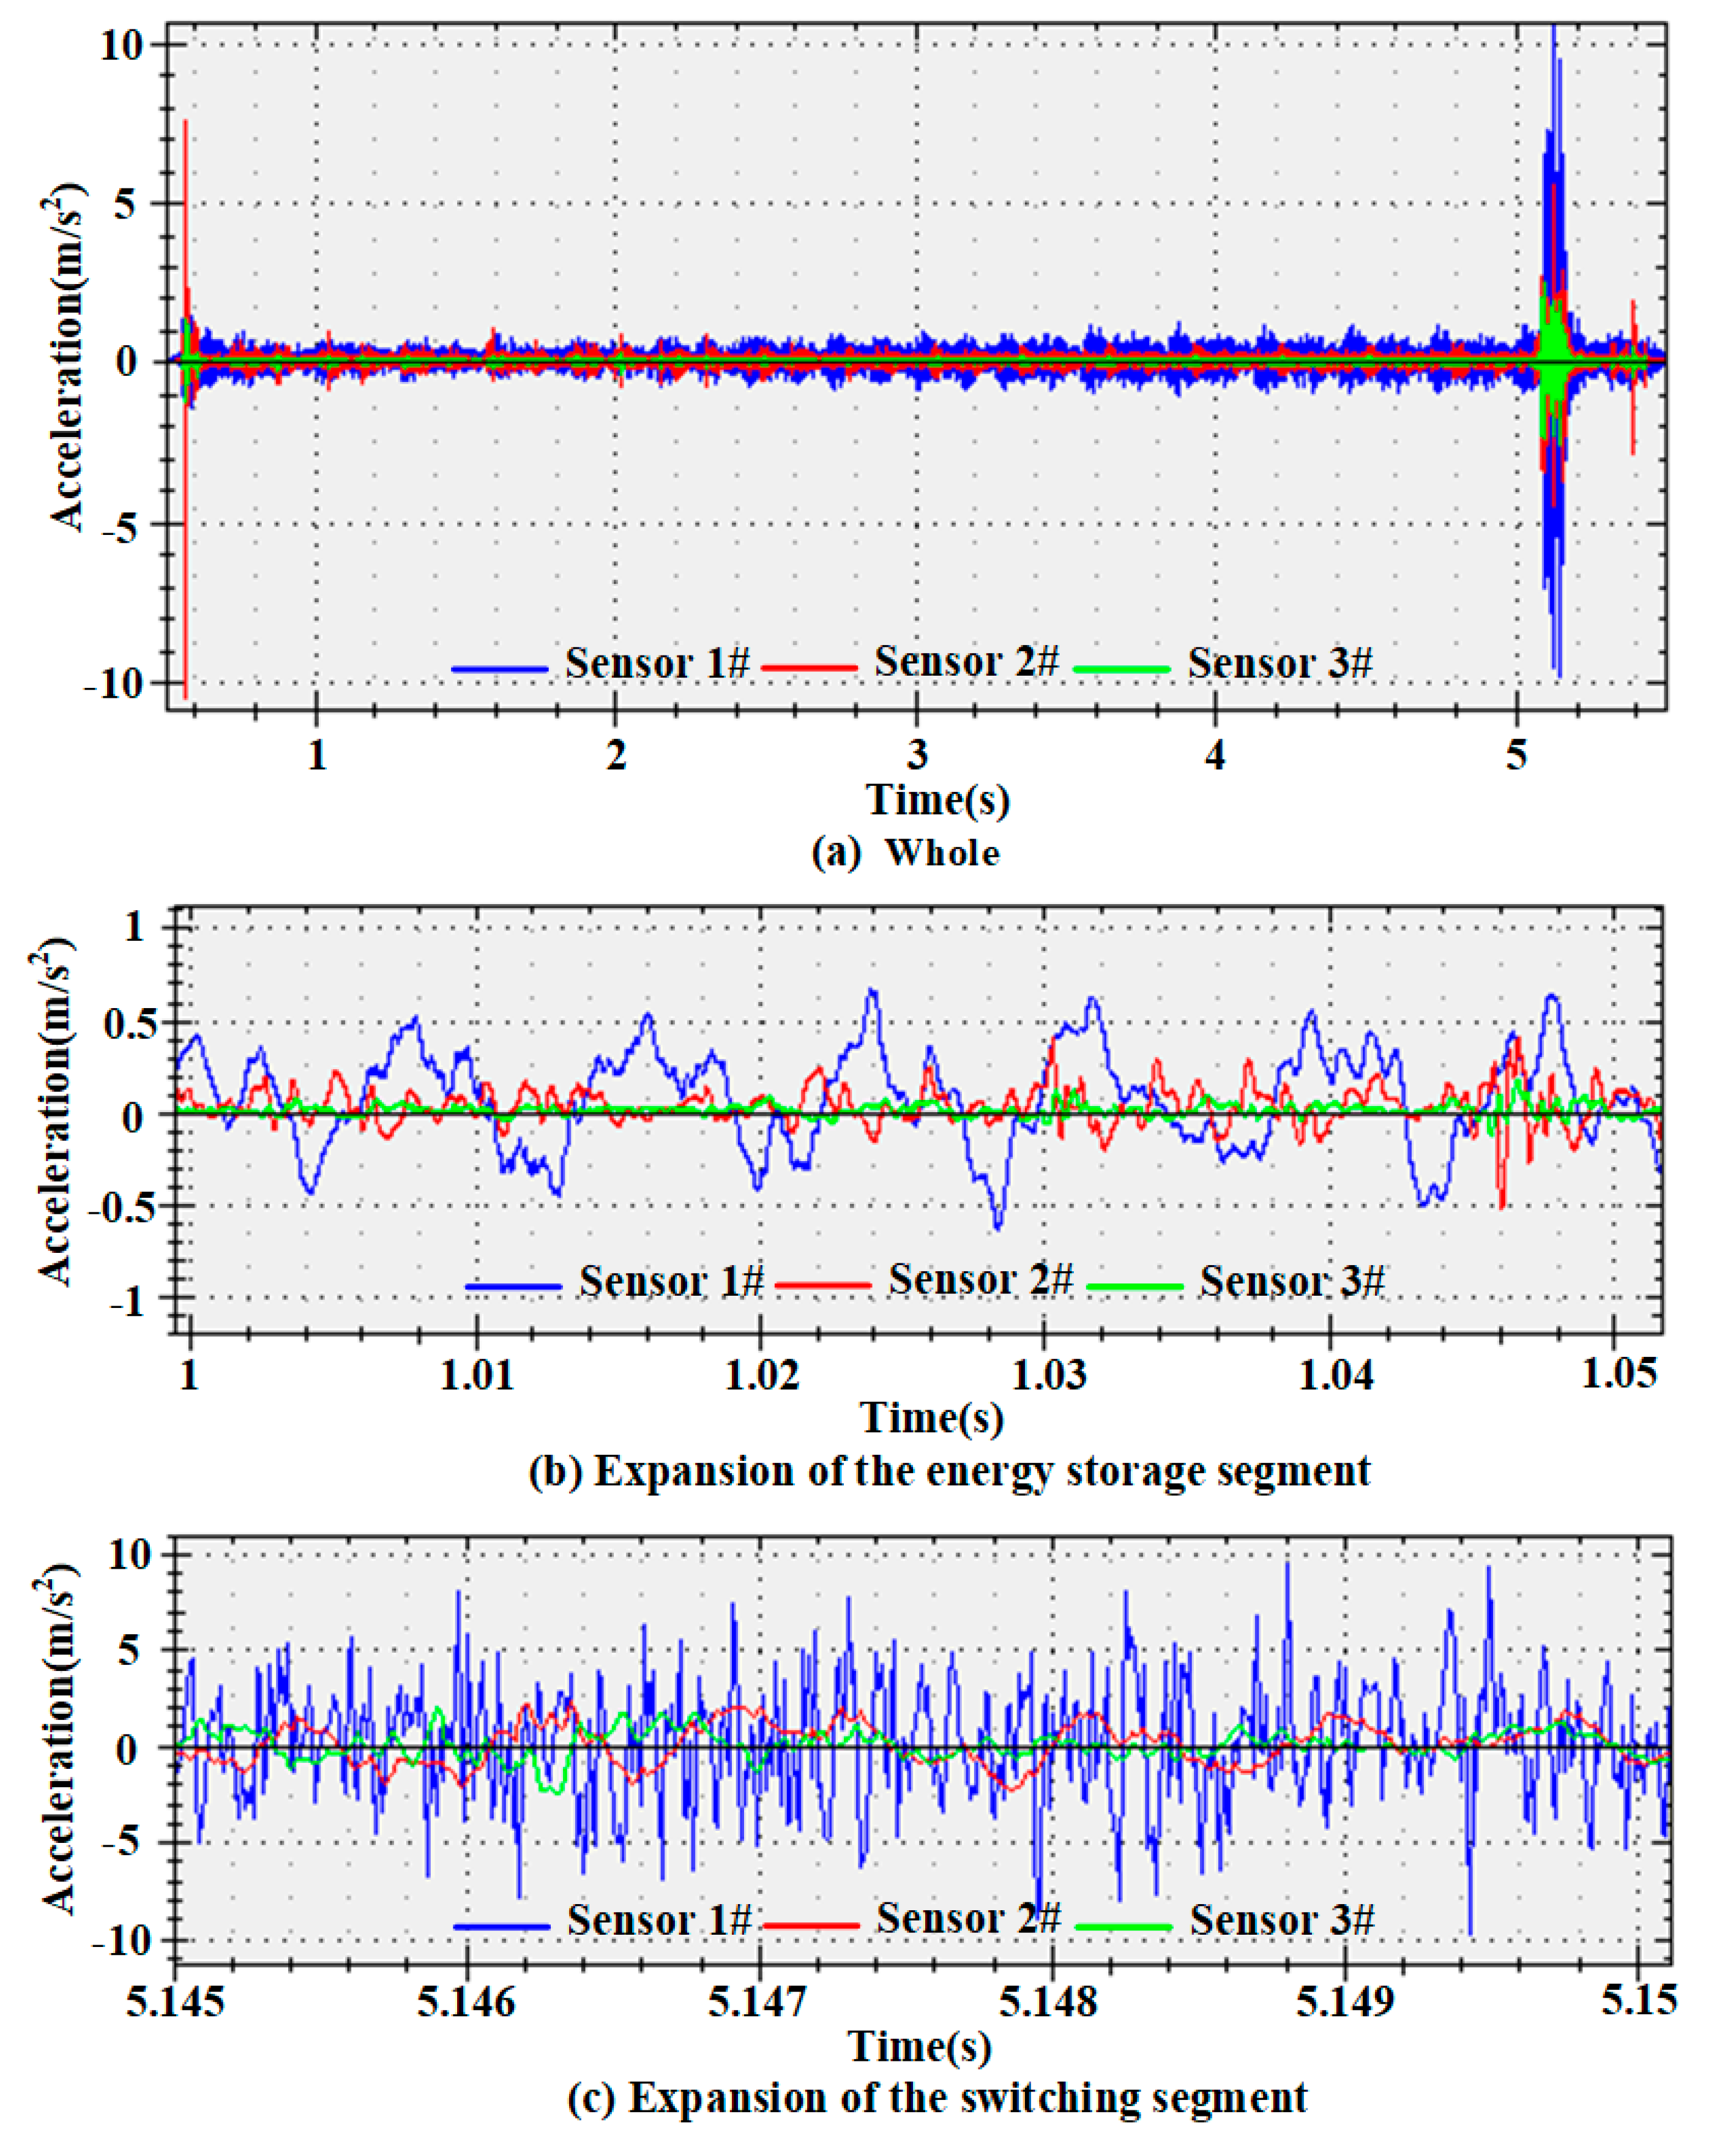
2.2. Waveform Characteristics of the Vibration Signals of the OLTC

The vibration signals of the OLTC were in the short term and had a typical stage [30]. The action of the switch contacts had a strong regularity as the main source of OLTC vibration. The sequence, impact intensity, and interval of the contacts during the shift of the same-side gear were highly consistent [31]. Therefore, the vibration signals during different periods corresponded to different action processes. The measured vibration signal during the normal action of the OLTC is shown in Figure 2 (Sensor 1#).
As shown in Figure 2, the vibration acceleration signal of the OLTC was transient in the whole range, including several mutation processes such as starting, switching, and stopping. Therefore, the vibration signal of the OLTC was divided into the starting segment AB, energy storage segment BC, switching segment CD, and stopping segment DE. The starting segment AB was very short, generally from dozens to hundreds of milliseconds; the signal was very random and generally not used for analysis. The energy storage segment BC was relatively long, lasting several seconds. The signal was relatively stable, and the frequency spectrum was relatively simple and fixed. The switching segment CD was normally 50–170 ms long. It was composed of some drastic waves, the signal amplitude was unstable, and the frequency range was very wide. The stopping segment DE was tens to hundreds of milliseconds. The signal amplitude gradually decreased until it stopped, and this segment was generally not used for analysis.

2.3. Selection of the Vibration Signal of the OLTC

The whole waveforms of the vibration signals collected by the three sensors when the OLTC was in normal action are shown in Figure 3a. A section of the energy storage segment was intercepted and expanded, as shown in Figure 3b. Furthermore, a section of the switching segment was intercepted and expanded, as shown in Figure 3c.
Figure 3 shows the following: (1) The vibration signals of the energy storage segment were mainly composed of medium- and low-frequency components, with a few high-frequency components. (2) The vibration signals of the switching segment contained a large number of high-frequency components, due to the mechanical impact during switching. (3) Sensor 1# was installed vertically on the OLTC’s top cover, the vibration signal was directly transmitted to the sensor through the OLTC’s shell, and the amplitude of the vibration acceleration at this sensor was the highest in the whole process. Sensor 2# was installed on the side wall of the transformer tank, and the transmission path included the transformer oil and the transformer shell. The amplitude was reduced, being second to Sensor 1#, but the signal was stable. Sensor 3# was installed near the fixed point of the driving mechanism, which had strong rigidity. Besides the installation posture, the amplitude decreased very obviously and was the lowest. (4) For Sensor 2# and Sensor 3#, the attenuation of high-frequency components was particularly severe due to the installation location, installation posture, and transmission path.
The signal amplitude of Sensor 3# was reduced too much, and the signal of Sensor 2# needed to be considered for additional processing to reduce the interference of the transformer’s own vibration on the vibration signal of the OLTC. Therefore, it was recommended that the signal of Sensor 1# be the main signal and the signal of Sensor 2# be the auxiliary signal for analysis.
The aforementioned analysis showed that the vibration signals collected at different locations had different vibration characteristics during the same time period. On the contrary, the vibration signals collected at the same location also had different vibration characteristics during different time periods. Choosing the proper installation location of the sensor was crucial to the segmentation processing of the vibration signal. To simplify the analysis, this study selected the vibration signals obtained using an acceleration sensor placed on the OLTC’s head cover (Sensor 1#).

3. Segmentation Preprocessing

3.1. Necessity of Segmentation Preprocessing

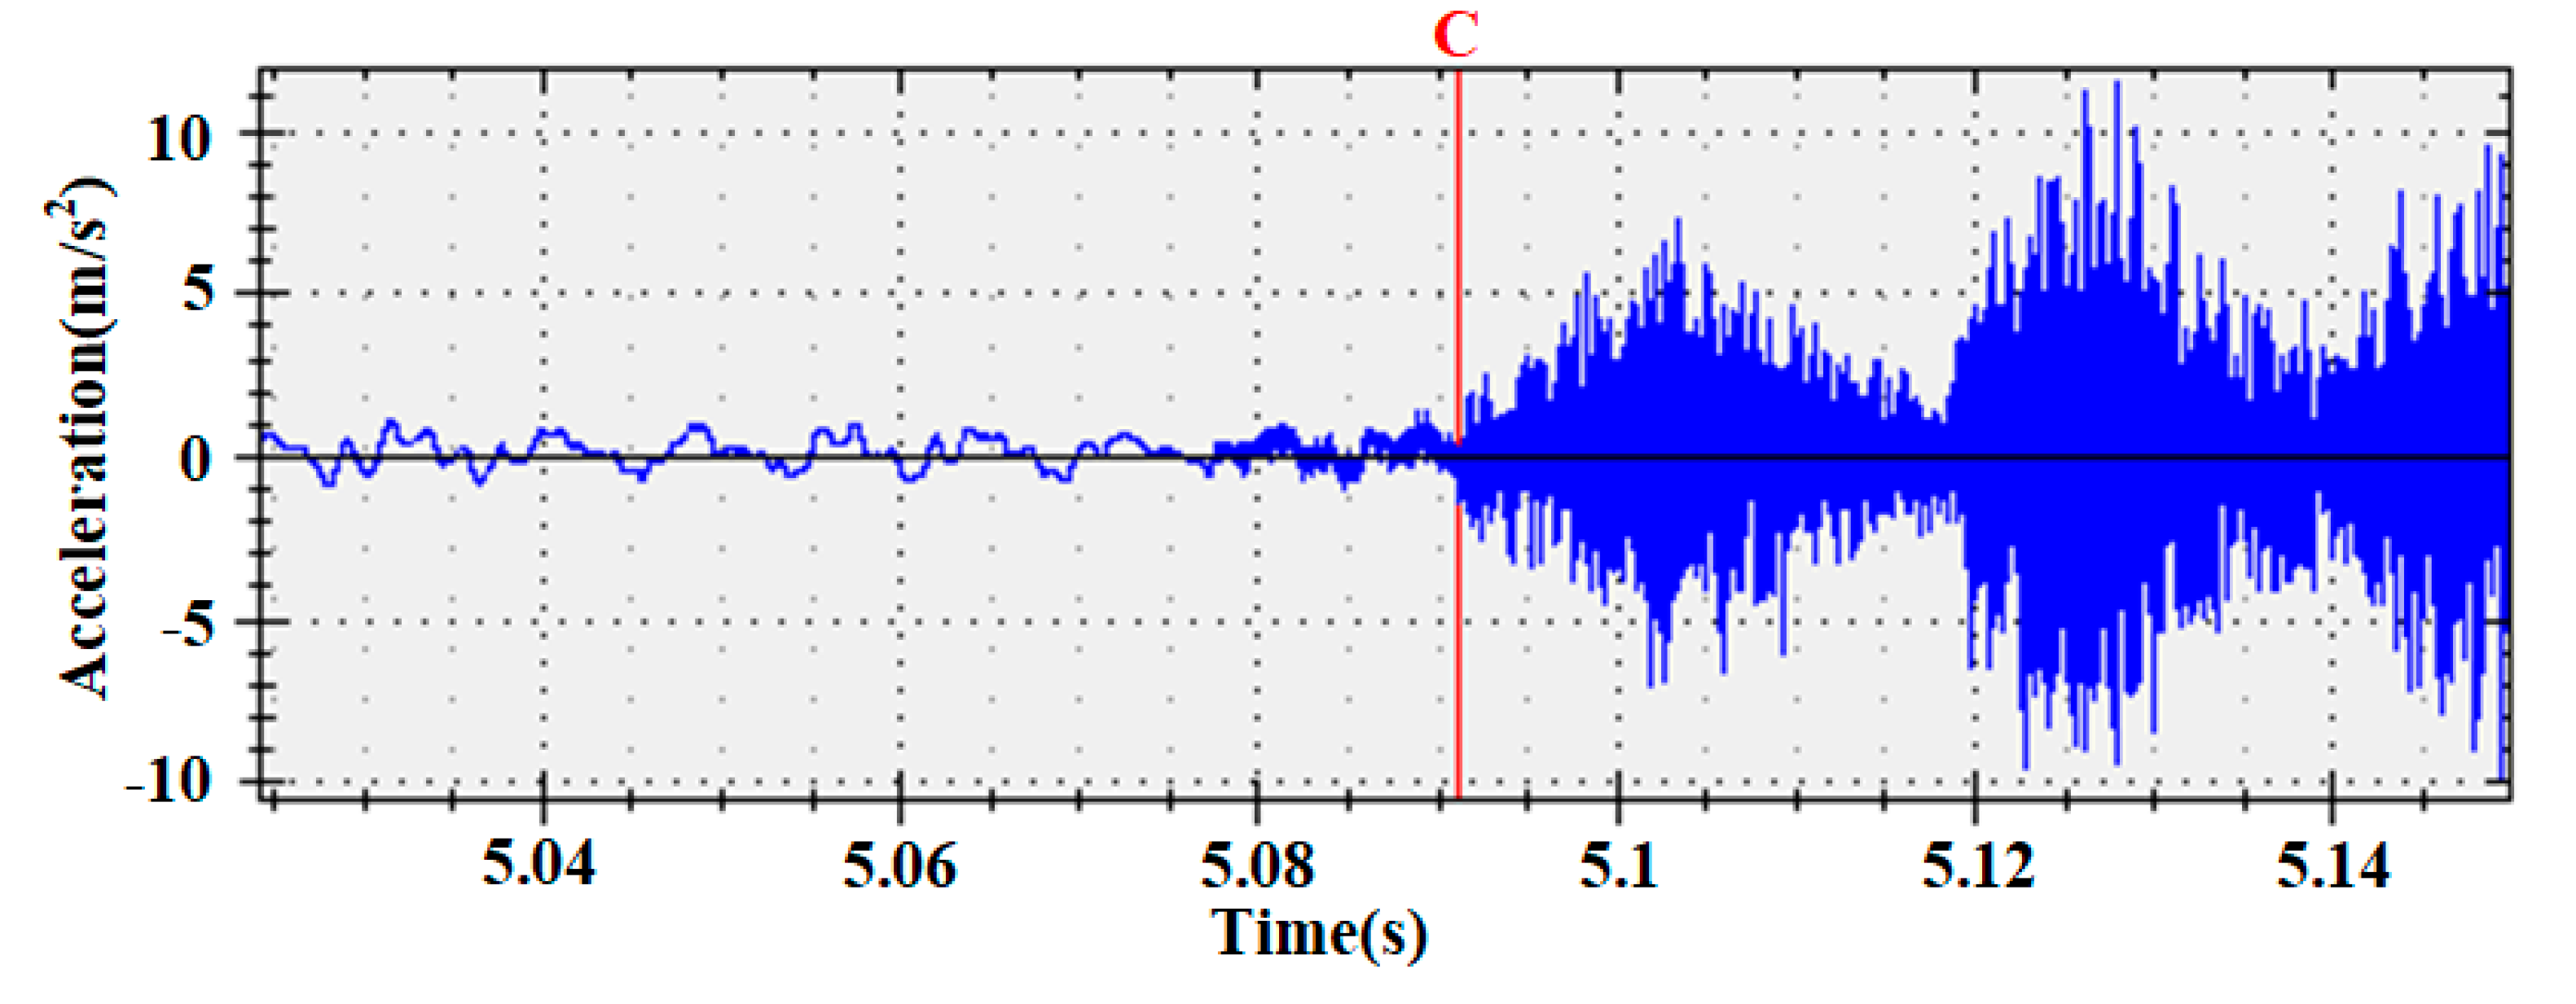
3.1.1. Time Domain Characteristic Analysis

The measured waveform in Figure 2 expanded, as shown in Figure 4.
Figure 4 shows that the vibration signals of the energy storage segment and the switching segment had obvious differences in either the amplitude of the Y-direction vibration acceleration or the density of the X-direction vibration waveform. The energy storage segment lasted for a long time, the amplitude of the vibration acceleration and the vibration frequency (the number of signal cycles per second) were relatively low, and the waveform was relatively stable. The duration of the switching segment was very short, the amplitude of the vibration acceleration was relatively high, the range of the vibration frequency was wide, and the randomness of the waveform was relatively large.
Therefore, preprocessing the vibration signal of the OLTC in segments inevitably reduced the possibility of missing useful information.

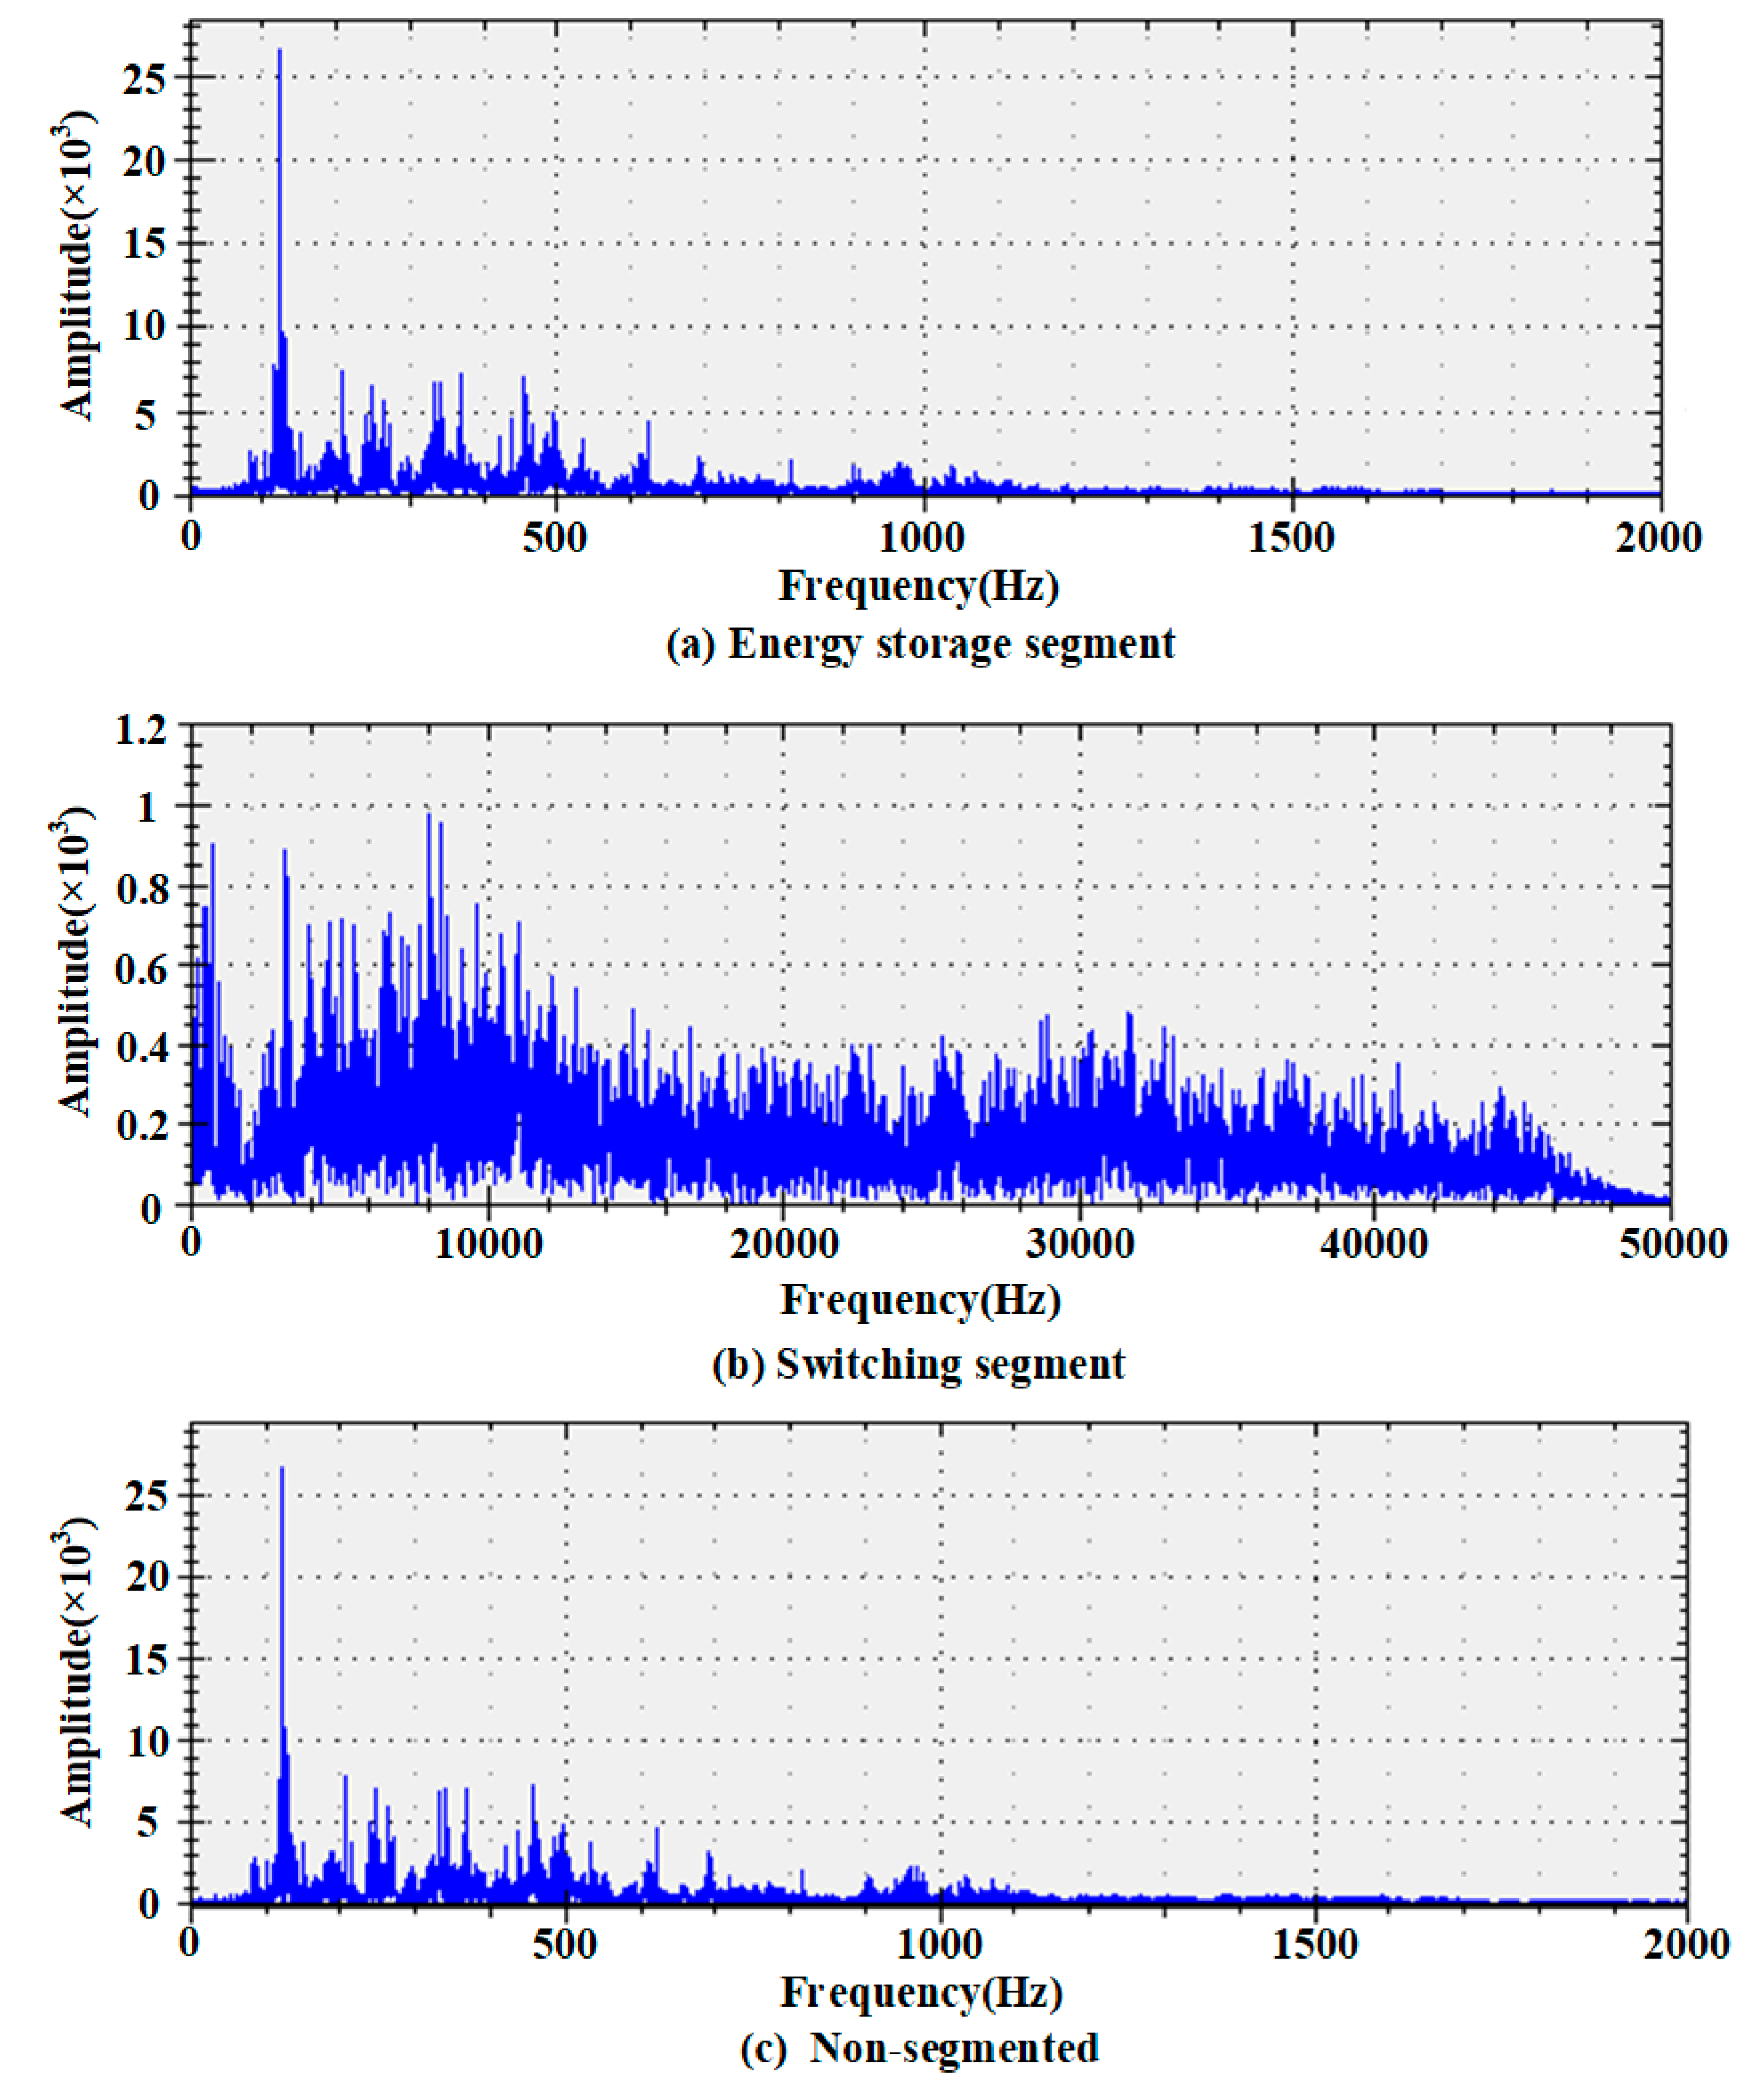
3.1.2. Frequency Spectrum Analysis

The vibration signals of the energy storage segment, the switching segment, and the nonsegmented part were analyzed with a fast Fourier transform (FFT), and the generated spectra are shown in Figure 5.
Figure 5 shows the following: (1) The frequency domain of the energy storage segment was within 1 kHz, the frequency characteristics were very obvious and concentrated, and the components above 1 kHz could basically be ignored. (2) The frequency domain of the switching segment was relatively wide, and it was distributed within 0–50 kHz (due to the limitation of the sampling rate, the limit frequency of the FFT analysis could only reach 50 kHz). The frequency characteristics were not obvious or divergent. (3) The spectrum amplitude of the energy storage segment and the switching segment differed by two orders of magnitude. If the two were added together (that is, nonsegmented), the signal spectrum of the nonsegmented part and the energy storage segment were almost the same, and the spectral characteristics of the switching segment were completely obliterated.
In summary, the difference between the energy storage segment and the switching segment of the vibration signals of the OLTC was obvious, whether from time domain analysis or frequency spectrum analysis. Nonsegmented processing resulted in missing the frequency characteristics of the switching segment. Hence, it is necessary to preprocess the vibration signals of the OLTC in segments, so as to prevent effective information from being missed and improve the accuracy of fault diagnosis.

3.2. Method of Segmentation Preprocessing

It was still difficult to monitor the OLTC’s condition online. Therefore, the segmentation preprocessing method was the best for not increasing data processing complexity. The method proposed in this study was simple, practical, and had a high accuracy. The basic steps were as follows.
Step 1: The absolute value of the vibration signal was averaged in units of 1 ms, and an envelope curve with a sampling rate of 1 kSa/s was obtained.
Step 2: The envelope curve was properly smoothed, and a smooth envelope curve was obtained.
Step 3: The envelope curve was derived to get the derivative curve, and the feature inflexion points of the smooth envelope curve were found.
Step 4: The segmentation points of the vibration signal were calculated according to the feature inflexion points and combined with the time-ordered action characteristics of the OLTC.
The calculation process is shown in Figure 6.
Some studies showed that the types of faults which were easy to detect were different during different periods of the vibration signal. The energy storage segment corresponded to the rotation process of the external transmission shaft, and it was easy to detect the looseness and jamming of the external transmission mechanism. The switching segment corresponded to the action of the OLTC switch. The switching process of the OLTC involved the actions of multiple contacts such as main contacts, main on-off contacts, and excessive contacts. Therefore, multiple vibration peaks with strong amplitudes were found in the switching segment. By analyzing the vibration signal in the switching segment, it was easy to detect whether the contacts of the switch were loose or excessively worn [23,28].
Therefore, extracting the features of different faults at different stages of the vibration signal is of great significance for analyzing each component of the OLTC. However, in actual use, the extracted vibration division points often do not correspond to the preset vibration stage due to noise and the possible loose parts of the OLTC, which greatly affects the fault diagnosis accuracy. In this study, the signal was preprocessed in segments, just to discard the time period with too many interference components (the starting segment and the stopping segment) and retain the time period with rich condition information (the energy storage segment and the switching segment). Moreover, reserved time periods were processed separately to prevent the annihilation of the fault information and maintain the integrity of the fault information. Therefore, the method proposed in this study did not require the high precision of division points.

4. Experiment

4.1. Sample Description

The established samples are shown in Table 1.
The test object was an OLTC, whose type was CMIII; 600Y/126C-10193W. The type of vibration acceleration sensor was LC0103TB-50. The sampling rate was 100 kSa/s. The wavelet base DB3 was used to decompose the vibration signal into four-layer WPs, and the classifier SVM was used to realize the intelligent diagnosis of the mechanical faults of the OLTC.
The mechanical faults of the OLTC included drive mechanism faults (e.g., trip over stop, refusal to move, parts loosening, parts falling off, spindle deformation, and jamming), switching mechanism faults (e.g., spring fatigue, spring breakage, parts loosening, parts falling off, and mismatching between the groove and wheels), and selection mechanism faults (e.g., parts loosening, parts falling off, parts distorted and deformed, and unbalanced operation of the switch) [32,33,34,35,36]. Some of these faults were mainly reflected in the energy storage segment, some were reflected in the switching segment, and others affected the whole process.
The OLTC had 17 tap positions, with transition positions between 8 and 9 as well as 9 and 10. Data with and without transition positions must be processed separately. This study only focused on data without transition positions. Excluding 8-9 and 9-10 upshifts and 10-9 and 9-8 downshifts, 14 upshifts and 14 downshifts were detected (1-2, 2-3, 3-4, 4-5, 5-6, 6-7, 7-8, 10-11, 11-12, 12-13, 13-14, 14-15, 15-16, and 16-17 upshifts; 2-1, 3-2, 4-3, 5-4, 6-5, 7-6, 8-7, 11-10, 12-11, 13-12, 14-13, 15-14, 16-15, and 17-16 downshifts). The continuous samples were measured from the 1-2 to 16-17 upshifts and then from the 17-16 to 2-1 downshifts. The supplementary samples were obtained by repeated tests of the 1-2 upshift and the 2-1 downshift.
The training samples used 1-2, 2-3, 3-4, 4-5, 5-6, 12-13, 13-14, 14-15, 15-16, and 16-17 upshifts and 2-1, 3-2, 4-3, 5-4, 6-5, 13-12, 14-13, 15-14, 16-15, and 17-16 downshifts in the continuous samples. The extended samples used the supplementary samples, consisting of 6-7, 7-8, 10-11, and 11-12 upshifts and 7-6, 8-7, 11-10, and 12-11 downshifts. In addition, this study did not consider a situation where multiple faults occurred together for the time being. Therefore, the spring fatigue and contact wear fault was only used as an extended sample. As long as the diagnosis result was spring fatigue or contact wear, the diagnosis was considered correct.
The detailed descriptions of the fault types in Table 1 are shown in Table 2.

4.2. Diagnosis Results

After the vibration signal was segmented, the accuracy of the SVM model training and optimization was 97.19%, which was higher than when it was not segmented (92.28%). A total of 270 training samples and 186 extended samples, as well as the trained model and the c and g parameters after optimization, were used for fault diagnosis by the SVM; the diagnosis results are shown in Table 3. In the table, error means that a normal sample was diagnosed as a fault, mistake means that a fault was diagnosed as another fault, and miss means that a faulty sample was diagnosed as normal. It should be noted that if the sample of spring fatigue and contact wear was diagnosed as major spring fatigue or contact wear, the diagnosis result was considered correct.
In Table 3, when vibration singles were not segmented, the 2 errors were diagnosed as contact wear, the 3 misses were faults related to contact wear, 3 out of 21 mistakes were wrong judgments of other faults as contact wear, and 15 were wrong judgments of faults related to contact wear as other faults.
Table 3 shows that the accuracy of fault diagnosis increased from 94.30% in nonsegmented preprocessing to 98.46% in segmented preprocessing. The increase was greater, especially for contact wear faults.

5. Conclusions

The vibration signal of the OLTC consisted of a series of sharp vibration bursts, and its fault feature during certain periods was easily missed. This study considered that preprocessing the vibration signal of the OLTC in segments could effectively solve this problem. This study explored the necessity of a segmented preprocessing method. The main conclusions are as follows:
  • The vibration signal of the OLTC was divided into the starting segment, energy storage segment, switching segment, and stopping segment. The signals of the starting segment and the stopping segment were very random and generally not used for analysis;
  • Whether from time domain analysis or frequency spectrum analysis, the difference between the energy storage segment and the switching segment of the vibration signals of the OLTC was obvious. Nonsegmented processing resulted in missing frequency characteristics for the switching segment. Hence, it was necessary to preprocess the vibration signal of the OLTC in segments;
  • The segmented preprocessing method for the vibration signals of the OLTC was presented. The method was simple, practical, and highly accurate;
  • The main mechanical faults of the OLTC were simulated, the vibration signals were collected, and OLTC fault diagnosis experiments were conducted. The experimental results showed that the accuracy of the fault diagnosis increased from 94.30% in the nonsegmented preprocessing to 98.46% in the segmented preprocessing. The increase was greater, especially for contact wear faults. The method was successfully applied to the actual project.
The segment points were fuzzy and not precise enough due to the limitation of the waveform. However, this had little effect on feature extraction. In addition, theoretical verification was carried out in the laboratory, and it was impossible to simulate the impact of the actual working environment on the analysis results. This aspect requires further research.

Author Contributions

Conceptualization, R.S., C.P., and R.F.; writing–original draft preparation, C.P.; discussion and analysis of this paper, organization of the paper and polishing of the writing, R.S. and C.P.; review and supervision, R.F. All authors have read and agreed to the published version of the manuscript.

Funding

This research was funded by the Industry University Research Project of Xiamen, grant numbers 3502Z20203036 and 3502Z20193032.

Conflicts of Interest

The authors declare no conflict of interest.

References

  1. Yang, R.; Zhang, D.; Li, Z.; Yang, K.; Mo, S.; Li, L. Mechanical fault diagnostics of power transformer on-load tap changers using dynamic time warping. IEEE Trans. Instrum. Meas. 2019, 68, 3119–3127. [Google Scholar] [CrossRef]
  2. Riaz, F.; Wetzer, J.A.; Mor, R. Innovative approach toward an algorithm for automated defect recognition for on-load-tap changers. CIRED Open Access Proc. J. 2017, 2017, 246–250. [Google Scholar] [CrossRef] [Green Version]
  3. Kang, P.J.; Birtwhistle, D. Condition monitoring of power transformer on-load tap-changers Part I: Automatic Condition diagnostic. Proc. Inst. Elect. Eng. Gener. Transmiss. Distrib. 2001, 148, 301–306. [Google Scholar] [CrossRef]
  4. Zhou, X.; Wang, F.H.; Fu, J.; Lin, J.; Jin, Z. Mechanical condition monitoring of on-load tap changers based on chaos theory and K-means clustering method. Proc. CSEE 2015, 35, 1541–1548. [Google Scholar]
  5. Yang, Q.; Ruan, J.; Zhuang, Z.; Huang, D. Condition evaluation for opening damper of spring operated high-voltage circuit breaker using vibration time-frequency image. IEEE Sens. J. 2019, 19, 8116–8126. [Google Scholar] [CrossRef]
  6. Seo, J.; Ma, H.; Saha, T.K. A joint vibration and arcing measurement system for online condition monitoring of on-load tap changer of the power transformer. IEEE Trans. Power Deliv. 2017, 32, 1031–1038. [Google Scholar] [CrossRef]
  7. Yang, Q.; Ruan, J.; Zhuang, Z. Fault diagnosis of circuit breakers based on time–frequency and chaotic vibration analysis. IET Gener. Transm. Distrib. 2020, 14, 1214–1221. [Google Scholar] [CrossRef]
  8. Wang, C.L.; Li, K.; Ma, H.Z.; Wang, A.Q. Feature recognition of OLTC vibration signal based on WP_SVD denoising method. Proc. CSU-EPSA 2012, 24, 36–41. [Google Scholar]
  9. Lu, L.; Cui, Y.H. Diagnosis of transformer tap changer contact fault based on vibration signal. Electr. Power Autom. Equip. 2012, 32, 93–97. [Google Scholar]
  10. Duan, X.; Zhao, T.; Li, T.; Liu, J.; Zou, L.; Zhang, L. Method for diagnosis of on-load tap changer based on wavelet theory and support vector machine. J. Eng. 2017, 2017, 2193–2197. [Google Scholar] [CrossRef]
  11. Gao, S.; Zhou, C.; Zhang, Z.; Geng, J.; He, R.; Yin, Q.; Xing, C. Mechanical fault diagnosis of an on-load tap changer by applying cuckoo search algorithm-based fuzzy weighted least squares support vector machine. Math. Probl. Eng. 2020. [Google Scholar] [CrossRef]
  12. Gao, S.G.; Yue, G.L.; Zhou, C.; Geng, J.H.; Xing, C.; Ding, Y.; Meng, L.H. Applying Hilbert-Huang transform of the Volterra model to diagnosing mechanical fault for on-load tap changer. High Volt. Appar. 2020, 56, 173–180. [Google Scholar]
  13. Duan, R.C.; Wang, F.H. Fault diagnosis of on-load tap-changer in converter transformer based on time–frequency vibration analysis. IEEE Trans. Ind. Electron. 2016, 63, 3815–3823. [Google Scholar] [CrossRef]
  14. Duan, R.C.; Wang, F.H.; Zhou, L.D. Mechanical condition detection of on-load tap-changer in converter transformer based on narrowband noise assisted multivariate empirical mode decomposition algorithm. Trans. China Electrotech. Soc. 2017, 32, 182–189. [Google Scholar]
  15. Duan, R.C.; Wang, F.H.; Zhou, L.D. Mechanical features extraction of on-load tap-changer in converter transformer based on optimized HHT algorithm and Lorentz information measure. Proc. CSEE 2016, 36, 3101–3109. [Google Scholar]
  16. Xu, Y.; Zhou, C.; Geng, J.; Gao, S.; Wang, P. A method for diagnosing mechanical faults of on-load tap changer based on ensemble empirical mode decomposition, Volterra model and decision acyclic graph support vector machine. IEEE Access 2019, 7, 84803–84816. [Google Scholar] [CrossRef]
  17. Liu, J.; Wang, G.; Zhao, T.; Zhang, L. Fault diagnosis of on-load tap-changer based on variational mode decomposition and relevance vector machine. Energies 2017, 10, 946. [Google Scholar] [CrossRef] [Green Version]
  18. Li, Q.M.; Zhao, T.; Zhang, L.; Lou, J. Mechanical fault diagnostics of on-load tap changer within power transformers based on hidden Markov model. IEEE Trans. Power Deliv. 2012, 27, 596–601. [Google Scholar] [CrossRef]
  19. Wang, F.H.; Zeng, Q.H.; Zheng, Y.M.; Qian, Y. A mechanical fault diagnosis of on-load tap-changers based on phase space fusion of Bayes estimation and CM-SVDD. Proc. CSEE 2020, 40, 358–368. [Google Scholar]
  20. Zeng, Q.H.; Wang, F.H.; Zheng, Y.M.; He, W.L. Fault recognition of on-load tap-changer in power transformer based on convolutional neural network. Autom. Electr. Power Syst. 2020, 44, 144–151. [Google Scholar]
  21. Wang, G.; Liu, J.; Zhao, T.; Zhang, L. Mechanical Condition Monitoring of On-load Tap Changers Based on Improved Variational Mode Decomposition. J. Hunan Univ. (Nat. Sci.) 2017, 44, 75–83. [Google Scholar]
  22. Zhang, Z.X.; Chen, W.G.; Tang, S.R.; Wang, Y.Y.; Wan, F. State feature extraction and anomaly diagnosis of on-load tap-changer based on complementary ensemble empirical mode decomposition and local outlier factor. Trans. China Electrotech. Soc. 2019, 34, 4508–4518. [Google Scholar]
  23. Zhang, Z.X.; Gao, T.Y.; Lei, J.L. Vibration signal preprocessing method of OLTC for converter transformer. Electr. Power Eng. Technol. 2020, 39, 120–125. [Google Scholar]
  24. Zhang, Z.X. Research on Vibration Signal Analysis and State Diagnosis Method of Transformer On-Load Tap Changer. Ph.D. Thesis, Chongqing University, Chongqing, China, 2019. [Google Scholar]
  25. Seshadrinath, J.; Singh, B.; Panigrahi, B.K. Vibration analysis based interturn fault diagnosis in induction machines. IEEE Trans. Ind. Inf. 2014, 10, 340–350. [Google Scholar] [CrossRef]
  26. Zheng, J.; He, T.T.; Guo, J.; Huang, H.; Chen, X.X. Adaptive separation of vibration signal of on-load tap changer based on independent component analysis and endpoint detection. Power Syst. Technol. 2010, 34, 208–213. [Google Scholar]
  27. Zhao, M.; Xu, G. Feature extraction of power transformer vibration signals based on empirical wavelet transform and multiscale entropy. IET Sci. Meas. Technol. 2018, 12, 63–71. [Google Scholar] [CrossRef]
  28. Rivas, E.; Burgos, J.C.; García-Prada, J.C. Vibration analysis using envelope wavelet for detecting faults in the OLTC tap selector. IEEE Trans. Power Deliv. 2010, 25, 1629–1636. [Google Scholar] [CrossRef]
  29. Xu, Y.; Chen, B.B.; Ma, H.Z.; Xu, H.H.; Wang, L. Vibration signal feature extraction method of the on-load tap changer based on EMD-PSD. J. Electr. Power Sci. Technol. 2020, 35, 3–10. [Google Scholar]
  30. Castro, J.C.; Lagos, G.S.; Gonzalez, O.A. Simulation and measuring transients in on-load tap changers. IEEE. Lat. Am. Trans. 2017, 15, 1901–1907. [Google Scholar] [CrossRef]
  31. Chen, M.; Ma, H.Z.; Xu, Y. Design of monitoring system for on-load tap changer of transformer based on data acquisition card. Transformer 2019, 56, 30–34. [Google Scholar]
  32. Fan, J.H.; Wang, W.G.; Wang, F.H.; Qian, Y. Vibration characteristic analysis of vacuum interrupter on-load tap-changer. Power Syst. Technol. 2019, 43, 4425–4432. [Google Scholar]
  33. Wang, K.M.; Shu, H.C.; Cao, L.P.; Dong, J.; Su, Y.G. Study of OLTC running state evaluation method based on correlation analysis. Power Syst. Prot. Control 2015, 43, 54–59. [Google Scholar]
  34. Chen, M.; Ma, H.Z.; Xu, Y.; Pan, X.C.; Chen, B.B. Mechanical fault diagnosis of on-load tap changer based on empirical mode decomposition algorithm for improved mask signal. Smart Power 2019, 47, 88–94. [Google Scholar]
  35. Liu, Z.Y.; Chen, H.J.; Yu, X.J.; Xia, X.Q. Research progress and prospects on fault diagnosis method for transformer on-load tap. High Volt. Appar. 2019, 55, 18–25, 33. [Google Scholar]
  36. Fang, Y.H. Brief analysis of on-load tap changer faults in transformer. Transformer 2011, 48, 62–65. [Google Scholar]
Figure 1. Installation location of the vibration acceleration sensors.
Electronics 10 00131 g001
Figure 2. Measured waveform of the vibration signal during the normal action of the OLTC.
Electronics 10 00131 g002
Figure 3. Waveforms of vibration signals at different measuring points.
Electronics 10 00131 g003
Figure 4. Measured waveform expansion of the vibration signal during the normal action of the on-load tap changer (OLTC).
Electronics 10 00131 g004
Figure 5. Vibration signal spectrum of the OLTC.
Electronics 10 00131 g005
Figure 6. Process of computer segmentation of the signal.
Electronics 10 00131 g006
Table 1. Established samples.
Fault CodeFault TypeNumber of Continuous SamplesNumber of Supplementary SamplesNumber of Training SamplesNumber of Extended Samples
0Normal (1)280208
Normal (2)280208
Normal (3)2862014
1Contact wear (1)280208
Contact wear (2)28162024
NASpring fatigue and contact wear284032
2Curved plate falling off280208
3Curved plate loosening280208
4Jamming (1)120102
Jamming (2)28102018
5Abnormal switching280208
6Contact loosening280208
7Contact falling off280208
8Main spring fatigue (1)280208
Main spring fatigue (2)28162024
Total40452270186
Table 2. Descriptions of fault types.
Fault TypeDescription
Normal (1)No fault. Data were obtained on different dates. The OLTC was detachable; therefore, the data might be different.
Normal (2)
Normal (3)
Contact wear (1)The surface of a group of four moving and static transition contacts were artificially roughened to simulate the fault that the contacts were burned by the arc.
Contact wear (2)The surface of 16 A-phase moving contacts were artificially roughened to simulate the fault that the contacts were burned by the arc.
Spring fatigue and contact wearThe main spring was shortened by two turns, and the surface of the 16 A-phase moving contacts was artificially roughened.
Curved plate falling offThe entire curved plate of phase A was removed.
Curved plate looseningThe screws of the A-phase curved plate were loosened.
Jamming (1)Sawdust was added to the gearbox. Jamming (1) and Jamming (2) were different in the position and quantity of sawdust.
Jamming (2)
Abnormal switchingThe position of the switch was adjusted so that it was offset by a certain angle.
Contact looseningThe pressure spring of the selector switch contact was cut off for one turn.
Contact falling offOne set of three selector switch contacts was removed.
Main spring fatigue (1)The main spring was shortened by four turns.
Main spring fatigue (2)The main spring was shortened by two turns.
Table 3. Diagnosis results.
Fault TypeTotal Number of SamplesSegmentedNonsegmented
ErrorMissMistakeErrorMissMistake
Normal901//2//
Contact wear72/ 3/ 3
Curved plate falling off28/ /
Curved plate loosening28/ / 1
Jamming50/ /
Abnormal switching28/ /
Contact loosening28/ 1/ 2
Contact falling off28/ /
Main spring fatigue72/1 / 3
Spring fatigue and contact wear32/1 /312
Total4561242321
Correct rate98.46%94.30%
Publisher’s Note: MDPI stays neutral with regard to jurisdictional claims in published maps and institutional affiliations.

