Article

An Optimization Model for Energy Community Costs Minimization Considering a Local Electricity Market between Prosumers and Electric Vehicles

1
Research Group on Intelligent Engineering and Computing for Advanced Innovation and Development (GECAD), Polytechnic of Porto (ISEP/IPP), Rua António Bernardino de Almeida, 431, 4200-072 Porto, Portugal
2
Polytechnic of Porto, Rua António Bernardino de Almeida, 431, 4200-072 Porto, Portugal
3
BISITE Research Group, Edificio Multiusos I+D+i, University of Salamanca, 37007 Salamanca, Spain
4
Air Institute, IoT Digital Innovation Hub, 37188 Salamanca, Spain
5
Department of Electronics, Information and Communication, Faculty of Engineering, Osaka Institute of Technology, Osaka 535-8585, Japan
*
Author to whom correspondence should be addressed.
Electronics 2021, 10(2), 129; https://doi.org/10.3390/electronics10020129
Submission received: 9 December 2020 / Revised: 30 December 2020 / Accepted: 5 January 2021 / Published: 9 January 2021
(This article belongs to the Special Issue Electric Vehicles Integration and Control in Smart Grids)

Abstract

:
Electric vehicles have emerged as one of the most promising technologies, and their mass introduction may pose threats to the electricity grid. Several solutions have been proposed in an attempt to overcome this challenge in order to ease the integration of electric vehicles. A promising concept that can contribute to the proliferation of electric vehicles is the local electricity market. In this way, consumers and prosumers may transact electricity between peers at the local community level, reducing congestion, energy costs and the necessity of intermediary players such as retailers. Thus, this paper proposes an optimization model that simulates an electric energy market between prosumers and electric vehicles. An energy community with different types of prosumers is considered (household, commercial and industrial), and each of them is equipped with a photovoltaic panel and a battery system. This market is considered local because it takes place within a distribution grid and a local energy community. A mixed-integer linear programming model is proposed to solve the local energy transaction problem. The results suggest that our approach can provide a reduction between 1.6% to 3.5% in community energy costs.

1. Introduction

The transportation sector in Europe contributes to one-quarter of the global greenhouse gas (GHG) emissions [1]. Considering the targets of the European Union (EU) presented in the Transport White Paper [2], the GHG emissions need to decrease around two-thirds by 2050 compared with the 1990 levels. In fact, due to improvements made to reduce GHG in recent years, the transportation sector has not received a lot of attention [3]. The electrification of road transportation is considered to be a promising solution to reduce the GHG by the International Energy Agency [4]. The integration of electric vehicles (EVs) with renewable electricity generation brings some advantages to reduce the GHG emissions from road transportation [5]. New challenges to distribution networks arise with the penetration of EV and renewable energy sources (RES). Indeed, distribution networks have not been projected to hold a great number of intermittent RES and uncontrolled EV charging [6]. EV is an extra load connected to the house but can contribute to the overall energy balance and help to reduce operation costs [7]. Demand-side management (DSM) enables EV smart charging, making it possible to move the load without violating the user’s preferences, e.g., having a 100% charged battery at departure time [8]. The interaction of EVs loads in DSM is now a popular approach that can be found in the literature [9]. The popularization of EVs has been possible not only because they allow the reduction of GHGs but also because the cost of batteries has drastically reduced [10], thus causing a reduction in the costs of acquiring EVs. Electric storage units (including EVs) will need to be intelligently installed and distributed in the system in order to ensure maximum utilization and capital savings [11].
Local electricity markets (LEMs) [12] appear as a solution to the recent trends of the European Commission (EC) [13] toward putting the electricity end-users in the center of the power system [14]. Some of the LEM approaches developed appear to provide services to the network operator. The authors of [14] presented a simulation where the household prosumers provided flexibility to the distributed system operator (DSO), and the quantity and price for flexibility were determined considering an auction approach. The research work developed by the authors of [15] used the transactive energy (TE) concept [16]. In this work, EVs were included in an aggregated way to provides services to DSO to reduce the system peak load. Another application with EVs to offers services for the network operator was presented by the authors of [17], who proposed the charging management of EVs to reduce the photovoltaic (PV) curtailment. Also, Peer-to-Peer (P2P) models have been proposed as another promising model for transacting electricity in LEM [18].
Based on the analysis carried out based on the aforementioned papers, there is a lack of approaches that have studied and simulated the interaction of EVs and prosumers in the LEM context. The authors of [9] included the interaction of prosumers with EVs when they are in their own home, but they did not address the electricity business between other peers. The authors of [17] addressed the charging coordination for EVs but the possibility of negotiating local electricity was not considered. The authors of [18] showed a local market for electricity in a P2P model but did not include EVs.
In order to overcome the literature gap, this paper contributes a prosumer-to-vehicle (P2V) market where the prosumers can sell their excess electricity to the EVs. The P2V market enables the electricity transaction between prosumers and EVs. In this proposed market, the sellers profit from selling at higher prices in the P2V (compared to selling to the network) and the consumers profit from buying at lower prices (compared to retailers’ prices). The proposed model contributes to the integration of RES into the system and the empowerment of electricity end-users, namely by allowing prosumers and EVs to have an active role in the peer electricity transactions. The case study is elaborated with three different types of prosumers (households, commercial and industrial) and EV models with real characteristics. All prosumers have installed a PV-battery system, which provides the possibility of generating and storing energy Furthermore, real electricity tariffs from a Portuguese electricity retailer are used in the case study. Figure 1 presents the bock diagram for the analyzed problem using the generation and load forecast, prosumers and EV characteristics and electricity prices as inputs. The optimization starts with reading the data and finishes when the results are available. In the middle block, the problem is solved. In output block, we obtain the prosumers and EV transactions.
The major contributions of this work are outlined as follows:
  • An optimization model that determines the best electricity transactions between prosumers and EVs in a local energy community.
  • The implementation of a new P2V market where the EVs can buy electricity at the cheapest prices compared to tariff available on retailers.
  • The possibility of prosumers to sell the excess RES generation to EVs in a more profitable way.
  • The model includes realistic constraints, prosumers load and generation profiles, PV systems, energy storage systems, EVs and market transactions constraints.
The paper is structured in five sections. In Section 1, the topics are introduced and the gaps in literature are identified. Section 2 presents the proposed formulation where a mathematical model is presented in order to model the problem. Section 3 presents the case study elaborated to test and validate the proposed formulation. Section 4 presents the results of the case study. Finally, in Section 5, the conclusions are presented and future work is proposed.

2. Proposed Formulation

In this section, the mathematical formulation used to obtain the energy costs minimization of the community with EVs is fully presented. The presented model is a mixed-integer linear programming model. Equation (1) presents the objective function of the problem.
minimize : i = 1 N i P r o i C o s t s + j = 1 N j E V j C o s t s
where P r o i C o s t s represents the costs of prosumers; E V j C o s t s represent the costs of electric vehicles, with prosumer i and electric vehicle j ; N i is the total number of prosumers; and N j is the total number of electric vehicles. Equation (2) represents the calculation of the costs for prosumer i , namely P r o i C o s t s .
P r o i C o s t s = t = 1 N t ( P i , t b u y × ϕ i , t b u y P i , t s e l l × ϕ i , t s e l l ( j = 1 N j P i , j , t P 2 V   t r a n s a c t × ϕ i , j , t P 2 V   s e l l ) ) × Δ t + F i x C o s t i i N i
where P i , t b u y represents the amount of prosumers electricity purchase from the retailer, ϕ i , t b u y is the retail price of electricity, P i , t s e l l represents the amount of prosumers electricity sale to the grid, ϕ i , t s e l l   is the price of electricity export to the grid, P i , j , t P 2 V   t r a n s a c t is the amount of electricity transacted between prosumer i and EV j , ϕ i , j , t P 2 V is the price of electricity transaction between prosumer i and EV j and Δ t is the period factor adjustment. Normally, the tariff provided by retailers is available in EUR/kWh (EUR per kilowatt-hour) and the optimization can be scheduled at different period intervals (15 min). F i x C o s t i is the fixed costs of each prosumer associated with the power contract. Equation (3) represents the calculation of the costs for EV j , namely E V j C o s t s .
E V j C o s t s = t = 1 N t ( P j , t b u y × ϕ j , t E V   b u y + ( i = 1 N i P i , j , t P 2 V   t r a n s a c t × ϕ i , j , t P 2 V ) ) × Δ t + F i x C o s t j , j N j
where P j , t b u y represents the EV electricity purchase from the retailer, ϕ j , t E V   b u y is the retail price to charge EV from the grid and F i x C o s t j is the fixed costs of EV associated with the power contract. Equation (4) represents the electricity balance for each prosumer.
  P i , t g e n + P i , t b u y + P i , t d c h = P i , t l o a d +   P i , t s e l l + j = 1 N j P i , j , t P 2 V   t r a n s a c t e d + P i , t c h + j = 1 N j P i , j , t c h   E V   h o m e , i N i , t N t
where P i , t g e n represents the electricity generated, P i , t d c h is the energy battery discharge, P i , t l o a d represents the load of each prosumer, P i , t c h represents the electricity battery charge and P i , j , t c h   E V   h o m e represents the electricity charged by EV from the house. In this model, we consider that prosumers have EV and, when they are at home, they must participate in the prosumers’ energy balance. Equations (5)–(7) represents the limits for prosumers’ transactions.
P i , t b u y P i , t max b u y × B i n i , t b u y , i N i , t N t
P i , t s e l l P i , t m a x   s e l l × B i n i , t s e l l , i N i , t N t  
j = 1 N j P i , j , t P 2 V   t r a n s a c t e d P i , t m a x   P 2 V × j = 1 N j B i n i , j , t P 2 V   t r a n s a c t e d , i N i , t N t  
where P i , t max b u y represents the maximum power that prosumer can buy from the grid, B i n i , t b u y is a binary variable associated the purchase, P i , t m a x   s e l l is the limit of electricity export to the grid, B i n i , t s e l l represents a binary variable associated to the electricity export to the grid, P i , t m a x   P 2 V corresponds to the maximum limit electricity sale to the EV and B i n i , j , t P 2 V   t r a n s a c t e d represents the binary variable associated with this transaction. Equation (8) indicates that each prosumer has the possibility to sell energy to one EV at a time. Equations (9) and (10) presents the prosumers restrictions to buy and sell electricity.
j = 1 N j B i n i , j , t P 2 V   t r a n s a c t e d 1 , i N i , t N t
B i n i , t b u y + B i n i , t s e l l 1 , i N i , t N t
B i n i , t b u y + j = 1 N j B i n i , j , t P 2 V   t r a n s a c t e d 1 , i N i , t N t
Equation (9) controls if the prosumer is buying or selling energy at a time, and Equation (10) limits prosumer electricity purchase to the retailer with a concurrent P2V transaction. Equations (11) and (12) correspond to the prosumers battery maximum charge rate and discharge rate, respectively, while constraint (13) controls the maximum charge rate of EV charging.
P i , t c h P i , t m a x   c h × B i n i , t c h ,   i N i , t N t
P i , t d c h P i , t m a x   d c h × B i n i , t d c h , i N i , t N t
i = 1 N i P i , j , t c h   E V   h o m e P j , t E V   m a x   c h × B i n j , t c h   E V   h o m e × X j , t c h   E V   h o m e , i N i , t N t
where P i , t m a x   c h represents the maximum power for prosumer battery charge, B i n i , t c h is a binary variable for the prosumer battery that represents the charge action when it is equal to 1, P i , t m a x   d c h represents the maximum power for the prosumer battery discharge, B i n i , t d c h is a binary variable that represents the discharge action when it is equal to 1, P j , t E V   m a x   c h represents the maximum power of EV battery charge located at prosumer i , B i n j , t c h   E V   h o m e is a binary variable for EV battery that represents the charge action when it is equal to 1 and X j , t c h   E V   h o m e is an input parameter that indicates if the EV is at home (1) or not (0). Equation (14) is a constraint applied to prosumers’ batteries, which limits the simultaneous charge and discharge of prosumers’ batteries.
B i n i , t c h + B i n i , t c h 1
Equations (15) and (16) represent the energy balance for the prosumers’ batteries.
E i , 1 B a t = E i B a t   i n i t + P i , 1 c h × η i c h P i , 1 d c h × 1 η i d c h , i N i
E i , t B a t = E i , t 1 B a t + P i , t c h × η i c h P i , t d c h × 1 η i d c h , i N i , t [ 2 , N t ]
where E i , t B a t represents the state of charge of the battery, E i B a t   i n i t is the initial level of the battery,   η i c h is the efficiency of battery charge and η i d c h is the efficiency of battery discharge. Equation (15) is applied only for the first period ( t = 1 ) and Equation (16) is applied to other periods. Equations (17)–(24) represent the limits for the continuous variables associated to the prosumers’ operation and (25)–(30) is the limits for the binary variables associated to the prosumers’ operation.
0 P i , t b u y P i , t m a x   b u y ,   i N i , t N t
0 P i , t s e l l P i , t m a x   s e l l ,   i N i , t N t
0 P i , t d c h P i , t m a x   d c h , i N i , t N t
0 P i , t c h P i , t m a x   c h ,   i N i , t N t
0 E i , t B a t E i , t m a x   B a t , i N i , t N t
0 P i , j , t c h   E V   h o m e P j , t E V   m a x   c h   , i N i , t N t
0 P i , j , t P 2 V P i , j , t m a x   P 2 V   , i N i , j N j , t N t
0 P i , t s e l l P i , t m a x   s e l l ,   i N i , t N t
0 B i n i , t b u y   G r i d 1 , i N i , t N t
0 B i n i , t s e l l   G r i d 1 , i N i , t N t
0 B i n t , i d c h 1 , i N i , t N t
0 B i n t , i c h 1 , i N i , t N t
0 B i n i , j , t P 2 V   t r a n s a c t e d 1 , i N i , j N j , t N t
0 B i n j , t c h   E V   h o m e 1 , i N i , t N t
where E i , t m a x   B a t represents the maximum capacity of the prosumers’ battery.
Equation (31) presents the energy balance for the EVs.
P j , t E V   b u y + i = 1 N i P i , j , t P 2 V   t r a n s a c t e d + i = 1 N i P i , j , t c h   E V   h o m e = P j , t E V   c h ,   j N j , t N t
where P j , t E V   b u y represents the electricity purchase by each EV to the retailer and P j , t E V   c h represents the electricity charged by each EV.
E j , 1 E V   B a t = E j E V   B a t   i n i t + P j , 1 E V   c h × η j E V   c h P j , 1 E V   M o v e , j N j
E j , t E V   B a t = E j , t 1 E V   B a t + P j , 1 E V   c h × η j E V   c h P j , t E V   M o v e , j N j , t [ 2 , N t ]
where E j , t E V   B a t represents the energy state of the EV battery, E j E V   B a t   i n i t represents the initial level of the EV battery, η j E V   c h corresponds to the efficiency of EV battery charge and P j , t E V   M o v e corresponds to the electricity consumption of EV during trips. Equations (34) and (35) are applied to limit the EV purchase of electricity to the retailer and P2V transactions with prosumers, respectively.
P j , t E V   b u y   P j , t E V   m a x   b u y × B i n j , t E V   b u y × ( 1 X j , t c h   E V   h o m e ) × X j , t E V   M o v e , j N j , t N t
i = 1 N i P i , j , t P 2 V   t r a n s a c t e d   P j , t E V   m a x   b u y × i = 1 N i B i n i , j , t P 2 V   t r a n s a c t e d × ( 1 X j , t c h   E V   h o m e ) × X j , t E V   M o v e , j N j , t N t
where P j , t E V   m a x   b u y is the maximum limit for EV electricity purchase to the retailer, B i n j , t E V   b u y is a binary variable to active the transaction of electricity between EV and retailer and X j , t E V   M o v e gives the indication if the EV is travelling (0) or it is available to charge (1). Equations (36) and (37) are applied to limit the transactions of electricity by EV when they are charging at home.
B i n j , t E V   b u y + B i n j , t c h   E V   h o m e 1 , j N j , t N t
i = 1 N i B i n i , j , t P 2 V   t r a n s a c t e d + B i n j , t c h   E V   h o m e 1 , j N j , t N t
i = 1 N i B i n i , j , t P 2 V   t r a n s a c t e d 1 , j N j , t N t
Equation (38) imposes that each EV has the possibility to buy electricity from only one prosumer. Equations (39)–(42) represent the limits of continuous variables for the EV operation. From Equation (43) to Equation (44), the limits for the binary variables of EV operation are represented.
0 P j , t E V   b u y P j , t E V   m a x   b u y ,   j N j , t N t
0 P j , t E V   c h P j , t E V   m a x   c h ,   j N j , t N t
E j , t E V   m i n   B a t E j , t E V   B a t E j , t E V   m a x   B a t , j N j , t N t
0   P j , t E V   c h P j , t E V max c h   , j N j , t N t
0 B i n j , t E V   b u y 1 , j N j , t N t
0 B i n j , t c h   E V   h o m e 1 , j N j , t N t
where E j , t E V   m i n   B a t represents the minimum value for the EV battery and E j , t E V   m a x   B a t represents the maximum value for the EV battery capacity. Equations (45) and (46) present the price calculation for the P2V electricity transaction. The P2V transaction price is the mean between the minimum retail price of each EV and the export grid price (e.g., feed-in tariff, sport market) of each prosumer.
ϕ i , j , t P 2 V   s e l l = ( α j + ϕ i , t s e l l ) 2 , i N i , j N j , t N t
α j = min ( ϕ j , t E V   b u y ) , j N j
where α j represents the minimum retail price for each EV. Equation (45) calculates the price for the P2V transaction.

3. Case Study

In this section, the specifications of the case study are presented to validate the proposed optimization model of Section 2. A local community with 6 households, 1 industry, 8 business stores and 20 EVs was considered in the presented study. Each prosumer and EV had a contract with the retailer with a bihourly or trihourly electricity buy tariff. The contract with the retailer established the contract power limit, including the fixed cost that each prosumer and EV needs to pay. As mentioned in Section 2, a P2V market was proposed in which the prosumers and EVs could transact electricity between them. Prosumers could sell electricity to the EV and the EV could buy electricity from prosumers. Table 1 presents the characteristics of the batteries installed in the prosumers as well as EVs used in the case study.
Table 1 presents three different models for stationary batteries and seven models for EVs. In the EV characteristics, the discharge rate is not presented because V2G was not considered. A total of 16 storage units was available within all prosumers. The industrial prosumer had installed two units of the Sonnen 9.43 model with a total capacity of 30 kWh. In total, the prosumers installed 228.5 kWh of storage capacity. As we mentioned before, 20 EV were used in the simulations, and the 7 models presented in Table 1 were randomly distributed within the available models. Tesla Model 3 Sta. Range + was the model more frequent among users. Making an analogy with prosumers battery systems, the total capacity of EV battery was 958.3 kWh. Three household prosumers had an EV, and if the EV was charging at home, it was required to charge its battery with the electricity provided from the house (variable P i , j , t c h   E V of Equation (4)).
Figure 1 presents the profiles used in the case study. Figure 2a–c is obtained considering the mean value of each variable (load and generation) with the group of prosumers.
Figure 2a presents the mean value of load and generation of the household prosumers. Among the household prosumers, a maximum peak of 6.07 kW was registered, while the mean power consumption was 1.2 kW. Over a single day, the total energy consumption on average per household was 28.9 kWh. All household prosumers consumed 173.40 kWh (not considering PV generation). The commercial prosumers (Figure 2b) presented a maximum peak consumption of 4.75 kW and mean power consumption of 0.98 kW. The average commercial prosumer energy consumption was 23.65 kWh and the total consumption in this group was 189.20 kWh. Considering the industrial prosumer (Figure 2c), a maximum peak power consumption of 10.28 kW was verified. The average power consumption was 5.82 kW, while the total energy consumption was 136.60 kWh. Figure 2d presents the movement of EV, where the blue line indicates the total number of EV in movement. The EVs movement scenario was created with the tool presented by the authors of [19]. Between 8 and 9 more EV movements were verified, and 18 were moving. A total of 185.26 kWh was consumed by EVs, and each one had a mean consumption of 9.21 kWh. With the analysis of Figure 2d, it is possible to state that most trips were made between 6.15 h and 10.15 h, which corresponds to the movements of people to the workplace. Between 11.30 h and 14.45 h, the EVs were moving, which corresponds to the lunchtime. The periods when the people return home from the workplace are visible in the figure, which corresponds to the movements between 17.45 h and 21.30 h.
Considering the generation profiles, the prosumers installed PV systems to generate their own electricity. A total of 18.97 (households), 10.35 (industrial) and 21.85 (commercial) kWp were installed in each group of prosumers. Considering the total of each period, households prosumers generated 106.1 kWh, commercial prosumers generated 127.37 kWh and industrial prosumer generated 61.6 kWh in the PV systems.
Figure 3 presents the electricity prices used as input parameters. The retail electricity prices are based on real values provided by an EDP retailer that operates in Portugal. The value for the grid export price was obtained considering the Portuguese legislation. For the market spot price, the values of the electricity market in MIBEL were considered.
As can be seen by Figure 3, two different types of tariff were used for households and business. Within the business tariffs, two variants were available, namely the bihourly with two different prices and trihourly with three different prices. For households, only a bihourly option was used. In Figure 3, the mean values are depicted (for the bihourly and trihourly tariff). The tariffs slightly changed and varied depending on the contracted power level for each prosumer. For the grid export price, a linear tariff was applied, namely 0.095 EUR/kWh, and for the spot price, 0.050 EUR/kWh (average of MIBEL Setepmber 2020). Table 2 presents the input parameters used in the optimization model. Most of the parameters have a range, e.g., the retail price for prosumers. In this case, the prices could take the minimum value of 0.094 EUR/kWh to a maximum of 0.294 EUR/kWh depending on the contracted tariff and the period of the day.
The maximum retail power limit for the prosumers and EVs was a parameter specified in the contract established between users (prosumers and EVs) and retailers. This parameter corresponded to the contracted power. The case study adopted the following contracted power levels: 4.6 kVA, 5.75 kVA, 6.9 kVA, 10.35 kVA, 13.8 kVA and 20.7 kVA, which specifies the maximum power limit admissible to obtain electricity from the supplier. The users were free to choose the contracted power, but higher contracted power also translated to higher fixed costs.

4. Results

In this section, the results of the proposed methodology applied to the case study are presented. The simulations were performed on a computer with Intel Xeon(R) [email protected] GHz processor with 16 GB of RAM running Windows 10. To emulate the optimization problem, a MATLAB2018a with TOMLAB optimization addon was used. The CPLEX solver was used to optimize the proposed model. Six different scenarios were implemented and compared. The scenarios were constructed considering the possibility of P2V market and the export price (feed-in, spot market, or unremunerated). The set of scenarios are:
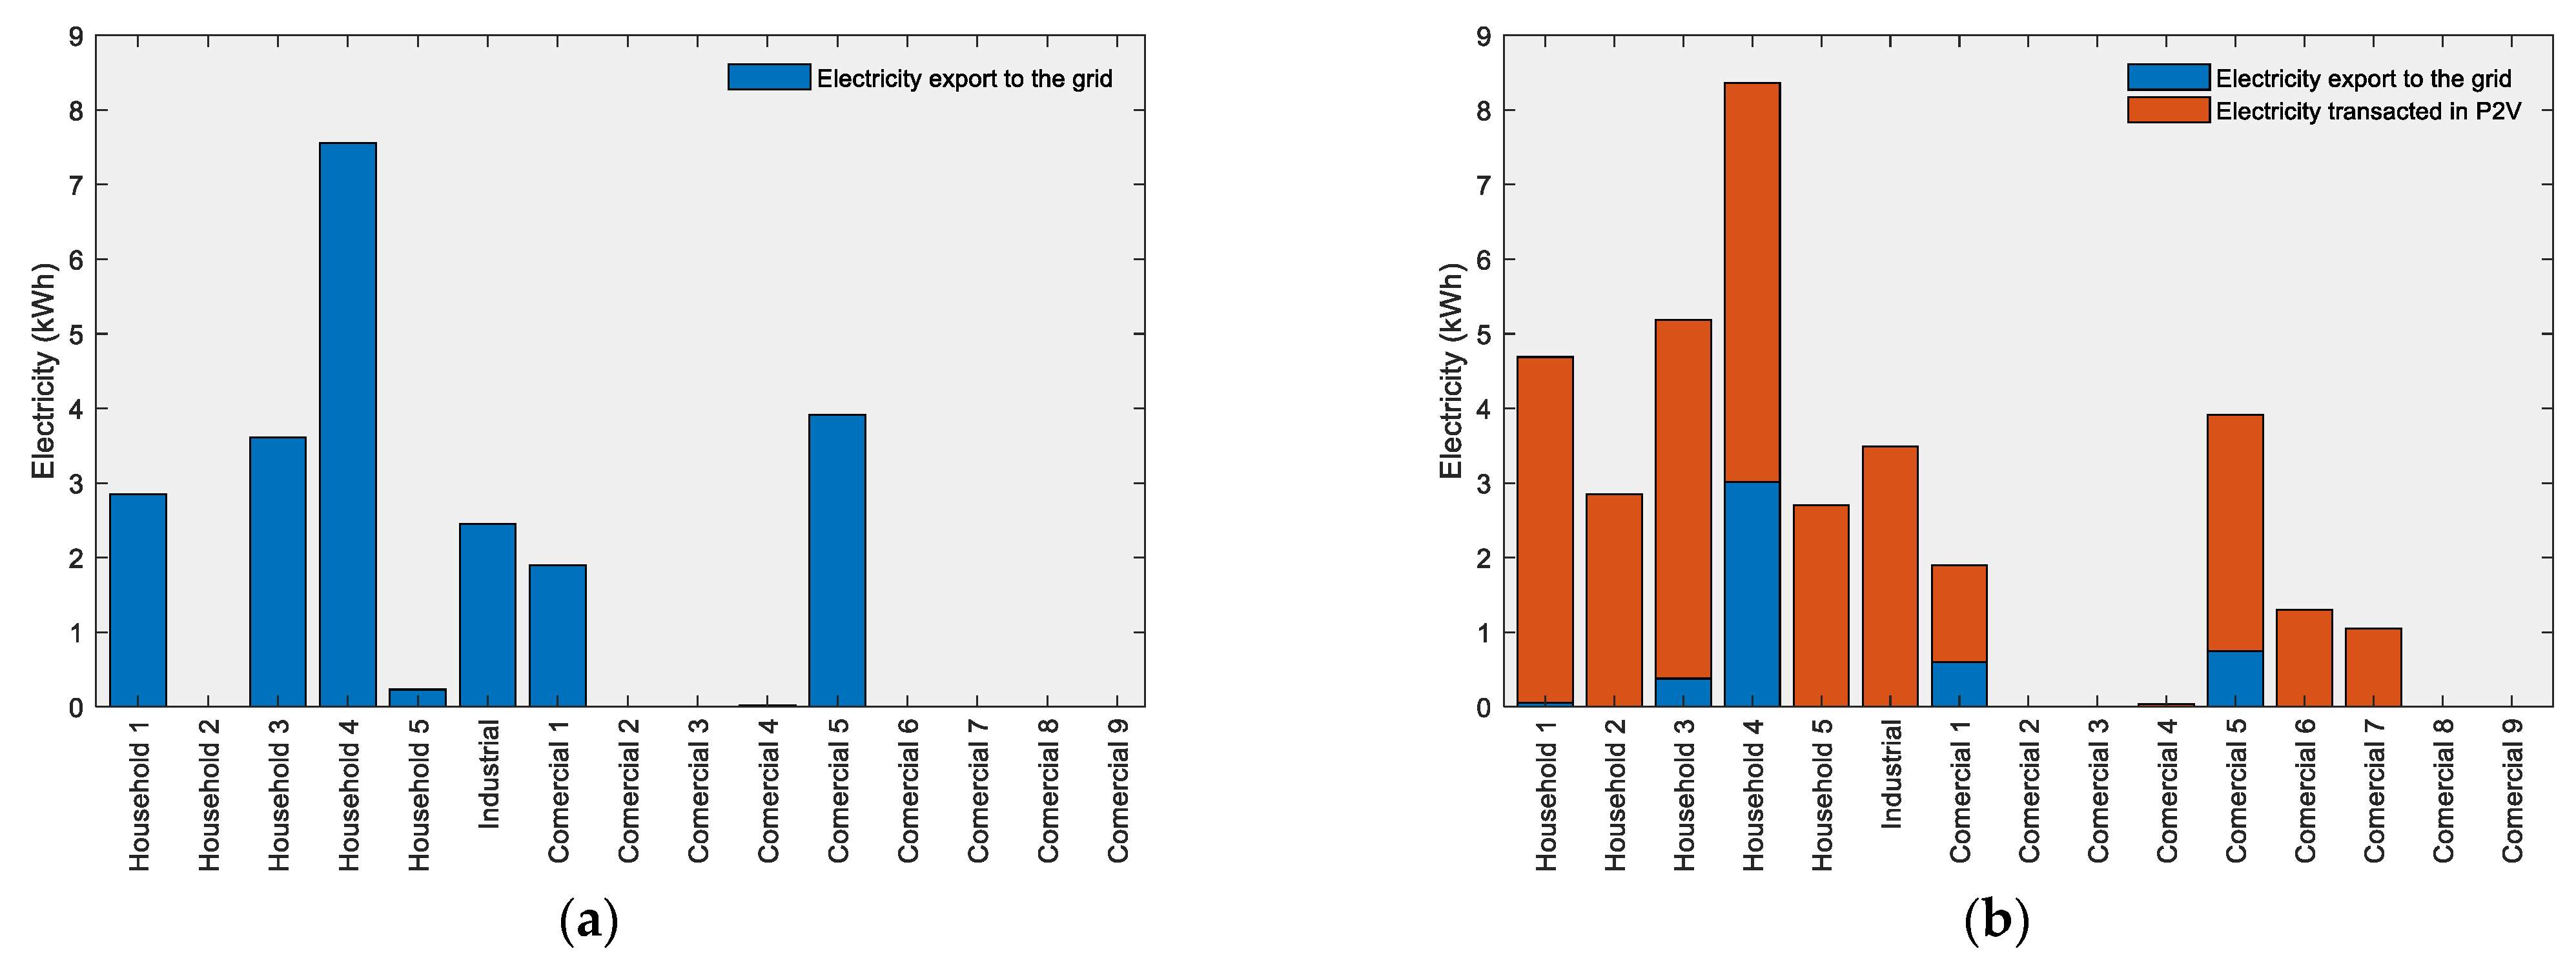
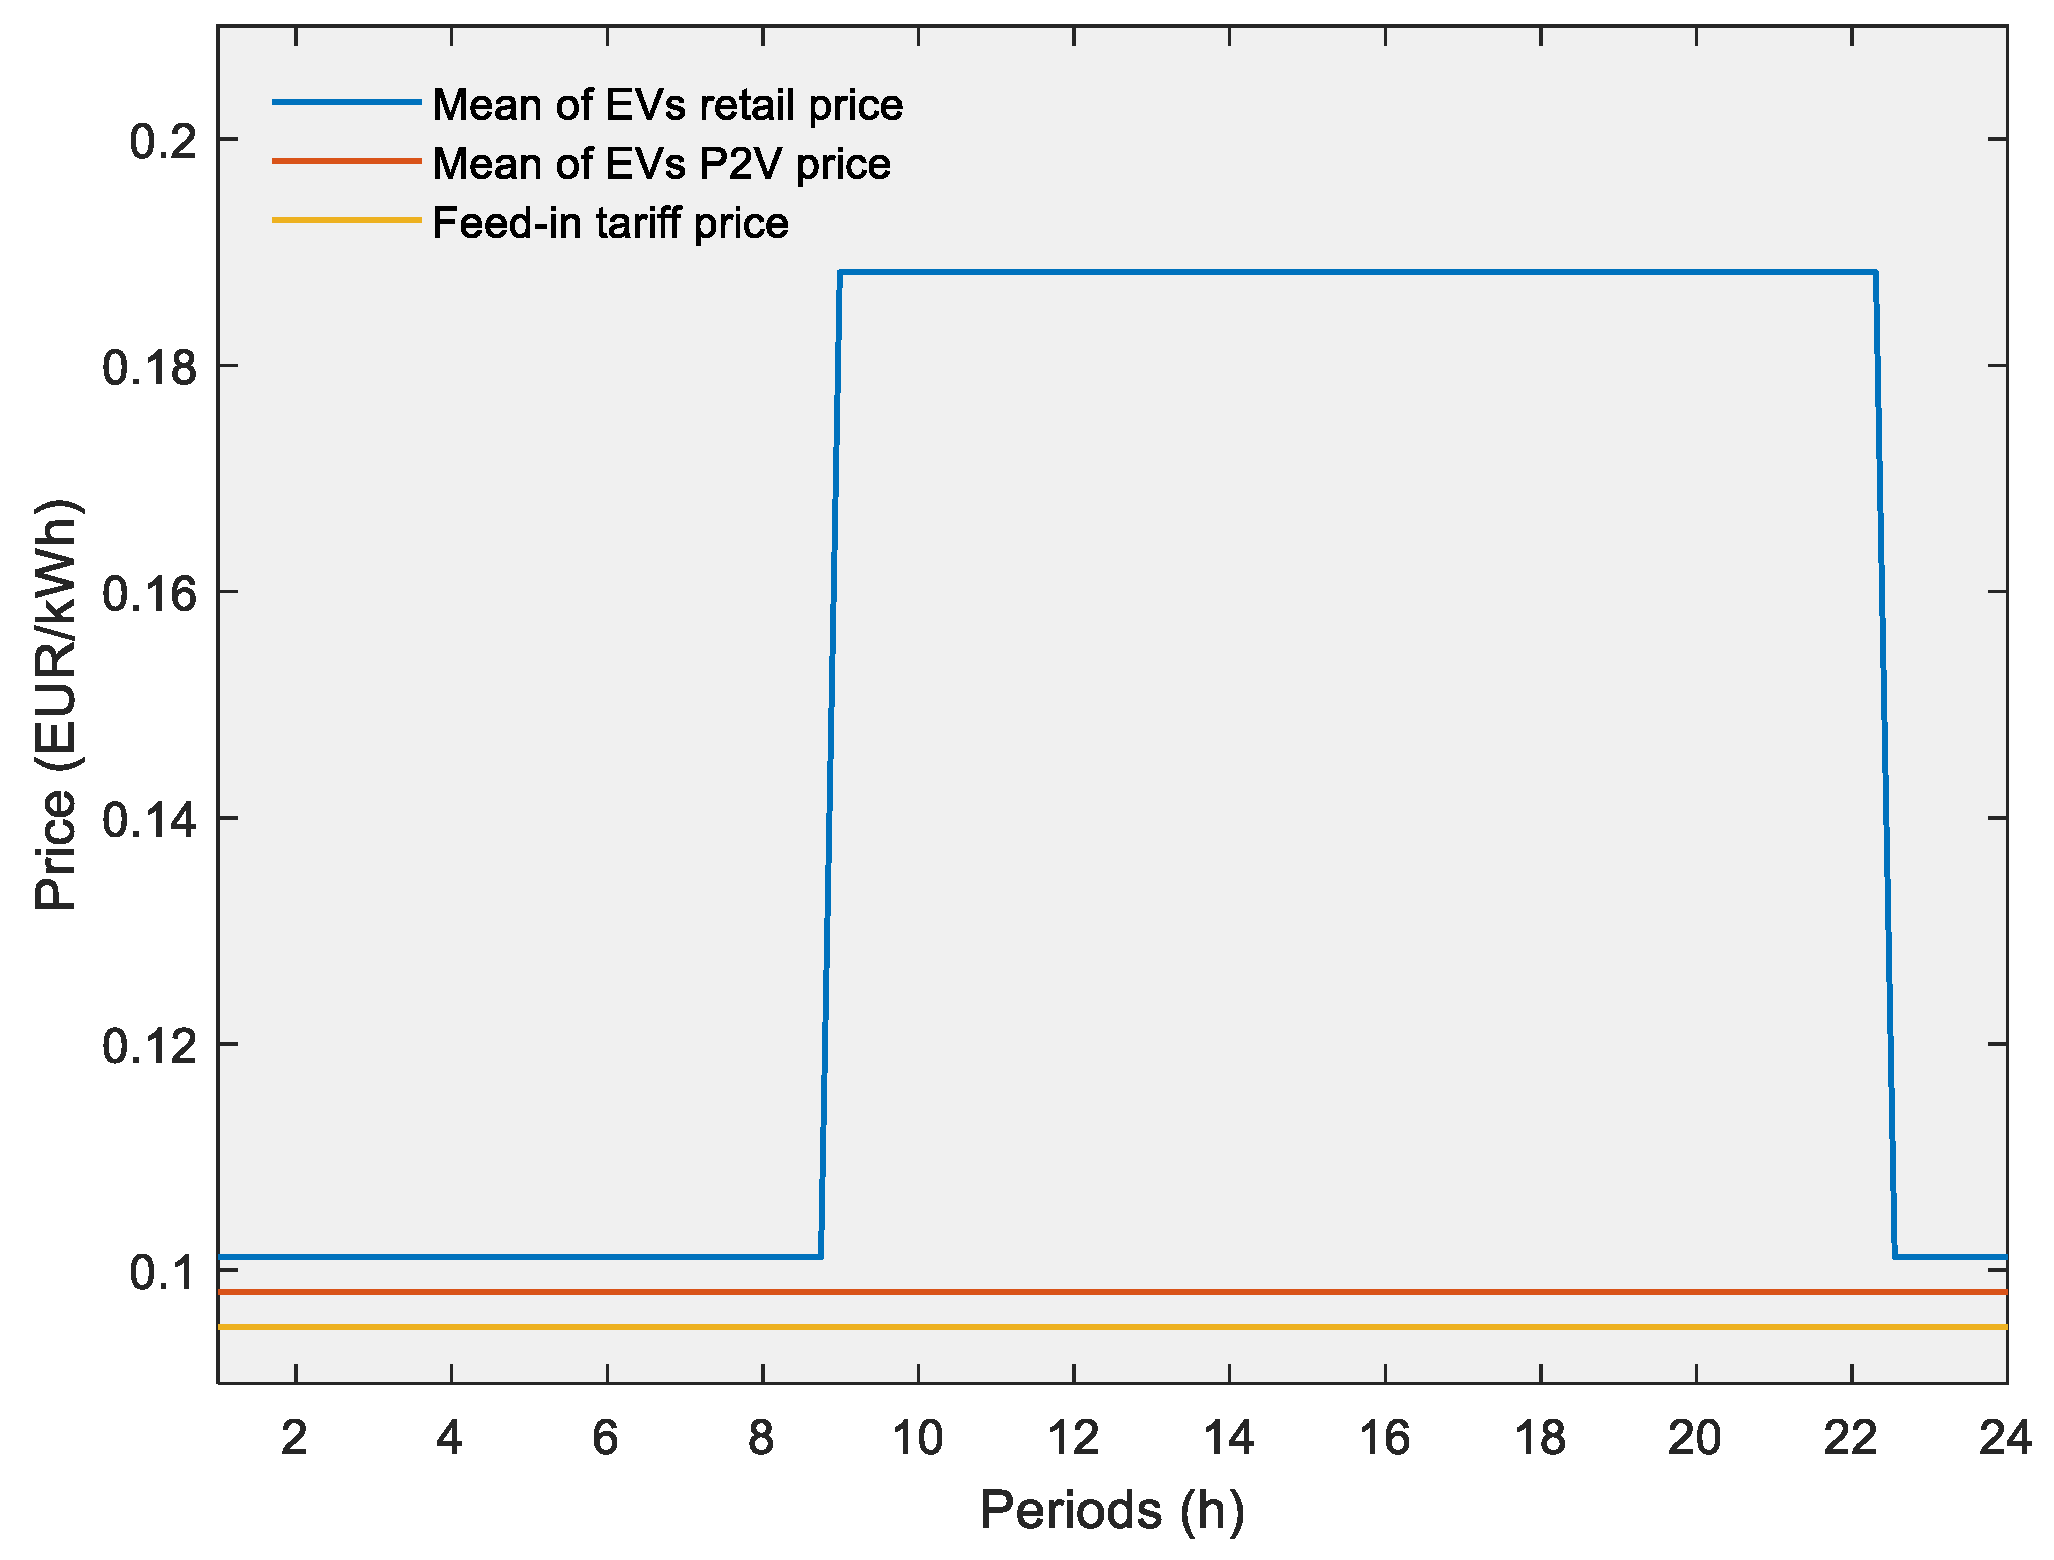
  • Scenario 1—Without the P2V market and considering the Portuguese feed-in tariff (0.095 EUR/kWh) for electricity export.
  • Scenario 2—With P2V market and considering the Portuguese feed-in tariff (0.095 EUR/kWh) for electricity export.
  • Scenario 3—Without the P2V market and considering the MIBEL Spot price (0.050 EUR/kWh) for electricity export.
  • Scenario 4—With P2V market and considering the MIBEL Spot price (0.050 EUR/kWh) for electricity export.
  • Scenario 5—Without P2V market and electricity export to the grid not remunerated.
  • Scenario 6—With P2V market and electricity export to the grid not remunerated.
Scenario 1 was implemented with the actual market regulation conditions, i.e., the export of electricity to the grid was the feed-in tariff at 0.095 EUR/kWh (Defined in Portaria n.° 115/2019 of Diário da República n.° 74/2019, Série I de 2019-04-15, https://data.dre.pt/eli/port/115/2019/04/15/p/dre/pt/html) and each prosumer could inject half of the contracted power at any moment. Scenario 2 was the same as scenario 1 but considered the proposed P2V market. Scenario 3 considered P2V market but the export of electricity to the grid could be paid at the spot market value for any prosumer. For simplification purposes, we considered the market spot price as constant. We considered that this community was aggregated with others by one aggregator and that it complied with the minimum restrictions to participate in the spot market. Scenario 4 was the same as scenario 3 but considered the P2V market. Scenario 5 considered the P2V market and the electricity export to the market was not remunerated, i.e., prosumers were not rewarded. Scenario 6 was the same as scenario 5 but considered the P2V market.
Table 3 present the optimization results for all proposed scenarios. The total cost in Table 3 is the value of the objective function obtained in the optimization process (Equation (1)). The average prosumer and EV cost corresponds to the mean value for the prosumers and EV costs, respectively. The P2V reduction column represents the total reduction in EUR achieved with the adoption of the P2V market.
Comparing scenarios 1 with 2, a reduction of 1.56% was verified in total cost. The average prosumer cost and EV cost was reduced with the P2V market. Comparing scenarios 3 and 4, the verified reduction was higher when compared with scenarios 1 and 2. The replacement of the export grid price, i.e., from 0.095 EUR/kWh to 0.050 EUR/kWh (feed-in to market spot), led to an increase of the total cost. The prosumers obtained reduced profits when they sold electricity because the export price decreased. The average prosumer cost and EV cost decreased from scenarios 3 to 4, but when comparing scenario 1 with scenario 3 and scenario 2 with scenario 4, the average prosumer cost increased. In the same comparison but for the average EV cost, the value remained unchanged without P2V but decreased with P2V adoption. Analysing the results of scenarios 5 and 6, the inclusion of the P2V market also provided the highest benefits, reducing the total cost by 3.48%. Scenario 5 presented the highest total cost considering all six scenarios, because the selected export grid price was not remunerated. Comparing the reduction values, scenarios 5 and 6 presented the best values (highest reduction: 3.48%). Analysing the average prosumer cost and EV cost, a reduction was also verified. In the case of the average EV cost, scenario 6 presented the lowest value considering the set of scenarios. The optimization time is presented in Table 3, where a great increase in the optimization time is visible when the P2V market was included, which is explained by the fact of a higher number of variables. Considering the presented results, two different aspects were demonstrated. First, the adoption of P2V market provided benefits for the prosumers and EVs, contributing to decreasing the total operating costs of the energy community. Second, with the export grid price decrease, the P2V market had more influence and impact because the prosumer revenue decreased and, consequently, its energy bill increased. Figure 4 presents the costs comparison in scenarios 1 and 2 for all the involved players.
Figure 4a presents the cost comparison for scenario 1 and 2. A small difference can be found within the results of both scenarios. The industrial prosumer presented the higher operational costs at EUR 14.19, the household prosumer group had a mean of EUR 2.79 and the EV group had a mean of EUR 1.72. The total cost reduction for each player, considering the comparison of both scenarios, is presented in Figure 4b. The reduction was more visible in EV players, with a mean cost reduction of EUR 0.055, while for the prosumers, a mean cost reduction of EUR 0.003 was verified. Within the EV group, EV 1 presented the highest reduction at EUR 0.35. Figure 5 presents the electricity export to the grid and P2V transactions between prosumers and EV.
By analysing Figure 5a,b, a comparison between scenario 1 and scenario 2 can be made concerning the total electricity export. As can be seen when the P2V market was available, the amount of electricity that prosumers exported was relatively higher. In scenario 1, the prosumers exported 22.52 kW, and in scenario 2, they exported 35.48 kW. The increase in the export was motivated by the possibility of prosumers to negotiate electricity with EVs (P2V), since prosumer was able to trade energy at better prices in the P2V market than by exporting to the grid, e.g., at the feed-in tariff. Household 2 did not present any transaction in scenario 1, whereas in scenario 2, this household was able to transact a considerable amount of energy with EVs when P2V was available. Figure 6 presents the electricity bought by EVs from the grid and prosumers.
Electricity acquisition by EVs for scenario 1 is presented in Figure 6a and for scenario 2 in Figure 6b. The total electricity bought by EVs was equal in both scenarios at 204.74 kWh. As explained before, some EVs have the possibility to charge the battery directly at home, namely in the case of EV1, EV3 and EV4. Considering this fact, the referred EVs are presented as a yellow bar in Figure 6, whereas when a transaction occurred with other prosumers (not at home), the bar became orange. In scenario 1, the total electricity bought directly from the grid was 179.15 kWh (88%), while the remaining electricity supplied at home totalled 25.59 kWh (12%). Analysing scenario 2, the total electricity bought directly from the grid was 148.47 kWh (73%), which compares with 179.15 kWh from scenario 1. Moreover, the electricity charged by EVs directly at home was 25.59 kWh (12%), which was equivalent to scenario 1, while the rest of the electricity was bought under P2V mode and totals 30.69 kWh (15%). Figure 7 presents the resulting EVs charging profiles.
Figure 7 presents the EV charging profiles for scenarios 1 and 2. The EV charging profile corresponds to the aggregation of EV power consumption curves. Figure 7a presents the EV charges from the grid and at home, and in the case of Figure 7b, the P2V transactions are included. In both scenarios, the EVs presented an equal amount of charge charges (204.74 kWh). In Figure 7b, the P2V transaction occurred between 10.30–16.00 h. As can be seen in Figure 2a–c, these periods represent the highest PV generation periods. Some of the electricity bought to the grid in scenario 1 between periods 1.00–4.00 h was moved to periods 10.30–16.00 h in scenario 2, since it moved to the P2V market during the day to profit from local PV generation. Figure 8 presents the final electricity price options for EVs.
Analysing the price values of Figure 8 with the results presented in Figure 7b, it becomes visible why the P2V market brings benefits, namely by reducing the operational costs of the energy community and its members. The electricity acquired on the P2V market was cheaper (orange line) compared with the retail price from the grid (blue line).

5. Conclusions

This work presented an innovative P2V market application in an energy community constituted by 15 prosumers and 20 EVs. The results showed a reduction in the energy community costs with the P2V electricity transactions. The results presented in this paper highly suggest that there is a significant influence of the feed-in tariff or similar schemes/incentives for PV generation in a hypothetical P2V market. In fact, we advocate that when there is little remuneration or zero remuneration for the local generation, the P2V market can be more capable of providing the best operational costs for all community members. With a high value of feed-in tariff in place, there is little motivation for the households to participate in the P2V market. In the future, feed-in tariffs may disappear and P2V may become one possible avenue for the prosumers market to trade energy local level and at a better deal.
The success of the P2V market also depends on the amount of surplus energy available from prosumers in a given energy community. Since most of them will have PV installations, it is possible to assume that sufficient amount will be available in the future. However, without storage facilities, this opportunity may well be restricted to the daytime. Nevertheless, the authors consider the P2V market a promising approach to better equip prosumers with an active tool to benefit the local distribution grid and the energy community.
Future work should consider more prosumers and EVs in the simulations in order to show that the model can eventually scale with a bigger energy community while also scaling the benefits for the involved members. Simulations considering the characteristics of the real network are another possible avenue to continue to carry out this research work. Due to the scalability problems that may appear in the simulation, blockchain-based methods considering metaheuristics are a valid option to implement and compare with the current model.

Author Contributions

Investigation, R.F. and J.S.; Methodology, R.F. and J.S.; Resources, Z.V.; Software, R.F. and J.S.; Writing—Original draft, R.F. and J.S.; Writing—Review & Editing, J.S., Z.V. and J.M.C.; supervision, Z.V. and J.M.C. All authors have read and agreed to the published version of the manuscript.

Funding

This work has received funding from FEDER Funds through COMPETE program and from National Funds through FCT under projects PTDC/EEI-EEE/28983/2017 (CENERGETIC), UIDB/00760/2020, CEECIND/02814/2017. Ricardo Faia was supported by the PhD grant SFRH/BD/133086/2017 from National Funds through FCT.

Institutional Review Board Statement

Not applicable.

Informed Consent Statement

Not applicable.

Data Availability Statement

Not applicable.

Conflicts of Interest

The authors declare no conflict of interest.

Nomenclature

Indices:
t Periods
i Prosumers
j Vehicles
Parameters:
η j E V   c h Efficiency of EV battery charge
η i c h Efficiency of prosumer battery charge
η i d c h Efficiency of prosumer battery discharge
P j , t E V   M o v e Electricity consumption of EV during trips
P i , t g e n Electricity generated
Δ t Factor adjustment
F i x C o s t Fixed costs
X j , t c h   E V   h o m e Indicates if the EV is at home (1) or not (0)
X j , t E V   M o v e Indication if the EV is travelling (0) or it is available to charge (1)
P i , t m a x   s e l l Limit of electricity export to the grid
P t , i l o a d Load of each prosumer
E i , t m a x   B a t Maximum capacity of the prosumer battery
P i , t m a x   P 2 V Maximum limit electricity sale to the EV
P j , t E V   m a x   b u y Maximum limit for EV electricity purchase to the retailer
P i , t m a x   c h Maximum power for prosumer battery charge
P i , t m a x   d c h Maximum power for the prosumer battery discharge
P j , t E V   m a x   c h Maximum power of EV battery charge located at prosumer i
P i , t max b u y Maximum power that prosumer can buy from the grid
E j , t E V   m a x   B a t Maximum value for the EV battery capacity
α j Minimum retail price for each EV
E j , t E V   m i n   B a t Minimum value for the EV battery capacity
N t Number of periods
N i Number of prosumers
N j Number of vehicles
ϕ i , t s e l l Price of electricity export to the grid
ϕ i , j , t P 2 V   s e l l Price of electricity transaction between prosumer and EV
ϕ i , t b u y Retail price of electricity
ϕ j , t E V   b u y Retail price to charge EV from the grid
Variables:
B i n j , t c h   E V   h o m e Binary variable for EV battery that represents the charge action
B i n i , t b u y Binary variable for prosumer buy from grid
B i n i , t s e l l Binary variable for prosumer sell to grid
B i n i , j , t P 2 V   t r a n s a c t e d Binary variable for prosumer to EV transaction
B i n i , t c h Binary variable for the prosumer battery that represents the charge action
B i n i , t d c h Binary variable for the prosumer battery that represents the discharge action
B i n j , t E V   b u y Binary variable to active the transaction of electricity between EV and retailer
E V j C o s t s Electric vehicles costs
P i , t c h Electricity battery charge
P j , t E V   c h Electricity charged by each EV
P i , j , t c h   E V   h o m e Electricity charged by EV from the house
P j , t E V   b u y Electricity purchase by each EV to the retailer
E j , t E V   B a t Electricity state of the EV battery
P i , j , t P 2 V   t r a n s a c t Electricity transacted between prosumer and EV
P i , t d c h Energy battery discharge
P j , t b u y EV electricity purchase from the retailer
P r o i C o s t s Prosumer costs
P i , t b u y Prosumers electricity purchase from the retailer
P i , t s e l l Prosumers electricity sale to the grid
E i , t B a t State of charge of the battery

References

  1. European Environment Agency. National emissions reported to the UNFCCC and to the EU Greenhouse Gas Monitoring Mechanism. In National Greenhouse Gas Inventories (IPCC Common Reporting Format Sector Classification); European Environment Agency: Copenhagen, Danmark, 2018. [Google Scholar]
  2. European Union. White Paper on Transport; European Union: Brussels, Belgium, 2011; pp. 1–32. [Google Scholar] [CrossRef]
  3. Telles, S.; Reddy, S.K.; Nagendra, H.R. A European Strategy for Low-Emission Mobility. Eur. Comm. 2019, 53, 1689–1699. [Google Scholar] [CrossRef]
  4. International Energy Agency. Global EV Outlook 2018; OECD: Paris, France, 2018; ISBN 9789264302365. [Google Scholar]
  5. Fachrizal, R.; Shepero, M.; van der Meer, D.; Munkhammar, J.; Widén, J. Smart charging of electric vehicles considering photovoltaic power production and electricity consumption: A review. eTransportation 2020, 4, 100056. [Google Scholar] [CrossRef]
  6. Garcia Villalobos, J. Optimized Charging Control Method for Plug-in Electric Vehicles in LV Distribution Networks. Ph.D. Thesis, Universidad del País Vasco (UPV/EHU), Leioa, Spain, 2016; pp. 1–230. [Google Scholar]
  7. Hoarau, Q.; Perez, Y. Interactions between electric mobility and photovoltaic generation: A review. Renew. Sustain. Energy Rev. 2018, 94, 510–522. [Google Scholar] [CrossRef] [Green Version]
  8. García-Villalobos, J.; Zamora, I.; San Martín, J.I.; Asensio, F.J.; Aperribay, V. Plug-in electric vehicles in electric distribution networks: A review of smart charging approaches. Renew. Sustain. Energy Rev. 2014, 38, 717–731. [Google Scholar] [CrossRef]
  9. Aoun, A.; Ibrahim, H.; Ghandour, M.; Ilinca, A. Supply side management vs. Demand side management of a residential microgrid equipped with an electric vehicle in a dual tariff scheme. Energies 2019, 12, 4351. [Google Scholar] [CrossRef] [Green Version]
  10. Asif, A.; Singh, R. Further Cost Reduction of Battery Manufacturing. Batteries 2017, 3, 17. [Google Scholar] [CrossRef]
  11. Hussain, A.; Bui, V.-H.; Baek, J.-W.; Kim, H.-M. Stationary Energy Storage System for Fast EV Charging Stations: Simultaneous Sizing of Battery and Converter. Energies 2019, 12, 4516. [Google Scholar] [CrossRef] [Green Version]
  12. Lezama, F.; Soares, J.; Hernandez-Leal, P.; Kaisers, M.; Pinto, T.; Vale, Z. Local Energy Markets: Paving the Path toward Fully Transactive Energy Systems. IEEE Trans. Power Syst. 2019, 34, 4081–4088. [Google Scholar] [CrossRef] [Green Version]
  13. European Union. The Strategic Energy Technology (SET) Plan; European Union: Brussels, Belgium, 2017. [Google Scholar]
  14. Faia, R.; Pinto, T.; Vale, Z.; Corchado, J.M. A Local Electricity Market Model for DSO Flexibility Trading. In Proceedings of the International Conference on the European Energy Market, Ljubljana, Slovenia, 8–20 September 2019. [Google Scholar]
  15. Masood, A.; Hu, J.; Xin, A.; Sayed, A.R.; Yang, G. Transactive Energy for Aggregated Electric Vehicles to Reduce System Peak Load Considering Network Constraints. IEEE Access 2020, 8, 31519–31529. [Google Scholar] [CrossRef]
  16. Abrishambaf, O.; Lezama, F.; Faria, P.; Vale, Z. Towards transactive energy systems: An analysis on current trends. Energy Strateg. Rev. 2019, 26. [Google Scholar] [CrossRef]
  17. Kikusato, H.; Fujimoto, Y.; Hanada, S.I.; Isogawa, D.; Yoshizawa, S.; Ohashi, H.; Hayashi, Y. Electric Vehicle Charging Management Using Auction Mechanism for Reducing PV Curtailment in Distribution Systems. IEEE Trans. Sustain. Energy 2020, 11, 1394–1403. [Google Scholar] [CrossRef] [Green Version]
  18. Gomes, L.; Vale, Z.A.; Corchado, J.M. Multi-Agent Microgrid Management System for Single-Board Computers: A Case Study on Peer-to-Peer Energy Trading. IEEE Access 2020, 8, 64169–64183. [Google Scholar] [CrossRef]
  19. Soares, J.; Canizes, B.; Lobo, C.; Vale, Z.; Morais, H. Electric vehicle scenario simulator tool for smart grid operators. Energies 2012, 5, 1881–1899. [Google Scholar] [CrossRef] [Green Version]
Figure 1. Methodology block diagram.
Electronics 10 00129 g001
Figure 2. Case study profiles: (a) Households, (b) commercial, (c) industrial and (d) EV movements.
Electronics 10 00129 g002
Figure 3. Electricity prices.
Electronics 10 00129 g003
Figure 4. (a) Operational costs for one day of operation and (b) reduction on operational costs.
Electronics 10 00129 g004
Figure 5. Electricity exported (grid and P2V transactions): (a) Scenario 1 and (b) Scenario 2.
Electronics 10 00129 g005
Figure 6. Electricity acquisition by EVs: (a) Scenario 1 and (b) Scenario 2.
Electronics 10 00129 g006
Figure 7. EV battery charge profile: (a) Scenario 1 and (b) Scenario 2.
Electronics 10 00129 g007
Figure 8. EV buy electricity prices.
Electronics 10 00129 g008
Table 1. Stationary and electrical vehicle (EV) battery characteristics.
BrandModelTypeBattery Capacity (kWh)Charge Rate (kW)Discharge Rate (kW)Efficiency (%)No.
Sonnen9.43Stationary15.0003.3003.3000.97
TeslaPowerwallStationary13.5005.0005.0000.96
AlphaSmileStationary14.5002.8672.8670.93
TeslaModel 3 Sta. Range +EV50.00011.000-0.95
VWe-GolfEV35.8007.200-0.94
NissanLeafEV40.0003.600-0.94
VWID.4EV82.00011.000-0.93
VWe-Up!EV36.8007.200-0.92
HondaeEV35.5006.600-0.91
Peugeote-208EV50.0007.400-0.91
Table 2. Input parameters.
ParameterDesignationValueUnits
MinMax
N i Number of prosumers15-
N j Number of EV20-
ϕ i , t b u y Retail price (Prosumers)0.0940.294EUR/kWh
ϕ i , t s e l l Export price (feed-in, spot market)00.095EUR/kWh
ϕ j , t E V   b u y Retail price (EVs)0.1010.189EUR/kWh
ϕ i , j , t P 2 V   s e l l , ϕ j , i , t P 2 V   b u y P2V prices0.0510.098EUR/kWh
F i x C o s t i Fixed costs of prosumers0.2181.024EUR/day
F i x C o s t j Fixed costs of EV0.2920.719EUR/day
P i , t g e n Prosumer electricity generation010.349kW
P i , t l o a d Prosumers electricity load010.277kW
P i , t max b u y The maximum power limit (prosumers) 3.45020.700kW
P i , t max s e l l The maximum export power limit 1.72510.350kW
P i , t m a x   P 2 V   s e l l The maximum P2V power transaction limit1.72510.350kW
E i B a t   i n i t The initial level of prosumer battery0kWh
P i , t m a x   d c h , P i , t m a x   c h Max. charge/discharge power prosumer battery2.8675.000kW
E i , t m a x   B a t The maximum level for the prosumer battery13.50015.000kWh
P j , t E V   M o v e Consumption related to PV movements013.300kWh
P j , t E V   m a x   c h The maximum limit for EV charge3.60011.000kW
P j , t E V   m a x   b u y The maximum power limit retailer contract 4.60013.800kW
E j , t E V   m i n   B a t The minimum level for the prosumer battery7.10016.400kWh
E j , t E V   m a x   B a t The maximum level for EV battery35.50082.000kWh
E j E V   B a t   i n i t The initial level of EV battery7.10016.400kWh
P i , j , t m a x   P 2 V   b u y Maximum P2V power transaction limit (EVs)4.60013.800kW
Table 3. Optimization results.
Export Grid PriceSce.P2V MarketTotal Cost (EUR)Average Prosumer Cost (EUR)Average EV Cost (EUR)P2V Red. (%)Time (s)
Feed-in tariff1No74.762.9591.52-2.94
2Yes73.602.9561.461.56182.84
Market spot price3No75.663.0191.52-2.72
4Yes73.793.0141.432.4778.16
Export not remunerated5No76.663.0861.52-2.67
6Yes73.993.0791.393.48117.08
Publisher’s Note: MDPI stays neutral with regard to jurisdictional claims in published maps and institutional affiliations.

