Article

Non-Linear Chaotic Features-Based Human Activity Recognition

1
School of Computer Science and Engineering, Xi’an University of Technology, Xi’an 710048, China
2
Shaanxi Key Laboratory for Network Computing and Security Technology, Xi’an 710048, China
*
Author to whom correspondence should be addressed.
Electronics 2021, 10(2), 111; https://doi.org/10.3390/electronics10020111
Submission received: 11 November 2020 / Revised: 21 December 2020 / Accepted: 5 January 2021 / Published: 7 January 2021
(This article belongs to the Section Computer Science & Engineering)

Abstract

:
Human activity recognition (HAR) has vital applications in human–computer interaction, somatosensory games, and motion monitoring, etc. On the basis of the human motion accelerate sensor data, through a nonlinear analysis of the human motion time series, a novel method for HAR that is based on non-linear chaotic features is proposed in this paper. First, the C-C method and G-P algorithm are used to, respectively, compute the optimal delay time and embedding dimension. Additionally, a Reconstructed Phase Space (RPS) is formed while using time-delay embedding for the human accelerometer motion sensor data. Subsequently, a two-dimensional chaotic feature matrix is constructed, where the chaotic feature is composed of the correlation dimension and largest Lyapunov exponent (LLE) of attractor trajectory in the RPS. Next, the classification algorithms are used in order to classify and recognize the two different activity classes, i.e., basic and transitional activities. The experimental results show that the chaotic feature has a higher accuracy than traditional time and frequency domain features.

1. Introduction

Human activity recognition is the detection, understanding and recognition of human habitual or temporary behavior types, activity ways, and patterns. The recognition of human activities provides intelligent services for various application platforms, such as smart home [1], healthcare [2], patient care, exercise health, identity authentication, etc., and it has a wide application prospect.
Substantial research has been conducted in order to recognize human activities [3]. In the aspect of motion data acquisition and recognition, there are mainly two ways that based on computer vision and various types of sensors [4]. When compared to computer vision approaches, the various sensors have the advantage of small size, high sensitively, abundant information, and not being limited by the scene or time. Especially, for smartphone’s built-in sensor [5], it does not require additional infrastructure, is universal, and it has better computational power. In addition, the accelerometer and gyroscope data can be collected from a smartphone.
Most of the existing sensor-based human activity recognition approaches often require steps, such as window division, feature extraction, model training, and activities recognition. Especially for feature extraction module, the existing researches are roughly divided into two categories: time and frequency domain features [6] and automatically extracted features based on deep learning [7,8]. Chen et al. [6] proposed a framework and performance analysis of human activity recognition system that is based on smartphone sensors, which accurately describe different human motion patterns by extracting seven features in the time-frequency domain and wavelet domain. Quaid et al. [9] proposed a genetic algorithm using sensor data to solve complex feature selection and classification problems, by combining time and frequency domain features and acoustic signal characteristics (e.g., energy, zero crossing rate, etc.). Besides, from the perspective of medical services, the signal amplitude, average, standard deviation, maximum, and minimum values are extracted from the motion date after de-noising as eigenvalues, and then these statistical features are learnt and trained by linear support vector machine to realize human behavior recognition [10]. Zhu et al. [11] proposed a semi-supervised deep learning method, through the deep Long Short Term Memory (LSTM) to extract the features of local lazy items in the cyclic framework, and realized the six activities recognition. Zhang et al. [12] combined attention mechanism with Convolutional Neural Networks (CNNs) to extract features. Meanwhile, there are some related literatures that combine the two methods for activity recognition. For example, literature [5] has combined LSTM model-based with time and frequency domain features, and proposed a feature fusion framework to improve the performance of Human activity recognition (HAR) based on smartphone sensors. Also, Nguyen et al. [13] used similar pose transform and discrete wavelet transform to extract time-frequency domain features, and then further utilize the bidirectional LSTM model to classify and recognize activities, thus improving the problem of different motions posture conversion.
There has been a widespread use of machine learning techniques in smartphone-based activity recognition [3]. One of the most common approaches is to extract time and frequency domain features (i.e., mean, maximum, principal component analysis, etc.). However, the traditional statistical features usually have higher dimensions; thus, it increases the computational complexity. Additionally, this method often ignores the periodic and nonlinear characteristics of the activity, and it does not fully consider the potential dynamic features of the human activity. In addition, the idea of human activity recognition that is based on deep learning is to extract features from the raw sensor data through various neural network models. Comparing with the global information of time and frequency domain features, the motion feature information extracted by deep learning is difficult to understand and it has high computational complexity. Besides, although the machine learning techniques and deep learning methods have both achieved a higher recognition rate in the field of HAR, these approaches do not fully consider the underlying chaotic dynamics in activity time series (sensor data), and they also ignore the non-linear characteristics of human motion series [14].
Nonlinear dynamical system studies the qualitative and quantitative changes of different motion states. Phase space reconstruction technology is a vital step in nonlinear dynamics analysis, which reconstructs a time series with chaotic features into a nonlinear dynamic system. Furthermore, there has been some works using dynamical system and chaos theory, along with machine learning techniques for human activity recognition [3,15,16]. Saad et al. [15] constructs a recognition framework for modeling and analyzing the nonlinear dynamics of human activities that are based on the chaos theory. Additionally, a four-dimensional eigenvector are built by parameters, such as Lyapunov exponent, embedding dimension, correlation integral and variance, the five activity classes are recognized and the recognition rate is 89.7%. Kawsar et al. [17] develops an activity detection system where they use pressure sensor data from shoes along with accelerometers and gyroscope data from smart phone. Additionally, they exploit the time-delay embedding for detecting four activities (e.g., running, walking, sitting, and standing), and the classification accuracy achieves 100%. Whereas, they do not mention the number of participants in this study and also do not perform some widely tested activities (i.e., laying down, walking upstairs, and walking downstairs). The acceleration sensor data are used in order to build phase space reconstruction, and the principal component analysis is used to extract the nine maximum values as the eigenvalues form the phase space, and then the five activities are recognized by the support vector machine, and the recognition rate is 85% [16]. Meantime, in the literature [18], the acceleration signals are embedded into a six-dimensional pseudo phase space using the time-delay embedding. Subsequently, these activity observation series are classified into different motions by the geometric template matching algorithm, and the six basic activities from the UCI datasets are recognized. However, this paper does not analyze the activity time series from the chaotic features perspective. Additionally, an Electrocardiogram (ECG) signal (that is, a sensor signal) is reconstructed into phase space using the time-delay technique. The 21 geometric features through the trajectory from the phase space are extracted, and the four daily activities (i.e., rest, exercise, listening to music, and watching a video) are recognized by the support vector machine learning, and the accuracy rate is 97.7% [19]. Based on the dynamic system and chaos theory, Md et al. [3] proposed a human activity recognition system that is based on lightweight smartphone. They use acceleration sensor data from a smartphone to reconstruct the phase space, and Gaussian Mixture Models (GMM) is learnt from the dynamics system to classily human activities by the Maximum Likelihood Classifier (MLC). That is, the accuracy is 100% in the self-collected dataset, but, in the public dataset, it is 90%. However, this work provides another idea for human activity recognition, but does not perform experiments with other test activities, such as transition activity.
In the meantime, although there have been extensive works towards the HAR problem, most of them adopt the time and frequency domain feature, without exploiting the chaotic feature via Reconstructed Phase Space (RPS). Thus, in this work, we analyze the nonlinear dynamic features of the human activity from the dynamic system perspectives. In particular, we only leverage one-axis acceleration sensor data to capture the inherent dynamics of the human activity, and these sensor data are reconstructed in the phase space by time-delay embedding. Following that, a two-dimensional chaotic feature matrix is constructed, where the chaotic feature includes both the correlation dimension and largest Lyapunov exponent (LLE) of attractor trajectory in the RPS. Additionally, then, five classification algorithms are leveraged in order to classify and recognize the two different activity classes (e.g., basic and transitional activities).
In this work, we study the non-linear chaotic features-based human activity recognition. The distinctive features of this work are as follows:
  • We present a novel method for human activity recognition that is based on non-linear chaotic features. Because the time series with the chaotic feature can be reconstructed into a nonlinear dynamical system, this system studies the qualitative and quantitative changes of various human motion states.
  • The human activity acceleration sensor data can be described as a chaotic time series. As such, we attempt to reconstruct the activity time series in a phase space by time-delay embedding technology. In the meantime, in the process of reconstructing motions phase space, we leverage the C-C method and G-P algorithm in order to estimate the optimal delay time and embedding dimension, respectively.
  • We construct a two-dimensional chaotic feature matrix, where the chaotic feature is composed of the correlation dimension and LLE of attractor trajectory in the reconstruction phase space. Additionally, the chaotic feature is different from the time-frequency domain features and it can fully describe the human activity potential dynamic information.
The remainder of this paper is organized, as follows. In Section 2, we overview the idea of HAR based on dynamic system and chaos theory. Additionally, we leverage the C-C method and G-P algorithm to solve the activity phase space reconstruction problem, respectively. Section 3 discusses the details of the experiment result. We conclude this article in Section 4.

2. Non-Linear Chaotic Features-Based Human Activity Recognition

2.1. Chaotic Analysis of Motion Time Series

In dynamical systems, the power-spectrum analysis of the chaotic time series is the first stage in RPS. The motion signal power-spectrum has autocorrelation structure, and it is an irregular signal in the time dimension. Furthermore, the time series power-spectrum with chaotic features might appear “noise background” or “wide peaks”, which reflect the randomness of the chaotic motion sequence.
Given a motion time series x n ( i ) , where i = { 1 , 2 , , r } is the activity class and n is the length of the motion time series. The multi-types motion time series X,
X = x 1 ( 1 ) , x 2 ( 1 ) , , x n ( 1 ) x 1 ( 2 ) , x 2 ( 2 ) , , x n ( 2 ) , , , x 1 ( i ) , x 2 ( i ) , , x n ( i ) .
For the motion signal time series, the autocorrelation function A is first calculated, and then the corresponding power-spectrum S k is obtained by Discrete Fourier Transform (DFT).
A i = 1 n j = 1 n x j x j + 1 ,
S k = x ^ k 2 = i = 1 r A i cos ( 2 π i k n ) .
Taking the activity class “walking” as an example, Figure 1 shows its power-spectrum distribution. It can be observed from the Figure 1 that the power-spectrum of the activity “walking” has the features of aperiodic, continuous spectrum, no obvious spectral peak, and not flat spectrum, and it also has the characteristics of “wide peak” and “noise background”. Thus, the human activity acceleration sensor data match the characteristic of chaotic time series.

2.2. System Model

In nonlinear dynamical systems, the qualitative and quantitative changes of various motion states are studied, and the phase space reconstruction is the key technology of nonlinear dynamics analysis. More specially, the quality of reconstruction directly affects the establishment and prediction of the model. In particular, the motion state space reconstruction of non-linear dynamical systems is the first stage in chaotic time series analysis and prediction.
From the nonlinear dynamical features in human activity [3,15], we construct a dynamical chaotic features model-based for human activity recognition, as revealed in Figure 2. The single-axis accelerometer sensor data are first filtered by the Butterworth low-pass filter, and a sliding window with a window size 3s and an overlap rate of 50% for segmenting the sensor data. Subsequently, we leverage the C-C method and G-P algorithm for estimating the appropriate delay time and embedding dimension, respectively. Additionally, each activity phase space is reconstructed by the two chaotic parameters, such as delay time and embedding dimension. Next, the correlation dimension and LLE of attractor trajectory in the RPS are extracted as chaotic features. In particular, the two chaotic features are utilized to build a two-dimensional chaotic feature matrix. Finally, the different human activities are classified and recognized by machine learning method.

2.3. Reconstructed Phase Space

The dynamical system is a model that describes the evolution of a system over time [3], and a temporal evolution of system is defined in a phase space. In addition, in chaotic time series analysis, the reconstruction of nonlinear dynamical systems from time series is the vital stage [20]. Phase space reconstruction can implement the modeling and forecasting of chaotic time series. Therefore, in this work, the RPS is introduced in order to capture the underlying dynamics of the accelerometer sensor data, where the data are chaotic time series observations.
Packard and Takens proposed the RPS theory [21]. From the Taken’s embedding theorem, an attractor of the original system is reconstructed from the time series. The attractor preserves the topological properties of the original dynamic system, which is, the RPS is topologically equivalent to the original system. The RPS describes a process that these observations (accelerometer sensor data) are converted into state vectors. For an activity class time series, in line with the Taken’s delay embedding theorem, the phase space vector Y can be represented as,
Y = x n , x n τ , , x n ( m + 1 ) τ ,
where m is the embedding dimension and τ is the delay time. Additionally, this time delayed the embedding of the time series is called the RPS [22]. Furthermore, to model and predict the chaotic time series, one must choose appropriate delay time and embedding dimension in the reconstruction of the attractor. For infinite long and without noise time series, the selection of embedding dimension and delay time is not limited in principle. However, for the motion time series with both noise and finite long, selecting the appropriate embedding dimension and delay time is the premise of RPS [23].

2.3.1. Delay Time

The C-C method has no firm theoretical basis, but it works well for the choice of delay time and shows strong robustness. Additionally, it can be practicable for the exact selection of delay time [24], when compared to other methods. Thereby, in this work, the C-C method is used in order to obtain the optimal delay time. The correlation integral of the time series is defined as,
C ( m , n , r , t ) = 2 M ( M 1 ) 1 i j M θ ( r d i j ) ,
where m is embedding dimension, n is the number of the time series, r is search radius, and M = n ( m 1 ) t is the number of embedded points in m-dimensional phase space, besides, d i j = | | x i x j | | , and θ are Heaviside function.
The correlation integral C is a cumulative distribution function, which represents the statistical probability that the distance between any two points in the phase space is less than r. The activity time series x is divided into t disjoint sub-series. For the general t, the statistic S of each time series is defined as,
S ( m , n , r , t ) = 1 t s = 1 t C s ( m , n / t , r , t ) C s m ( 1 , n / t , r , t ) ,
as n , we can obtain,
S ( m , r , t ) = 1 t s = 1 t C s ( m , r , t ) C s m ( 1 , r , t ) .
The optimal delay time τ may be the times that correpond to the first zero crossings of S ( m , r , t ) . The Δ S ( m , t ) is defined via the maximum and minimum of radius.
Δ S ( m , t ) = max { S ( m , r k , t ) } min { S ( m , r k , t ) } .
The appropriate selection range of the quantities is determined, relying on the BDS statistics. The average of the quantities that are given by Equations (7) and (8) are defined,
S c o r = S ¯ ( t ) + Δ S ¯ ( t ) .
Therefore, the optimal delay time τ corresponds to the first zero crossing of S ¯ ( t ) or the first local minimum of Δ S ¯ ( t ) .

2.3.2. Embedding Dimension

Grassberger and Procaccia propose a G-P algorithm [25]; this method is widely used to calculate the embedding dimension and correlation dimension form the chaotic time series. Because of the self-similar characteristic of the chaotic system, the correlation dimension of fractal geometry is adopted for the description of the chaotic attractor, as it can describe the complexity of the system in a quantitative way.
The principle is that a set of motion time series is { x 1 , x 2 , , x n } , and the erratic attractor of the chaotic dynamical system is constructed by the RPS Y = x n , x n τ , , x n ( m + 1 ) τ , where τ is the delay time and m is the embedding dimension of the state space rebuild.
In Y, the absolute value of the difference between any two vectors is recorded as r i j = Y i Y j . Additionally, the association function C indicates the probability that the distance between two points is less than r. Additionally, the expression is,
C ( r ) = 1 n 2 j = 1 N i = 1 N δ ( r Y i Y j ) , i j ,
where, δ ( r Y i Y j ) is Heaviside function, then the correlation dimension is,
D = lim r l n C ( r ) / l n r .
From Taken’s embedding theorem, the relationship between embedding dimension m and the correlation dimension d meets the condition, i.e., m 2 d + 1 .

2.3.3. Lyapunov Exponent

In a dynamic system, the Lyapunov exponent (LE) is a typical indicator and it can be used to inspect whether the nonlinear time series is in a chaotic state. The largest Lyapunov exponent (LLE) reveals the chaotic degree of a time series, and a greater value shows a more obvious chaotic characteristic and a higher degree of chaos. Thus, the positive LLE value means that the time series is in chaotic state, and, if the LLE value is negative, which explains the time series is a stable motion state [26]. In our paper, we calculate the LLE value of time series Wolf-based [27]. The detailed process is described, as follows:
  • For a set of motion time series { x 1 , x 2 , , x n } , the optimal delay time τ and embedding dimension m are determined, and then the corresponding reconstructed phase space Y can be obtained based on the Equation (4).
  • The initial point Y ( t 0 ) is obtained from the Y. The distance between Y ( t 0 ) and its nearest neighbor point Y 0 ( t 0 ) is estimated L 0 , which is the evolution of the two points with time.
  • At the time t 1 , the distance L 0 = Y ( t 1 ) Y 0 ( t 0 ) > ε , which is, the ε ( ε > 0 ) is a threshold value, then retained at the Y ( t 1 ) .
  • The Y ( t 1 ) is the adjacent point of the another point Y 1 ( t 1 ) , the distance L 1 = | Y ( t 1 ) Y 1 ( t 1 ) | < ε is the and the angle between Y ( t 1 ) and Y 1 ( t 1 ) as small as possible.
  • Repeat the above steps, until Y ( t ) reaches the end of the entire time series n.
  • In the process of tracking the evolution, the total number of iterations is set as M. The LLE can be achieved from Equation (12).
    λ = 1 t M t 0 k = 1 k = M log 2 L t k log 2 L t k .
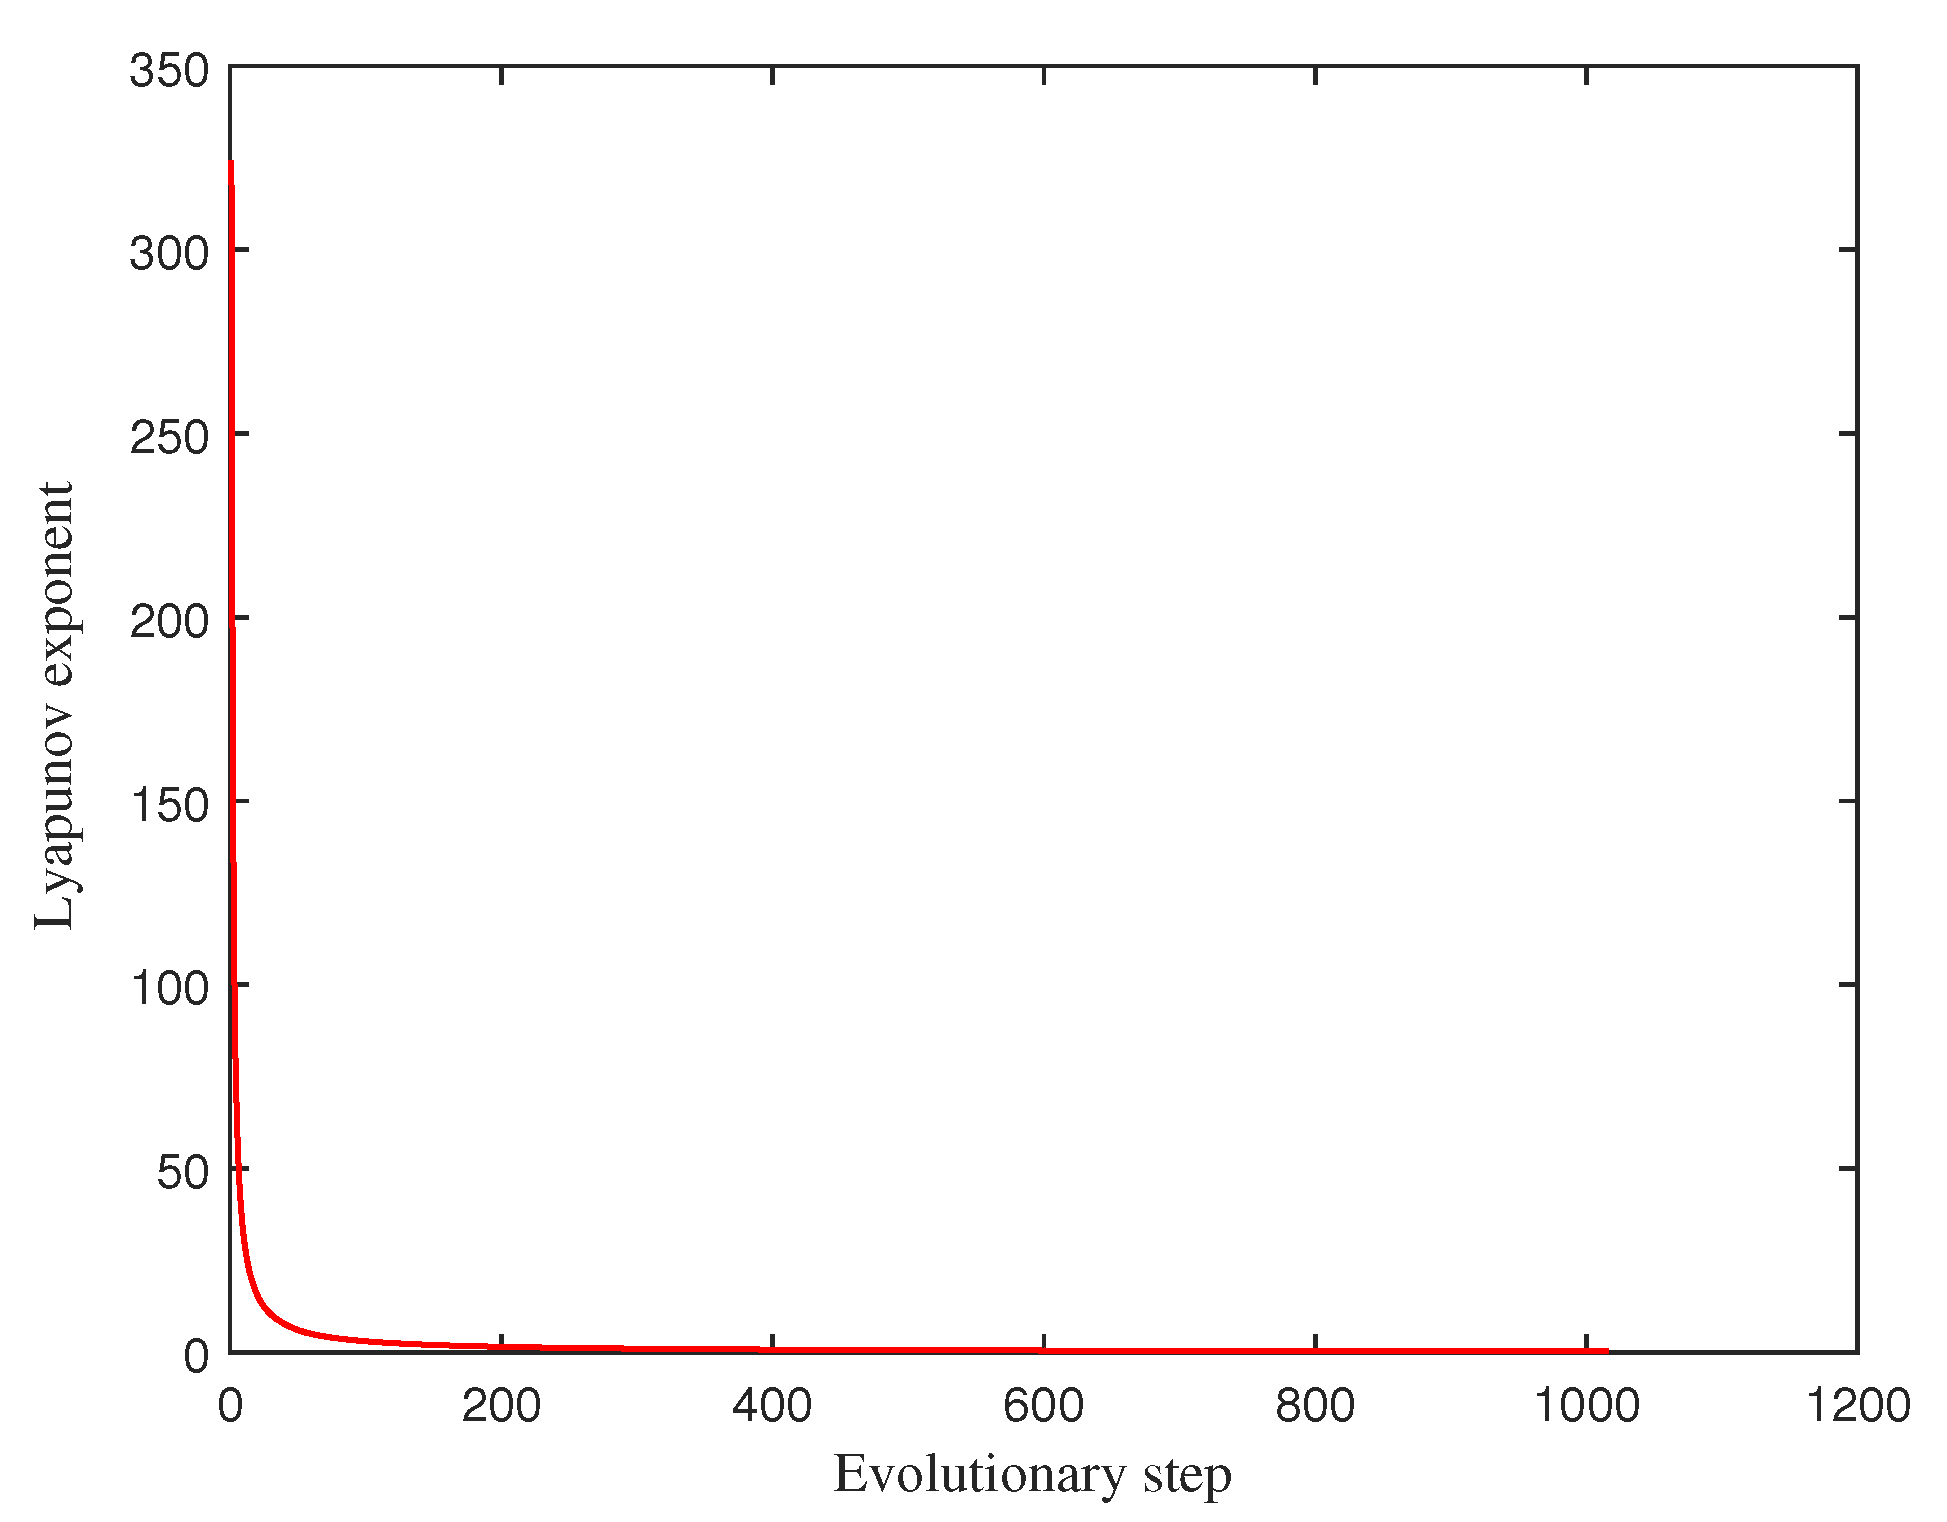
Figure 3 shows the LE value of the activity class “walking”. In Figure 3, the LE value is all positive, which indicates that the activity is in chaotic state.

2.4. Non-Linear Chaotic Features-Based Human Activity Recognition

Accounting for the shortcomings of the traditional time and frequency domain features for human activity recognition (i.e., high dimension), we propose a method of human activity recognition chaotic features-based, from the perspective of nonlinear chaotic dynamical. This method can ensure the accuracy, while reducing the computational complexity, with the specific implementation is as follows:
  • Data preprocessing. The Butterworth low-pass filter is used to separate gravity from the single-axis acceleration sensor data { x i } . In addition, we further use a sliding window with a window size 3s and an overlap rate of 50% in order to segment the sensor data.
  • Reconstructed phase space. We respectively leverage the C-C method and G-P algorithm in order to estimate the appropriate delay time τ and embedding dimension m. Additionally, the each activity phase space is reconstructed using Equation (4).
  • The feature matrix T construction. A two-dimensional chaotic feature matrix is constructed, where the chaotic feature is correlation dimension d and LLE of attractor trajectory in the Y.
  • Classification and recognition. The two different human activity classes, such as basic and transition activities, are classified and recognized by the machine learning algorithm.
Algorithm 1 shows the pseudo-code of specific implementation.
Algorithm 1 Pseudo-code of non-linear chaotic features-based human activity recognition
  • Input: A single-axis acceleration sensor data: { x i } . The length of series: n.
  • Output: the recognition rate.
  • 1: Data Pre-processing. The data filtering and silding window division
  • 2: Reconstructed phase space (Y)
  • 3: while a time series do
  • 4: calculate the delay tine τ by Equation (9)
  • 5: calculate the correlation dimension d by Equation (11)
  • 6: if m 2 d + 1 then
  • 7: get embedding dimension m
  • 8: endif
  • 9: Y = reconstitution( x i , m, τ , n)
  • 10: endwhile
  • 11: Feature space T
  • 12: for each phase space point Y ( t ) do
  • 13: calculate the largest Lyapunov exponent (LLE)
  • 14: endfor
  • 15: T = d , L L E
  • 16: the recogntion result

3. Experimental Results and Analysis

3.1. Experimental Materials and Methods

In this paper, we leverage a Human Activity Recognition datasets smartphone-based, from the HAPT Machine Learning Repository [28]. The dataset is collected using the built-in accelerometer and gyroscope sensor, and the sampling frequency is 50 Hz, from a group of 30 participants aged 19–48 years. Each participant wears a smartphone on the waist, and a total of 815,614 valid samples sensor data are collected. In order to improve the computational, we randomly choose 26,000 data as the experimental sample dataset. Following that, these accelerometer sensor signals are pre-processed by applying the Butterworth low-pass filter, and we further use a sliding window with a window size 3s and overlap rate of 50% in order to segment the sensor data. In particular, we analyze the nonlinear of these activity sensor data, and then chaotic features are extracted in the RPS, in order to realize the recognition of human activity. Specifically, these sensor data cover twelve activities in total, which is, these activities are divided into both the basic and transition activities. Besides, the basic activities contain walking, walking upstairs, walking downstairs, sitting, standing, and laying down, and the transition activities include standing-sitting, sitting-standing, sitting-laying down, laying down-sitting, standing-laying down, and laying down-standing, and these twelve activities are labelled A1–A12, respectively.

3.2. Experimental Results and Analysis

3.2.1. Reconstructed Phase Space

A dynamical system describes the temporal evolution process of a system, and the phase space can represent all possible states of a system that evolve over time. Therefore, we analyze the nonlinear dynamic features of the human activity from the dynamic system perspectives, and then reconstruct the activity time series into a phase space. More specially, the embedding dimension and delay time are both the premise of reconstructed phase space.
(1) delay time
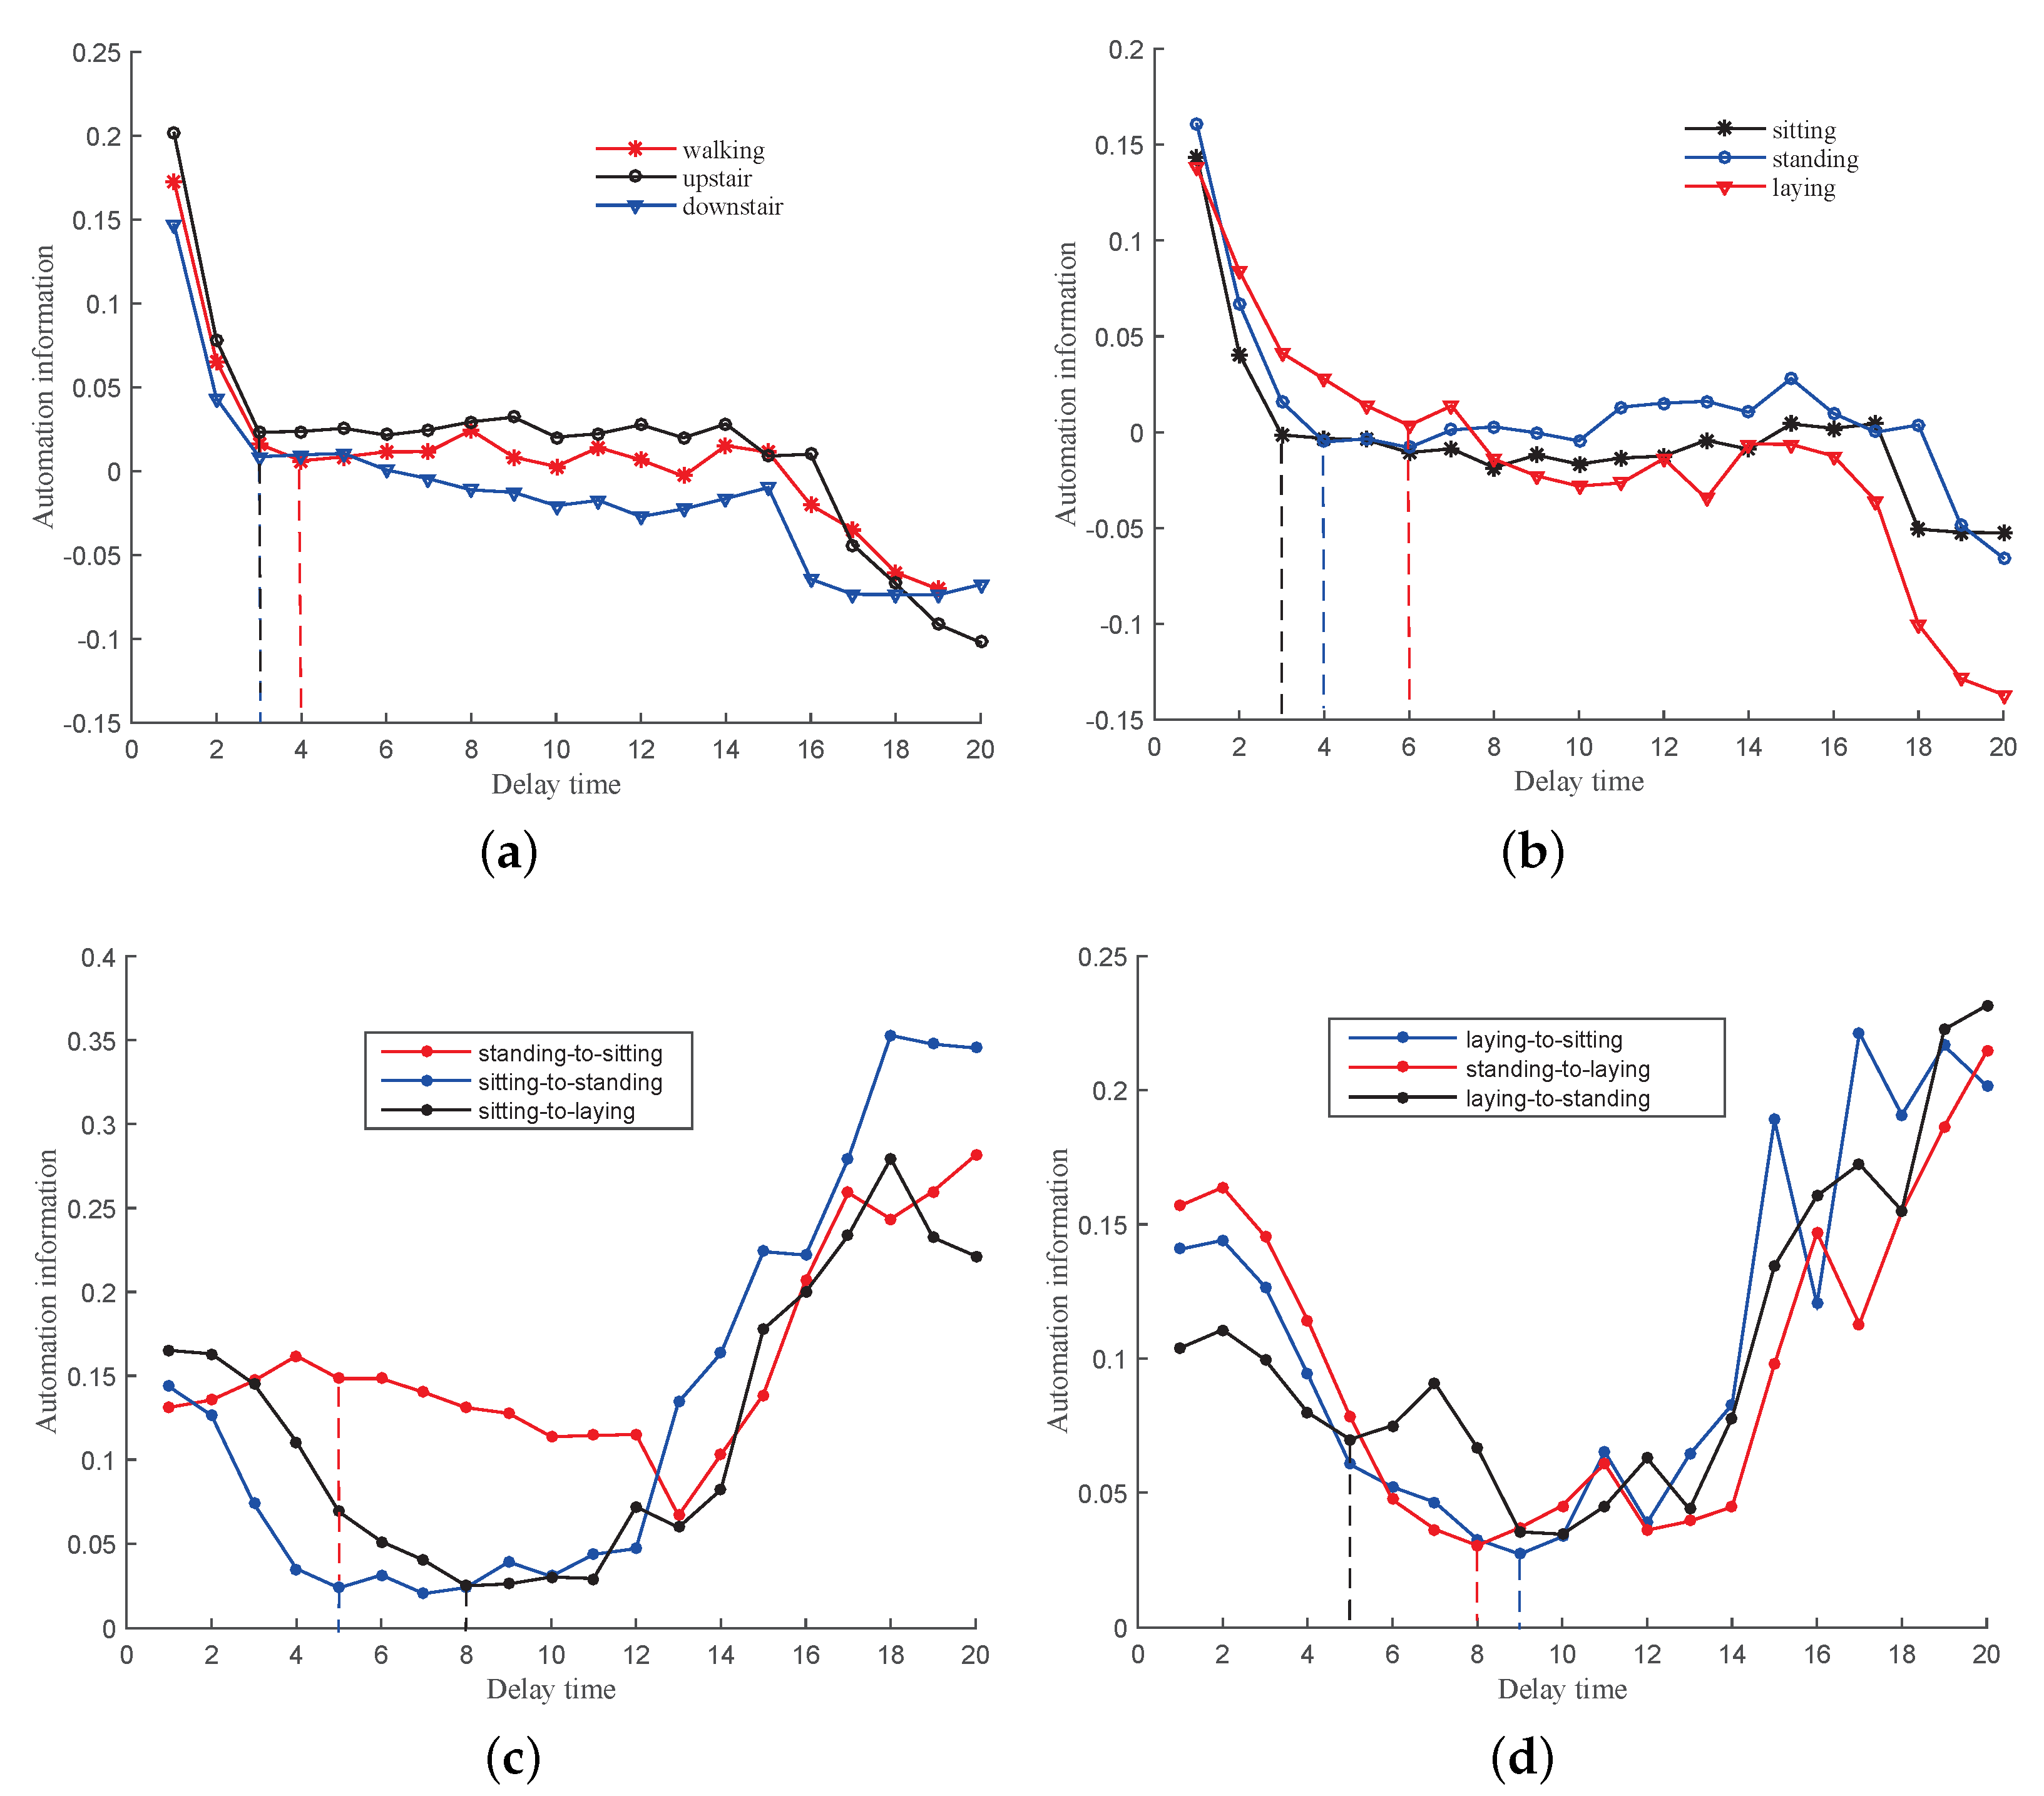
Figure 4 reveals the optimal delay time for the twelve activities, i.e., A1–A12, the abscissa represents the time delay. The C-C method looks for the first local minimum of Δ S or the first zero crossing of S as the first optimal delay time for activity. Furthermore, in order to avoid Δ S , various activities are covered in the same figure, and four experimental subfigures are used.
In Figure 4, for the basic activity A1, the first local minimum value Δ S is 4, which is, the optimal delay time is τ = 4, which the same as the activity type A5. Meanwhile, the appropriate delay time of three activities, e.g., A2, A3, and A4, is τ = 3, and the optimal delay time of activity A6 is τ = 6. In addition, for transition activity the A7 and A8, the statistics Δ S first local minimum value is 5, namely, the optimal delay time τ = 5; for activity A9, the appropriate delay time τ = 8, which is the same as the activity type A11. Besides, the optimal delay time of activity A10 and A12 is τ = 5 and τ = 9, respectively. Based on the C-C method, the optimal delay time of twelve activities is obtained.
(2) embedding dimension
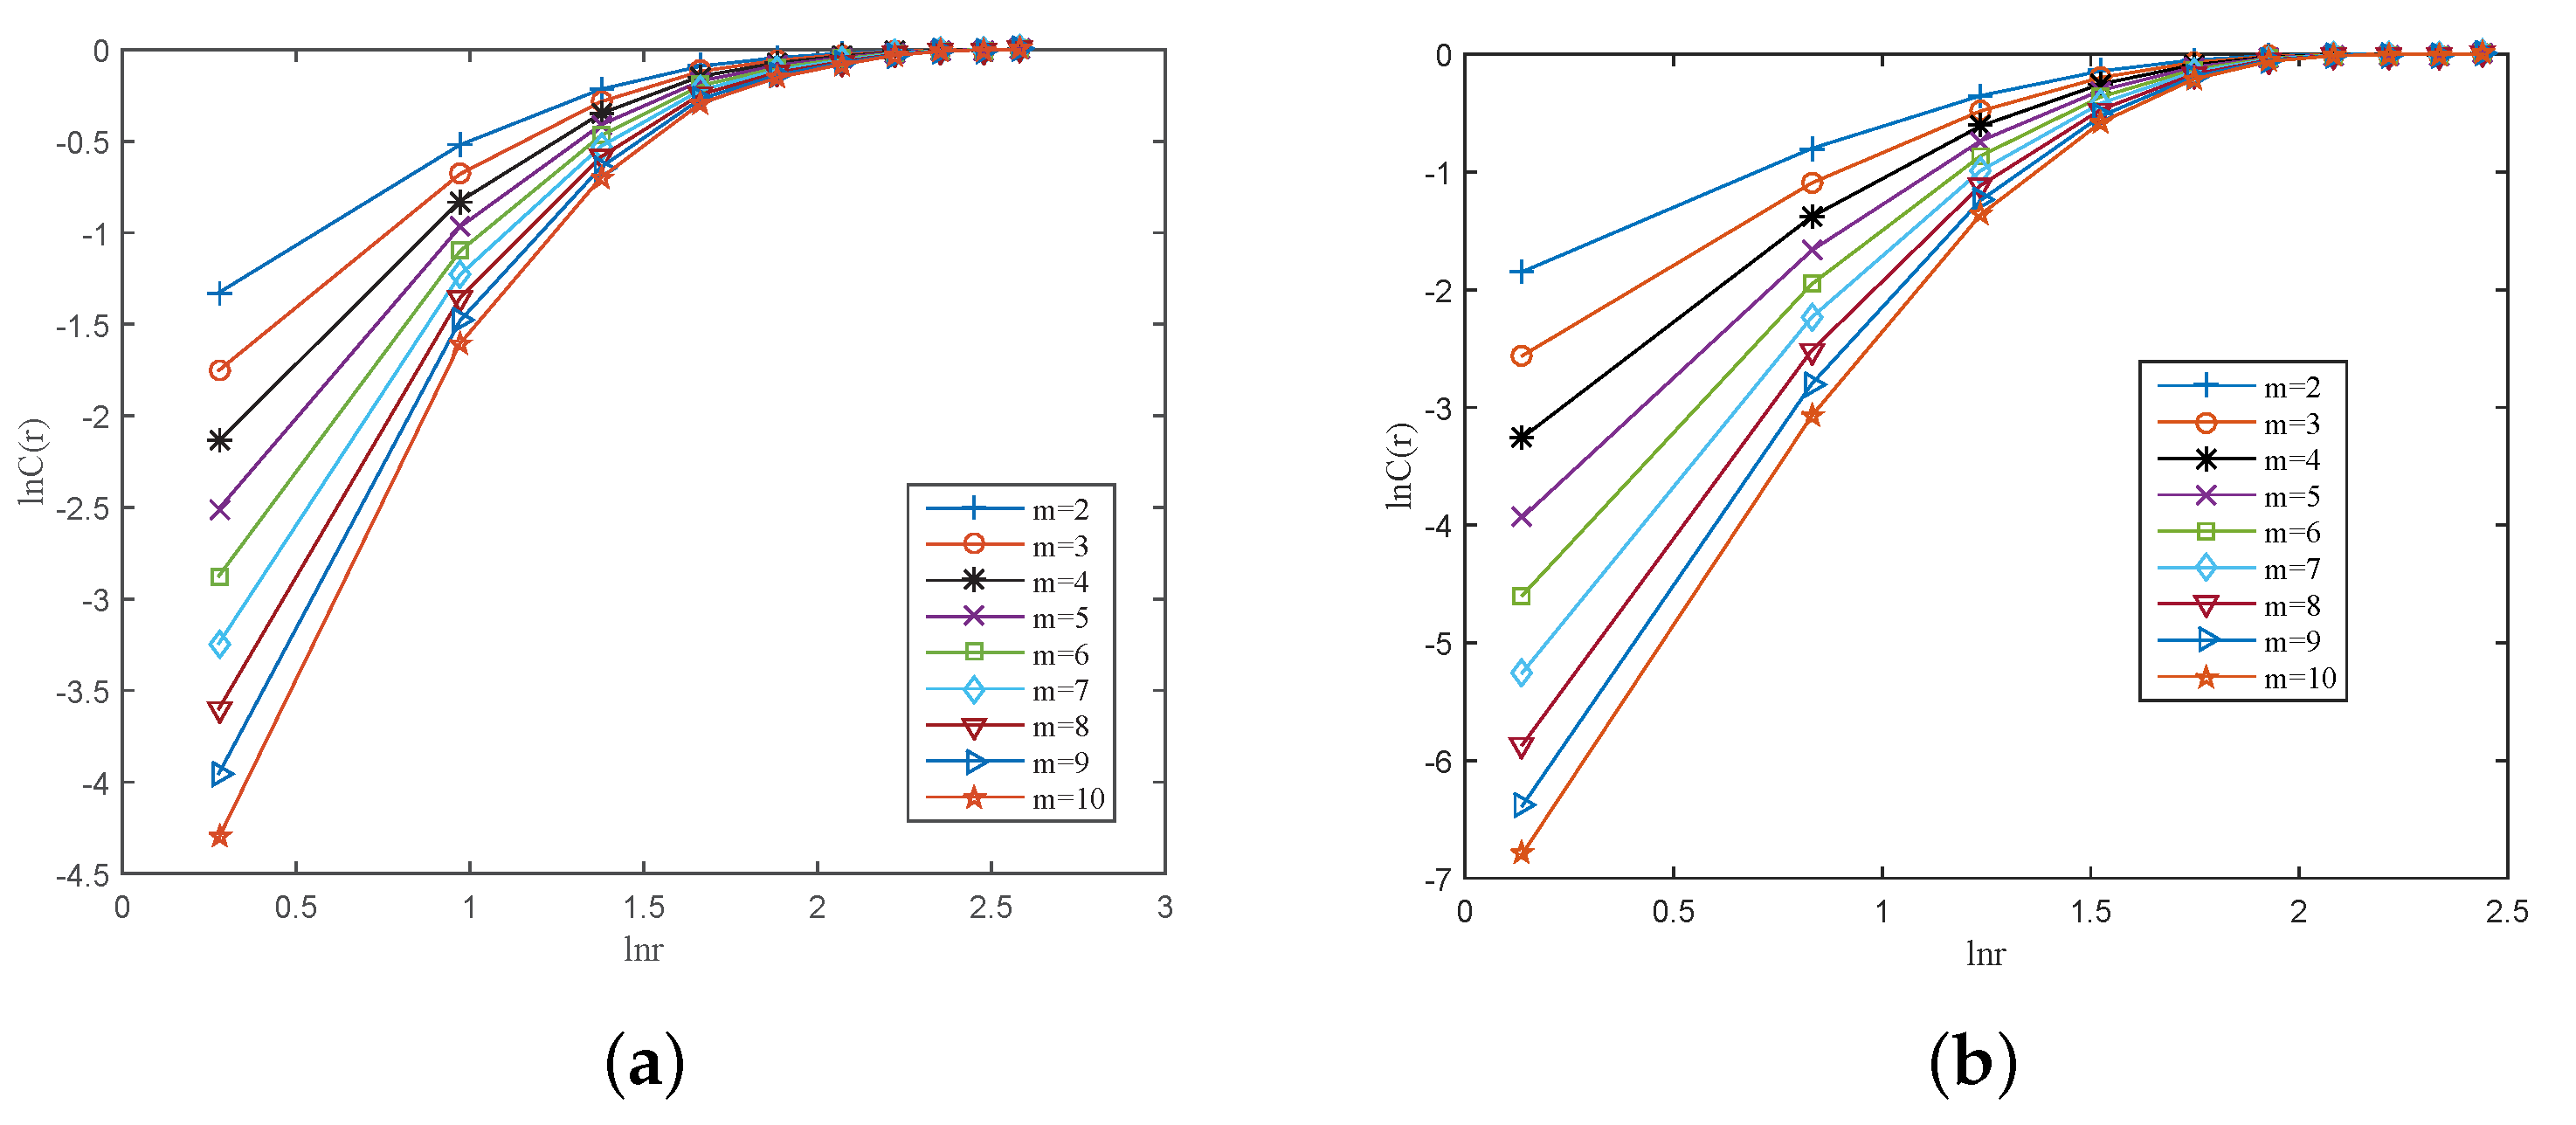
The optimal delay time is determined, as in Section 3.2.1 (1). Based on this, the appropriate embedding dimension of all activities is estimated by G-P algorithm. Taking the activity of both A1 and A10 as examples, which is, Figure 5 illustrates the corresponding double logarithmic coefficient relationship curve lnC(r)-ln(r). It can be seen from Figure 5 that no matter what kind of activity, when the embedding dimension m is smaller, the slope of the straight line part of the curve is smaller, and the interval distance between the two curves is larger. However, with the increase of m, the slope of the straight part gradually increases, but the interval between the two curves decrease. When the straight line part of the curve tends to be parallel, the corresponding value is the correlation dimension of the motion time series, which is, the lnC(r)-ln(r) relationship curve is in a saturated state. Specifically, the optimal embedding dimension of the all activity is estimated, according to Taken’s embedding theorem (i.e., m 2 d + 1 ).
Table 1 describes the estimates of the correlation dimension d and optimal embedding dimension m by the G-P algorithm of twelve human activities. In practice, fractal dimension is the attractor correlation dimension d of different activity types.
(3) Reconstructed phase space
We use the filtered sensor data along the x-axis to build RPS with the optimal delay time and embedding dimension, namely, the two parameters are used in order to build RPS for each activity. By reconstructing the phase space, the evolution discipline of chaotic attractors can be found, and it can also provide a new method and idea for the study of action time series. Figure 6 and Figure 7 reveal the three-dimensional attractor trajectories reconstructed of twelve activities, respectively.
It can be observed from Figure 6 that the chaotic attractor trajectory of the each activity sequence is twisted together around the origin of space, and the overall shape is roughly spherical or ellipsoidal. When comparing with the chaotic attractor trajectory of various activities, each activity has obvious differences between the size of the geometric structure and the spatial position. The chaotic attractors’ divergence degree of the activity, i.e., A1, A2, and A3, is significantly greater than the chaotic attractors of A4, A5, and A6. Moreover, the chaotic attractor of activity A1, A2, and A3 “attempt to escape” from the locus center are also more than those of activity A4, A5, and A6, which is consistent with the phenomenon that the activity amplitude is stronger and more complex.
In Figure 7, because the activities A7–A12 describe the transition process between different motions, for each activity, the variation of amplitude is small. Thus, the divergence of the chaotic attractor trajectory of transition activities A7–A12 is less than the basic activities type A1–A6. In addition, the chaotic attractor of activities A9, A10, A11, and A12 “attempt to escape” the center of trajectory more than the activities A7 and A8, which is related to the magnitude of motion amplitude in the process of action transition.
Specifically, because the attractor is the product of the global stability and local instability of the system, regardless of the basic activities or transition activities, for each activity class, although all of the motion outside the attractor converges to the central attractor, the motion within the attractor is mutually exclusive. After reconstructing the phase space of all activities, the LLE of each activity is estimated by the Wolf method, as revealed in Table 2. In practice, the LLE is greater than zero, and it quantitatively describes the chaotic motion state of singular attractor.

3.2.2. Experimental Results and Analysis

In the RPS model, we obtain the appropriate delay time τ , embedding dimension m, correlation dimension d, and the LLE of all human activity classes. Subsequently, both of the parameters, the correlation dimension and LLE, are used to construct the chaotic feature matrix T . In fact, each activity class has three groups one-dimensional motion time series (e.g., x, y, z); thus, there are three groups of two-dimensional chaotic feature matrices for each activity. Furthermore, in this work, the five classification algorithms, i.e., NB (Naive Bayesian), DT (Decision Tree), KNN (K-Nearest Neighbor), RF (Random Forest), and SVM (Support Vector Machines) are introduced in order to recognize the human activity. Additionally, for each input sample of various classification algorithms, the 10-fold cross validation is performed in order to test the accuracy of our method. Additionally, the recognition result is the three-axis average recognition rate.
After pre-processing and window division, the 26,000 experimental sample datasets are divided into 6847 test samples and the 16,794 training samples. Table 3 shows the recognition rate of the activities A1–A12 on five different classification algorithms. For the basic activities A1–A6, the average recognition rate is 96.80% on five classification algorithm, whereas the average recognition rate is 90.08% of the transitional activities A7–A12. Moreover, the two activity classes’ accuracy is the highest for SVM algorithm, in particular, the activity A2 (basic activity) achieved an accuracy of 100%. Besides, the accuracy of activity A11 (transition activity) is only 87.1% in the KNN algorithm. Generally, for five classification algorithms, the average accuracy of twelve activities is 96.28%, 97.27%, 97.23%, 97.02%, 96.49%, 96.50%, 89.4%, 89.62%, 89.8%, 90.08%, 90.28%, and 91.38%, in turn. Therefore, when comparing with the basic activities, for each classification algorithm, the accuracy of transition activities is lower. This is related to the short duration of transition activities, and the fact that all of the motion information may not be saved in a window period.
The recognition result of SVM is upper than other classification algorithms, as mentioned before. Thus, in order to further illustrate the effectiveness of chaotic features for human activity recognition, Table 4 reveals the confusion matrix result of all activities that are SVM algorithm-based. For basic activities, the average precision is 98.9% and the average recall is 99.1%, whereas the average precision and recall of transition activities are 92.1% and 90.26%, respectively. Thereby, no matter what kind of performance evaluation index, the result of basic activities is superior than the transition activities.
Usually, the time-frequency domain features (i.e., mean, standard deviation, maximum, minimum, discrete cosine transform, etc.), are extracted as features of human activity recognition. Therefore, we further compare and analyze our work with the time-domain features for HAPT dataset. Specifically, the four time-domain features (e.g., mean, maximum, standard, and minimum) are extracted from the x, y and z three-axes, separately, which is, each activity is constructed by three groups of four-dimensional feature matrices. Similarly, the above five classification algorithms are used to recognize these activities. Figure 8 shows the comparison of basic and transition activities, respectively. In Figure 8a, that is, for basic activities, the recognition rate of chaotic feature is about 4.1% better than the time-frequency domain features; in addition, the accuracy of transition activities is about 4.8% higher, as seen in Figure 8b. Furthermore, when comparing with the time and frequency domain features, the time of reconstructed phase space is three to four times less.
We also compare our work with the literature [3]. Table 5 presents a comparative analysis. We compare both extracted features and activity class for each work. The literature focuses on the RPS, Gaussian Mixture Model (GMM), and Maximum Likelihood Classifier (MLE) method, the six basic activities on UCI [29] dataset are recognized, and the accuracy is 90%. However, in this work, the correlation dimension and LLE of the attractor structure in RPS are constructed as features, the overall accuracy of six basic activities is 96.8%, which is 6.8% higher than the literature [3]. In addition, the six transition activities are also recognized and the overall accuracy is 90.08%.

4. Conclusions

In this work, aiming at the problem of the traditional time and frequency domain features for human activity recognition, when considering the nonlinear features of human motion time series, this paper proposes a method of human activity recognition that is based on non-linear chaotic features. It focuses on how to compute the optimal delay time and embedding dimension of reconstructed phase space, and also establish the feature matrix by correlation dimension and largest Lyapunov exponent. The experimental results show that the chaotic feature has a higher accuracy when compared to existing approaches. In the future, we will consider the combination of chaos theory and deep learning technology. The phase space reconstruction technology is used in order to represent the action time series as vectors, and then classify and recognize them by deep learning.

Author Contributions

P.T. contributed the main idea of proposed algorithm and wrote the paper. J.L. organized and supervised the research schedule. H.W. conducted the simulations. T.C. validated the idea to the work. K.W. helped to improve the quality of the work. All authors have read and agreed to the published version of the manuscript.

Funding

This research was funded by the National Key Research and Development Plan (No. 2017YFB1402103), the National Natural Science Foundation of China (No. 61971347, No. 61801379), Project of Xi’an science and technology planning foundation (201805037YD15CG21(4)).

Conflicts of Interest

The authors declare no conflict of interest.

References

  1. Zhang, Y.; Tian, G.; Zhang, S.; Li, C. A Knowledge-Based Approach for Multiagent Collaboration in Smart Home: From Activity Recognition to Guidance Service. IEEE Trans. Instrum. Meas. 2019, 69, 1–13. [Google Scholar] [CrossRef]
  2. Torres, C.; Alvarez, A. Accelerometer-Based Human Activity Recognition in Smartphones for Healthcare Services. Mob. Health 2015, 5, 147–169. [Google Scholar]
  3. Md, G.; Taskina, F.; Richard, J.; Roger, S.; Muhammad, A.; Ahmed, J.; Sheikh, A. A light weight smartphone based human activity recognition system with high accuracy. J. Netw. Comput. Appl. 2019, 147, 59–72. [Google Scholar]
  4. Terry, U.; Vahid, B.; Dana, K. Exercise Motion Classification from Large-Scale Wearable Sensor Data Using Convolutional Neural Networks. In Proceedings of the IEEE International Workshop on Intelligent Robots and Systems (IROS), Vancouver, BC, Canada, 24–28 September 2017; pp. 2385–2390. [Google Scholar]
  5. Wang, A.; Chen, G.; Yang, J.; Zhao, S.; Chang, C. A Comparative Study on Human Activity Recognition Using Inertial Sensors in a Smartphone. IEEE Sens. J. 2016, 19, 4566–4578. [Google Scholar] [CrossRef]
  6. Chen, Y.; Shen, C. Performance Analysis of Smartphone-Sensor Behavior for Human Activity Recognition. IEEE Access 2017, 5, 3095–3110. [Google Scholar] [CrossRef]
  7. Qin, Z.; Zhang, Y.; Meng, S.; Qin, Z.; Kim, C. Imaging and fusing time series for wearable sensor-based human activity recognition. Inf. Fusion 2020, 53, 80–87. [Google Scholar] [CrossRef]
  8. Guan, Y.; Thomas, P. Ensembles of deep lstm learners for activity recognition using wearables. ACM 2017, 1. [Google Scholar] [CrossRef] [Green Version]
  9. Quaid, M.; Jalal, A. Wearable sensors based human behavioral pattern recognition using statistical features and reweighted genetic algorithm. Multimed. Tools Appl. 2019, 79, 1–23. [Google Scholar] [CrossRef]
  10. Ahmad, J.; Majid, A.; Abdul, S. Wearable Sensor-Based Human Behavior Understanding and Recognition in Daily Life for Smart Environments. In Proceedings of the 2018 International Conference on Frontiers of Information Technology (FIT), Islamabad, Pakistan, 17–19 December 2018; pp. 105–110. [Google Scholar]
  11. Zhu, Q.; Chen, Z.; Soh, Y. A Novel Semisupervised Deep Learning Method for Human Activity Recognition. IEEE Trans. Ind. Inform. 2019, 15, 3821–3830. [Google Scholar] [CrossRef]
  12. Zhang, H.; Xiao, Z.; Wang, J.; Li, F.; Szczerbicki, E. A Novel IoT-Perceptive Human Activity Recognition (HAR) Approach Using Multihead Convolutional Attention. IEEE Internet Things J. 2020, 7, 1072–1080. [Google Scholar] [CrossRef]
  13. Nguyen, T.; Dong, S. Utilization of Postural Transitions in Sensor-based Human Activity Recognition. In Proceedings of the International Conference on Artificial Intelligence in Information and Communication (ICAIIC), Fukuoka, Japan, 19–21 February 2020; pp. 177–181. [Google Scholar]
  14. Ignatov, A. Real-time human activity recognition from accelerometer data using Convolutional Neural Networks. Appl. Soft Comput. 2018, 61, 915–922. [Google Scholar] [CrossRef]
  15. Saad, S.; Arslan, B. Chaotic invariants for human action recognition. In Proceedings of the IEEE 11th International Conference on Computer Vision, Rio de Janeiro, Brazil, 14–21 October 2007. [Google Scholar]
  16. Jordan, F.; Shie, M.; Doina, P. Activity and Gait recognition with time-delay embeddings. In Proceedings of the Thirty-Fourth AAAI Conference on Artificial Intelligence, New York, NY, USA, 7–11 February 2020; pp. 407–408. [Google Scholar]
  17. Kawsar, F.; Hasan, M.K.; Love, R.; Ahamed, S.I. A Novel Activity Detection System Using Plantar Pressure Sensors and Smartphone. In Proceedings of the IEEE Computer Software and Applications Conference, Taichung, Taiwan, 1–5 July 2015; pp. 44–49. [Google Scholar]
  18. Bao, J.; Ye, M.; Dou, Y. Mobile phone-based internet of things human action recognition for E-health. In Proceedings of the IEEE 13th International Conference on Signal Processing (ICSP), Chengdu, China, 6–10 November 2016; pp. 957–962. [Google Scholar]
  19. Kim, D.H.; Park, J.S.; Kim, I.Y.; Kim, S.I.; Lee, J.S. Personal recognition using geometric features in the phase space of electrocardiogram. In Proceedings of the IEEE Life Sciences Conference (LSC), Sydney, NSW, Australia, 13–15 December 2017; pp. 198–201. [Google Scholar]
  20. Li, Y.; Song, Y.; Li, C. Selection of parameters for phase space reconstruction of chaotic time series. In Proceedings of the IEEE Fifth International Conference on Bio-Inspired Computing: Theories & Applications, Changsha, China, 23–26 September 2010. [Google Scholar]
  21. Takens, F. Detecting strange attractors in turbulence. In Dynamical Systems and Turbulence, Warwick; Springer: Berlin, Germany, 1981; pp. 366–381. [Google Scholar]
  22. Fang, S.; Chan, H. Qrs detection-free electrocardiogram biometrics in the reconstructed phase. Pattern Recognit. Lett. 2013, 34, 595–602. [Google Scholar] [CrossRef]
  23. Michael, T.; James, J.; Carlo, T. A practical method for calculating largest Lyapunov exponents from small data sets. Phys. D Nonlinear Phenom. 1993, 65, 117–134. [Google Scholar]
  24. Kim, H.; Eykholt, R.; Salas, J. Nonlinear dynamics, delay times, and embedding windows. Phys. D Nonlinear Phenom. 1999, 127, 48–60. [Google Scholar] [CrossRef]
  25. Grassberger, P.; Procaccis, I. Measuring the strangeness f strange attractors. Phys. D Nonlinear Phenom. 1983, 9, 189–208. [Google Scholar] [CrossRef]
  26. Leng, X.; Chen, H.; Li, P.; Liu, X. Research of chaotic characteristics of low-voltage air arc. J. Eng. 2019, 16, 2484–2487. [Google Scholar] [CrossRef]
  27. Wolf, A.; Swift, B.; Swinney, L.; Vastano, A. Determining Lyapunov exponents form a time series. Phys. D Nonlinear Phenom. 1985, 16, 285–317. [Google Scholar] [CrossRef] [Green Version]
  28. HAPT. Available online: http://archive.ics.uci.edu/ml/datasets/Smartphone-Based+Recoginition+of+Human+Activities+and+Postural+Transitions (accessed on 19 August 2020).
  29. UCI. Available online: https://archive.ics.uci.edu/ml/datasets/Human+Activity+Recoginition+Using+Smartphones (accessed on 19 August 2020).
Figure 1. Power-spectrum distribution of activity “walking”.
Electronics 10 00111 g001
Figure 2. A dynamical chaotic features model-based for Human activity recognition (HAR) framework.
Electronics 10 00111 g002
Figure 3. The Lyapunov exponent (LE) value of the activity class “walking”.
Electronics 10 00111 g003
Figure 4. The Δ S distribution by C-C method. (a) A1–A3; (b) A4–A6; (c) A7–A9; and, (d) A10–A12.
Electronics 10 00111 g004
Figure 5. Double logarithmic coefficient relationship curve lnC(r)-ln(r). (a) A1; (b) A10.
Electronics 10 00111 g005
Figure 6. Reconstructed Phase Space (RPS) with basic activities. (a) A1; (b) A2; (c) A3; (d) A4; (e) A5; and, (f) A6.
Electronics 10 00111 g006
Figure 7. RPS with transitional activities. (a) A7; (b) A8; (c) A9; (d) A10; (e) A11; (f) A12.
Electronics 10 00111 g007
Figure 8. Comparison of recognition result. (a) basic activity; (b) transition activity.
Electronics 10 00111 g008
Table 1. The correlation dimension and embedding dimension of all activities.
Activity Typedm
A11.77565
A21.95435
A32.11526
A40.65083
A50.56243
A60.27542
A71.15774
A81.47464
A91.96835
A101.37714
A111.71475
A121.56815
Table 2. The largest Lyapunov exponent (LLE) of all activities.
Activity TypeA1A2A3A4A5A6A7A8A9A10A11A12
LLE2.1802.0802.1251.9912.0141.9801.9552.0252.0132.0122.0232.014
Table 3. The accuracy of different activities.
Activity TypeFive Classification AlgorithmsAverage Accuracy
SVMNBDTKNNRF
A198.34%97.26%93.84%94.48%97.48%96.28%
A2100%97.77%95.65%96.57%96.37%97.27%
A398.42%98%97.48%95.79%96.47%97.23%
A498.46%98.35%95.36%97.46%95.47%97.02%
A599.63%96.65%96.64%94.64%94.90%96.49%
A698.95%95.29%98.10%95.28%94.89%96.50%
A792.30%89.00%87.60%89.00%89.10%89.40%
A891.90%88.90%89.00%88.30%90.00%89.62%
A990.50%90.40%87.70%90.00%90.40%89.80%
A1092.20%88.80%89.60%88.20%91.60%90.08%
A1192.70%89.90%90.70%87.10%91.00%90.28%
A1293.00%87.60%92.60%90.80%92.90%91.38%
Table 4. The confusion matrix Support Vector Machines (SVM) algorithm-based.
Activity TypeA1A2A3A4A5A6A7A8A9A10A11A12Recall
A111500700000000099.3%
A2171108500000000098.0%
A360102200000000099.4%
A40009414000000099.5%
A500014946000000098.5%
A60030099300000099.6%
A7000100955001093.1%
A8000003372000092.3%
A90000000010004195.2%
A10000005020972488.1%
A110000005090121188.9%
A12001003001838484.0%
Precision98.3%100%98.4%98.5%99.6%98.9%92.3%91.9%90.5%92.2%92.7%93.0%
Table 5. The LLE of all activities.
Related MethodFeatureActivity ClassRecognition Rate
Literature [3]embedding dimension, delay timeA1–A690%
Our workcorrelation dimension, Lyapunov exponentA1–A696.80%
A7–A1290.08%
Publisher’s Note: MDPI stays neutral with regard to jurisdictional claims in published maps and institutional affiliations.