Abstract
A test oracle is a procedure that is used during testing to determine whether software behaves correctly or not. One of most important tasks for a test oracle is to choose oracle data (the set of variables monitored during testing) to observe. However, most literature on test oracles has focused either on formal specification generation or on automated test oracle construction, whereas little work exists for supporting oracle data selection. In this paper, we present a path-sensitive approach, PSODS (path-sensitive oracle data selection), to automatically select oracle data for use by expected value oracles. PSODS ranks paths according to the possibility that potential faults may exist in them, and the ranked paths help testers determine which oracle data should be considered first. To select oracle data for each path, we introduce quantity and quality analysis of oracle data, which use static analysis to estimate oracle data for their substitution capability and fault-detection capability. Quantity analysis can reduce the number of oracle data. Quality analysis can rank oracle data based on their fault-detection capability. By using quantity and quality analysis, PSODS reduces the cost of oracle construction and improves fault-detection efficiency and effectiveness. We have implemented our approach and applied it to a real-world project. The experimental results show that PSODS is efficient in helping testers construct test oracles. Moreover, the oracle datasets produced by our approach are more effective and efficient than output-only oracles at detecting faults.
1. Introduction
Testing is one of the most important processes in software development. There are two activities to be performed when testing software: executing a program under test using test data and determining if the program executes correctly. Test data determine what behavior the program will exhibit when it is executed, and a considerable amount of research focuses on automatic test data generation to exhibit more behaviors [1,2]. Nevertheless, it is not enough for a testing process to obtain only the program behaviors; more effort is required to determine whether the behaviors are correct. However, compared to many aspects of test automation, the test oracle problem is still recognized as one of the most difficult problems and remains comparatively less well-solved [3,4].
Oracle data (for details, see Section 2.2) comprise a set of variables monitored during testing. The output-only oracle that specifies output variables as oracle data is the most common type of test oracle [5]. Nevertheless, in some cases, faults leading to incorrect states do not always propagate and manifest themselves as failures and may vanish before they reach output variables [6]. Except for the propagation problems of output-only oracles, it is difficult to determine the expected values of the output of programs under test because of the complexity of programs [7]. Thus, in practice the output-only oracle is not always a good solution, since it is necessary to observe both output variables and internal variables during test oracle process. When we construct a test oracle, the more oracle data a test oracle contains, the more powerful the test oracle is in detecting faults [8,9,10]. However, it is not feasible to monitor all variables (including all the output variables and internal variables) during testing because of the high cost of constructing test oracles. Furthermore, in some cases, because of the lack of formal specifications, testers have to construct test oracles manually, and manually determining oracle data is a very time-consuming and expensive process.
Based on the above analysis, it is very necessary to select oracle data before constructing a test oracle [10,11,12]. A test oracle uses inputs and corresponding expected values to construct an oracle. Each input corresponds to an execution, and an execution corresponds to a program path. In a sense, a test oracle can be treated as a path-sensitive mechanism. Path-oriented oracle data selection is more conducive to the subsequent oracle construction.
In this paper, we present PSODS (path-sensitive oracle data selection), a path-sensitive oracle data selection approach to support testers for the test oracle construction. Since the ultimate goal of a test oracle is to detect faults in the program [13], PSODS aims at estimating the capability of each path and each oracle data on detecting faults and providing testers with recommendations regarding what oracle data should consist of. We propose critical path analysis (for details, see Section 2.1) to analyze paths. Critical path analysis ranks paths based on their possibility that potential faults may exist in them. For the ranked path, PSODS analyses oracle data in each path to determine the substitution relationships between oracle data and their fault-detection capability. Finally, PSODS selects the minimum set of oracle data for each path and ranks the oracle data in each set. The number of oracle data in each set is reduced according to the substitution relationships between oracle data, and the oracle data in each set are ranked based on their fault-detection capability. By providing testers the ranked oracle data, the tester can maximize the fault finding potential of testing with minimal efforts.
We present an empirical study in which we evaluated the capabilities of PSODS and compared our approach with the output-only oracle. We evaluated PSODS on a real-world project single. The evaluations show promising results in terms of fault finding efficiency. In addition, the results show that PSODS is more effective than the output-only oracle in fault detection. PSODS can find faults that the output-only oracle has difficulty in finding. According to our experimental results, PSODS is clearly more effective and efficient at detecting faults.
The contributions of this paper are as follows.
(1) We propose a critical path analysis approach to rank program paths before selecting oracle data. Paths are ranked based on the possibility that potential faults may exist in them. The ranked path can provide useful insights to testers during oracle construction. Furthermore, path-sensitive oracle data selection is more conducive to the subsequent oracle construction.
(2) We propose a quantity and quality analysis approach to select oracle data. The quantity analysis reduces the number of oracle data for each path based on their substitution relationships. The quality analysis ranks oracle data in accordance with the fault-detection capability.
(3) We evaluate the proposed PSODS using a real-world project. From our experimental results, we observe that PSODS is able to select oracle data and is more effective and efficient than an output-only oracle at detecting faults.
2. Our Approach
To make oracle construction easier and maximize the potential return on testers’ efforts, we propose a path-sensitive oracle data selection approach, PSODS. PSODS uses critical path analysis to rank paths in accordance with their relevance to potential faults. The ranked paths not only provide information on oracle construction order for testers but also partition oracle data to facilitate the oracle construction. PSODS uses quantity and quality analysis to select oracle data; the quantity and quality analysis determines a minimal set of oracle data that is likely to detect faults during testing.
An overview of PSODS is shown in Figure 1. PSODS consists of two major components: (1) critical path analysis. (2) quantity and quality analysis. In the following, we describe the two major components separately.
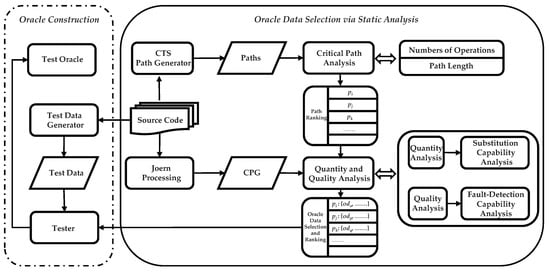
Figure 1.
Overview of Our Approach.
2.1. Critical Path Analysis
To perform path-sensitive oracle data selection, PSODS begins with critical path analysis. Critical paths are paths that are more likely to have potential faults. The paths that PSODS deals with are generated by CTS [14,15], which is a code testing system for C programs. CTS selects paths by traversing a control flow graph (CFG). The path selected by CTS is an ordered sequence of nodes of CFG (CTS adopts some strategies to alleviate the path explosion problem, such as using bounded iteration to deal with loops).
To estimate the possibility that potential faults exist in each path, we introduce the critical path analysis (CPA). CPA sets a weight for each path. The weight is calculated according to two factors, which are the number of operations in paths and path length. Operations include normal operations and high-risk operations (more details can be found in Section 2.1.1). Normal operations here refer to operations that contain arithmetic operators, relational and logical operators and so on. CPA assumes that more normal operations mean a higher possibility that potential faults exist. High-risk operations are operations that may cause vulnerability, such as buffer overflow caused by library calls. A vulnerability can be exploited by an attacker to alter the normal behavior of the program. Improper use of high-risk operations can trigger errors or even crashes. Therefore, CPA assumes that the more high-risk operations in the path there are, the more likely it is to contain faults [16]. Since long paths usually have a higher possibility that potential faults exist, CPA takes path length as a complement to the factor of the number of operations.
The number of operations is calculated by simply using a pattern matching strategy. The length of a path can be derived from calculating the number of CFG nodes in the path. As a result, CPA could be finished in a short time. After CPA determines the weight for each path, CPA ranks paths based on their weight. PSODS first analyzes the path with the highest weight to select oracle data. Testers construct the oracle in the order of the ranked paths, which may help to find faults faster.
2.1.1. Numbers of Operations
To calculate the number of operations in the program, we should first determine which operations to analyze. In this paper, we divide operations into normal operations and high-risk operations.
Normal operations. Normal operation refers to operations that contain arithmetic operators, relational and logical operators, increment and decrement operators or bitwise operators. For a given path, CPA sums the number of these operators to obtain the number of normal operations.
High-risk operation. High-risk operations include function operations and pointer operations. Function operations refer to security-critical library functions, whose parameters have to satisfy a condition to ensure the security of a program. Take strcpy(buf,str) as an example. According to the standard of C programming language (ISO/IEC 9899:1999 (E)), if the length of the str copied to the buf using strcpy exceeds the capacity of the buf, then an overflow error occurs. Paths with functions such as strcpy may have vulnerability problems. Therefore, the number of function operations is used to estimate the probability that potential faults exist and helps to decide which path should be observed first.
Pointer operations refer to operations containing a dereferencing operator. The pointer needs to satisfy the nonnull requirement when dereferencing. If the dereferencing operator acts on a null pointer, an error occurs. More pointer operations mean a higher possibility that potential faults exist.
Table 1 lists library functions that are well known to be “high-risk” (here we only present three popular functions according to our investigation [17]) and the pointer operation.

Table 1.
List of High-risk Operations.
2.1.2. Path Length
Long paths usually contain more variables and operations and are therefore more prone to faults, therefore, constructing a test oracle for the long path first helps testers find faults faster.
After CPA completes the analysis of the current path, we can obtain the number of operations and the length of the current path. Then, we use Equation (1) to calculate the weight of the current path.
represents the weight of the current analysis path. represents the number of operations in the current analysis path. represents the length of the current analysis path. and are parameters on adjusting the impact of and , respectively, and . To obtain a good performance, we empirically investigate the impact of and in the evaluation section. CPA ranks paths based on the of each path.
CPA can provide a ranked paths set. These paths are used in subsequent quantity and quality analysis. The quantity and quality analysis starts from the path with a high weight. After the quantity and quality analysis completes the analysis for all the paths, each path can obtain an oracle dataset. Oracle datasets are ranked in accordance with the corresponding path weights, and the oracle dataset that corresponds to the path with a high weight is given priority to testers.
2.2. Quantity and Quality Analysis
PSODS introduces a path-sensitive analysis—quantity and quality analysis of oracle data, which can select oracle data from a program and provide ranked oracle data for testers. In this section, we describe the details of the quantity and quality analysis.
As described in the previous section, it is not feasible to monitor all variables during testing because of the high cost of constructing a test oracle. Therefore, we need to select some variables as oracle data. The quantity analysis can reduce the cost of oracle construction by reducing the number of oracle data, to help testers find faults faster, it is very necessary to know which oracle data should be dealt with first. To solve this problem, we use the quality analysis to estimate the fault-detection capability of oracle data, and oracle data are ranked based on their fault-detection capability. Dependence relationships [18] exist between oracle data; therefore, data can flow from one oracle data to another oracle data. If oracle data have erroneous values, then these erroneous values may propagate to further uses. We can observe values of oracle data to detect faults resulting from other oracle data. The basis for oracle data selection is that erroneous values can propagate from one oracle data to another oracle data.
Furthermore, the fault-detection capability of oracle data is different. There are two main reasons for the difference of fault-detection capability. First, some oracle data depend on more oracle data than other oracle data, that is, their values are influenced by many other oracle data. As a result, oracle data such as these are more likely to contain erroneous values and have a strong fault-detection capability. Second, the number of computations between oracle data that have dependence relationships influences the propagation of faults. The reason is that the erroneous values may vanish before they reach observed oracle data. The likelihood that an erroneous value will propagate to the oracle data decreases as the number of computations between oracle data that have dependence relationships increases. Therefore, the fault-detection capability of oracle data may vary with the number of computations. Since the fault-detection capability of oracle data is different, we use the quality analysis to estimate the fault-detection capability and rank oracle data based on their fault-detection capability.
Before describing the details of the quantity and quality analysis, we first introduce some definitions.
Oracle data comprise a set of variables monitored during testing. Oracle data can be represented as a two-tuple: . represents an oracle data, which is composed of a variable and its observation position. p represents the observation position of the variable. v represents the variable in the program under test. In this paper, refers to the variable defined at a statement (here defining a variable refers to the definition in the definition-use concept [18], that is, a variable is assigned a value). In other words, the observation position p is only at the assignment statement in the program, the variable v is the assigned variable in the assignment statement, and p and v form . In addition, although variables may be defined more than once, the definition position is different; thus, these variables are different oracle data according to the definition of . All the in the current path constitute the candidate oracle dataset.
A program dependence graph (PDG) is a directed graph whose nodes represent program statements and whose edges represent data and control dependencies [19]. PDG can be expressed as . V represents the vertex which is statements and predicate expressions. E refers to the edge which represents data dependence and control dependence between vertexes. The edges in E may be partitioned into two graphs. Edges that represent data values on which a vertex depends form the data dependence graph (DDG). Edges that represent control conditions on which a vertex depends form the control dependence graph (CFG) [20].
A property graph a directed, edge-labeled, attributed multigraph, where sets of properties are attached to nodes and edges. A property graph can be represented as a four-tuple , where V is a set of nodes, is a multiset of directed edges, is a label function, and ∑ is a set of edge labels. Properties can be assigned to edges and nodes by the function where K is a set of property keys and S the set of property values [21].
A code property graph (CPG) [22] is a joint data structure, which is a property graph constructed from the AST (abstract syntax tree), CFG and PDG of source code with
and
.
2.2.1. Performing Static Analysis to Generate CPG
PSODS is a path-sensitive approach; the static analysis for oracle data selection is performed path by path. The path is an ordered sequence of nodes of the control flow graph, and it can provide control relationships between statements. However, only obtaining control relationships is not enough, since we need the data dependence information between variables to estimate their fault-detection capability and quantify their substitution relationships. CPG can provide not only control dependence information but also data dependence information. Therefore, PSODS can perform quantity and quality analysis by traversing along the sequence of nodes in the path.
CPG is generated in accordance with the result of program analysis. In this paper, we use an off-the-shelf tool-joern-to generate CPG. Joern is a tool for robust analysis of C/C++ code [22]. Joern allows analyzing C/C++ code bases and stores information about the code in the code property graph. In our approach, the joern implementation is extended as a component of PSODS, such that PSODS can obtain the control relationships and dependence information by querying the code property graph.
2.2.2. Quantity Analysis
Constructing a test oracle is an important step during testing. Since it is not feasible to monitor all variables (candidate oracle data) when constructing the test oracle, we need to select some variables as oracle data. Erroneous values in program variables propagate to further uses during program execution; therefore, observing the variable in candidate oracle data can detect faults resulting from oracle data that have a dependence relationship with the observed candidate oracle data. This substitutability between oracle data makes quantity analysis possible. PSODS uses the quantity analysis to reduce the number of oracle data. By reducing the number of oracle data, the cost of constructing oracles is reduced.
The basis of quantity analysis is that there are dependencies between statements. A statement is data-dependent on a statement if contains a definition of a variable v and uses v and there is a path in the program from to on which v is not redefined. and can also be called a definition-use pair. Since is data-dependent on , the value can propagate from to . According to our definition of oracle data, if both and contain definitions of variables, then two candidate oracle data exist in these two statements. As a result, is also data-dependent on . If v assigns an erroneous value, then the erroneous value can propagate from to . Observing can detect faults resulting from ; we call this relationship a substitution relationship, denoted as . In addition, the substitution relationship is transitive. If and , faults that are introduced by can be detected by observing .
Figure 2 shows the simplified CPG of Figure 3, which is generated based on CPG. The node of Figure 2 is statements. If the statement is an assignment statement and contains a definition of a variable, then this statement contains candidate oracle data. We use circles to represent such statements that contain oracle data in Figure 2. The blue edges between statements that contain oracle data represent a data dependency relation. The substitution relationship of the variables in oracle data can be derived from the data dependency relation. The quantity analysis obtains the substitution relationship between by traversing the data dependence graph. The substitution relationships are used to determine which variables should be retained to construct the oracle.
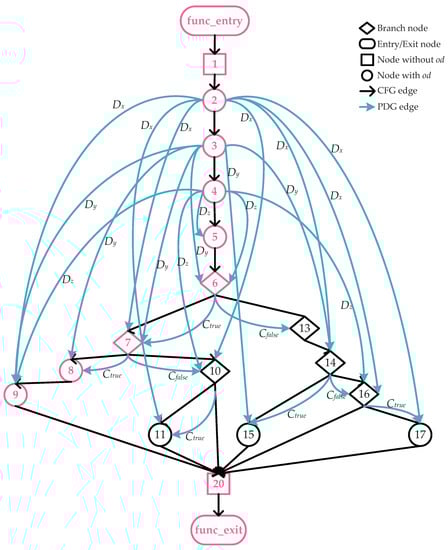
Figure 2.
Simplified code property graph (CPG) of Example Function f.
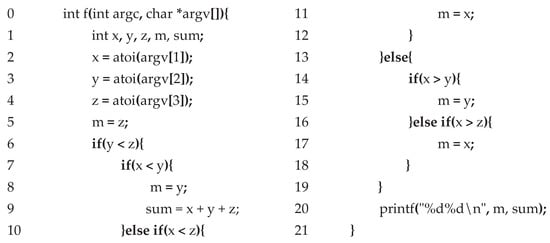
Figure 3.
Example Function.
A candidate oracle data is composed of a variable and its observation position. According to the definition of oracle data, the observation position p is only at the assignment statement in the program, and the variable v is the assigned variable in the assignment statement. Because there may be data dependencies between assignment statements, the corresponding oracle data also have data dependency relations. Variables v in can not only be defined but also used. When v is used, the value of v propagates to a dependent variable. As a result, the corresponding to v can be substituted by dependent to detect faults. According to our investigation, the substitution capability of varies due to their different dependence relations. Take variables in the example function f in Figure 3 as an example. Line 2 is an assignment statement and contains candidate oracle data. Variable x is assigned by a function call. If x is assigned an erroneous value in line 2, this erroneous value will be propagated to other variables, for example, propagating to variable m in line 11. As a result, we can use to detect faults resulting from ; is substitutable. The substitution capability of candidate oracle data is determined by data dependence relations. If other oracle data that are dependent on and is not dependent on any oracle data, then has a strong capability to be substituted. We can use other oracle data to detect faults resulting from , and can be removed from the candidate oracle dataset. If is dependent on other oracle data, the substitution capability of will be weakened. This is because the value of the variable in is influenced by many other variables and is more likely to contain erroneous values; therefore, may be useful for detecting faults resulting from its dependence on oracle data. For example, in Figure 2, is data dependent on , and , and removing may miss the errors caused by , or .
We propose implementing quantity analysis to obtain the substitution capability of candidate oracle data and then using the result to determine which oracle data can be removed. For a given path, the quantity analysis first obtains the corresponding subgraph of the data dependence graph (there may be several graphs; we analyze them one by one). Figure 4 shows the subgraph of DDG of the given path (the path is the path corresponding to the red node in Figure 2. For the convenience of analysis, we only keep the nodes that contain ). Since the edges in the data dependence graph can represent a data dependency relation, the quantity analysis calculates the dependence relations of each candidate oracle data according to the out-degree and in-degree of the od nodes in the subgraph of DDG.
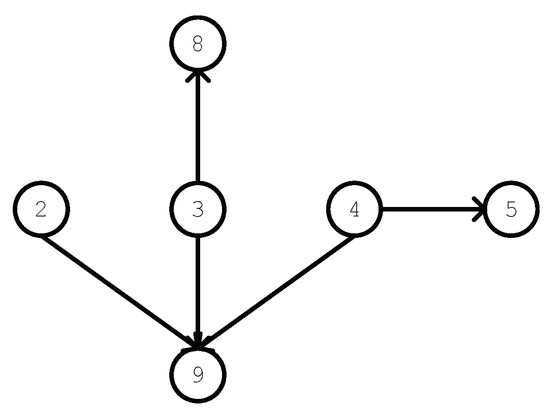
Figure 4.
Subgraph of Data Dependence Graph.
Algorithm 1 shows how to perform quantity analysis of oracle data. For a given path path, the quantity analysis first obtains the corresponding to path from CPG by traversing CPG along the sequence of nodes in the path. Then, the quantity analysis finds all candidate oracle data from . After we obtain all candidate oracle data, we calculate the in-degree and out-degree for each candidate oracle data. The quantity analysis analyses the in-degree and out-degree of each candidate oracle data. If the in-degree of is equal to 0 and the out-degree of is greater than 0, then is substitutable and can be removed from the candidate oracle dataset. The purpose of the quantity analysis is to collect oracle data such as and add them to a set. As we mentioned before, if the in-degree of is not equal to 0, it is difficult to determine whether can be substituted by other oracle data. Therefore, we do not add the to the set.
After PSODS executes quantity analysis, we can obtain a set of oracle data rm_od that can be removed. However, instead of removing these oracle data from the candidate oracle dataset immediately, we wait until quality analysis is complete. This is because quality analysis is also performed based on the subgraph of DDG, and removing rm_od destroys the integrity of the subgraph of DDG, making the quality analysis impossible to perform. When quality analysis is complete and the candidate oracle data are ranked based on their fault-detection capability, PSODS removes rm_od from the candidate oracle dataset.
| Algorithm 1: Quantity Analysis of Oracle Data |
 |
2.2.3. Quality Analysis
PSODS performs the quantity analysis to reduce the number of oracle data. By reducing the number of oracle data, the cost of constructing an oracle is reduced. However, solely reducing the number of oracle data is not enough. Testers need to know which oracle data should be dealt with first. Therefore, PSODS introduces a quality analysis to estimate the capability of each oracle data to detect faults and then ranks oracle data based on their fault-detection capability.
The erroneous values can propagate from one oracle data to another oracle data. In the process of propagation, the data dependence relations between oracle data are different and the numbers of intermediate computations in which erroneous values are involved are different. As a result, different candidate oracle data have different capabilities to detect the erroneous values. The data dependence relations and the number of intermediate computations can be derived from subgraph of DDG. For example, the edges of the subgraph of DDG represent dependence relations between oracle data. In Figure 2, depends on , and ; therefore, there are three edges that point to . The number of intermediate computations can be calculated by the in-degree of the .
To estimate the fault-detection capability of oracle data, we adopt the approach of [11] which uses graph centrality analysis to evaluate oracle data. Graph centrality metrics are used to estimate the relative importance of a node in a graph. In [11], it is used to estimate the fault-detection capability of oracle data. Considering the size of programs to be analyzed and the cost of the algorithm, we use the degree centrality algorithm to estimate the fault-detection capability of oracle data. Degree centrality obtains the degree of oracle data by traversing the subgraph of DDG, and the degree is used to estimate the fault-detection capability. In this paper, we only consider intraprocedural analysis. As a result, the oracle size we obtained is not large. According to the evaluation results of [11], the degree centrality algorithm can achieve a good fault-detection rate with a small oracle size.
2.3. Selecting Oracle Data
PSODS provides testers a group of oracle datasets. Oracle datasets are ranked according to CPA results. The oracle data in each set are ranked based on their fault-detection capability. Testers can construct the oracle in the given order, which may help to find more faults in a shorter time. Although we use quantity analysis to reduce the number of oracle data, the tester may still be dissatisfied with the given oracle size. PSODS also provides an option for the user to decide on the oracle size. If users do not set the oracle size, PSODS will provide them with the default oracle size which is processed by the quantity analysis.
3. Evaluation
To evaluate the fault-detection capabilities of PSODS, faulty program versions are needed. However, real programs of appropriate size with real faults are hard to find and difficult to prepare appropriately (for instance, by preparing correct and faulty versions) [23]. As a result, we introduced mutation testing in our experiments to generate faulty program versions. According to the empirical studies in the previous works, the results with mutation faults are comparable to real faults for testing experiments [24,25]. We use CTS to generate test data and perform mutation testing for the C program (mutants generated by CTS are available at [26]). In this paper, we only consider intraprocedural analysis. Therefore, our analysis is performed at the function level.
All experiments in the evaluation were run on a laptop with a 2.20 GHz CPU and 8 GB RAM—the laptop runs on an Ubuntu-14.04 operating system.
In this evaluation, we conducted several experiments to investigate the following research questions.
RQ1: Dose critical path analysis improve the efficiency of fault-detection?
RQ2: Can quantity analysis reduce the number of oracle data?
RQ3: Is PSODS more effective than output-only oracles in fault detection?
3.1. Objects of Study
Experiments are conducted on the real-world project single to evaluate the effectiveness of our approach. Specifically, single is a single-precision mathematical function library, available at [27]. Since we need to evaluate the effectiveness of CPA, the function unit to be analyzed should have more than one path. In this paper, we use mutation testing to generate faulty program versions and simulate test oracle. Mutation testing is time-consuming and expensive since there are many mutant programs that need to be generated and tested. single has 156 functions with multipaths, because of limited resources and space, we select 15 functions with a simple random sampling method to perform experiments. We set the maximum number of mutants generated for each function to 30. However, due to the limitation of function size, it is impossible to generate so many mutants for each function. The number of generated mutants for selected functions and other information of functions can be found in Table 2.
Table 2.
Information of Selected Functions.
3.2. RQ1: Effectiveness of Critical Path Analysis
3.2.1. Experimental Setup
Before performing experiments to evaluate the effectiveness of CPA, we should first determine the values of and in Equation (1). We conducted five experiments (using different parameter values to perform CPA for selected functions) to investigate the impact of and , including {}, {}, {}, {} and {}. We finally found that {} can achieve a good performance (the weights of different paths can be distinguished well and the weights can reflect the actual situation of the path).
3.2.2. Experimental Process
After we set the values of and , we evaluated the effectiveness of critical path analysis to determine whether it can improve fault-detection efficiency. We performed the following process for each function.
(1) Rank paths of each function by performing critical path analysis.
(2) Run the mutation testing in the order of ranked paths (the test data are ranked in the order of the corresponding path and then the ranked test data are run) and record the time of each execution.
(3) Run the mutation testing without critical path analysis and record the time of each execution.
(4) Calculate the time of execution.
In the following, we will give some equations to calculate the time of execution. For a given set of test data and mutant, we can determine the number of times the mutant was killed by this set of test data. As a result, the time required for the two methods (with and without critical path analysis, denoted as CPA and NCPA, respectively) to kill the mutant can be calculated. For example, suppose the function f has a mutant and a set of test data . PSODS ranks = {,…,} based on the order of ranked path and obtains ranked test dataset = {,…,}. Suppose there are only two test data and that can kill ; p and q satisfy , and in , comes before . CTS runs with and separately. The execution time of is denoted as . We use Equations (2) and (3) to calculate the time required for the CPA approach and NCPA approach to kill the mutant for the first time.
We use Equations (4) and (5) to calculate the total time required for the two approaches to run and respectively.
For , if and , we say that CPA can save time for to find faults, that is, improving the fault detection efficiency of .
Since f has more than one mutant, we need to average the obtained time to reflect their central tendency. Suppose the number of mutants of f is M, the number of equivalent of mutants is E and the set of mutants that can be killed is K = . The average time can be calculated using the following equations.
and are used to evaluate the effectiveness of critical path analysis. If is shorter than , it means that CPA can help us find faults faster. If is shorter than , it indicates that the path with a higher weight is more likely to have faults. Furthermore, it also means that the ranked paths are more conducive to finding faults.
3.2.3. Results and Analysis
Figure 5 shows the overview of the effect of CPA on fault detection efficiency. As can be seen from Figure 5, CPA can save time for most of the selected functions to find faults. Some functions still have some mutants that cannot save time by CPA, such as sicif. We conducted further analysis on these functions and found that or exists in mutants that cannot save time. This is because CTS randomly injects faults into functions, and the position of faults in these mutants is more conducive to being detected by NCPA. Therefore, or occurs in these mutants, which results in the inability of CPA to save time for these mutants. CPA ranks paths based on their weight, which is calculated according to number of operations in the path and path length. As a result, high-weight paths are more likely to contain faults.
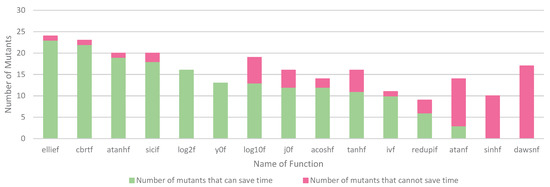
Figure 5.
Overview of the Effect of CPA on Fault Detection Efficiency.
From the result in Figure 5, we can see that none of the mutants in function dawsnf can save time. We conducted further analysis on dawsnf and found that 5 out of 6 paths have the same weight, and the paths have a similar length and number of operations. The weights of different paths cannot be distinguished well, and at the same time, the position of faults in mutants of dawsnf is more conducive to being detected by NCPA. These two reasons lead to the finding that CPA cannot quickly find faults in the mutants. We would like to investigate this problem more in the future.
Table 3 shows and of selected functions (the time that critical path analysis cost has been added to the calculation). From the results, we can see that most of the functions with CPA can achieve better results than NCPA. The results of functions sinhf and dawsnf are not good enough. For function sinhf, although , we have . is equal because the first and last path of ranked paths contains a fault, and this fault can be killed by test data. Therefore, the CPA approach needs to run all test data to obtain . The situation of the NCPA approach is the same as CPA. As a result, . dawsnf is discussed above; therefore, we do not provide further discussion.
Table 3.
and of Selected Functions.
The experimental results show that CPA can improve fault detection efficiency. CPA can help testers find faults faster during the oracle process, so that more faults can be found in a limited time.
3.3. RQ2: Effectiveness of Quantity Analysis
3.3.1. Experimental Process and Setup
In this experiment, we perform quantity analysis for selected functions to determine which oracle data can be removed. We first generated CPG and paths for each function and then analyzed each function one by one. For a given function, we obtained a subgraph of DDG for each path by traversing CPG along paths. Finally, quantity analysis was performed to calculate the dependence relations of each candidate oracle data according to the out-degree and in-degree of the od nodes in the subgraph of DDG.
Space limitations make it difficult to show the results of quantity analysis for each path. Therefore, we calculated the number of paths in each function that can reduce the number of od using quantity analysis.
3.3.2. Results and Analysis
Figure 6 shows an overview of the effectiveness of quantity analysis. From the data in Figure 6, it is apparent that most of the paths can reduce the number of oracle data. However, there are still two functions that have paths that cannot reduce the number of oracle data by quantity analysis. We performed further analysis on cbrtf and sicif. The in-degree of some od in paths that cannot reduce the number of oracle data is equal to 0, and the out-degree is also equal to 0. This is because the variables in these od are used in branch statements rather than assignment statements (other od). As a result, the erroneous values in these od cannot propagate to other od. To avoid false negatives in subsequent analysis, we cannot put these od into rm_od. Therefore, we have paths that cannot reduce the number of oracle data.
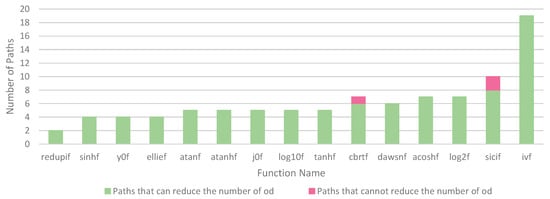
Figure 6.
Overview of the Effectiveness of Quantity Analysis.
The results show that PSODS can reduce the number of oracle data using the quantity analysis. By reducing the number of oracle data, the cost of constructing an oracle is reduced.
3.4. RQ3: Effectiveness of PSODS
3.4.1. Experimental Process and Setup
To evaluate the effectiveness and efficiency of PSODS, we compared PSODS with an output-only oracle (using mutation testing simulation). The goal of PSODS is to make oracle construction easier and maximize the potential return on the tester’s efforts; consequently, PSODS supports testers by providing the oracle data and oracle construction order. PSODS is mainly for human oracles, and using a manual oracle approach to perform the experiment is the best way. However, a manual oracle is costly and hard to prepare. In this paper, since all the selected functions have a return or output, the mutation testing is similar to the output-only oracle, and we used mutation testing to simulate the output-only oracle. For mutation testing with PSODS (PSODS-Mutation Testing), we instrumented selected functions to collect output information of each , which is used to estimate the fault-detection capability of . We compared the fault-detection rates and run time of PSODS-mutation testing and mutation testing. The fault-detection rates can be calculated by Equation (10).
3.4.2. Results and Analysis
Table 4 presents the results of fault-detection rates. From the results in Table 4, it is apparent that both approaches can achieve good fault-detection rates. For some functions, such as sinhf, y0f and so on, PSODS-mutation testing can achieve better fault-detection rates. This is because erroneous values may not be propagated to output; they may vanish before they reach output variables. PSODS can selected oracle data from the program instead of just using the default output variable. In addition, PSODS ranks the selected oracle data according to their fault-detection capability. By observing the selected oracle data, PSODS may have more opportunities to find faults in the programs and achieve better fault-detection rates. Take the code fragment in y0f in Figure 7 as an example. A fault is injected in line 1. After the program executes line 1, variable z is assigned an erroneous value. The erroneous value can propagate to variable w. However, w is assigned a new value in line 4. Therefore, the erroneous value cannot propagate to line 5. The output-only approach cannot find this fault. In this example, z is one of the oracle data that is selected by PSODS. PSODS generates an instrumentation statement after line 1; as a result, erroneous value is collected and the fault can be found.
Table 4.
Fault-detection Rates of Selected Functions.
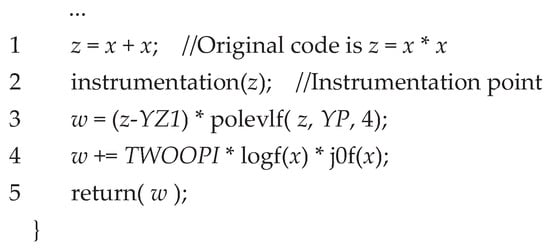
Figure 7.
Code Fragment of y0f.
The output-only fault-detection rate of sicif is 0%, but PSODS is 100%. This occurs because regardless of what the test input is, the return value of the output-only approach is always 0. This may be a bug or sicif is only used to process data, and the return value is just a flag. The return problem makes the output-only approach obtain a 0 fault-detection rate. Because PSODS observes oracle data in the program, it can achieve a good fault-detection rate. For functions atanf and redupif, we preformed further analysis and found that they have faults in the branch statement that are hard to detect. Therefore, both PSODS and output-only approaches cannot achieve a good fault-detection rate in this scenario.
Figure 8 shows the run time of mutation testing and PSODS - mutation testing. As can be seen from the figure, for most functions, the run time of PSODS is shorter than that of the output-only approach. dawsnf is an exception. The reason has been discussed in RQ1; consequently, we do not repeat the discussion.
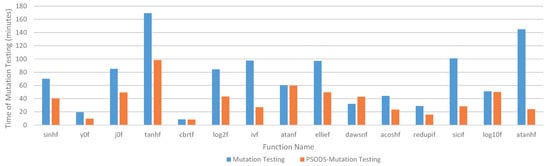
Figure 8.
Run Time of Mutation Testing and PSODS-Mutation Testing.
Through the above analysis, we find that it is necessary to select oracle data for oracle construction. By observing oracle data in programs, we can find faults that the output-only approach cannot find. Although PSODS needs more analysis of programs, with CPA and quantity analysis, PSODS can achieve a good fault-detection efficiency.
3.5. Threats to Validity
Threats to internal validity are concerned with possible bugs in the implementation of our approach. To reduce this threat, we performed some manual checks to confirm the correctness of the results we obtained. Furthermore, we also reviewed all the code we produced for correctness.
Threats to external validity regard the potential bias in the selection of the projects used in the evaluation. These threats relate to the question: was the project we selected representative? To reduce this threat, we attempted to remove any bias related to the selection of the sample by adopting a third-party benchmark. However, since the basis for verifying the effectiveness of our approach is high coverage of selected programs, our selection is still biased. In addition, although the results with mutation faults are comparable to real faults for testing experiments, mutation faults may still not be representative of real faults in practice. To reduce these threats, we will conduct experiments on practical programs with real faults in the future.
Threats to construct validity are concerned with whether our the measurements reflect real-world situations. In our study, we used common criteria to measure the performance of our approach, including the fault-detection rate and run time. However, we use mutation testing to simulate the test oracle, and these two criteria do not take into account this simulation.
4. Related Work
There have been other attempts to help select oracle data to make the construction of test oracles easier. Our research has been conducted based on this previous knowledge in related work. Oracle data selection approaches can be divided into dynamic approaches and static approaches.
Park [28] proposed a static approach that uses error propagation analysis to predict the capability of variables to reveal errors when examined. The error propagation analysis computes the error propagation probability for each variable, the analysis techniques are based on the masking and propagation probability when an error is propagated through other nodes. The timed data flow graph was also introduced to provide the infrastructure for error propagation analysis. Chen et al. [10] presented SODS, which is a static approach to oracle data selection. SODS identifies the substitution relationships between candidate oracle data by constructing a probabilistic substitution graph. The substitution relationships are used to estimate the fault-detection capability of each candidate oracle data. SODS selects a subset of oracle data with strong fault-detection capability.
To deal with various programs, static approaches usually need to reduce accuracy to obtain conservative information from large-scale programs. In this paper, we present a path-sensitive approach, which breaks down whole-program analysis into path-oriented analysis. Our approaches can overcome intrinsic limitations of whole-program static analysis.
Staats et al. [5] proposed a dynamic approach which is based on the use of mutation analysis to rank variables in terms of fault-finding effectiveness, thus automating the selection of the oracle data. In their approach, the test data is executed against the mutants using the original system as the oracle. Then, ranking variable effectiveness in terms of fault finding which is estimated based on how often each variable in the program reveals a fault in a mutant. Oracle data is selected based on this ranking. Gay et al. [12] also proposed an approach to select oracle data using mutation analysis to rank variables. Loyola et al. [11] presented DODONA, a tool that supports the generation of test oracles. DODONA obtains variable relationship network by monitoring the relationships that occur between variables during execution and ranks the relevance of each program variable using techniques from network centrality analysis.
Dynamic approaches need to execute programs under test, and executing programs increases the total processing time and cost. In addition, these approaches may incur extra costs when collecting information during program execution. The information is used to estimate the fault-detection capability of variables.
In addition, we use critical path analysis to analyze program paths. Therefore, our work is also related to critical path analysis. Prior work on critical path analysis can be broadly classified into two categories [29,30]: (1) Using random testing to analyze critical paths [31,32,33,34]. For example, this category of techniques relies on sampling of run time program states to find a critical path. (2) Using formal methods to analyze critical paths [30,35,36,37]. Formal methods include symbolic execution, dynamic tainting analysis, etc. These methods rely on program models, semantics and logical structures to construct a knowledge base.
5. Conclusions
In this paper, we have presented the PSODS framework to automatically select the oracle data to support the construction of a test oracle. PSODS uses critical path analysis to improve fault-detection efficiency. CPA ranks paths according to their possibility that they contain potential faults. The ranked paths not only provide information on the oracle construction order for testers but also partition oracle data to facilitate the oracle construction. To select a suitable set of oracle data, PSODS introduces quantity and quality analysis to improve fault-detection efficiency and effectiveness of oracle data. We evaluated PSODS on a real-world project, and the results indicate that compared with the output-only approach, PSODS can find more faults in a shorter time.
In our future work, we plan to perform further research regarding how to more accurately estimate the fault-detection capability of candidate oracle data. Additionally, we aim to extend our work for interprocedural analysis. Finally, while PSODS achieved good results on single, it is unclear whether the results are generalizable. We will apply the PSODS to other real-world projects (especially larger-scale programs) to evaluate the applicability and practicality of the tool in more detail.
Author Contributions
Conceptualization, M.Z. and Y.W.; methodology, M.Z.; validation, M.Z.; writing—original draft preparation, M.Z.; writing—review and editing, Y.W.; supervision, Y.G.; project administration, D.J. All authors have read and agreed to the published version of the manuscript.
Funding
This research was funded by the National Natural Science Foundation of China under Grant Nos. U1736110.
Institutional Review Board Statement
Not applicable.
Informed Consent Statement
Not applicable.
Data Availability Statement
Not applicable.
Conflicts of Interest
The authors declare no conflict of interest.
References
- Jaffari, A.; Yoo, C.J.; Lee, J. Automatic Test Data Generation Using the Activity Diagram and Search-Based Technique. Appl. Sci. 2020, 10, 3397. [Google Scholar] [CrossRef]
- Koo, B.; Bae, J.; Kim, S.; Park, K.; Kim, H. Test Case Generation Method for Increasing Software Reliability in Safety-Critical Embedded Systems. Electronics 2020, 9, 797. [Google Scholar] [CrossRef]
- Harman, M.; McMinn, P.; Shahbaz, M.; Yoo, S. A Comprehensive Survey of Trends in Oracles for Software Testing; Tech. Rep. CS-13-01; University of Sheffield: Sheffield, UK, 2013. [Google Scholar]
- Jahangirova, G. Oracle Problem in Software Testing. In Proceedings of the 26th ACM SIGSOFT International Symposium on Software Testing and Analysis; Association for Computing Machinery (ISSTA 2017), New York, NY, USA, 10–14 July 2017; pp. 444–447. [Google Scholar]
- Staats, M.; Gay, G.; Heimdahl, M.P. Automated oracle creation support, or: How I learned to stop worrying about fault propagation and love mutation testing. In Proceedings of the 34th International Conference on Software Engineering, Zurich, Switzerland, 2–9 June 2012; pp. 870–880. [Google Scholar]
- Meng, Y.; Gay, G.; Whalen, M. Ensuring the observability of structural test obligations. IEEE Trans. Softw. Eng. 2018. [Google Scholar] [CrossRef]
- Fraser, G.; Staats, M.; McMinn, P.; Arcuri, A.; Padberg, F. Does automated white-box test generation really help software testers? In Proceedings of the 2013 International Symposium on Software Testing and Analysis, Lugano, Switzerland, 15–20 July 2013; pp. 291–301. [Google Scholar]
- Briand, L.C.; Di Penta, M.; Labiche, Y. Assessing and improving state-based class testing: A series of experiments. IEEE Trans. Softw. Eng. 2004, 30, 770–783. [Google Scholar] [CrossRef]
- Xie, Q.; Memon, A.M. Designing and comparing automated test oracles for GUI-based software applications. ACM Trans. Softw. Eng. Methodol. (TOSEM) 2007, 16, 4. [Google Scholar] [CrossRef]
- Chen, J.; Bai, Y.; Hao, D.; Zhang, L.; Zhang, L.; Xie, B.; Mei, H. Supporting oracle construction via static analysis. In Proceedings of the 2016 31st IEEE/ACM International Conference on Automated Software Engineering (ASE), Singapore, 3–7 September 2016; pp. 178–189. [Google Scholar]
- Loyola, P.; Staats, M.; Ko, I.Y.; Rothermel, G. Dodona: Automated oracle dataset selection. In Proceedings of the 2014 International Symposium on Software Testing and Analysis, San Jose, CA, USA, 21–26 July 2014; pp. 193–203. [Google Scholar]
- Gay, G.; Staats, M.; Whalen, M.; Heimdahl, M.P. Automated oracle data selection support. IEEE Trans. Softw. Eng. 2015, 41, 1119–1137. [Google Scholar] [CrossRef]
- Staats, M.; Whalen, M.W.; Heimdahl, M.P. Better testing through oracle selection (nier track). In Proceedings of the 33rd International Conference on Software Engineering, Honolulu, HI, USA, 21–28 May 2011; pp. 892–895. [Google Scholar]
- Zhang, M.Z.; Gong, Y.Z.; Wang, Y.W.; Jin, D.H. Unit Test Data Generation for C Using Rule-Directed Symbolic Execution. J. Comput. Sci. Technol. 2019, 34, 670–689. [Google Scholar] [CrossRef]
- Xing, Y.; Gong, Y.; Wang, Y.; Zhang, X. Branch and bound framework for automatic test case generation. Sci. Sin. Inf. 2014, 44, 1345–1360. [Google Scholar]
- Wang, W.; Zeng, Q. Evaluating initial inputs for concolic testing. In Proceedings of the 2015 International Symposium on Theoretical Aspects of Software Engineering, Nanjing, China, 12–14 September 2015; pp. 47–54. [Google Scholar]
- Zhang, X.Z.; Gong, Y.Z.; Wang, Y.W.; Xing, Y.; Zhang, M.Z. Automated string constraints solving for programs containing string manipulation functions. J. Comput. Sci. Technol. 2017, 32, 1125–1135. [Google Scholar] [CrossRef]
- Herman, P. A data flow analysis approach to program testing. Aust. Comput. J. 1976, 8, 92–96. [Google Scholar]
- Baah, G.K.; Podgurski, A.; Harrold, M.J. The probabilistic program dependence graph and its application to fault diagnosis. IEEE Trans. Softw. Eng. 2010, 36, 528–545. [Google Scholar] [CrossRef]
- Baxter, W.; Bauer, H.R., III. The program dependence graph and vectorization. In Proceedings of the 16th ACM SIGPLAN-SIGACT Symposium on Principles of Programming Languages, Austin, TX, USA, 11–13 January 1989; pp. 1–11. [Google Scholar]
- Meng, Q.; Feng, C.; Zhang, B.; Tang, C. Assisting in auditing of buffer overflow vulnerabilities via machine learning. Math. Prob. Eng. 2017, 2017, 1–13. [Google Scholar] [CrossRef]
- Yamaguchi, F.; Golde, N.; Arp, D.; Rieck, K. Modeling and discovering vulnerabilities with code property graphs. In Proceedings of the 2014 IEEE Symposium on Security and Privacy, San Jose, CA, USA, 18–21 May 2014; pp. 590–604. [Google Scholar]
- Andrews, J.H.; Briand, L.C.; Labiche, Y. Is mutation an appropriate tool for testing experiments? In Proceedings of the 27th International Conference on Software Engineering, St. Louis, MO, USA, 15–21 May 2005; pp. 402–411. [Google Scholar]
- Romano, S.; Scanniello, G.; Antoniol, G.; Marchetto, A. SPIRITuS: A SimPle Information Retrieval regressIon Test Selection approach. Inf. Softw. Technol. 2018, 99, 62–80. [Google Scholar] [CrossRef]
- Just, R.; Jalali, D.; Inozemtseva, L.; Ernst, M.D.; Holmes, R.; Fraser, G. Are mutants a valid substitute for real faults in software testing? In Proceedings of the 22nd ACM SIGSOFT International Symposium on Foundations of Software Engineering, Hong Kong, China, 16–21 November 2014; pp. 654–665. [Google Scholar]
- Mutants Used in the Evaluation. Available online: https://github.com/z420/PSODS/releases (accessed on 6 January 2021).
- Astronomy and Numerical Software Source Codes. Available online: http://www.moshier.net/ (accessed on 6 January 2021).
- Park, M.H. An Approach For Oracle Data Selection Criterion. Ph.D. Thesis, University of Minnesota, Minneapolis, MN, USA, 2010. [Google Scholar]
- Mertoguno, J.S. Human decision making model for autonomic cyber systems. Int. J. Artif. Intell. Tools 2014, 23, 1460023. [Google Scholar] [CrossRef]
- Yao, F.; Li, Y.; Chen, Y.; Xue, H.; Lan, T.; Venkataramani, G. Statsym: Vulnerable path discovery through statistics-guided symbolic execution. In Proceedings of the 2017 47th Annual IEEE/IFIP International Conference on Dependable Systems and Networks (DSN), Denver, CO, USA, 26–29 June 2017; pp. 109–120. [Google Scholar]
- Godefroid, P.; Levin, M.Y.; Molnar, D.A. Automated Whitebox Fuzz Testing. NDSS Citeseer 2008, 8, 151–166. [Google Scholar]
- Liang, H.; Pei, X.; Jia, X.; Shen, W.; Zhang, J. Fuzzing: State of the art. IEEE Trans. Reliab. 2018, 67, 1199–1218. [Google Scholar] [CrossRef]
- Godefroid, P.; Levin, M.Y.; Molnar, D. SAGE: Whitebox fuzzing for security testing. Commun. ACM 2012, 55, 40–44. [Google Scholar] [CrossRef]
- Xue, H.; Chen, Y.; Yao, F.; Li, Y.; Lan, T.; Venkataramani, G. Simber: Eliminating redundant memory bound checks via statistical inference. In IFIP International Conference on ICT Systems Security and Privacy Protection; Springer: New York, NY, USA, 2017; pp. 413–426. [Google Scholar]
- Wang, W.G.; Zeng, Q.K.; Sun, H. Dynamic symbolic execution method oriented to critical operation. Ruan Jian Xue Bao/J. Softw. 2016, 27, 1230–1245. [Google Scholar]
- Baldoni, R.; Coppa, E.; D’elia, D.C.; Demetrescu, C.; Finocchi, I. A survey of symbolic execution techniques. ACM Comput. Surv. (CSUR) 2018, 51, 50. [Google Scholar] [CrossRef]
- Yang, S.; Zhang, X.; Gong, Y.Z. Infeasible Path Detection Based on Code Pattern and Backward Symbolic Execution. Math. Prob. Eng. 2020. [Google Scholar] [CrossRef]
Publisher’s Note: MDPI stays neutral with regard to jurisdictional claims in published maps and institutional affiliations. |
© 2021 by the authors. Licensee MDPI, Basel, Switzerland. This article is an open access article distributed under the terms and conditions of the Creative Commons Attribution (CC BY) license (http://creativecommons.org/licenses/by/4.0/).