
Improved Heart Disease Prediction Using Particle Swarm Optimization Based Stacked Sparse Autoencoder


Abstract
:1. Introduction
2. Related Works
3. Materials and Methods
3.1. Datasets
3.2. Autoencoder
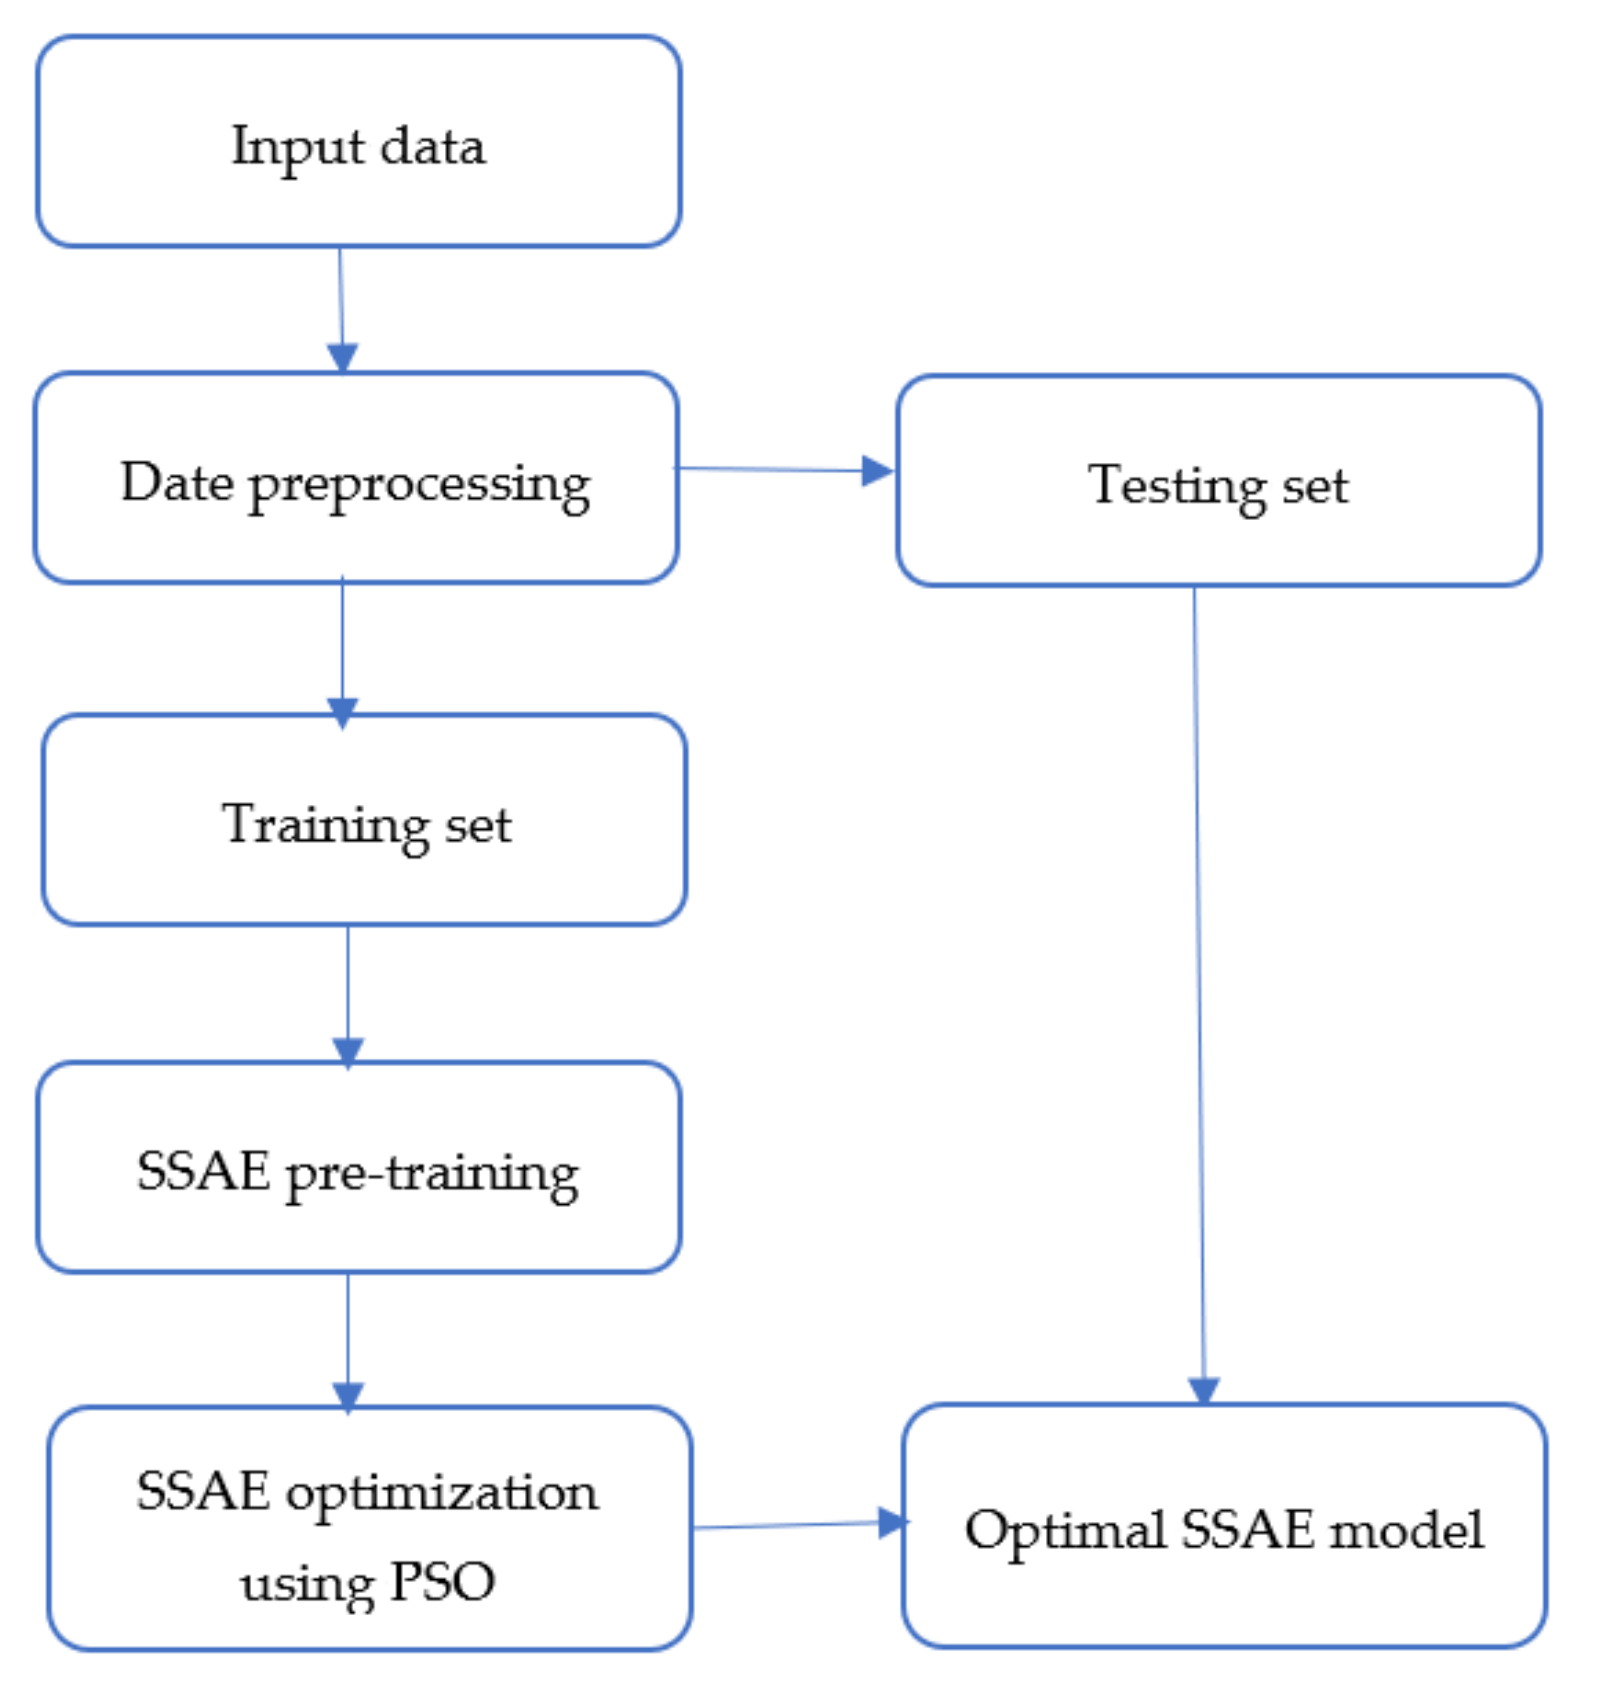
3.3. Proposed Methodology
| Algorithm 1. Proposed methodology. |
Set the parameters of the PSO, i.e., , , , the maximum number of iterations , and the number of particles
|
- Step 1: The encoder maps the input data into a low dimensional space, while the decoder reconstructs the data. In order to obtain optimal reconstruction, we employed backpropagation to minimize the reconstruction error. During this step, the bias and weight matrices of the encoder and decoder are obtained using backpropagation.
- Step 2: In this step, the sparse autoencoders are stacked to form the SSAE. It is achieved by stacking new hidden and output layers into the first autoencoder, where the hidden layer of the first autoencoder serves as input to the new autoencoder. In this study, only three autoencoders are stacked in order not to make the model too complex.
- Step 3: The final hidden layer is then connected to the softmax classifier to complete the SSAE network. Backpropagation is applied to finetune the parameters of the entire network, including the weights and biases.
- Step 4: The fourth step involves using PSO to search for the optimal initial weights and bias values of the SSAE. In the PSO implementation, we initialized parameters such as the number of particles, the maximum number of iterations, the acceleration factors, etc., as stated in Algorithm 1. During the backpropagation finetuning in step 3, the PSO is employed to find the optimal SSAE parameters, which leads to enhanced performance.
4. Results and Discussion
5. Conclusions
Author Contributions
Funding
Conflicts of Interest
References
- Chicco, D.; Jurman, G. Machine learning can predict survival of patients with heart failure from serum creatinine and ejection fraction alone. BMC Med. Inform. Decis. Mak. 2020, 20, 16. [Google Scholar] [CrossRef]
- Fitriyani, N.L.; Syafrudin, M.; Alfian, G.; Rhee, J. HDPM: An Effective Heart Disease Prediction Model for a Clinical Decision Support System. IEEE Access 2020, 8, 133034–133050. [Google Scholar] [CrossRef]
- Benjamin, E.J.; Muntner, P.; Alonso, A.; Bittencourt, M.S.; Callaway, C.W.; Carson, A.P.; Chamberlain, A.M.; Chang, A.R.; Cheng, S.; Das, S.R.; et al. Heart Disease and Stroke Statistics-2019 Update: A Report From the American Heart Association. Circulation 2019, 139, e56–e528. [Google Scholar] [CrossRef]
- Mohan, S.; Thirumalai, C.; Srivastava, G. Effective Heart Disease Prediction Using Hybrid Machine Learning Techniques. IEEE Access 2019, 7, 81542–81554. [Google Scholar] [CrossRef]
- Li, J.P.; Haq, A.U.; Din, S.U.; Khan, J.; Khan, A.; Saboor, A. Heart Disease Identification Method Using Machine Learning Classification in E-Healthcare. IEEE Access 2020, 8, 107562–107582. [Google Scholar] [CrossRef]
- Mdhaffar, A.; Bouassida Rodriguez, I.; Charfi, K.; Abid, L.; Freisleben, B. CEP4HFP: Complex Event Processing for Heart Failure Prediction. IEEE Trans. NanoBioscience 2017, 16, 708–717. [Google Scholar] [CrossRef]
- Jin, B.; Che, C.; Liu, Z.; Zhang, S.; Yin, X.; Wei, X. Predicting the Risk of Heart Failure With EHR Sequential Data Modeling. IEEE Access 2018, 6, 9256–9261. [Google Scholar] [CrossRef]
- Ali, L.; Rahman, A.; Khan, A.; Zhou, M.; Javeed, A.; Khan, J.A. An Automated Diagnostic System for Heart Disease Prediction Based on x2 Statistical Model and Optimally Configured Deep Neural Network. IEEE Access 2019, 7, 34938–34945. [Google Scholar] [CrossRef]
- Alaa, A.M.; Bolton, T.; Angelantonio, E.D.; Rudd, J.H.F.; van der Schaar, M. Cardiovascular disease risk prediction using automated machine learning: A prospective study of 423,604 UK Biobank participants. PLoS ONE 2019, 14, e0213653. [Google Scholar] [CrossRef] [PubMed] [Green Version]
- Mienye, I.D.; Sun, Y.; Wang, Z. An improved ensemble learning approach for the prediction of heart disease risk. Inform. Med. Unlocked 2020, 20, 100402. [Google Scholar] [CrossRef]
- Buchan, T.A.; Ross, H.J.; McDonald, M.; Billia, F.; Delgado, D.; Duero Posada, J.G.; Luk, A.; Guyatt, G.H.; Alba, A.C. Physician Prediction versus Model Predicted Prognosis in Ambulatory Patients with Heart Failure. J. Heart Lung Transplant. 2019, 38, S381. [Google Scholar] [CrossRef]
- Oh, S.L.; Jahmunah, V.; Ooi, C.P.; Tan, R.-S.; Ciaccio, E.J.; Yamakawa, T.; Tanabe, M.; Kobayashi, M.; Acharya, U.R. Classification of heart sound signals using a novel deep WaveNet model. Comput. Methods Programs Biomed. 2020, 105604. [Google Scholar] [CrossRef] [PubMed]
- Bengio, Y.; Courville, A.; Vincent, P. Representation Learning: A Review and New Perspectives. IEEE Trans. Pattern Anal. Mach. Intell. 2013, 35, 1798–1828. [Google Scholar] [CrossRef] [PubMed]
- Kasongo, S.M.; Sun, Y. A Deep Learning Method With Filter Based Feature Engineering for Wireless Intrusion Detection System. IEEE Access 2019, 7, 38597–38607. [Google Scholar] [CrossRef]
- Kasongo, S.M.; Sun, Y. Performance Analysis of Intrusion Detection Systems Using a Feature Selection Method on the UNSW-NB15 Dataset. J. Big Data 2020, 7, 105. [Google Scholar] [CrossRef]
- Reddy, G.T.; Reddy, M.P.K.; Lakshmanna, K.; Kaluri, R.; Rajput, D.S.; Srivastava, G.; Baker, T. Analysis of Dimensionality Reduction Techniques on Big Data. IEEE Access 2020, 8, 54776–54788. [Google Scholar] [CrossRef]
- Wickramasinghe, C.S.; Marino, D.L.; Manic, M. ResNet Autoencoders for Unsupervised Feature Learning From High-Dimensional Data: Deep Models Resistant to Performance Degradation. IEEE Access 2021, 9, 40511–40520. [Google Scholar] [CrossRef]
- Zhang, C.; Cheng, X.; Liu, J.; He, J.; Liu, G. Deep Sparse Autoencoder for Feature Extraction and Diagnosis of Locomotive Adhesion Status. J. Control. Sci. Eng. 2018, 2018, 8676387. [Google Scholar] [CrossRef]
- Ng, A. Sparse Autoencoder. 2011. Available online: https://web.stanford.edu/class/cs294a/sparseAutoencoder.pdf (accessed on 6 June 2020).
- Liu, J.; Li, C.; Yang, W. Supervised Learning via Unsupervised Sparse Autoencoder. IEEE Access 2018, 6, 73802–73814. [Google Scholar] [CrossRef]
- Mienye, I.D.; Ainah, P.K.; Emmanuel, I.D.; Esenogho, E. Sparse noise minimization in image classification using Genetic Algorithm and DenseNet. In Proceedings of the 2021 Conference on Information Communications Technology and Society (ICTAS), Durban, South Africa, 10–11 March 2021; pp. 103–108. [Google Scholar] [CrossRef]
- Mienye, I.D.; Sun, Y.; Wang, Z. Improved Predictive Sparse Decomposition Method with Densenet for Prediction of Lung Cancer. Int. J. Comput. 2020, 533–541. [Google Scholar] [CrossRef]
- Lin, C.-J.; Jeng, S.-Y. Optimization of Deep Learning Network Parameters Using Uniform Experimental Design for Breast Cancer Histopathological Image Classification. Diagnostics 2020, 10, 662. [Google Scholar] [CrossRef]
- Kaur, S.; Aggarwal, H.; Rani, R. Hyper-parameter optimization of deep learning model for prediction of Parkinson’s disease. Mach. Vis. Appl. 2020, 31, 32. [Google Scholar] [CrossRef]
- Bickel, S.; Brückner, M.; Scheffer, T. Discriminative Learning Under Covariate Shift. J. Mach. Learn. Res. 2009, 10, 2137–2155. [Google Scholar]
- Pasha, S.J.; Mohamed, E.S. Novel Feature Reduction (NFR) Model With Machine Learning and Data Mining Algorithms for Effective Disease Risk Prediction. IEEE Access 2020, 8, 184087–184108. [Google Scholar] [CrossRef]
- Ali, S.A.; Raza, B.; Malik, A.K.; Shahid, A.R.; Faheem, M.; Alquhayz, H.; Kumar, Y.J. An Optimally Configured and Improved Deep Belief Network (OCI-DBN) Approach for Heart Disease Prediction Based on Ruzzo–Tompa and Stacked Genetic Algorithm. IEEE Access 2020, 8, 65947–65958. [Google Scholar] [CrossRef]
- Haq, A.U.; Li, J.P.; Memon, M.H.; Nazir, S.; Sun, R. A Hybrid Intelligent System Framework for the Prediction of Heart Disease Using Machine Learning Algorithms. Mob. Inf. Syst. 2018, 2018, 3860146. [Google Scholar] [CrossRef]
- Samuel, O.W.; Asogbon, G.M.; Sangaiah, A.K.; Fang, P.; Li, G. An integrated decision support system based on ANN and Fuzzy_AHP for heart failure risk prediction. Expert Syst. Appl. 2017, 68, 163–172. [Google Scholar] [CrossRef]
- Yang, S.; Zhang, Y.; Zhu, Y.; Li, P.; Hu, X. Representation learning via serial autoencoders for domain adaptation. Neurocomputing 2019, 351, 1–9. [Google Scholar] [CrossRef]
- Du, L.; Wu, Y.; Hu, H.; Wang, W. Self-adaptive weighted synthesised local directional pattern integrating with sparse autoencoder for expression recognition based on improved multiple kernel learning strategy. IET Comput. Vis. 2020, 14, 73–83. [Google Scholar] [CrossRef]
- Tai, G.; Wang, Y.; Li, Y.; Hong, W. Radar HRRP target recognition based on stacked denosing sparse autoencoder. J. Eng. 2019, 2019, 7945–7949. [Google Scholar] [CrossRef]
- Xiong, Y.; Lu, Y. Deep Feature Extraction From the Vocal Vectors Using Sparse Autoencoders for Parkinson’s Classification. IEEE Access 2020, 8, 27821–27830. [Google Scholar] [CrossRef]
- Mienye, I.D.; Sun, Y.; Wang, Z. Improved sparse autoencoder based artificial neural network approach for prediction of heart disease. Inform. Med. Unlocked 2020, 18, 100307. [Google Scholar] [CrossRef]
- Ebiaredoh-Mienye, S.A.; Esenogho, E.; Swart, T.G. Integrating Enhanced Sparse Autoencoder-Based Artificial Neural Network Technique and Softmax Regression for Medical Diagnosis. Electronics 2020, 9, 1963. [Google Scholar] [CrossRef]
- UCI Machine Learning Repository: Heart Disease Data Set. Available online: http://archive.ics.uci.edu/ml/datasets/Heart+Disease (accessed on 9 April 2020).
- Framingham Heart Study Dataset. Available online: https://kaggle.com/amanajmera1/framingham-heart-study-dataset (accessed on 24 January 2020).
- Khan, S.I.; Hoque, A.S.M.L. SICE: An improved missing data imputation technique. J. Big Data 2020, 7, 37. [Google Scholar] [CrossRef]
- Pathirage, C.S.N.; Li, J.; Li, L.; Hao, H.; Liu, W.; Wang, R. Development and application of a deep learning–based sparse autoencoder framework for structural damage identification. Struct. Health Monit. 2019, 18, 103–122. [Google Scholar] [CrossRef] [Green Version]
- Yan, B.; Han, G. Effective Feature Extraction via Stacked Sparse Autoencoder to Improve Intrusion Detection System. IEEE Access 2018, 6, 41238–41248. [Google Scholar] [CrossRef]
- Li, G.; Han, D.; Wang, C.; Hu, W.; Calhoun, V.D.; Wang, Y.-P. Application of deep canonically correlated sparse autoencoder for the classification of schizophrenia. Comput. Methods Programs Biomed. 2020, 183, 105073. [Google Scholar] [CrossRef] [PubMed]
- Doaud, M.; Mayo, M. Using Swarm Optimization To Enhance Autoencoders Images. arXiv 2018, arXiv:1807.03346. [Google Scholar]
- Fernandes Junior, F.E.; Yen, G.G. Particle swarm optimization of deep neural networks architectures for image classification. Swarm Evol. Comput. 2019, 49, 62–74. [Google Scholar] [CrossRef]
- Chiroma, H.; Noor, A.S.M.; Abdulkareem, S.; Abubakar, A.I.; Hermawan, A.; Qin, H.; Hamza, M.F.; Herawan, T. Neural Networks Optimization through Genetic Algorithm Searches: A Review. Appl. Math. Inf. Sci. 2017, 11, 1543–1564. [Google Scholar] [CrossRef]
- Feng, X.; Zhao, J.; Kita, E. Genetic Algorithm-based Optimization of Deep Neural Network Ensemble. Rev. Socionetwork Strat 2021, 15, 27–47. [Google Scholar] [CrossRef]
- Yang, X.-S. Chapter 8-Particle Swarm Optimization. In Nature-Inspired Optimization Algorithms, 2nd ed.; Yang, X.-S., Ed.; Academic Press: Cambridge, MA, USA, 2021; pp. 111–121. [Google Scholar]
- Kennedy, J. Particle Swarm Optimization. In Encyclopedia of Machine Learning; Sammut, C., Webb, G.I., Eds.; Springer: Boston, MA, USA, 2010; pp. 760–766. [Google Scholar]
- Qolomany, B.; Maabreh, M.; Al-Fuqaha, A.; Gupta, A.; Benhaddou, D. Parameters optimization of deep learning models using Particle swarm optimization. In Proceedings of the 2017 13th International Wireless Communications and Mobile Computing Conference (IWCMC), Valencia, Spain, 26–30 June 2017; pp. 1285–1290. [Google Scholar] [CrossRef] [Green Version]
- Ioffe, S.; Szegedy, C. Batch Normalization: Accelerating Deep Network Training by Reducing Internal Covariate Shift. arXiv 2015, arXiv:1502.03167. [Google Scholar]
- Hiriyannaiah, S.; Srinivas, A.M.D.; Shetty, G.K.; Siddesh, G.M.; Srinivasa, K.G. Chapter 4-A computationally intelligent agent for detecting fake news using generative adversarial networks. In Hybrid Computational Intelligence; Bhattacharyya, S., Snášel, V., Gupta, D., Khanna, A., Eds.; Academic Press: Cambridge, MA, USA, 2020; pp. 69–96. [Google Scholar]
- Theodoridis, S. Chapter 18-Neural Networks and Deep Learning. In Machine Learning, 2nd ed.; Theodoridis, S., Ed.; Academic Press: Cambridge, MA, USA, 2020; pp. 901–1038. [Google Scholar] [CrossRef]
- Garbin, C.; Zhu, X.; Marques, O. Dropout vs. batch normalization: An empirical study of their impact to deep learning. Multimed Tools Appl. 2020, 79, 12777–12815. [Google Scholar] [CrossRef]
- Altman, N.S. An Introduction to Kernel and Nearest-Neighbor Nonparametric Regression. Am. Stat. 1992, 46, 175–185. [Google Scholar] [CrossRef] [Green Version]
- Cramer, J.S. The Origins of Logistic Regression; Social Science Research Network: Rochester, NY, USA, 2002. [Google Scholar] [CrossRef] [Green Version]
- Hastie, T.; Tibshirani, R.; Friedman, J. Linear Methods for Classification. In The Elements of Statistical Learning: Data Mining, Inference, and Prediction; Hastie, T., Tibshirani, R., Friedman, J., Eds.; Springer: New York, NY, USA, 2009; pp. 101–137. [Google Scholar] [CrossRef]
- Cortes, C.; Vapnik, V. Support-vector networks. Mach. Learn. 1995, 20, 273–297. [Google Scholar] [CrossRef]
- Krzywinski, M.; Altman, N. Classification and regression trees. Nat. Methods 2017, 14, 757–758. [Google Scholar] [CrossRef]
- Breiman, L. Arcing the Edge; Technical Report 486; Statistics Department, University of California: Los Angeles, CA, USA, 1997. [Google Scholar]
- Breiman, L. Random Forests. Mach. Learn. 2001, 45, 5–32. [Google Scholar] [CrossRef] [Green Version]
- Bridle, J.S. Probabilistic Interpretation of Feedforward Classification Network Outputs, with Relationships to Statistical Pattern Recognition. In Neurocomputing; Springer: Berlin/Heidelberg, Germany, 1990; pp. 227–236. [Google Scholar] [CrossRef]
- Schapire, R.E. A brief introduction to boosting. In Proceedings of the 16th Internation Joint Conference on Artificial Intelligence, IJCAI, Stockholm, Sweden, 31 July–6 August 1999; Volume 2, pp. 1401–1406. [Google Scholar]
- UCI Machine Learning Repository: Cervical Cancer (Risk Factors) Data Set. Available online: https://archive.ics.uci.edu/ml/datasets/Cervical+cancer+%28Risk+Factors%29 (accessed on 15 April 2021).
- UCI Machine Learning Repository: Chronic_Kidney_Disease Data Set. Available online: https://archive.ics.uci.edu/ml/datasets/Chronic_Kidney_Disease (accessed on 20 July 2021).
- Mienye, I.D.; Sun, Y. Performance analysis of cost-sensitive learning methods with application to imbalanced medical data. Inform. Med. Unlocked 2021, 25, 100690. [Google Scholar] [CrossRef]
- Repaka, A.N.; Ravikanti, S.D.; Franklin, R.G. Design And Implementing Heart Disease Prediction Using Naives Bayesian. In Proceedings of the 2019 3rd International Conference on Trends in Electronics and Informatics (ICOEI), Tirunelveli, India, 23–25 April 2019; pp. 292–297. [Google Scholar] [CrossRef]
- Ali, L.; Bukhari, S.A.C. An Approach Based on Mutually Informed Neural Networks to Optimize the Generalization Capabilities of Decision Support Systems Developed for Heart Failure Prediction. IRBM 2020. [Google Scholar] [CrossRef]
- Reddy, G.T.; Reddy, M.P.K.; Lakshmanna, K.; Rajput, D.S.; Kaluri, R.; Srivastava, G. Hybrid genetic algorithm and a fuzzy logic classifier for heart disease diagnosis. Evol. Intel. 2020, 13, 185–196. [Google Scholar] [CrossRef]
- Paul, A.K.; Shill, P.C.; Rabin, M.R.I.; Murase, K. Adaptive weighted fuzzy rule-based system for the risk level assessment of heart disease. Appl. Intell. 2018, 48, 1739–1756. [Google Scholar] [CrossRef]
- Ali, L.; Niamat, A.; Khan, J.A.; Golilarz, N.A.; Xingzhong, X.; Noor, A.; Nour, R.; Bukhari, S.A.C. An Optimized Stacked Support Vector Machines Based Expert System for the Effective Prediction of Heart Failure. IEEE Access 2019, 7, 54007–54014. [Google Scholar] [CrossRef]
- Kim, J.O.R.; Jeong, Y.-S.; Kim, J.H.; Lee, J.-W.; Park, D.; Kim, H.-S. Machine Learning-Based Cardiovascular Disease Prediction Model: A Cohort Study on the Korean National Health Insurance Service Health Screening Database. Diagnostics 2021, 11, 943. [Google Scholar] [CrossRef] [PubMed]

| S/N | Feature | Description |
|---|---|---|
| 1 | Age | The individual’s age, in years |
| 2 | Sex | The sex of the patient (1 = male, 0 = female) |
| 3 | Chest pain type | The type of chest pain experienced by the patient (1 = typical angina, 2 = atypical angina, 3 = non-anginal pain, 4 = asymptomatic) |
| 4 | Resting Blood Pressure | Resting blood pressure value of the patient in mmHg |
| 5 | Serum Cholesterol | Serum cholesterol in mg/dL |
| 6 | Fasting Blood Sugar | Fasting blood sugar > 120 mg/dL (1 = true, 0 = false) |
| 7 | Resting ECG | ECG result (0 = normal, 1 = ST-T abnormality, 2 = left ventricular hypertrophy) |
| 8 | MaxHeart rate | Maximum heart rate achieved by the patient |
| 9 | Exercise induced angina | Exercise induced angina (1 = true, 0 = false) |
| 10 | ST depression | ST depression induced by exercise relative to rest |
| 11 | Slope | The slope of the peak exercise ST segment (1 = upsloping, 2 = flat, 3 = downsloping) |
| 12 | Number of vessels | Number of major vessels (0–3) colored by fluoroscopy |
| 13 | Thalassemia | Type of thalassemia disorder (3 = normal, 6 = fixed disorder, 7 = reversible disorder) |
| 14 | Target variable | The status of heart disease diagnosis (0 = absence, 1, 2, 3, 4 = present) |
| S/N | Feature | Description |
|---|---|---|
| 1 | Sex | Patient’s gender |
| 2 | Age | Patient’s age |
| 3 | Education | Educational level (1 = high school, 2 = GED certificate, 3 = vocational training, 4 = college degree) |
| 4 | currentSmoker | Whether the individual smokes or not |
| 5 | cigsPerDay | The average number of cigarettes the patient smokes per day |
| 6 | BPMeds | Whether the individual is on BP medication or not |
| 7 | prevalentStroke | Whether the individual previously had a stroke or not |
| 8 | PrevalentHyp | Whether the individual is hypertensive |
| 9 | Diabetes | Whether the individual is diabetic |
| 10 | totChol | Total cholesterol level |
| 11 | sysBP | Systolic blood pressure |
| 12 | diaBP | Diastolic blood pressure |
| 13 | BMI | Body mass index |
| 14 | heartrate | The patient’s heart rate |
| 15 | Glucose | Glucose level |
| 16 | Target variable (TenYearCHD) | Whether or not the patient has a ten-year risk of coronary heart disease |
| Algorithm | Accuracy | Precision | Sensitivity | F-Measure |
|---|---|---|---|---|
| KNN | 0.783 | 0.801 | 0.789 | 0.800 |
| LR | 0.838 | 0.839 | 0.841 | 0.839 |
| LDA | 0.825 | 0.806 | 0.828 | 0.817 |
| SVM | 0.805 | 0.837 | 0.823 | 0.830 |
| Decision tree | 0.749 | 0.735 | 0.745 | 0.739 |
| Softmax classifier | 0.794 | 0.803 | 0.786 | 0.794 |
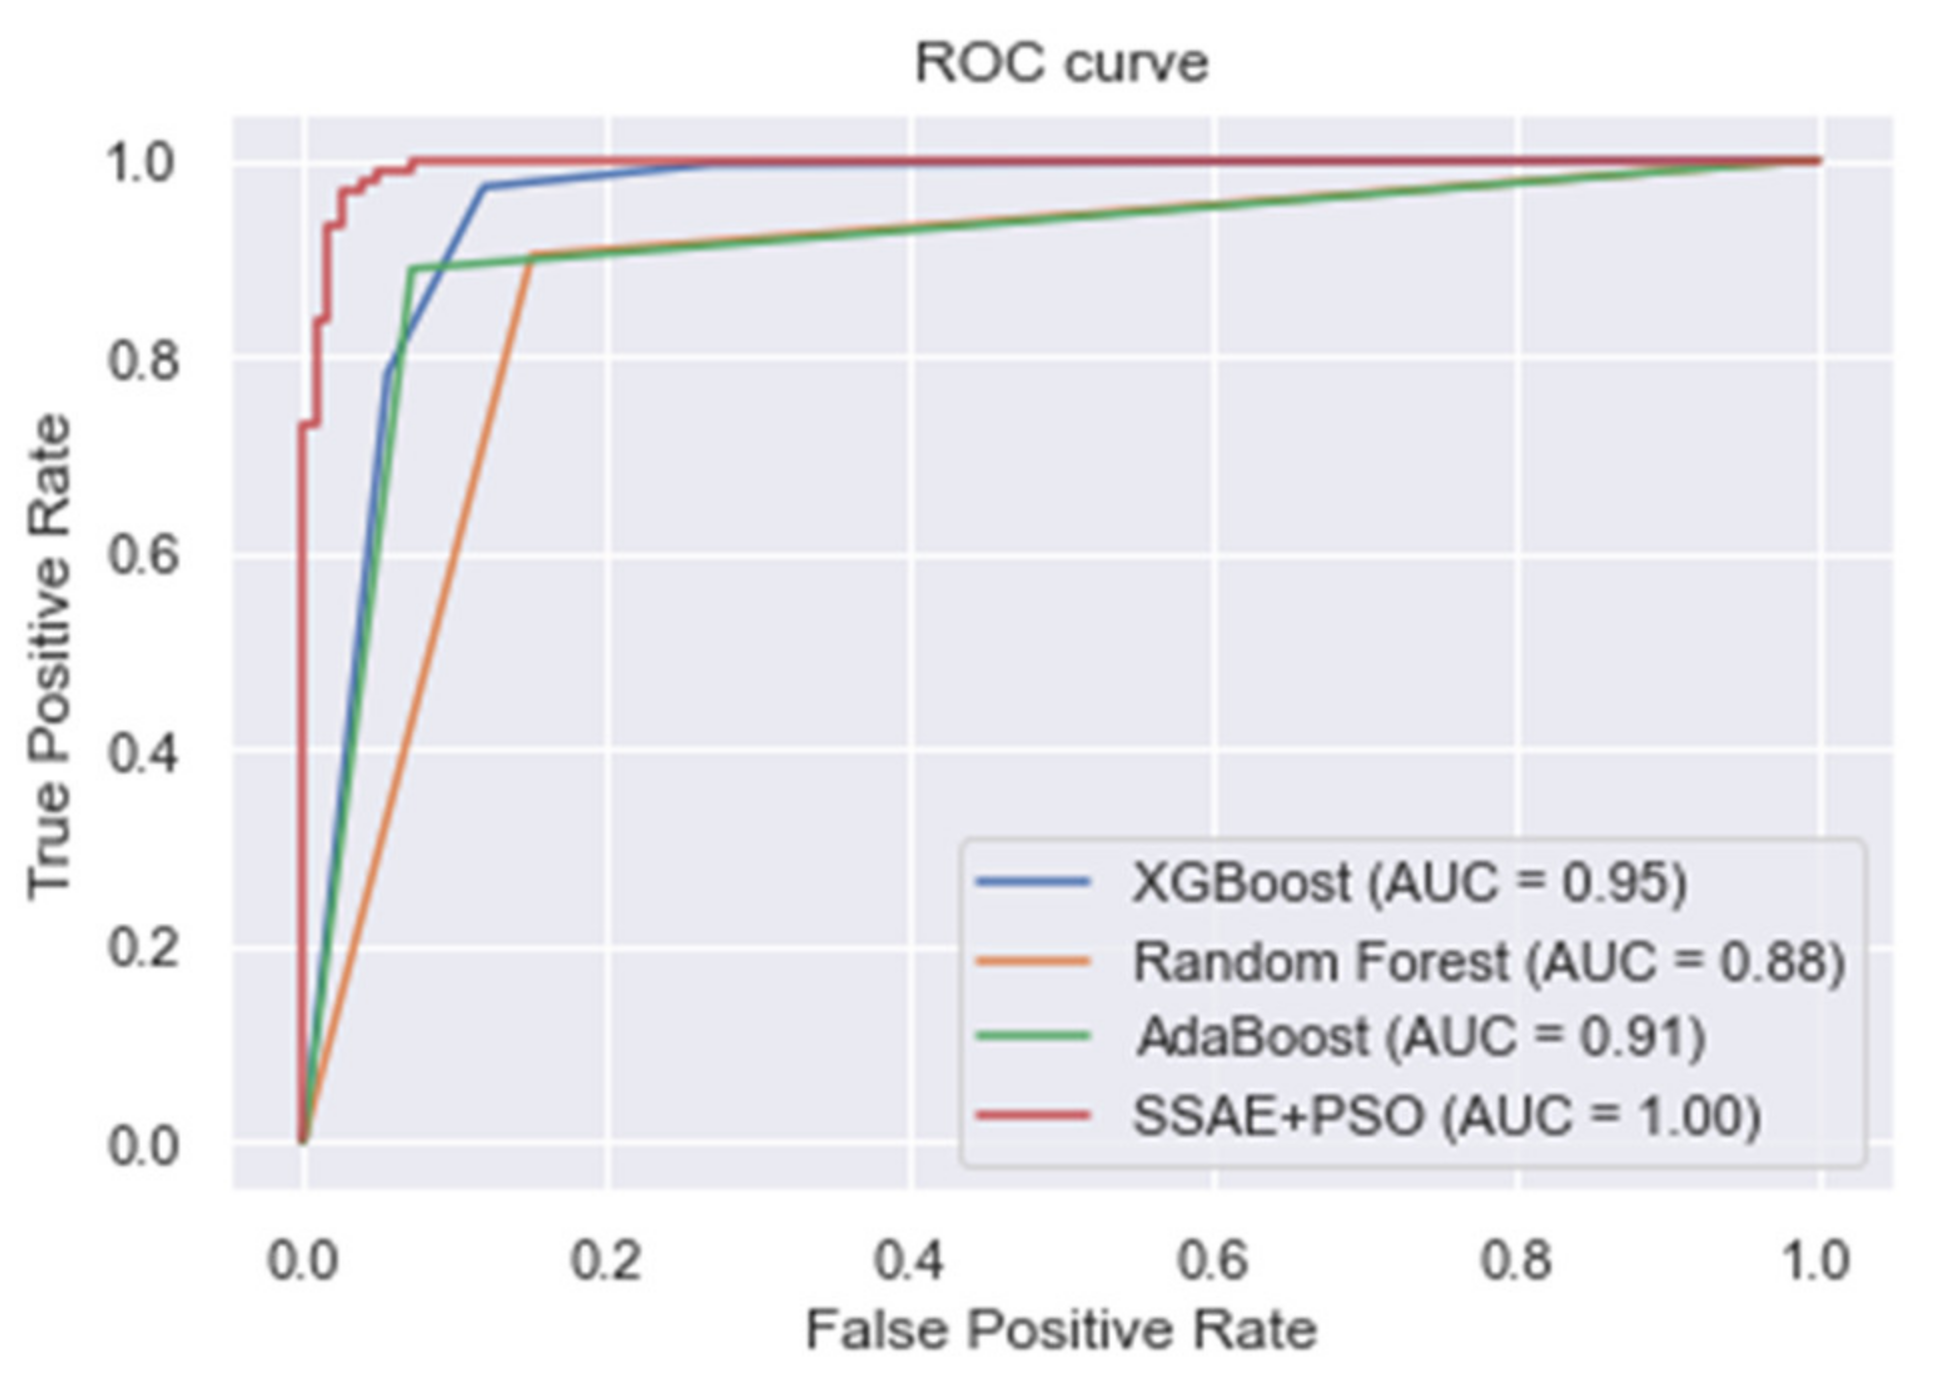
| XGBoost | 0.918 | 0.938 | 0.972 | 0.955 |
| Random forest | 0.883 | 0.911 | 0.903 | 0.907 |
| AdaBoost | 0.895 | 0.955 | 0.889 | 0.920 |
| Proposed SSAE + PSO | 0.973 | 0.948 | 1.000 | 0.973 |
| Algorithm | Accuracy | Precision | Sensitivity | F-Measure |
|---|---|---|---|---|
| KNN | 0.624 | 0.608 | 0.594 | 0.601 |
| LR | 0.783 | 0.790 | 0.781 | 0.785 |
| LDA | 0.781 | 0.804 | 0.792 | 0.798 |
| SVM | 0.796 | 0.800 | 0.789 | 0.794 |
| Decision tree | 0.710 | 0.699 | 0.708 | 0.703 |
| Softmax classifier | 0.738 | 0.715 | 0.700 | 0.708 |
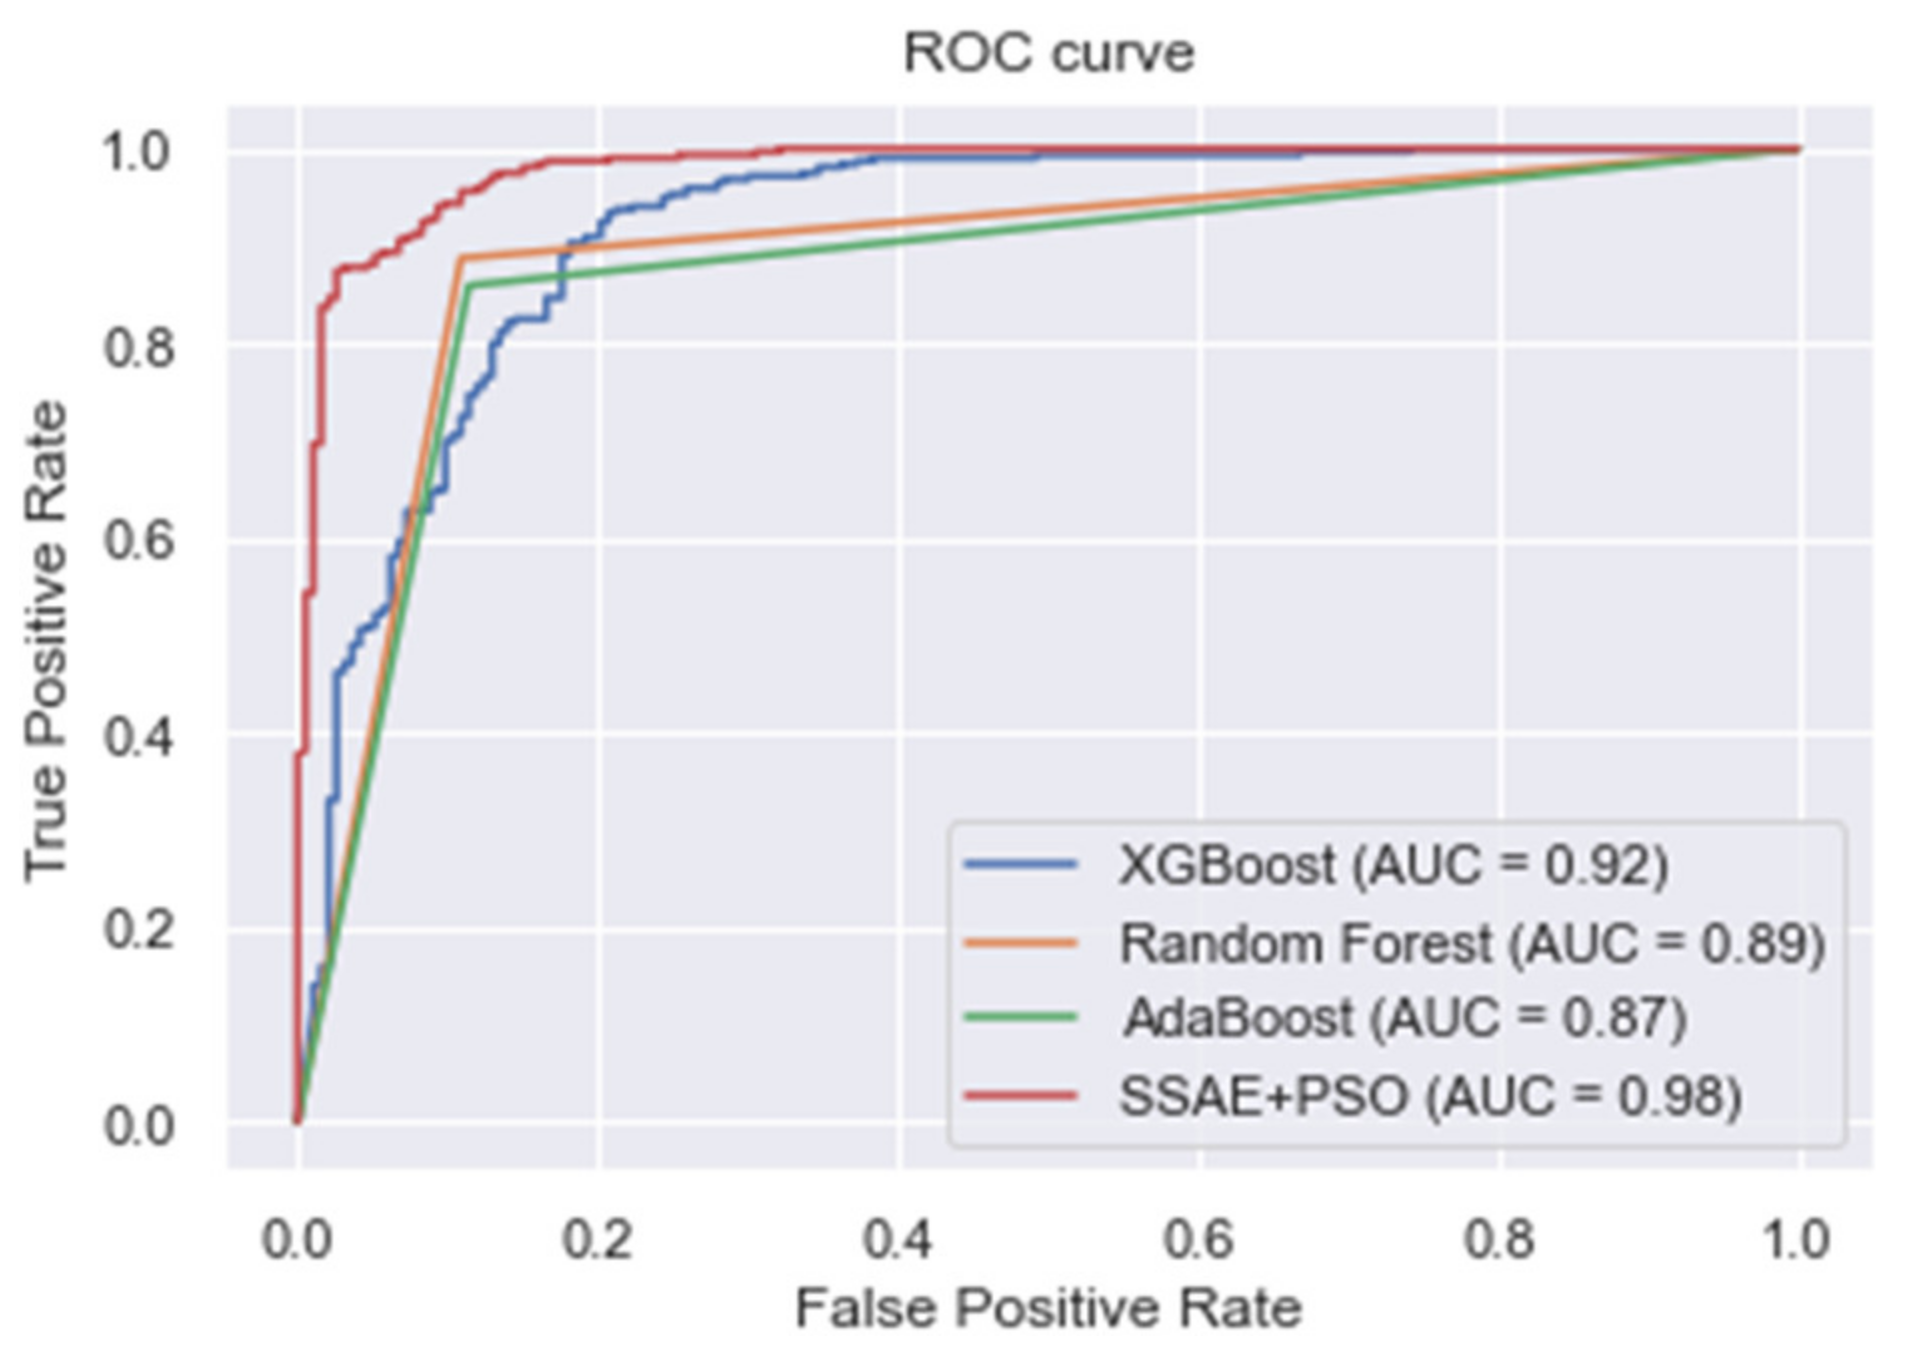
| XGBoost | 0.875 | 0.864 | 0.940 | 0.900 |
| Random forest | 0.868 | 0.914 | 0.887 | 0.900 |
| AdaBoost | 0.877 | 0.932 | 0.865 | 0.897 |
| Proposed SSAE + PSO | 0.961 | 0.930 | 0.988 | 0.958 |
| Algorithm | Accuracy | Precision | Sensitivity | F-Measure |
|---|---|---|---|---|
| KNN | 0.956 | 0.913 | 0.830 | 0.870 |
| LR | 0.940 | 0.942 | 0.978 | 0.959 |
| LDA | 0.942 | 0.876 | 0.904 | 0.890 |
| SVM | 0.933 | 0.918 | 0.920 | 0.919 |
| Decision tree | 0.892 | 0.910 | 0.902 | 0.906 |
| Softmax classifier | 0.938 | 0.841 | 0.924 | 0.881 |
| XGBoost | 0.966 | 0.903 | 0.917 | 0.910 |
| Random forest | 0.964 | 0.855 | 0.912 | 0.883 |
| AdaBoost | 0.955 | 0.860 | 0.912 | 0.885 |
| Proposed SSAE + PSO | 0.988 | 0.984 | 0.978 | 0.981 |
| Algorithm | Accuracy | Precision | Sensitivity | F-Measure |
|---|---|---|---|---|
| KNN | 0.925 | 0.910 | 0.894 | 0.903 |
| LR | 0.927 | 0.914 | 0.880 | 0.897 |
| LDA | 0.900 | 0.896 | 0.897 | 0.896 |
| SVM | 0.896 | 0.907 | 0.900 | 0.904 |
| Decision tree | 0.910 | 0.921 | 0.921 | 0.921 |
| Softmax classifier | 0.930 | 0.924 | 0.917 | 0.920 |
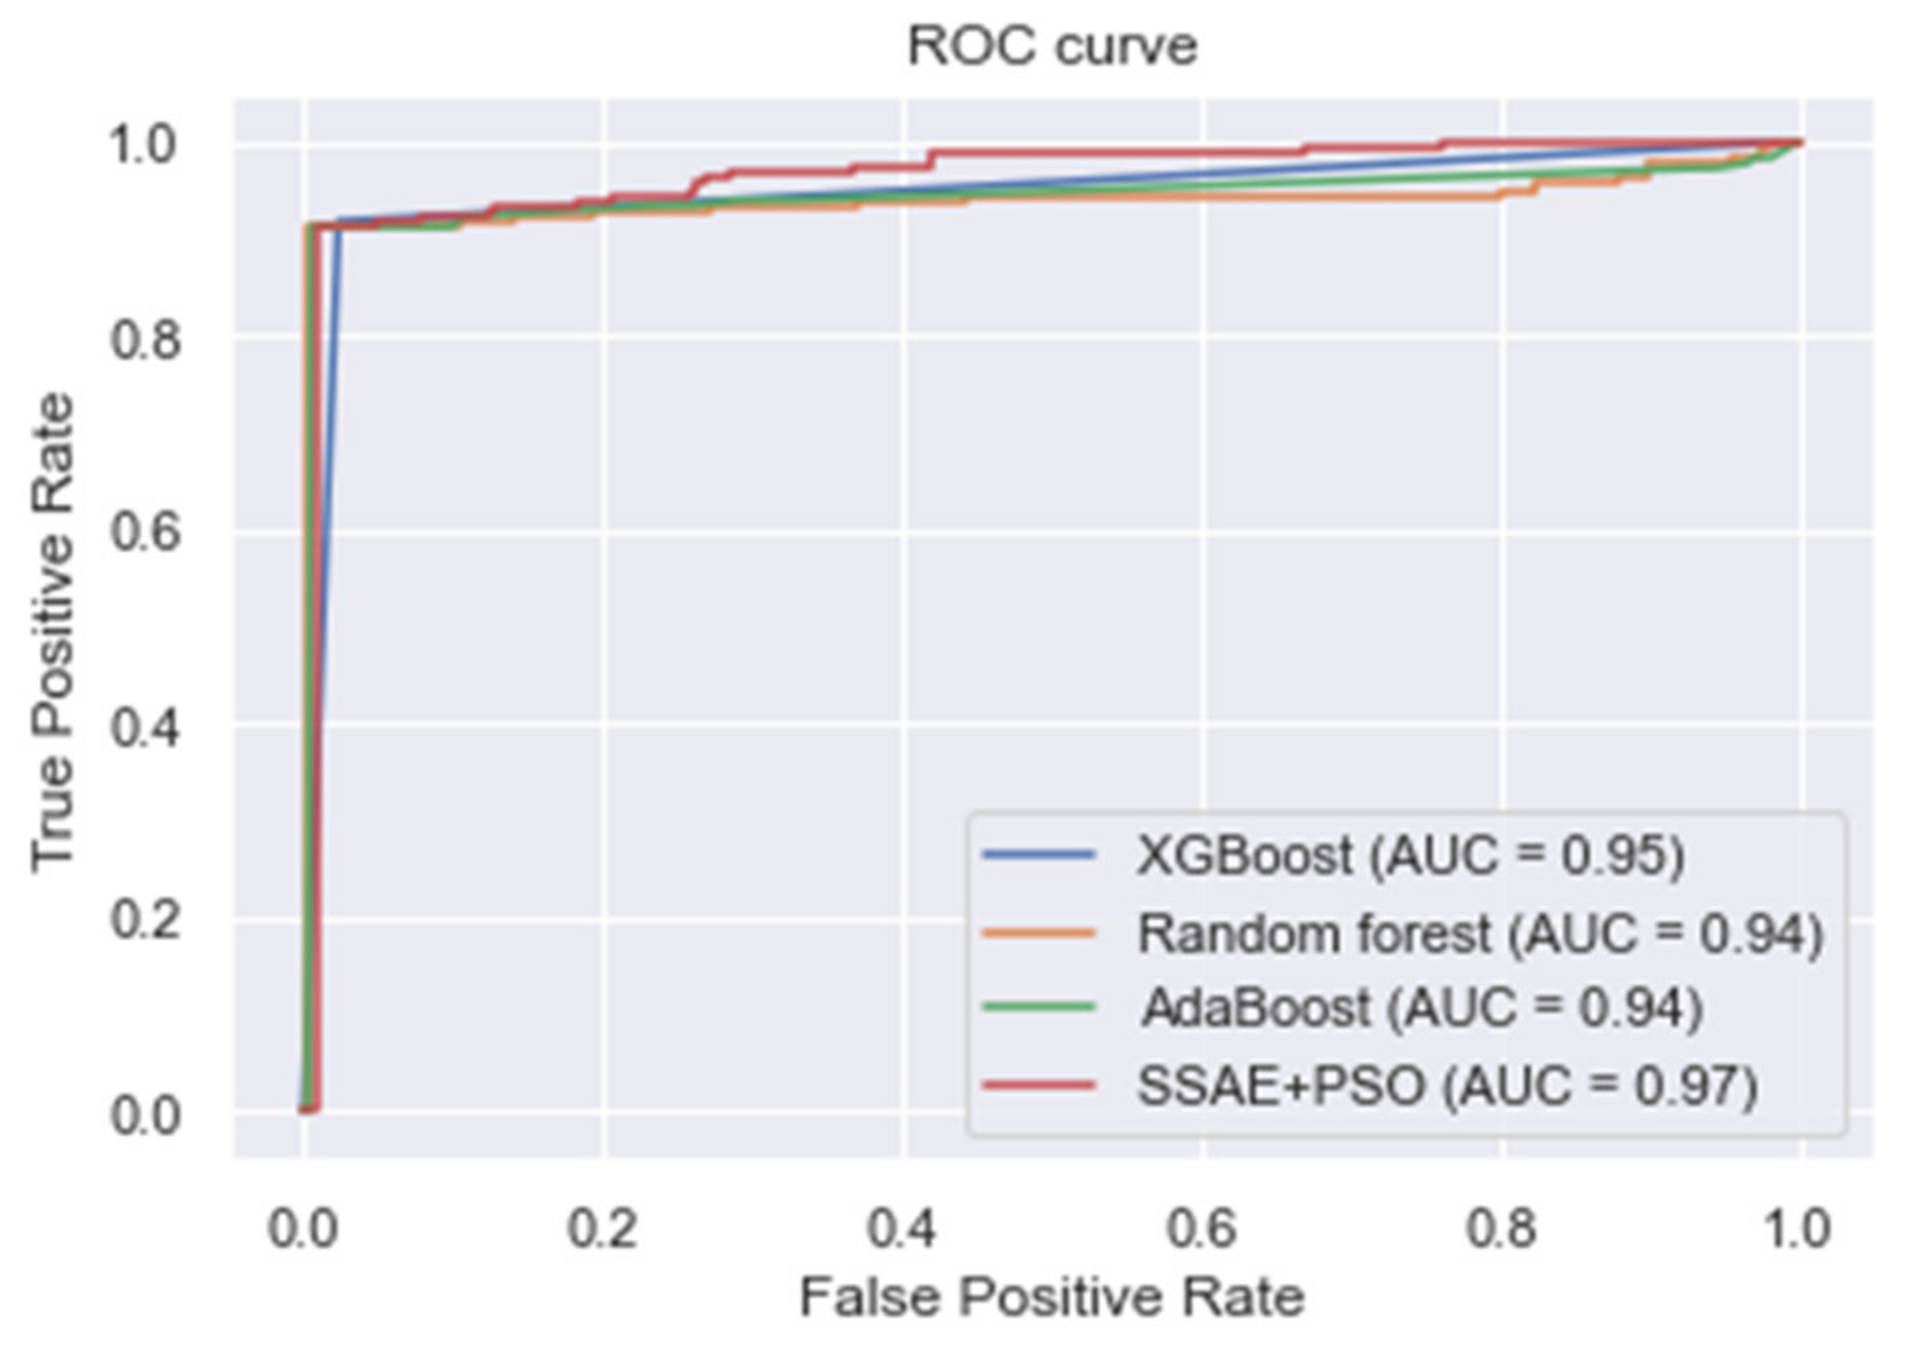
| XGBoost | 0.940 | 0.940 | 0.932 | 0.936 |
| Random Forest | 0.935 | 0.946 | 0.930 | 0.938 |
| AdaBoost | 0.947 | 0.947 | 0.973 | 0.960 |
| Proposed SSAE + PSO | 0.982 | 0.974 | 1.000 | 0.987 |
| Author(s) | Method | Accuracy | Precision | Sensitivity | F-Measure |
|---|---|---|---|---|---|
| Mohan et al. [4] | Hybrid random forest | 0.884 | 0.901 | 0.928 | 0.900 |
| Haq et al. [28] | Improved Logistic Regression Model + FS | 0.890 | - | 0.770 | - |
| Repaka et al. [65] | Naïve Bayes + FS | 0.8977 | - | - | - |
| Samuel et al. [29] | Fuzzy AHP + ANN | 0.910 | - | - | - |
| Ali et al. [69] | Optimized SVM | 0.922 | 0.829 | 1.000 | - |
| Li et al. [5] | FS + SVM | 0.923 | - | 0.98 | - |
| Fitriyani et al. [2] | XGBoost + Resampling | 0.984 | 0.985 | 0.983 | 0.983 |
| Ali and Bukhari [66] | MI + DNN | 0.933 | - | 0.902 | - |
| Mienye et al. [10] | Ensemble learning | 0.930 | 0.960 | 0.910 | 0.930 |
| Mienye et al. [34] | SAE + ANN | 0.900 | 0.890 | 0.910 | 0.900 |
| Reddy et al. [67] | Hybrid GA + Fuzzy Classifier | 0.900 | - | 0.910 | - |
| Paul et al. [68] | Ensemble Fuzzy system + GA + PSO | 0.923 | - | - | - |
| Our approach | SSAE + PSO | 0.961 | 0.930 | 0.988 | 0.958 |
Publisher’s Note: MDPI stays neutral with regard to jurisdictional claims in published maps and institutional affiliations. |
© 2021 by the authors. Licensee MDPI, Basel, Switzerland. This article is an open access article distributed under the terms and conditions of the Creative Commons Attribution (CC BY) license (https://creativecommons.org/licenses/by/4.0/).
Share and Cite
Mienye, I.D.; Sun, Y. Improved Heart Disease Prediction Using Particle Swarm Optimization Based Stacked Sparse Autoencoder. Electronics 2021, 10, 2347. https://doi.org/10.3390/electronics10192347
Mienye ID, Sun Y. Improved Heart Disease Prediction Using Particle Swarm Optimization Based Stacked Sparse Autoencoder. Electronics. 2021; 10(19):2347. https://doi.org/10.3390/electronics10192347
Chicago/Turabian StyleMienye, Ibomoiye Domor, and Yanxia Sun. 2021. "Improved Heart Disease Prediction Using Particle Swarm Optimization Based Stacked Sparse Autoencoder" Electronics 10, no. 19: 2347. https://doi.org/10.3390/electronics10192347
APA StyleMienye, I. D., & Sun, Y. (2021). Improved Heart Disease Prediction Using Particle Swarm Optimization Based Stacked Sparse Autoencoder. Electronics, 10(19), 2347. https://doi.org/10.3390/electronics10192347