
Parameter Estimation of Modified Double-Diode and Triple-Diode Photovoltaic Models Based on Wild Horse Optimizer


Abstract
:
1. Introduction
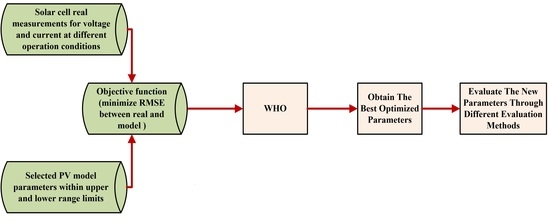
2. PV Mathematical Modeling and Optimization Problem
2.1. DDM and MDDM
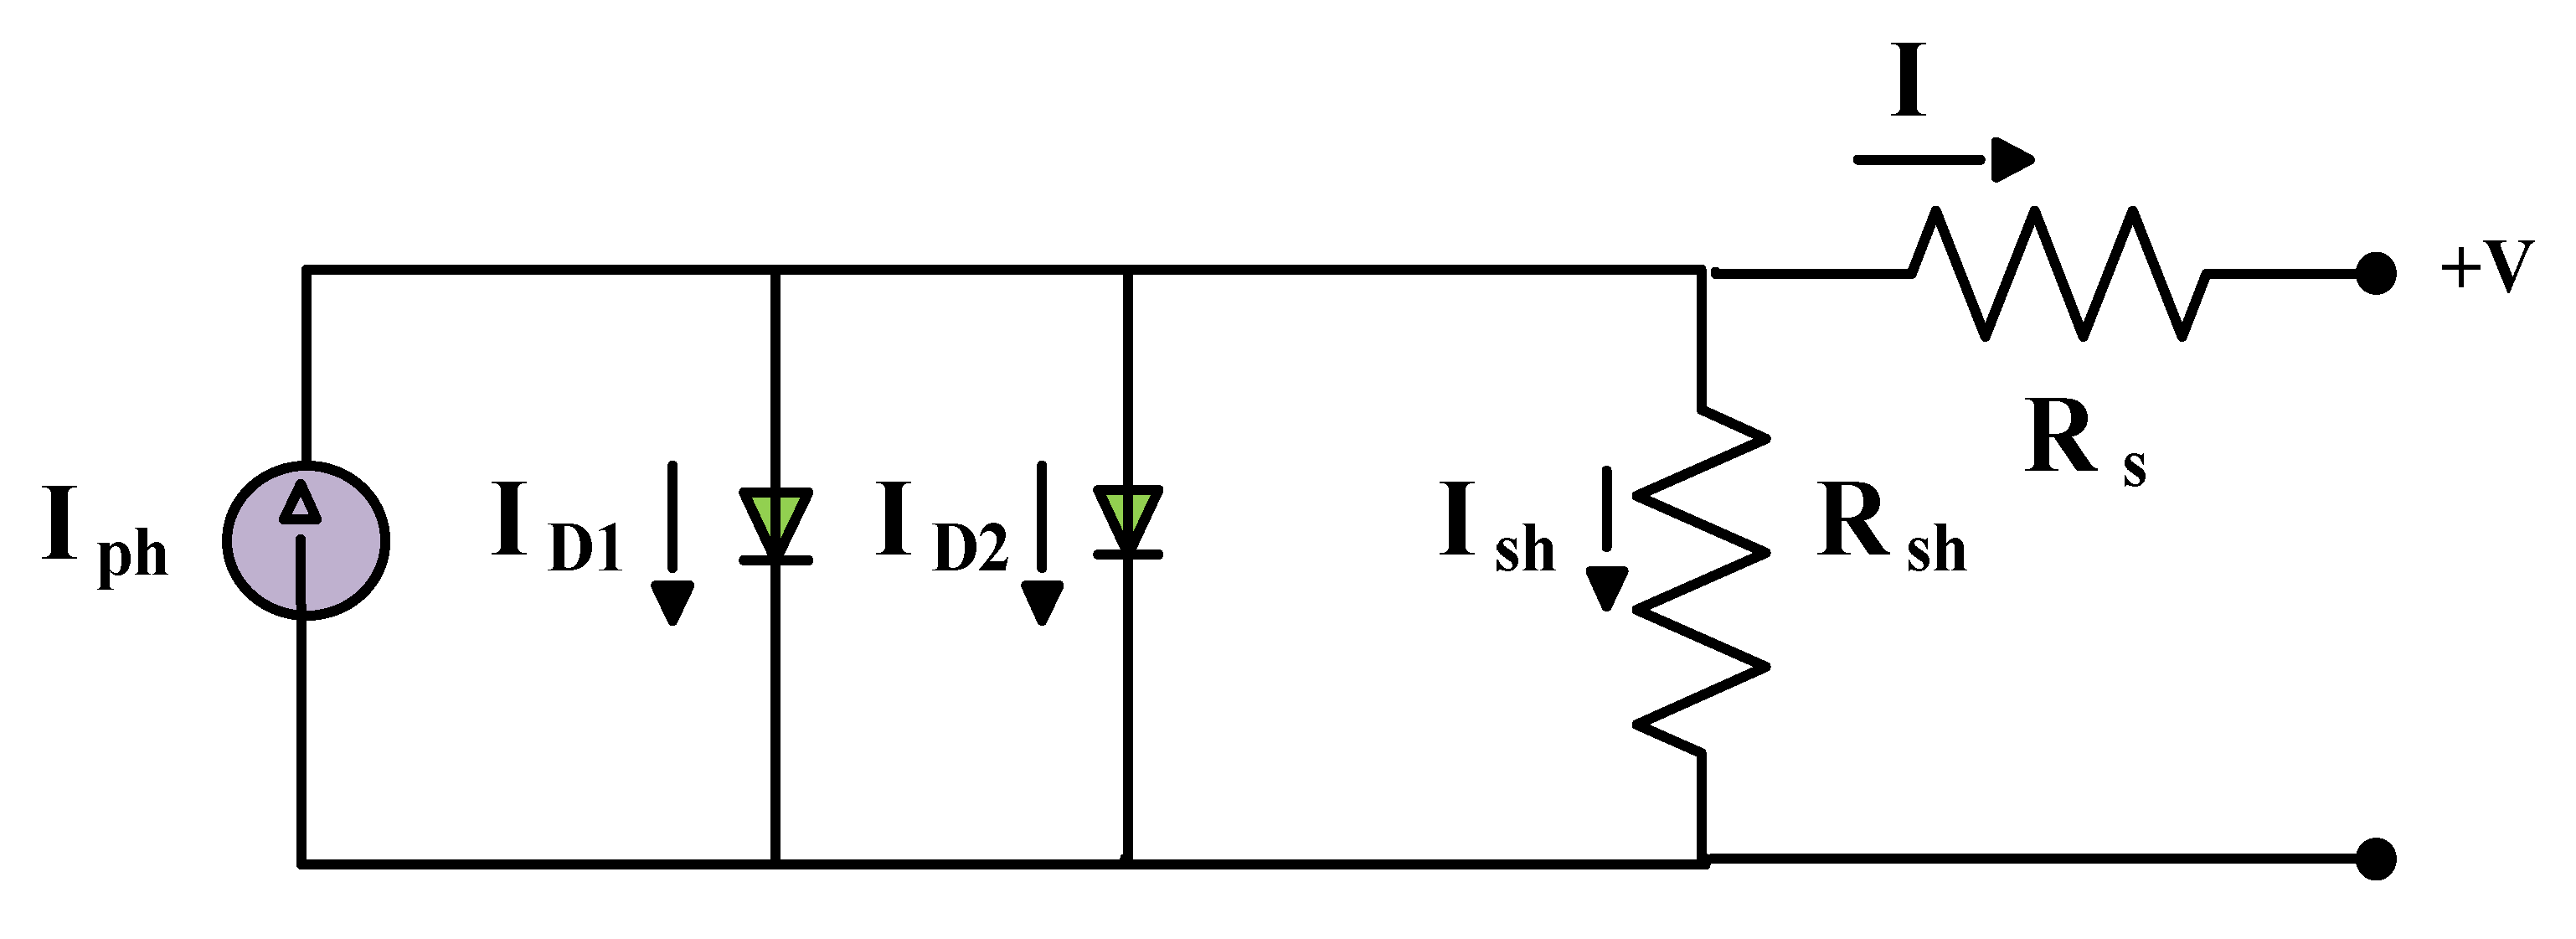
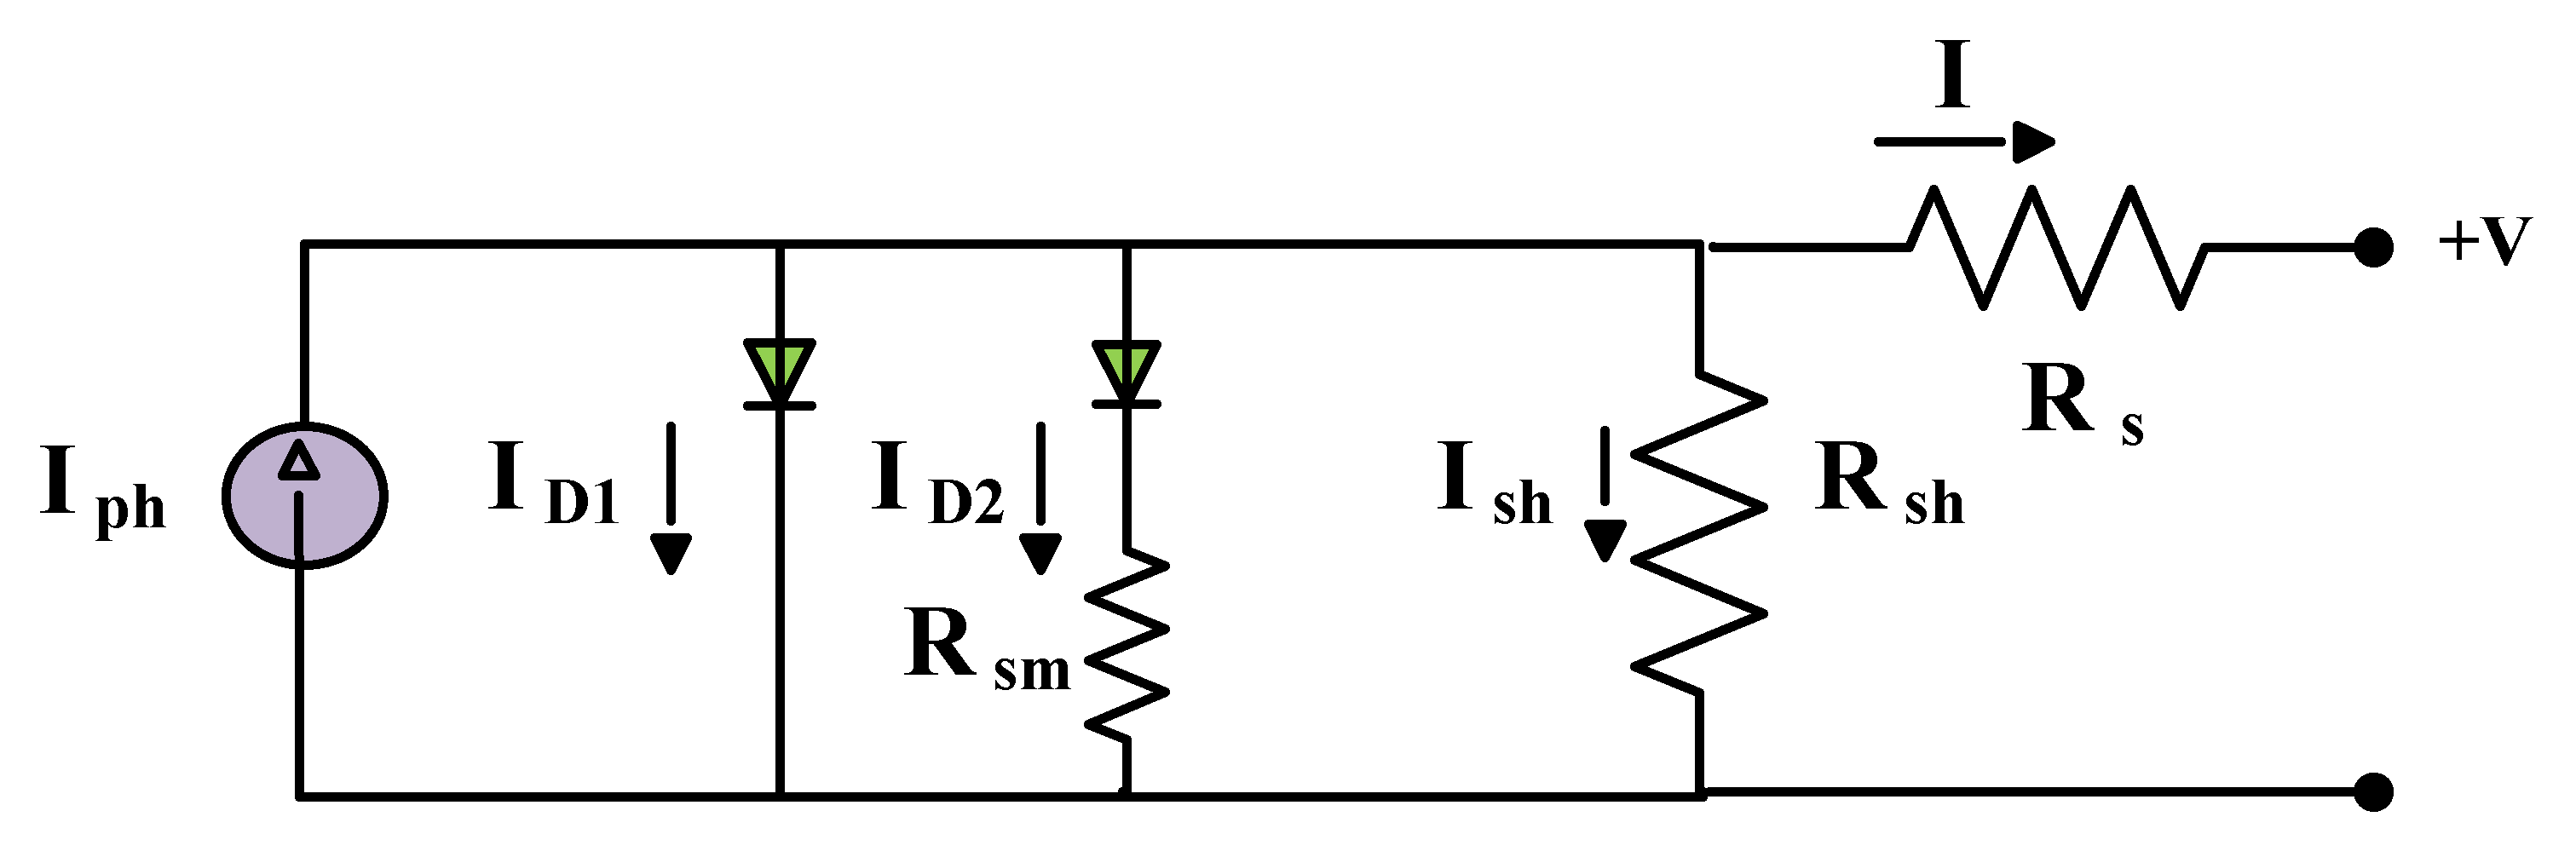
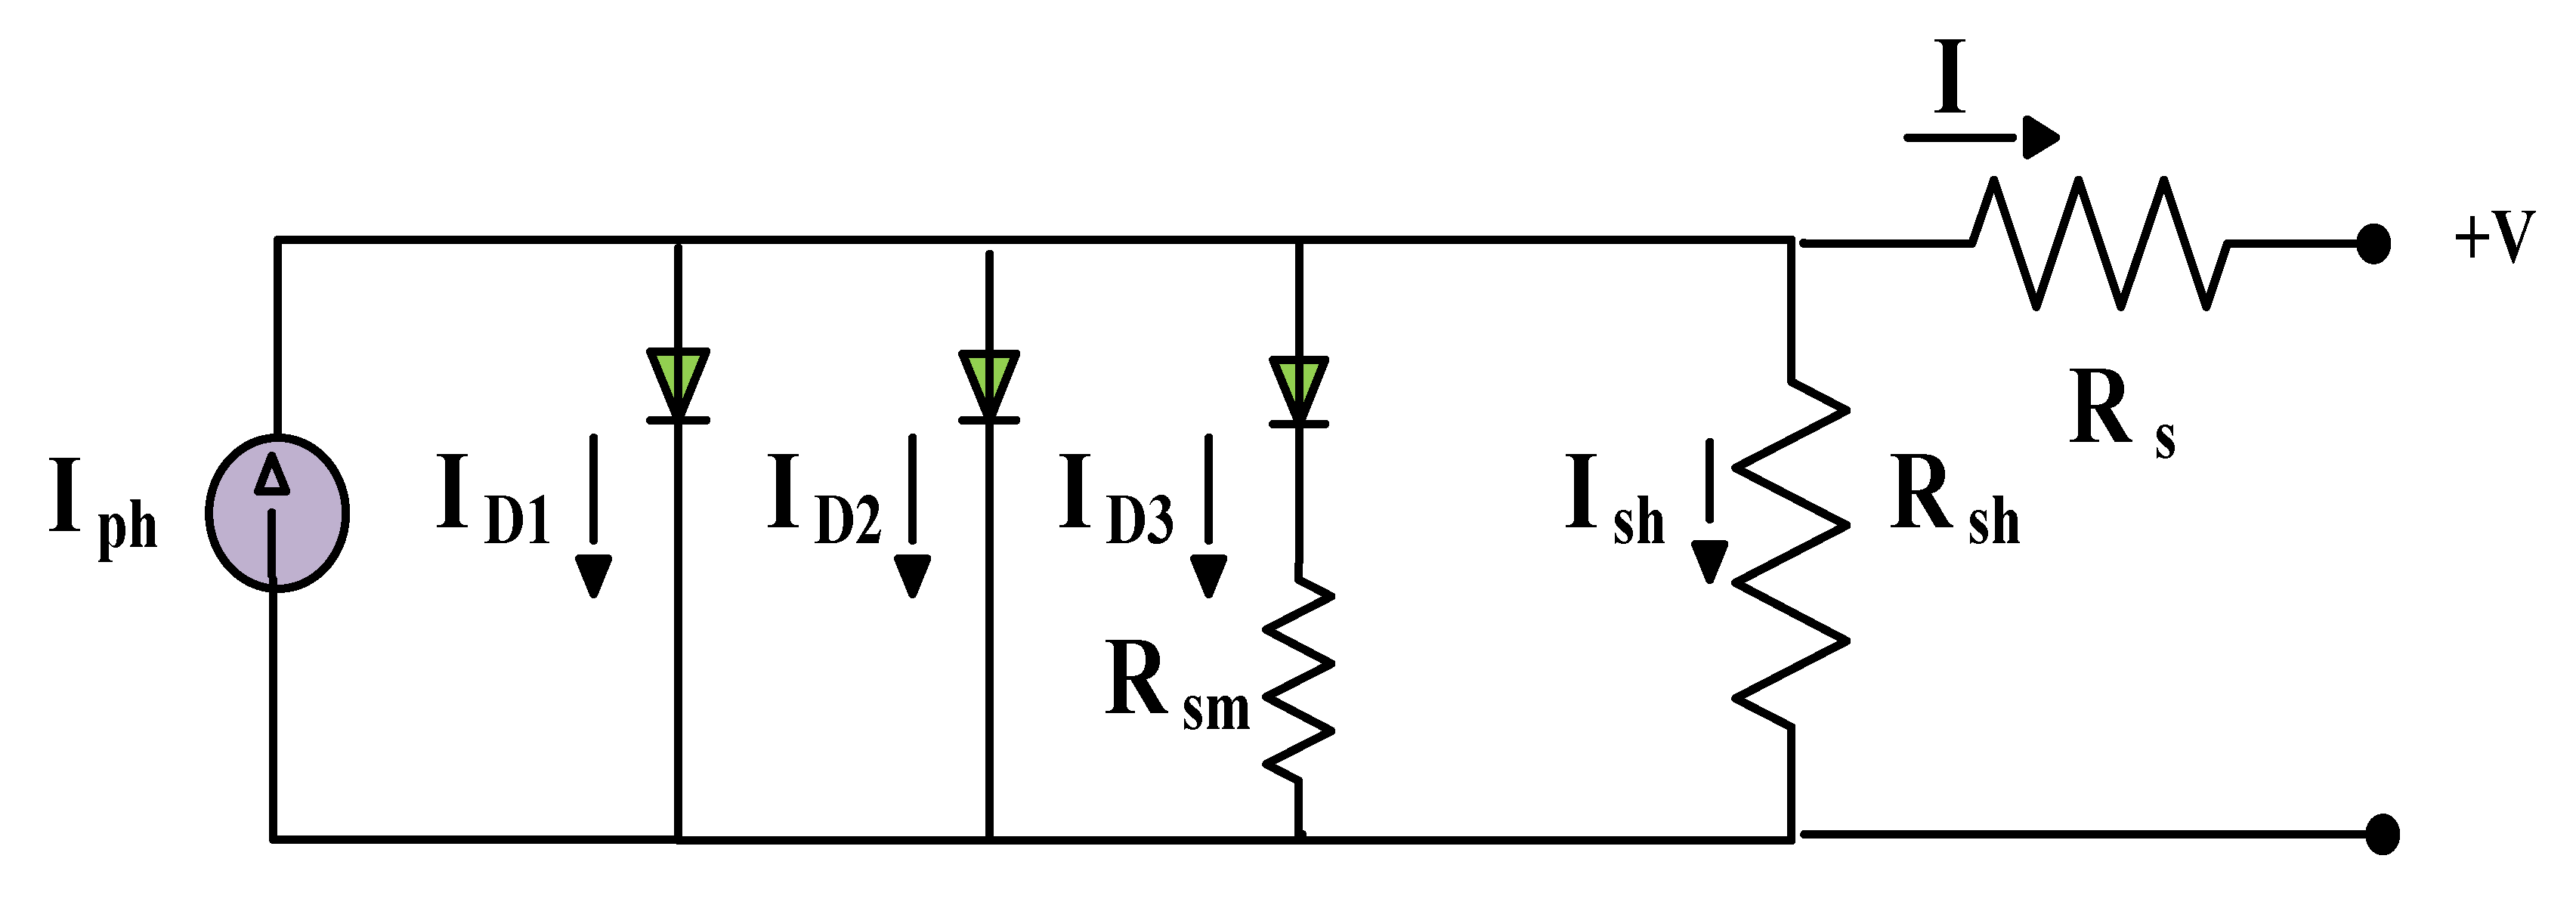
2.2. TDM and MTDM
- -
- [Iph] Current source representing the photo-generated current;
- -
- [Is1] Current of the first diode representing the cell diffusion current;
- -
- [Is2] Current of the second diode representing the cell recombination current;
- -
- [Is3] Current of the third diode representing the cell grain boundaries and large leakage current;
- -
- [Rs] Series resistance representing the effect of the semiconductor material resistance at neutral regions;
- -
- [Rsh] Shunt resistance representing the effect of P-N junction leakage current resistance.
3. Wild Horse Optimizer (WHO)
- -
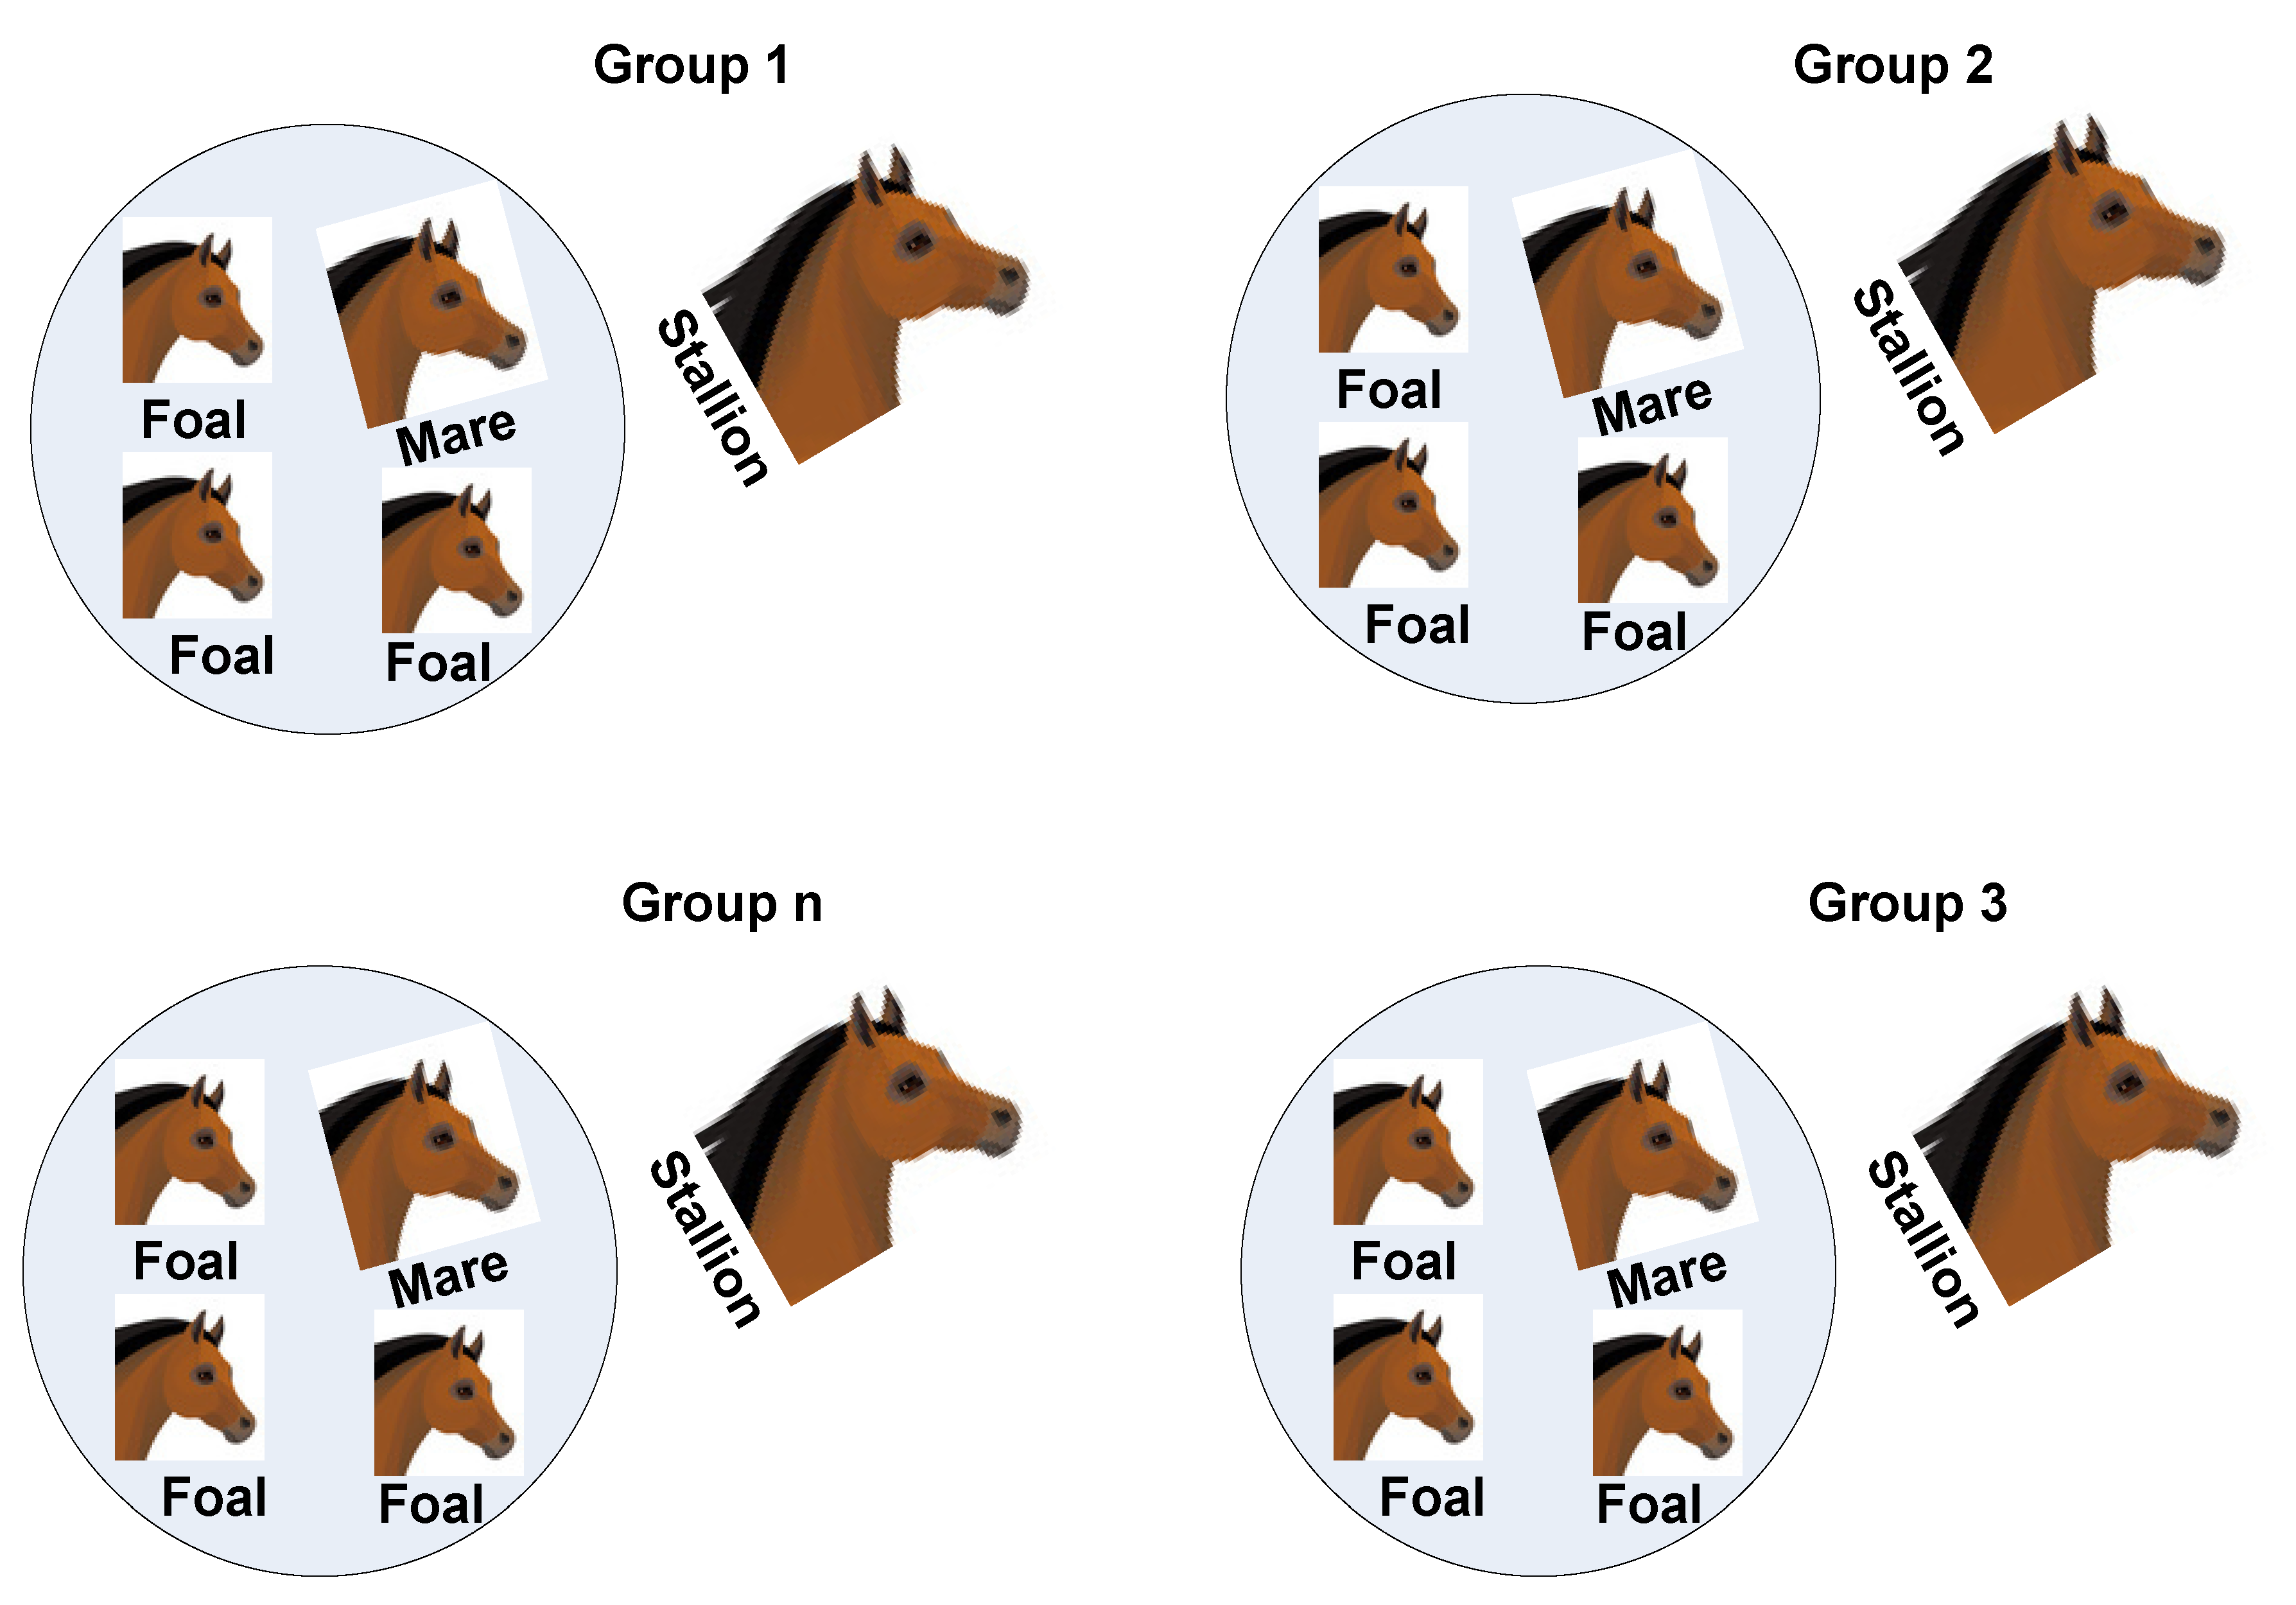
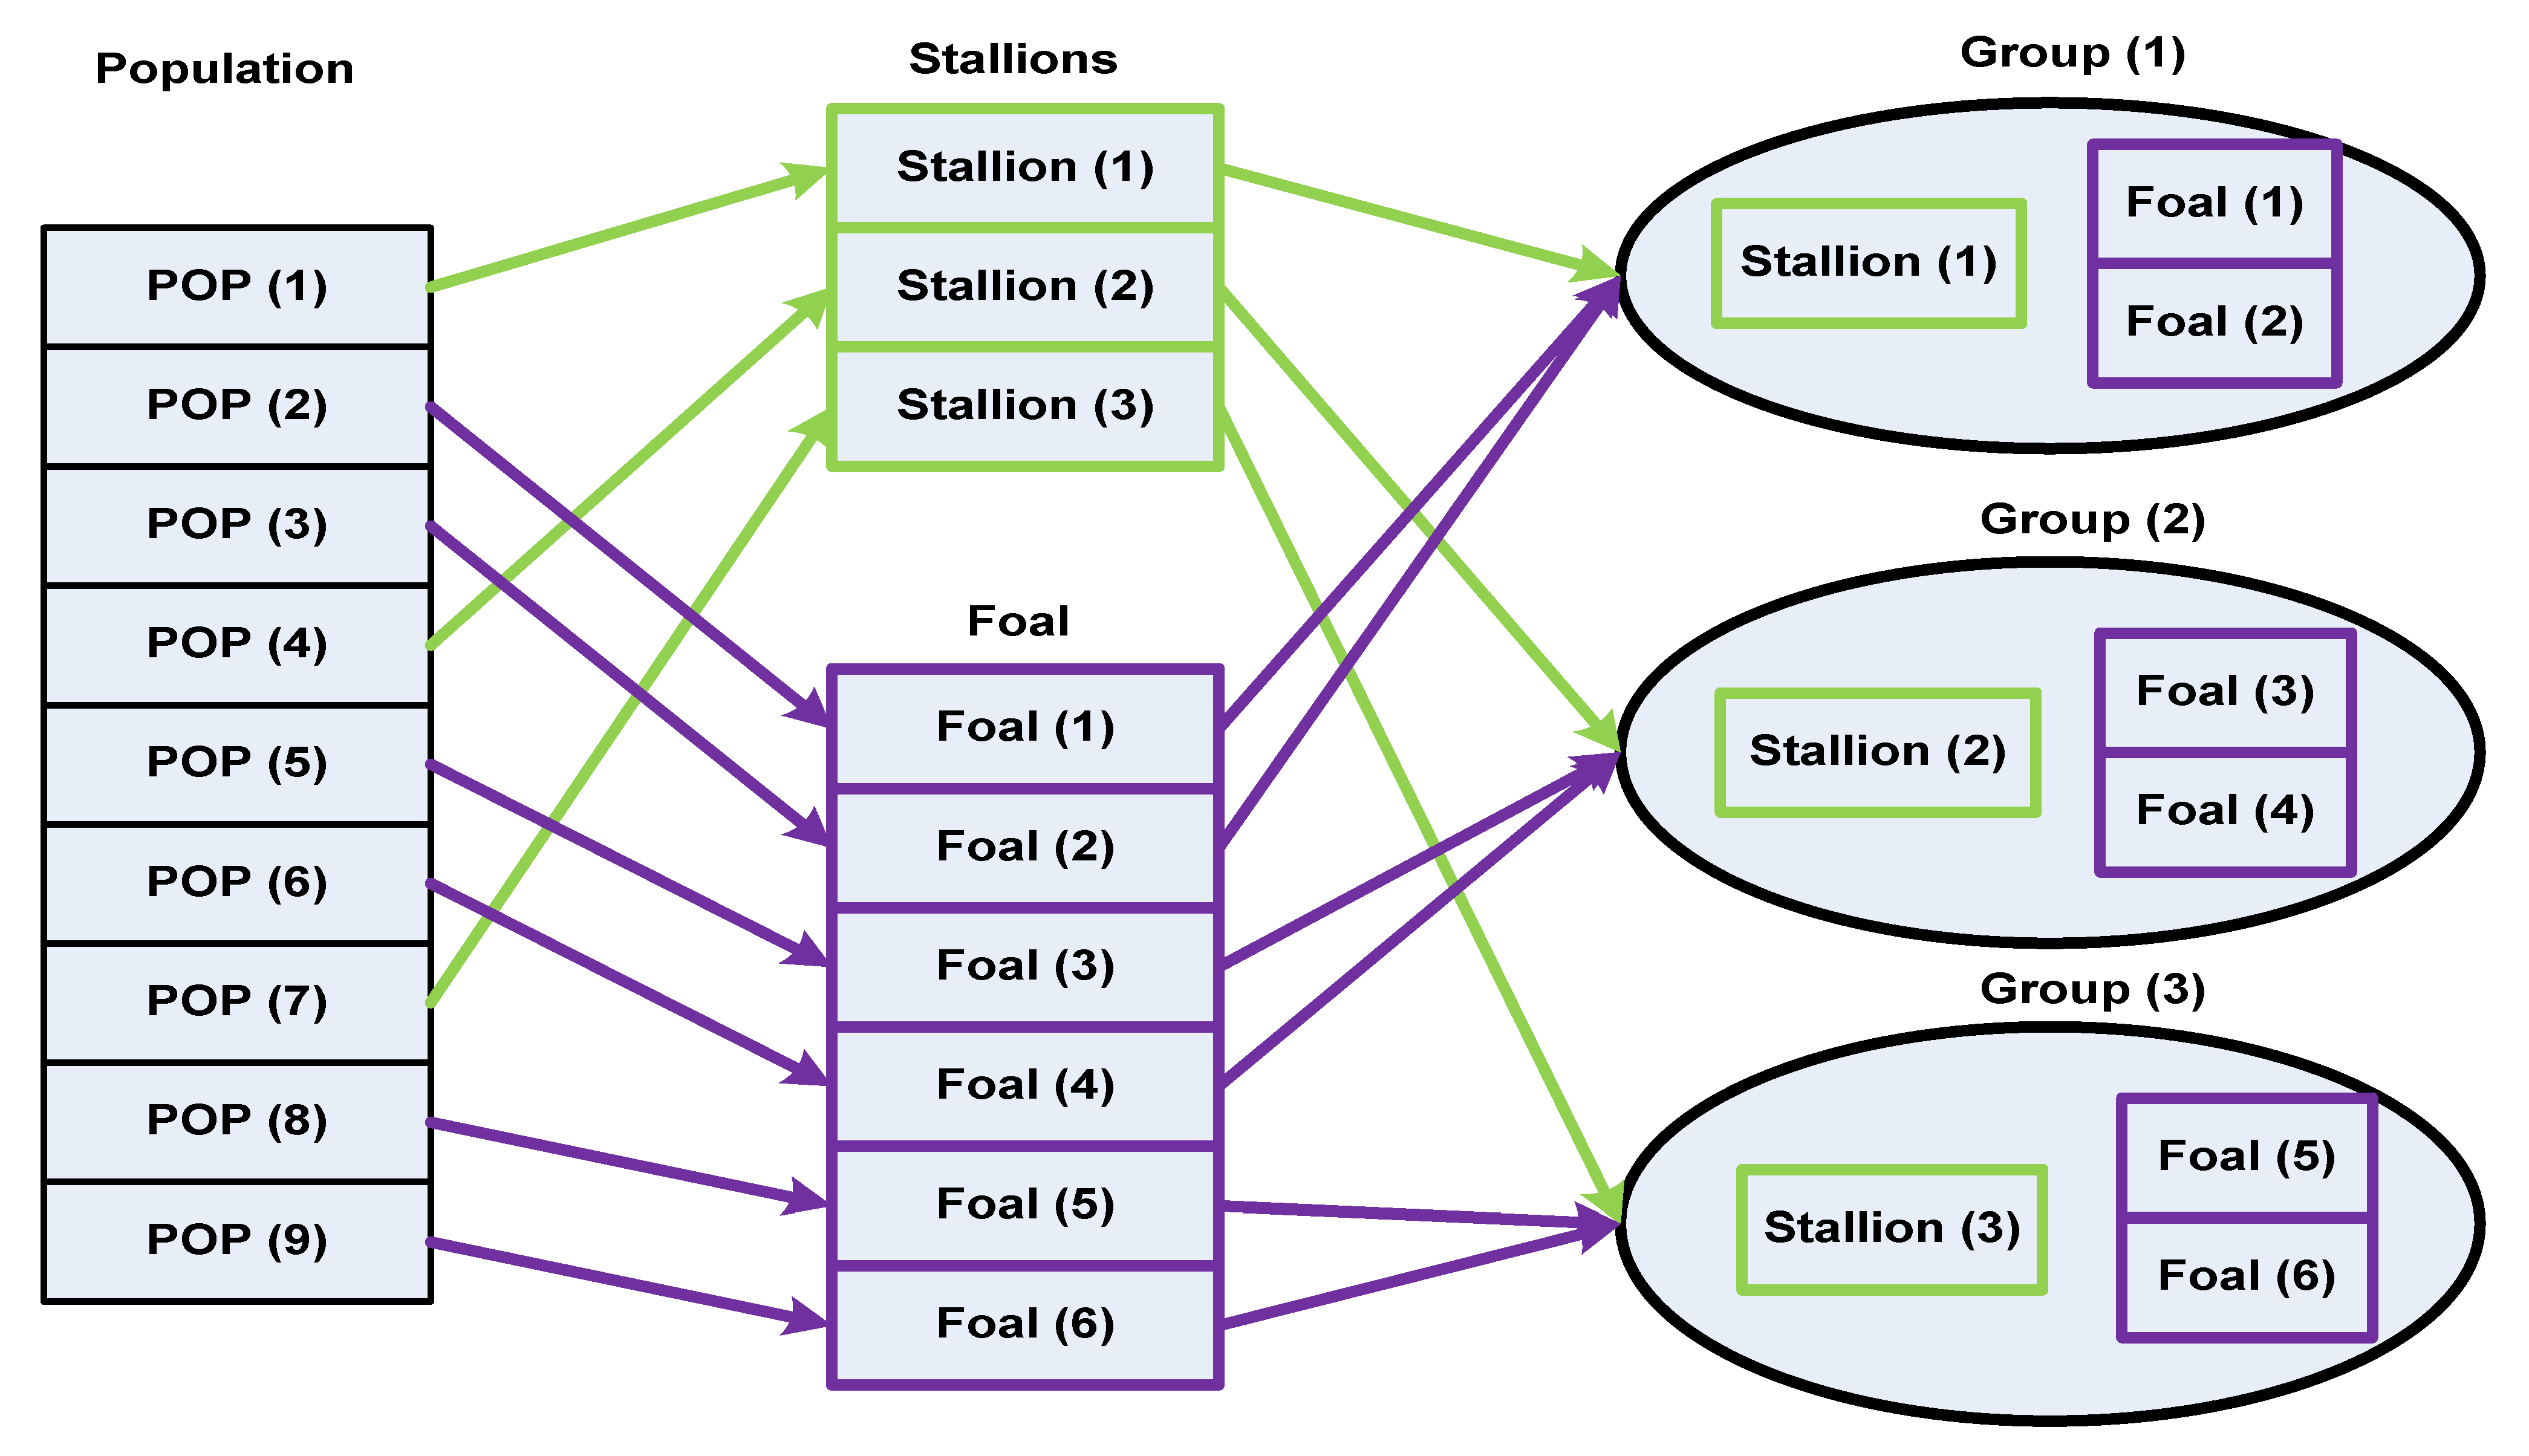
- Starting the problem initialization and collecting groups of horses with their leaders;
- -
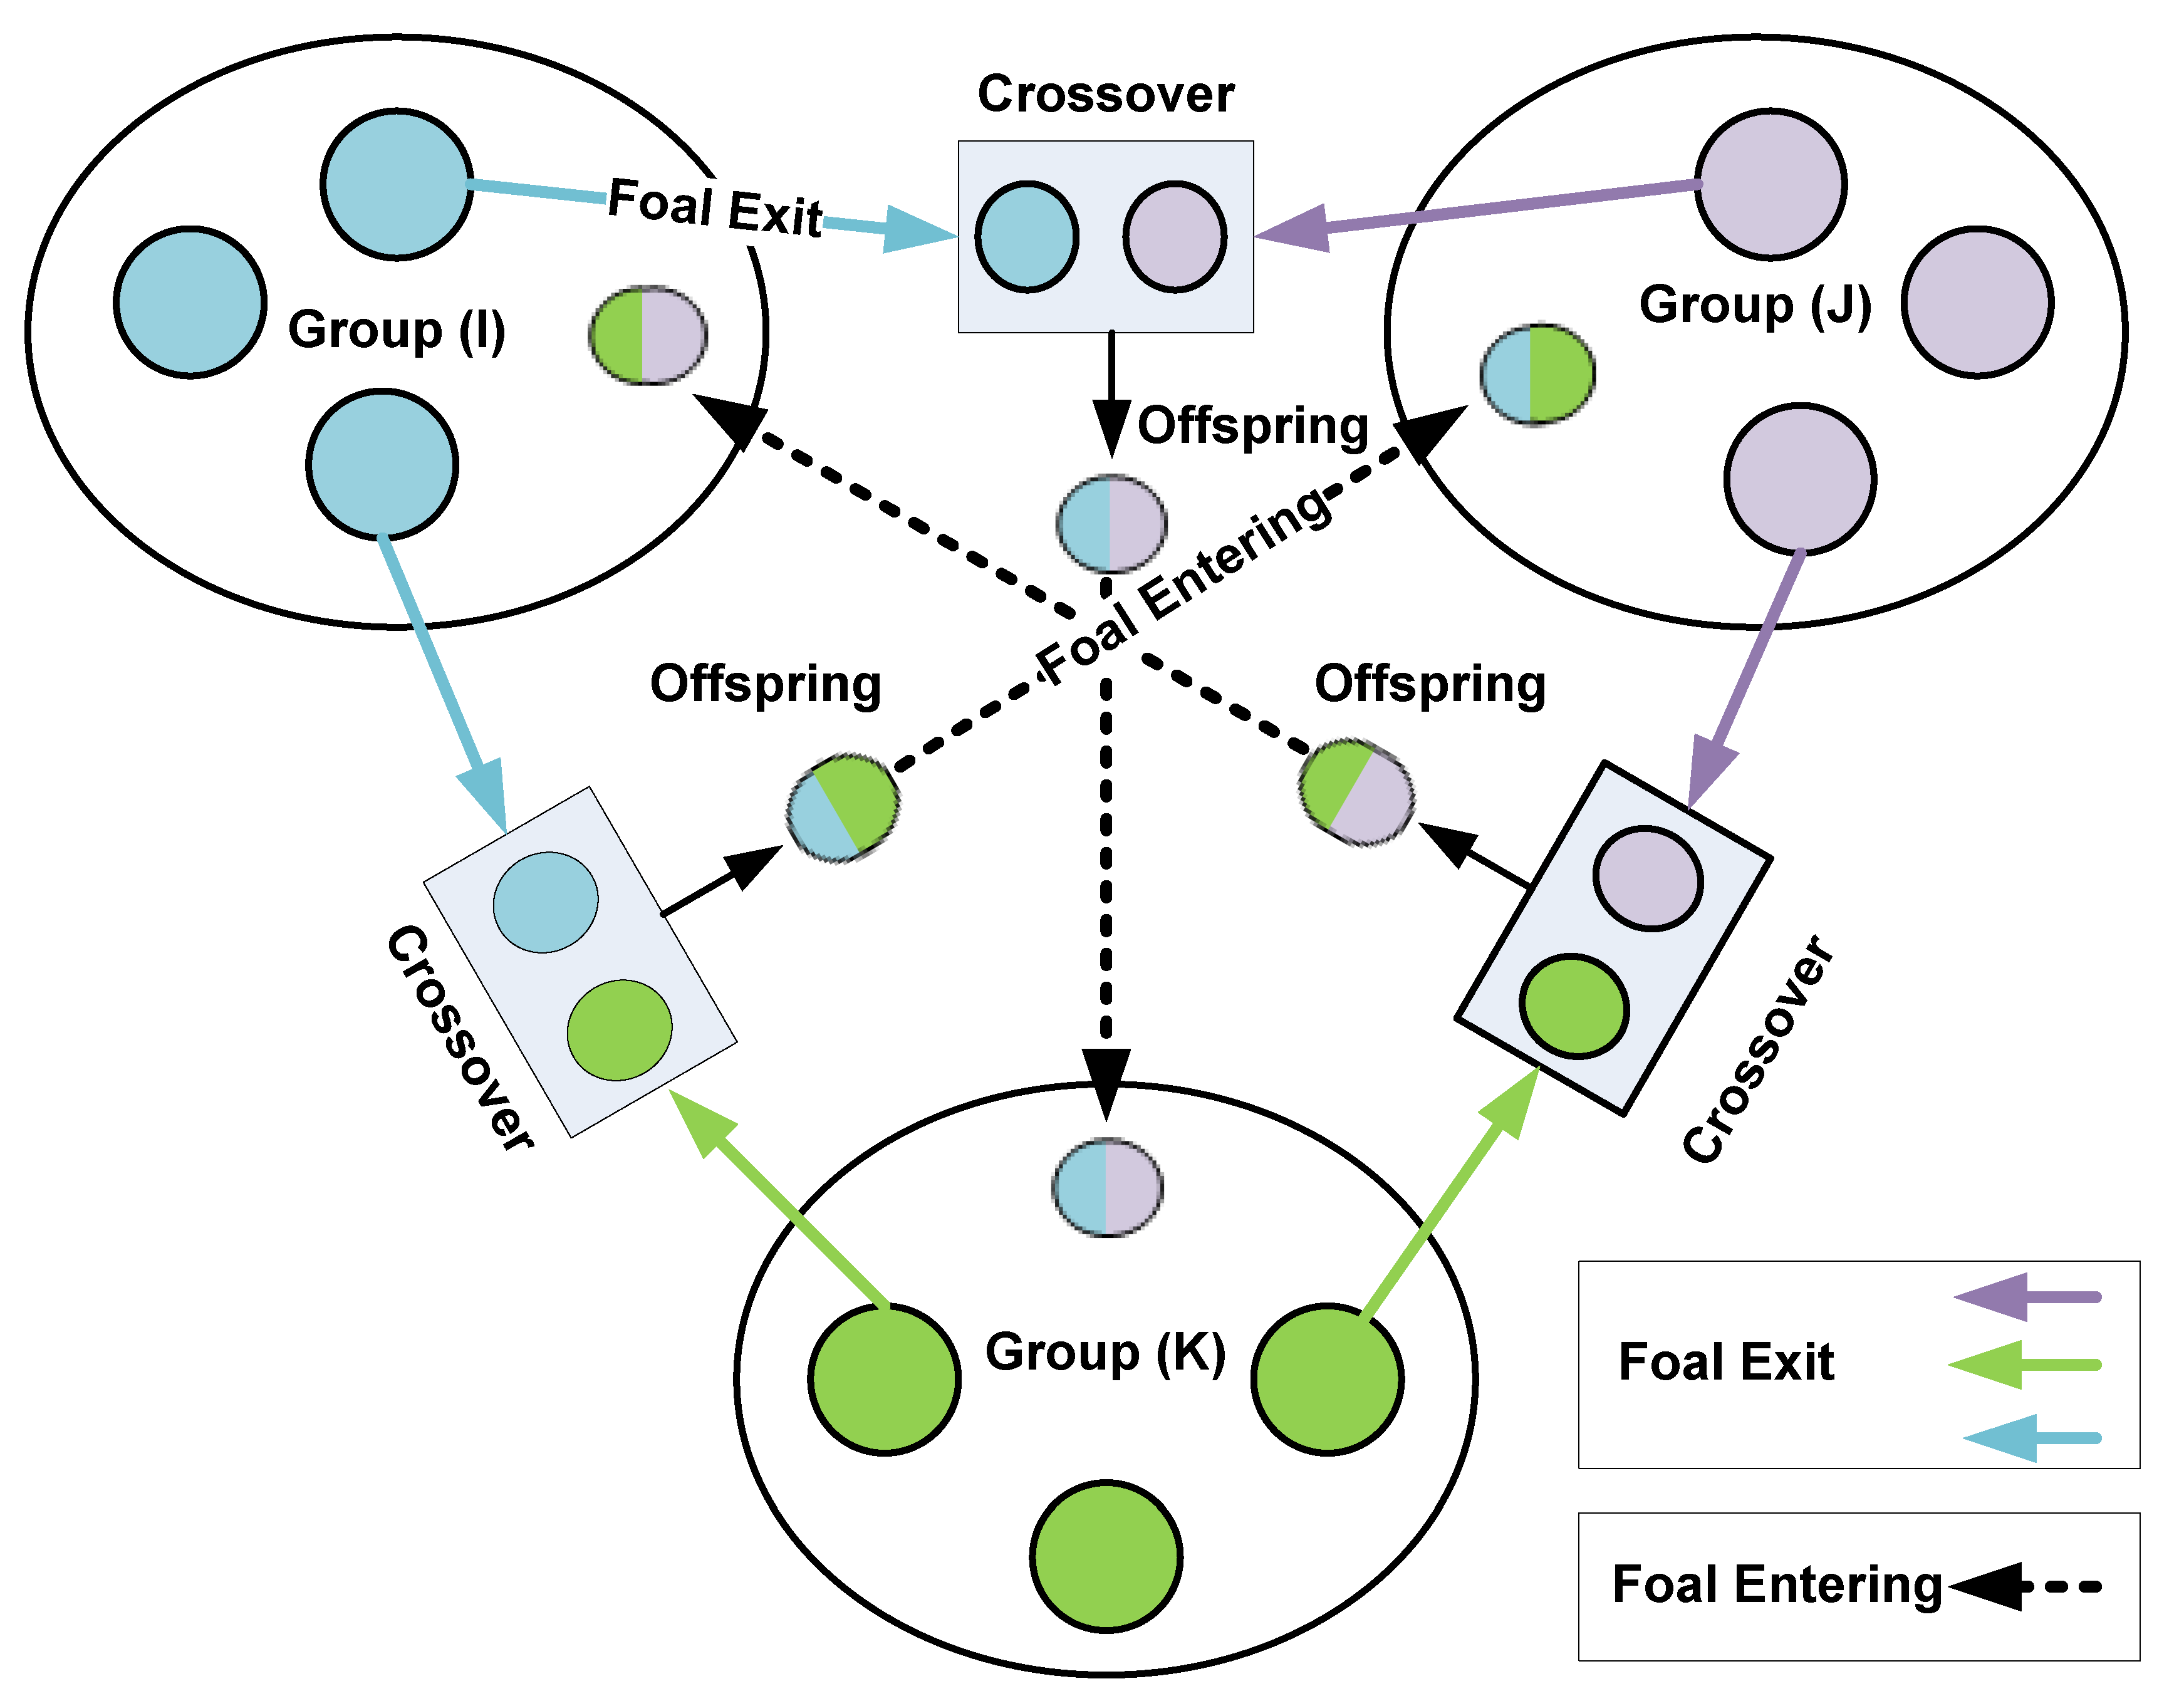
- Mating and grazing of horses;
- -
- Leadership of the group (stallion);
- -
- Selecting the leaders and applying to exchange;
- -
- Obtaining the best solutions.
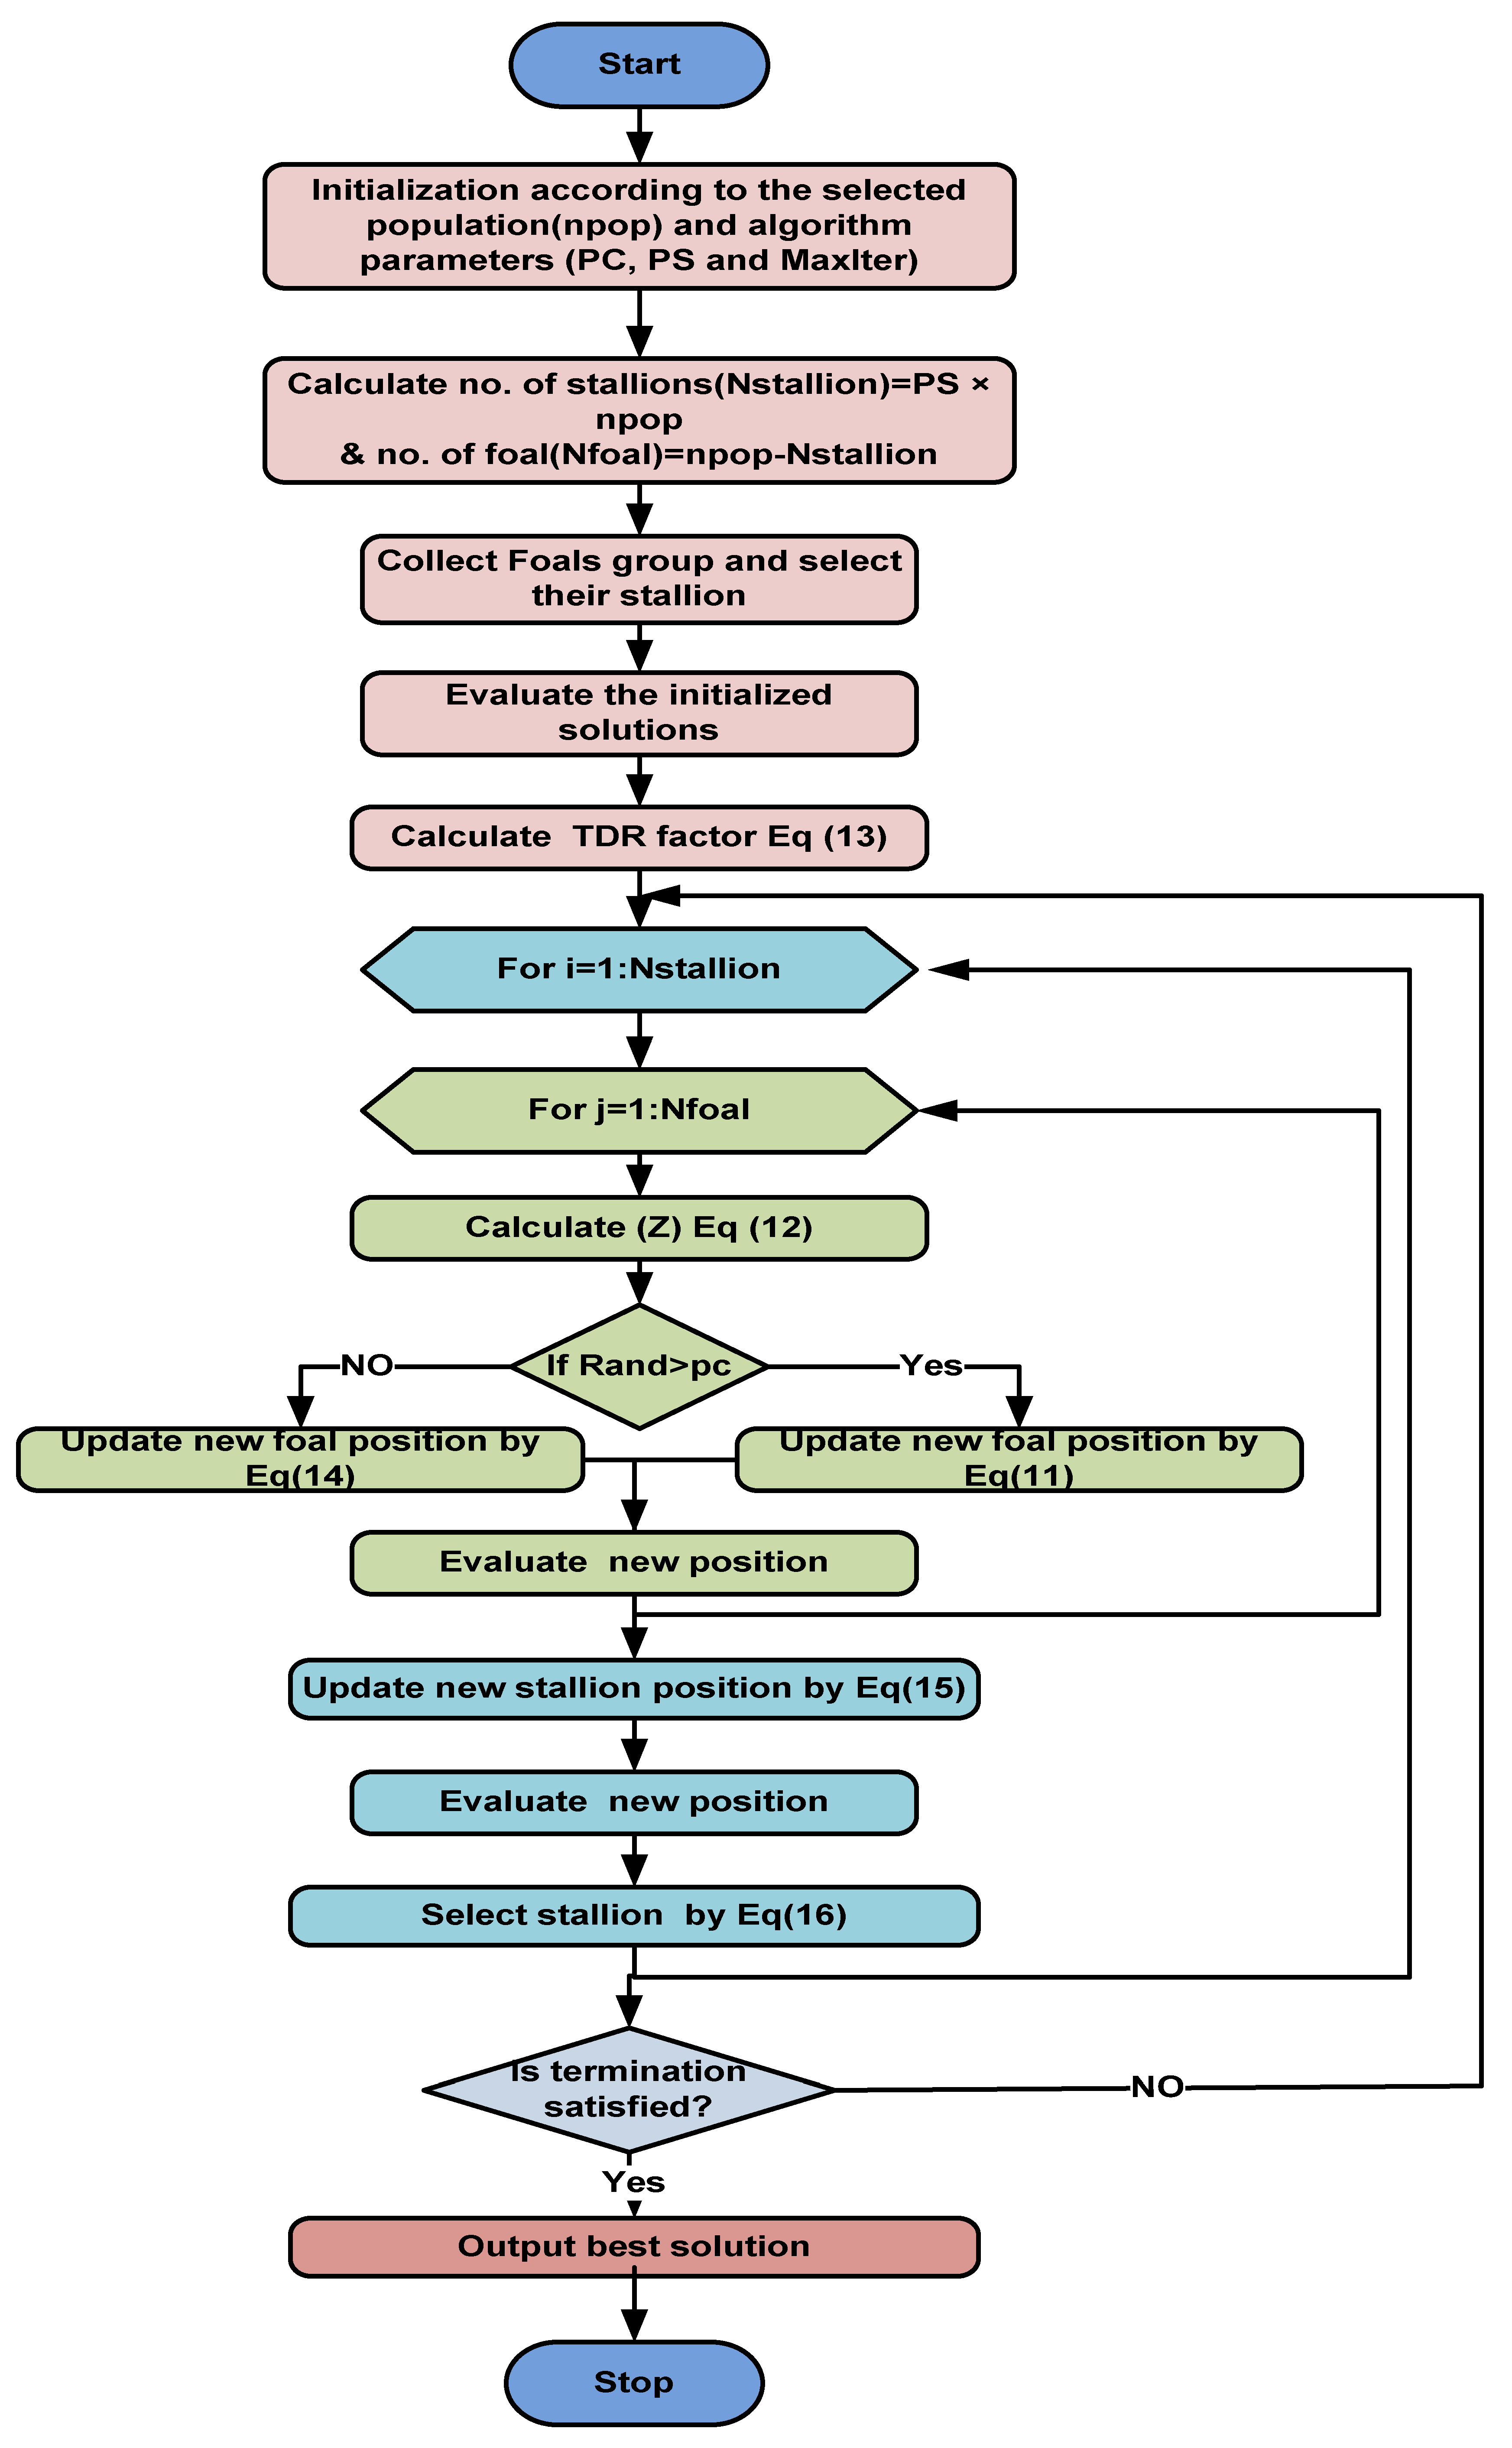
3.1. Initialization for the Problem
3.2. Grazing Behavior of Horses
3.3. Horse Mating Behavior
3.4. Leadership of Groups
3.5. Selecting and Exchanging Leaders
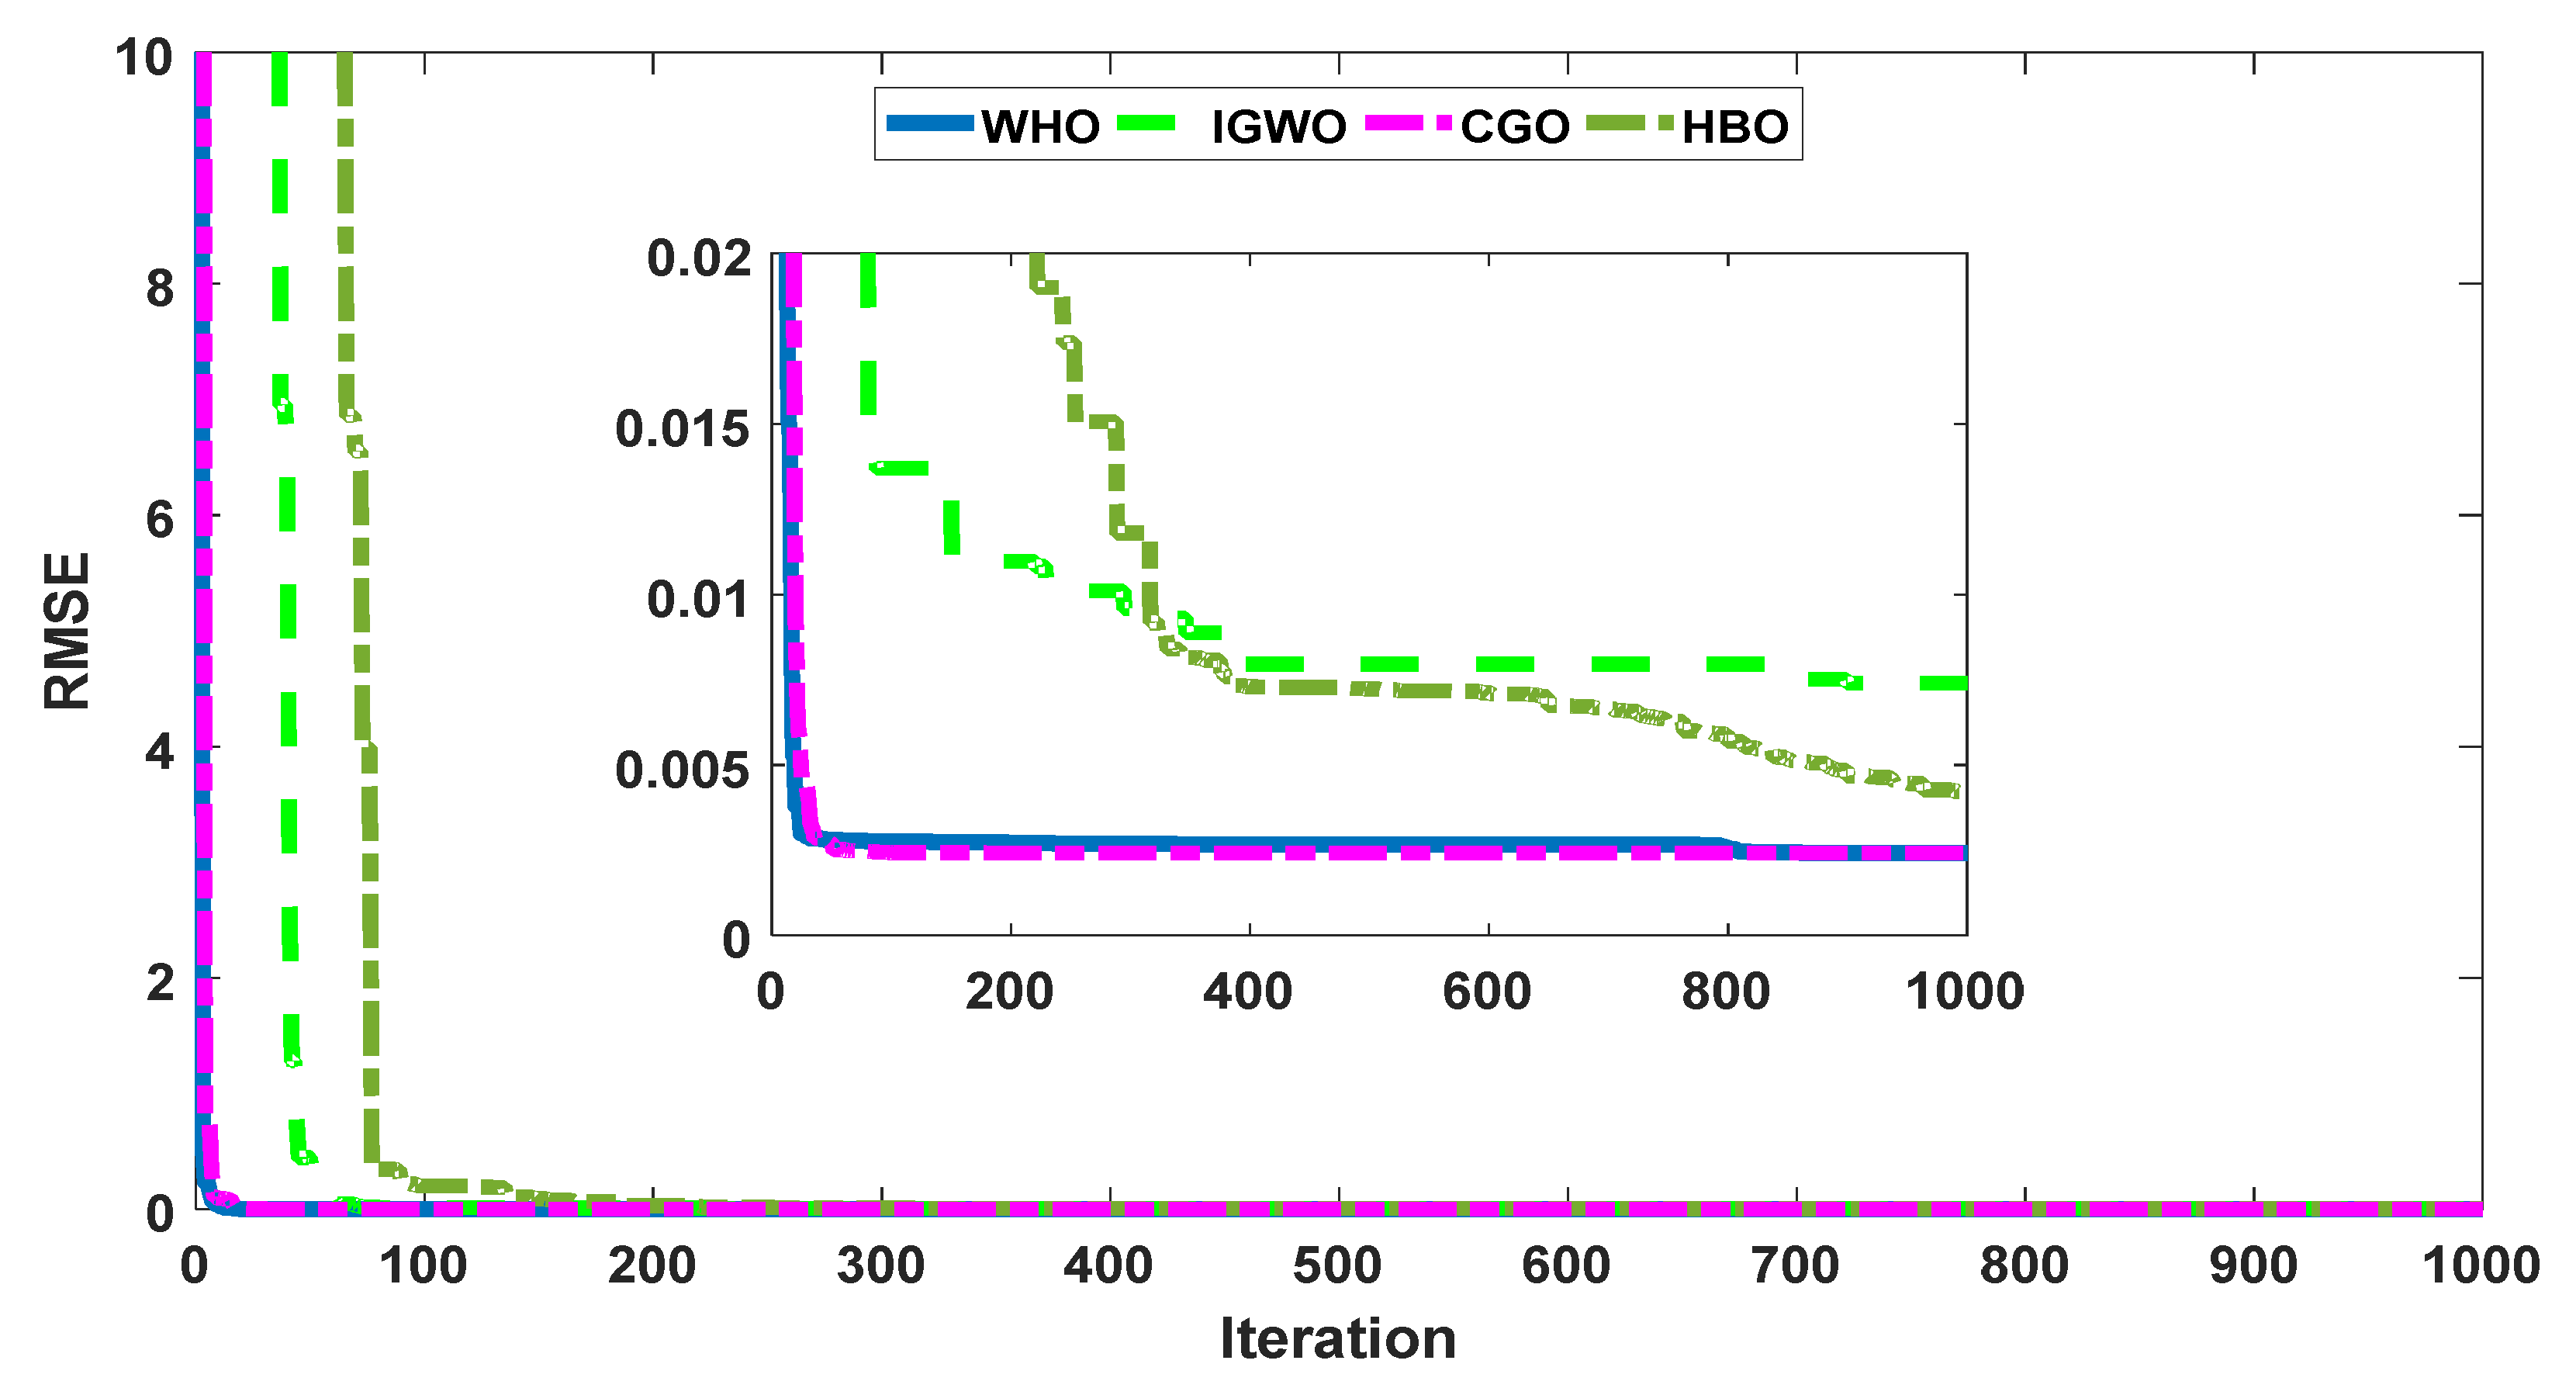
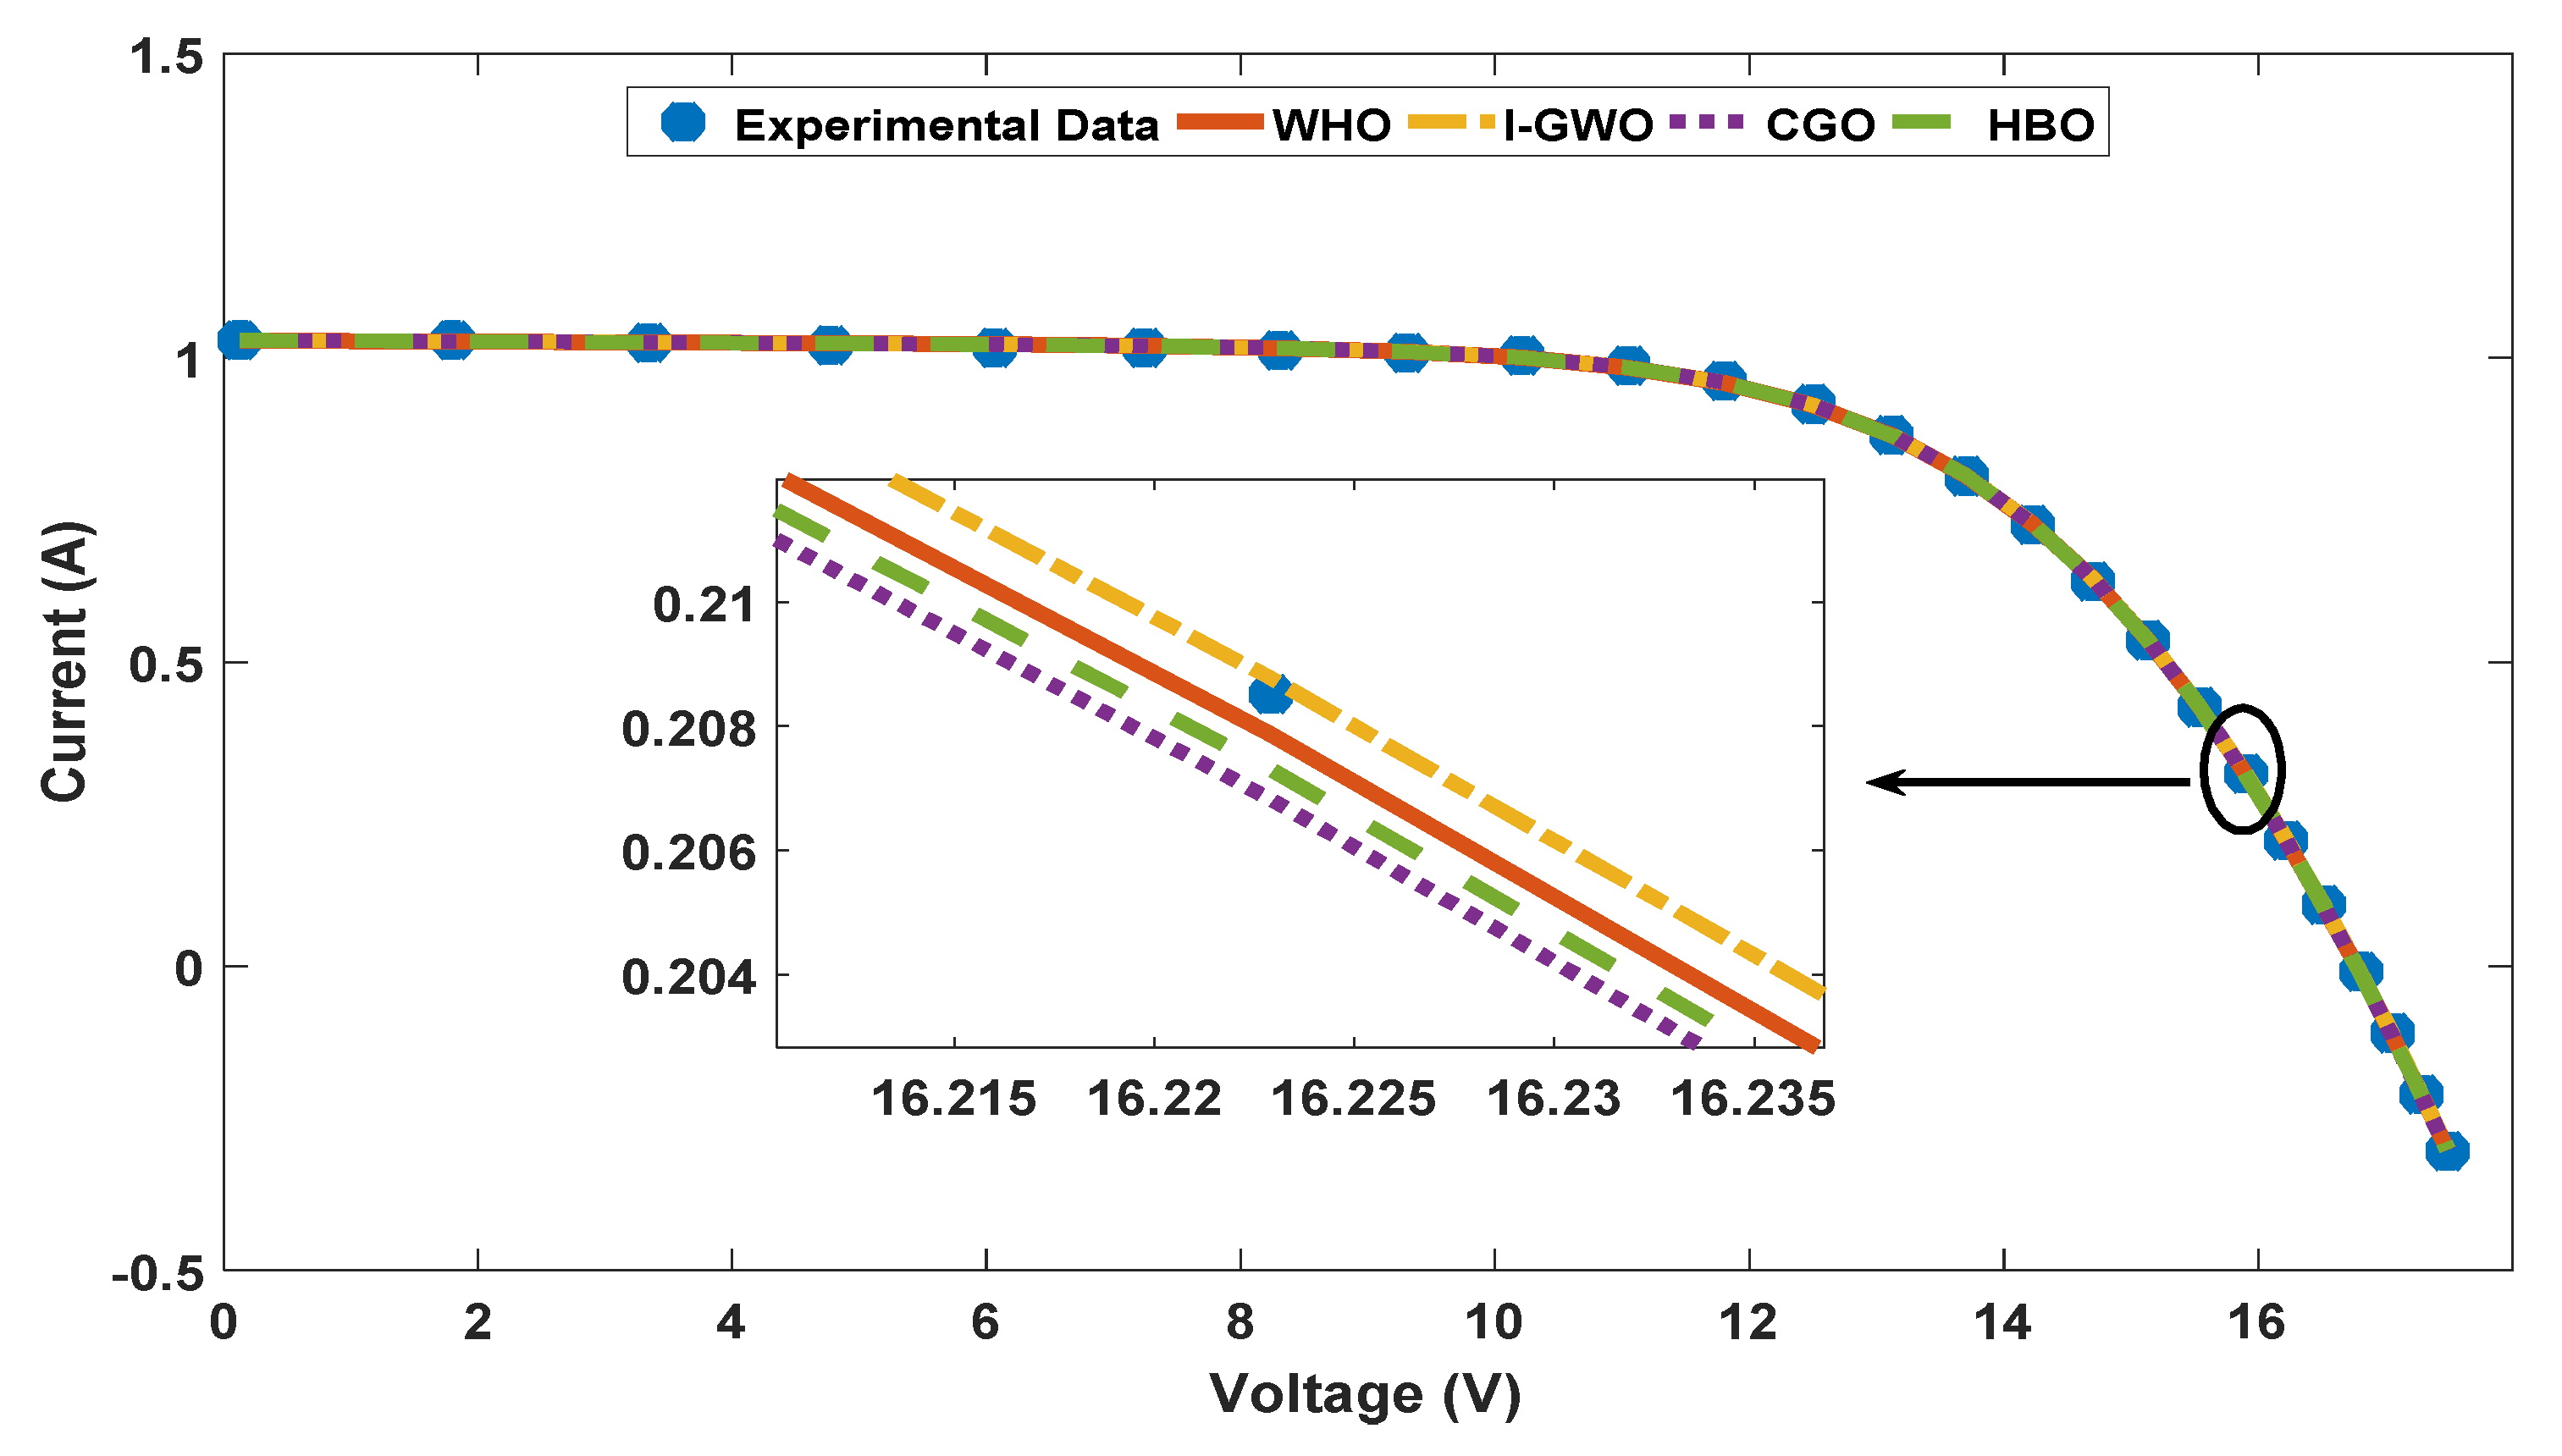
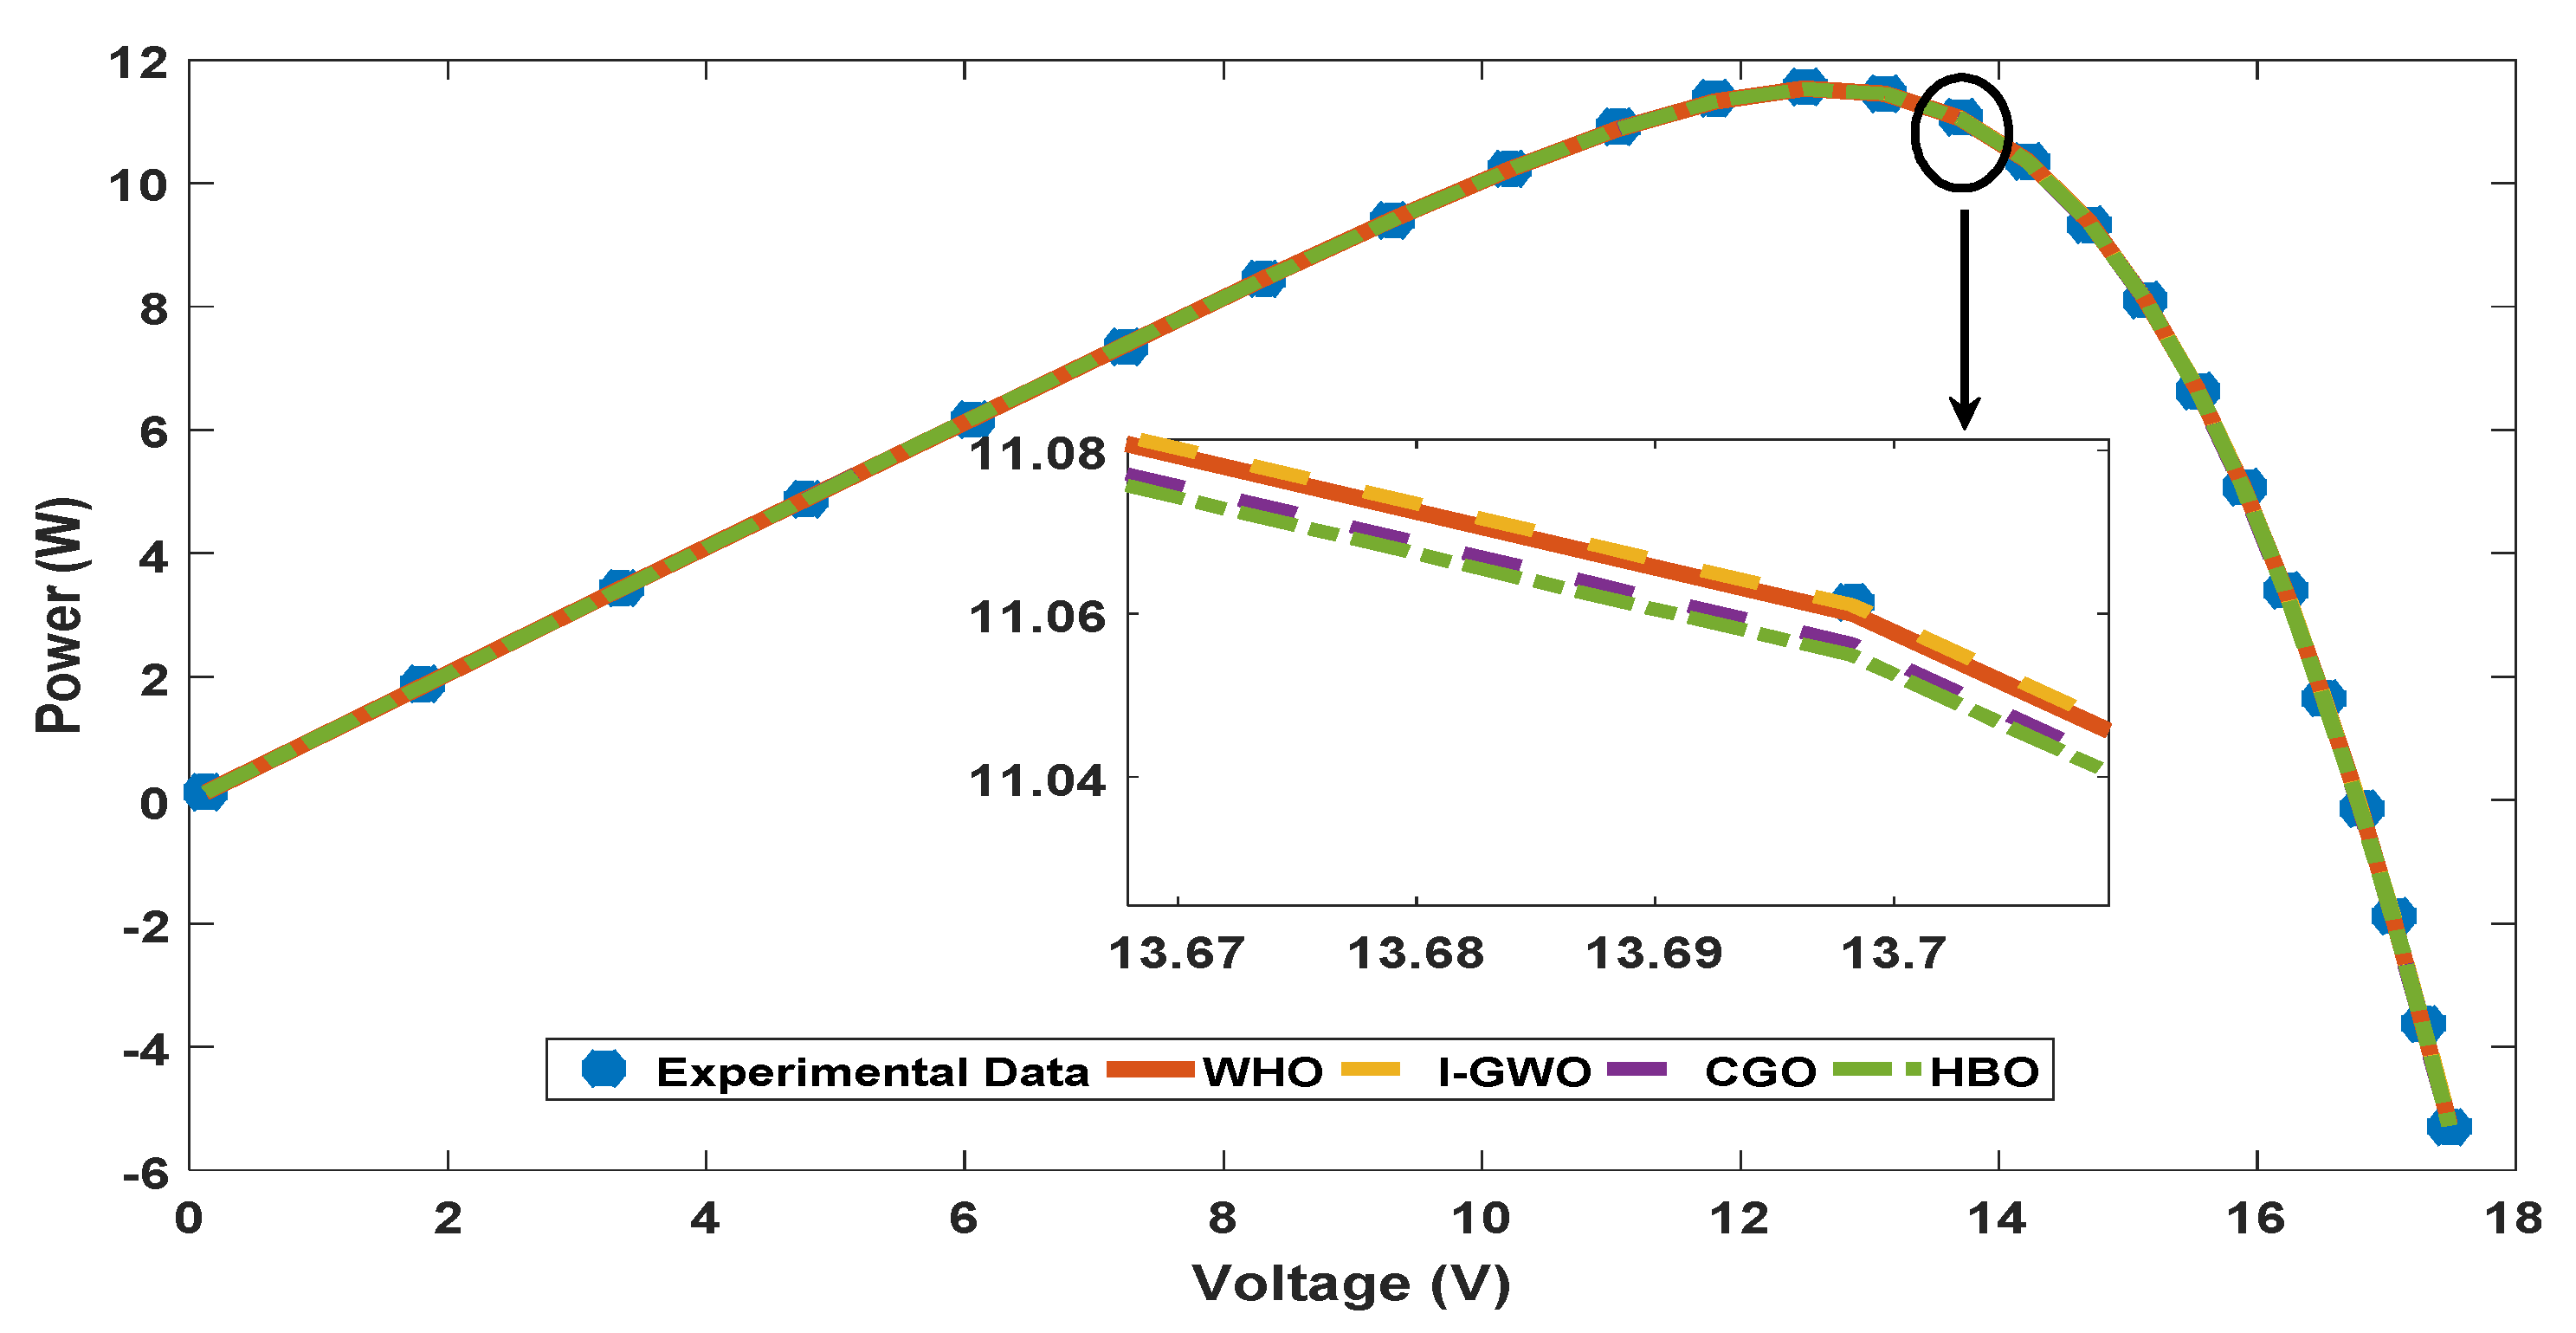
4. Results and Discussion
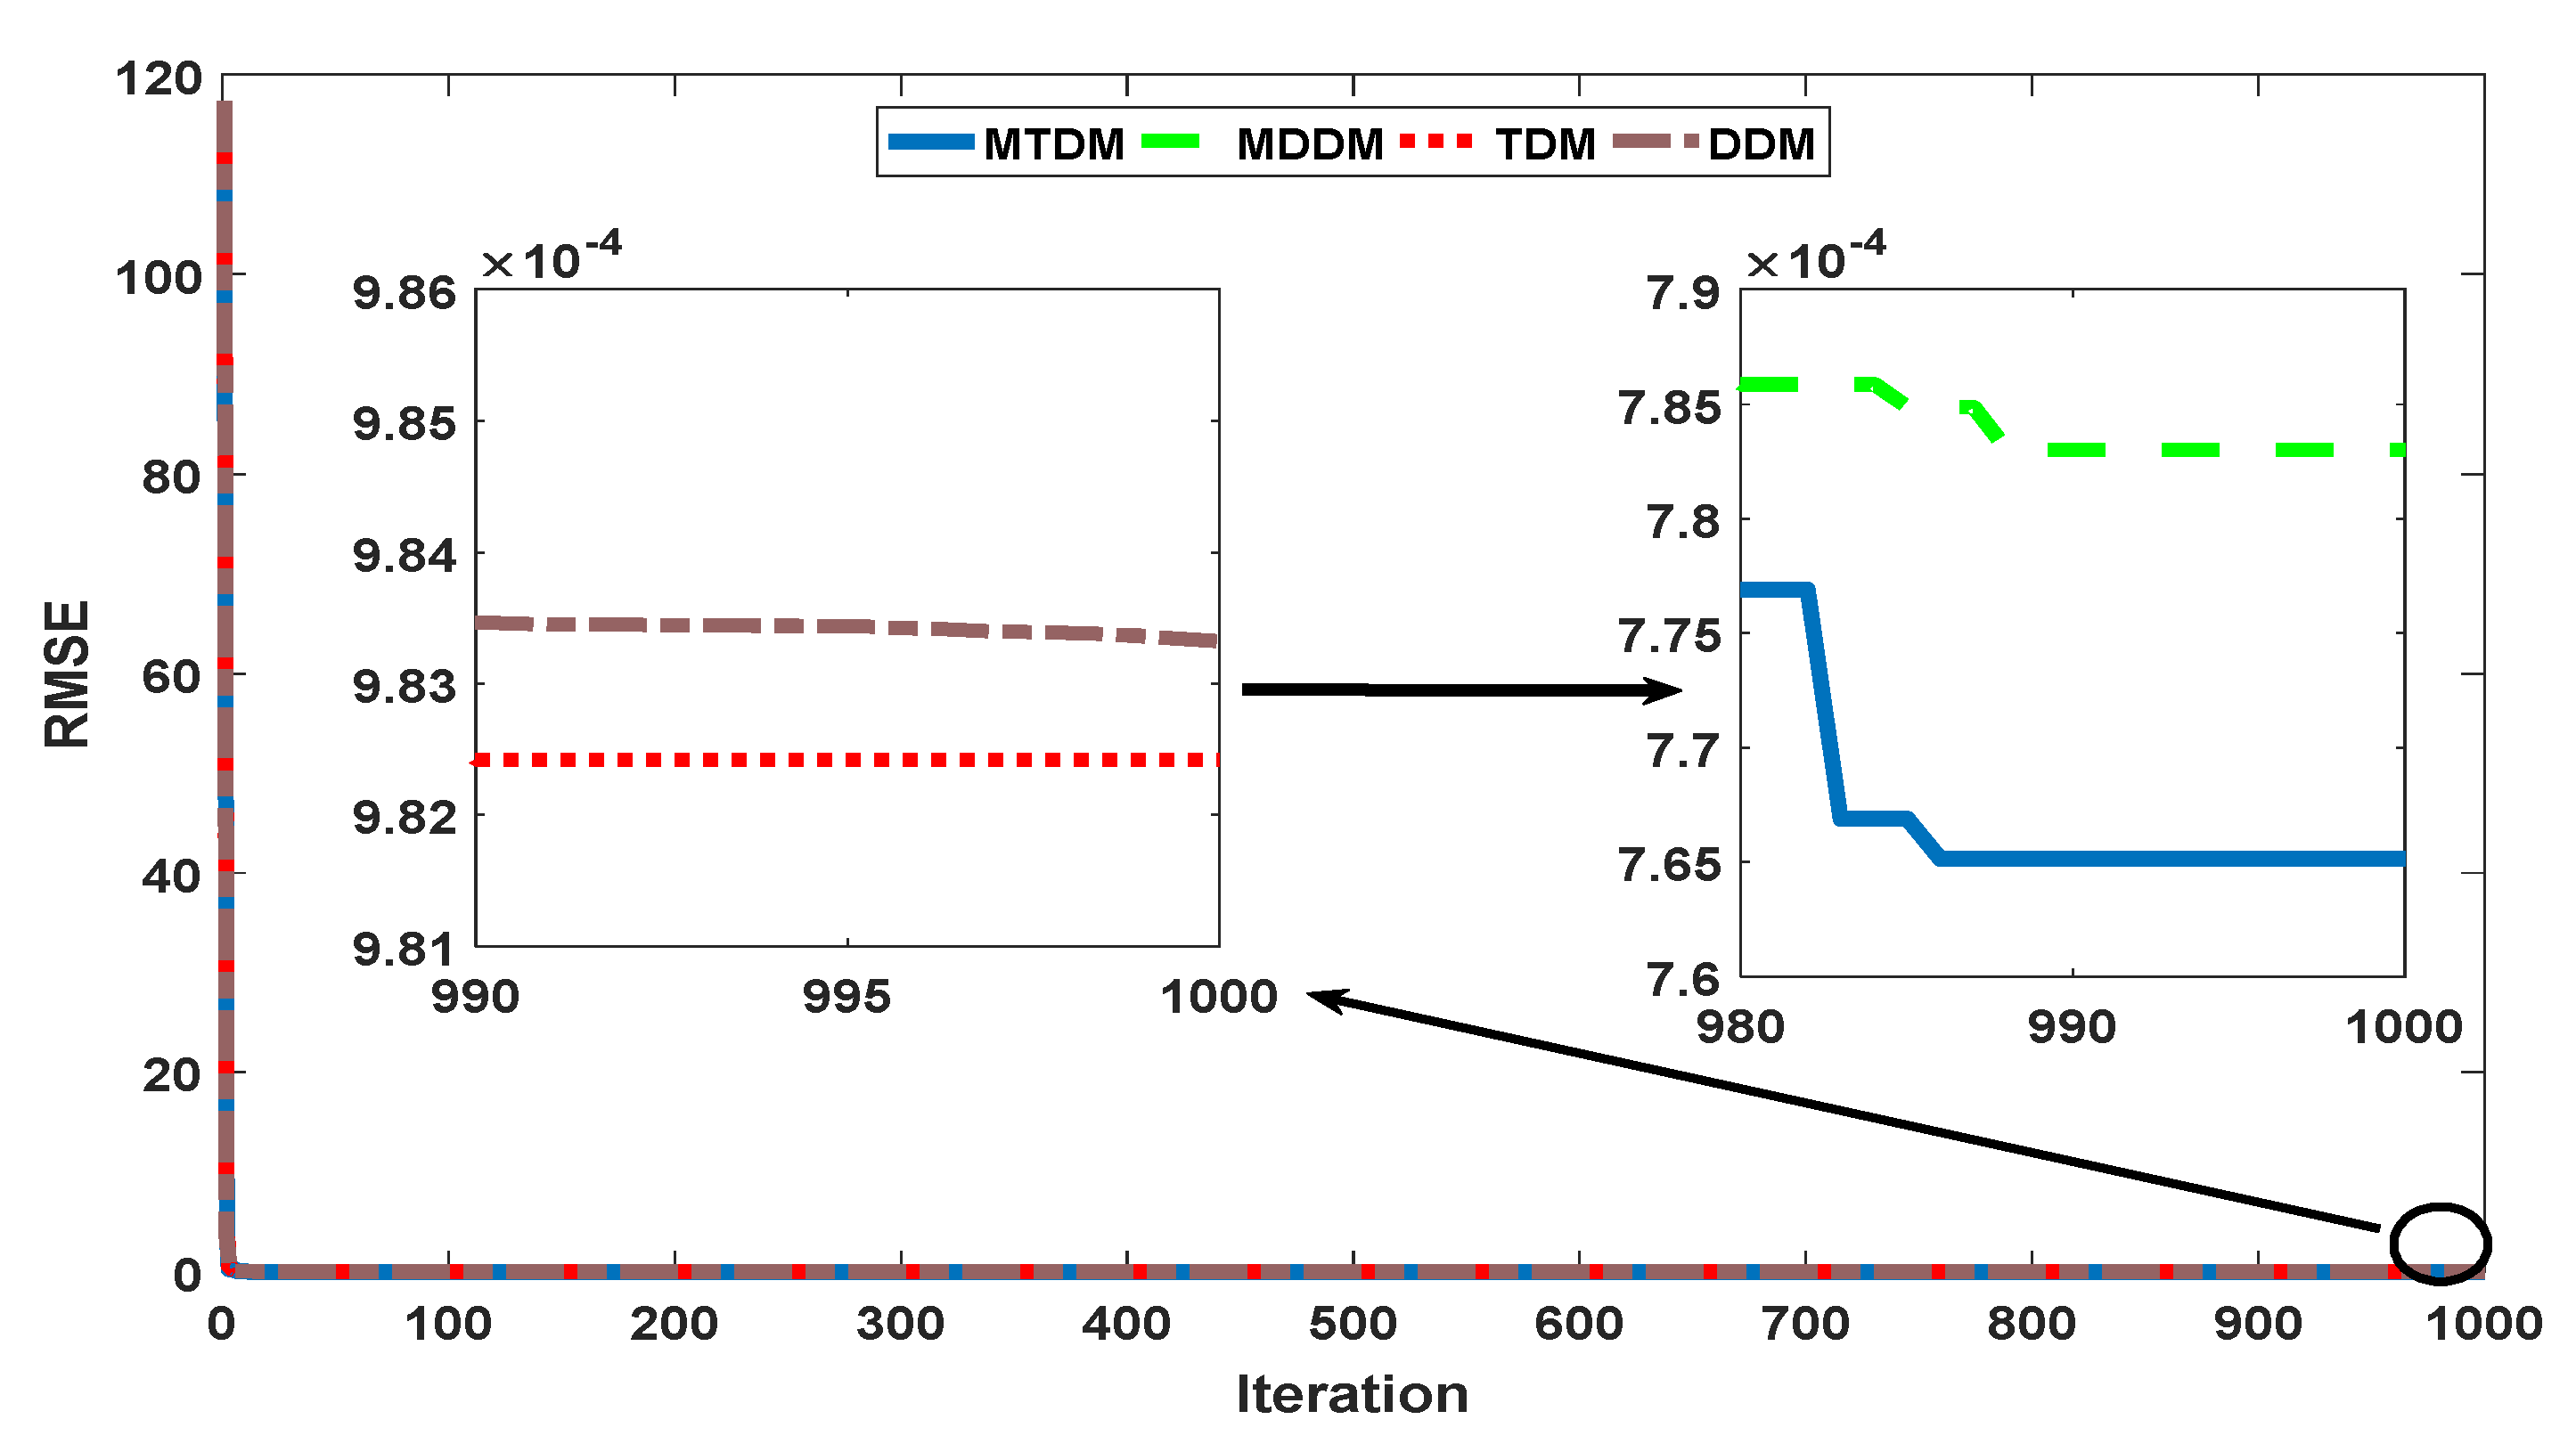
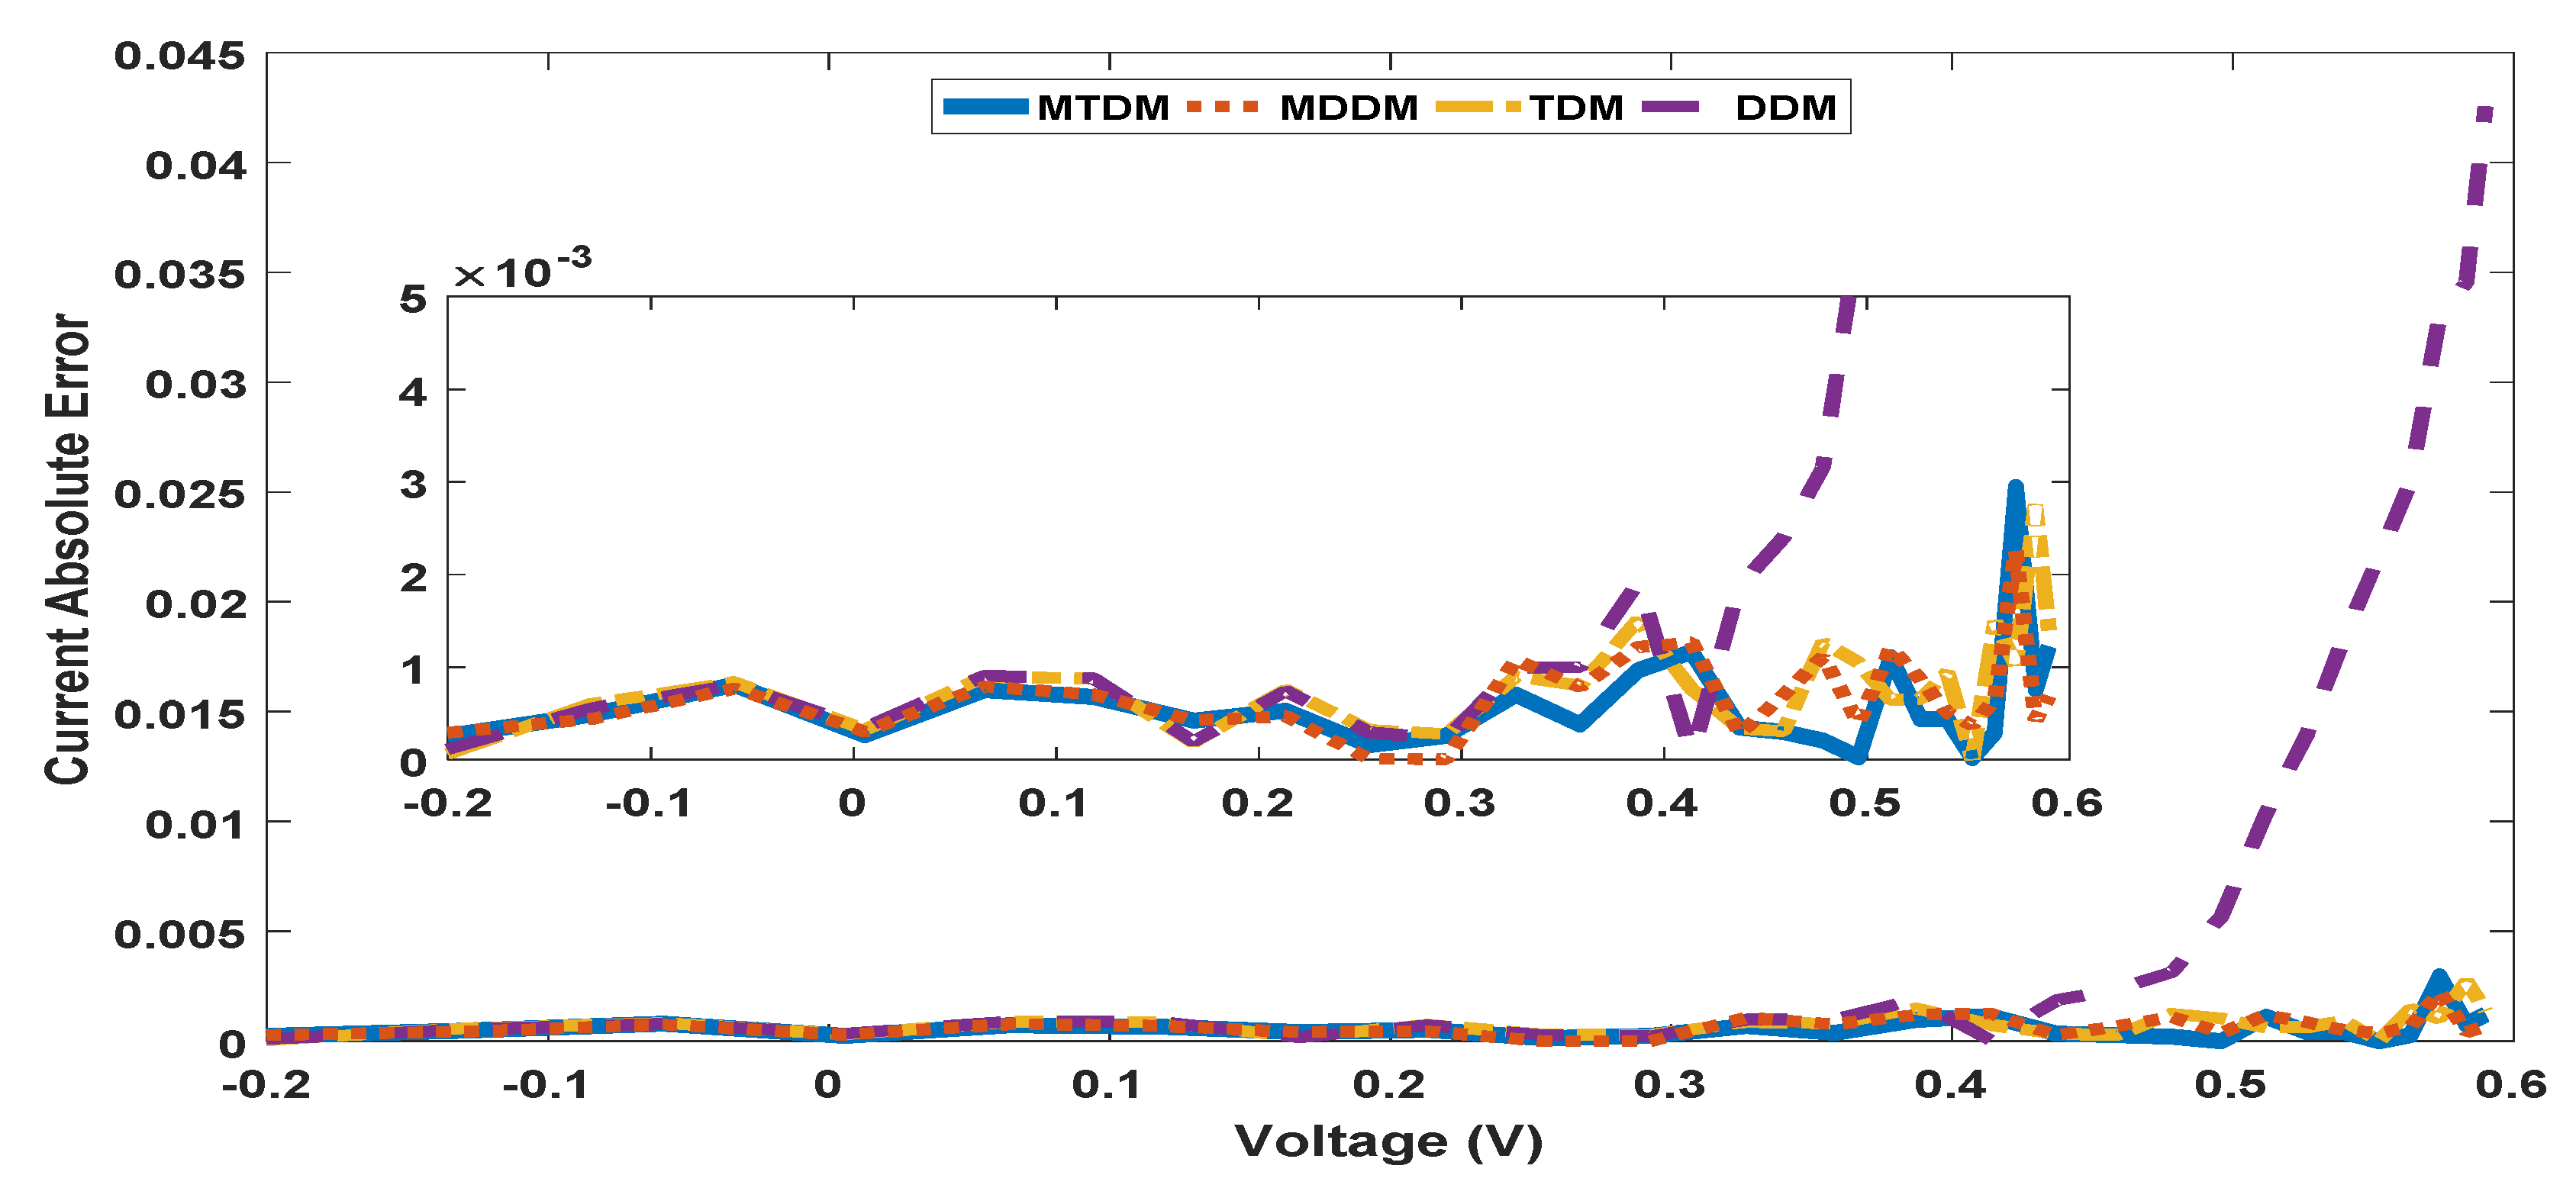
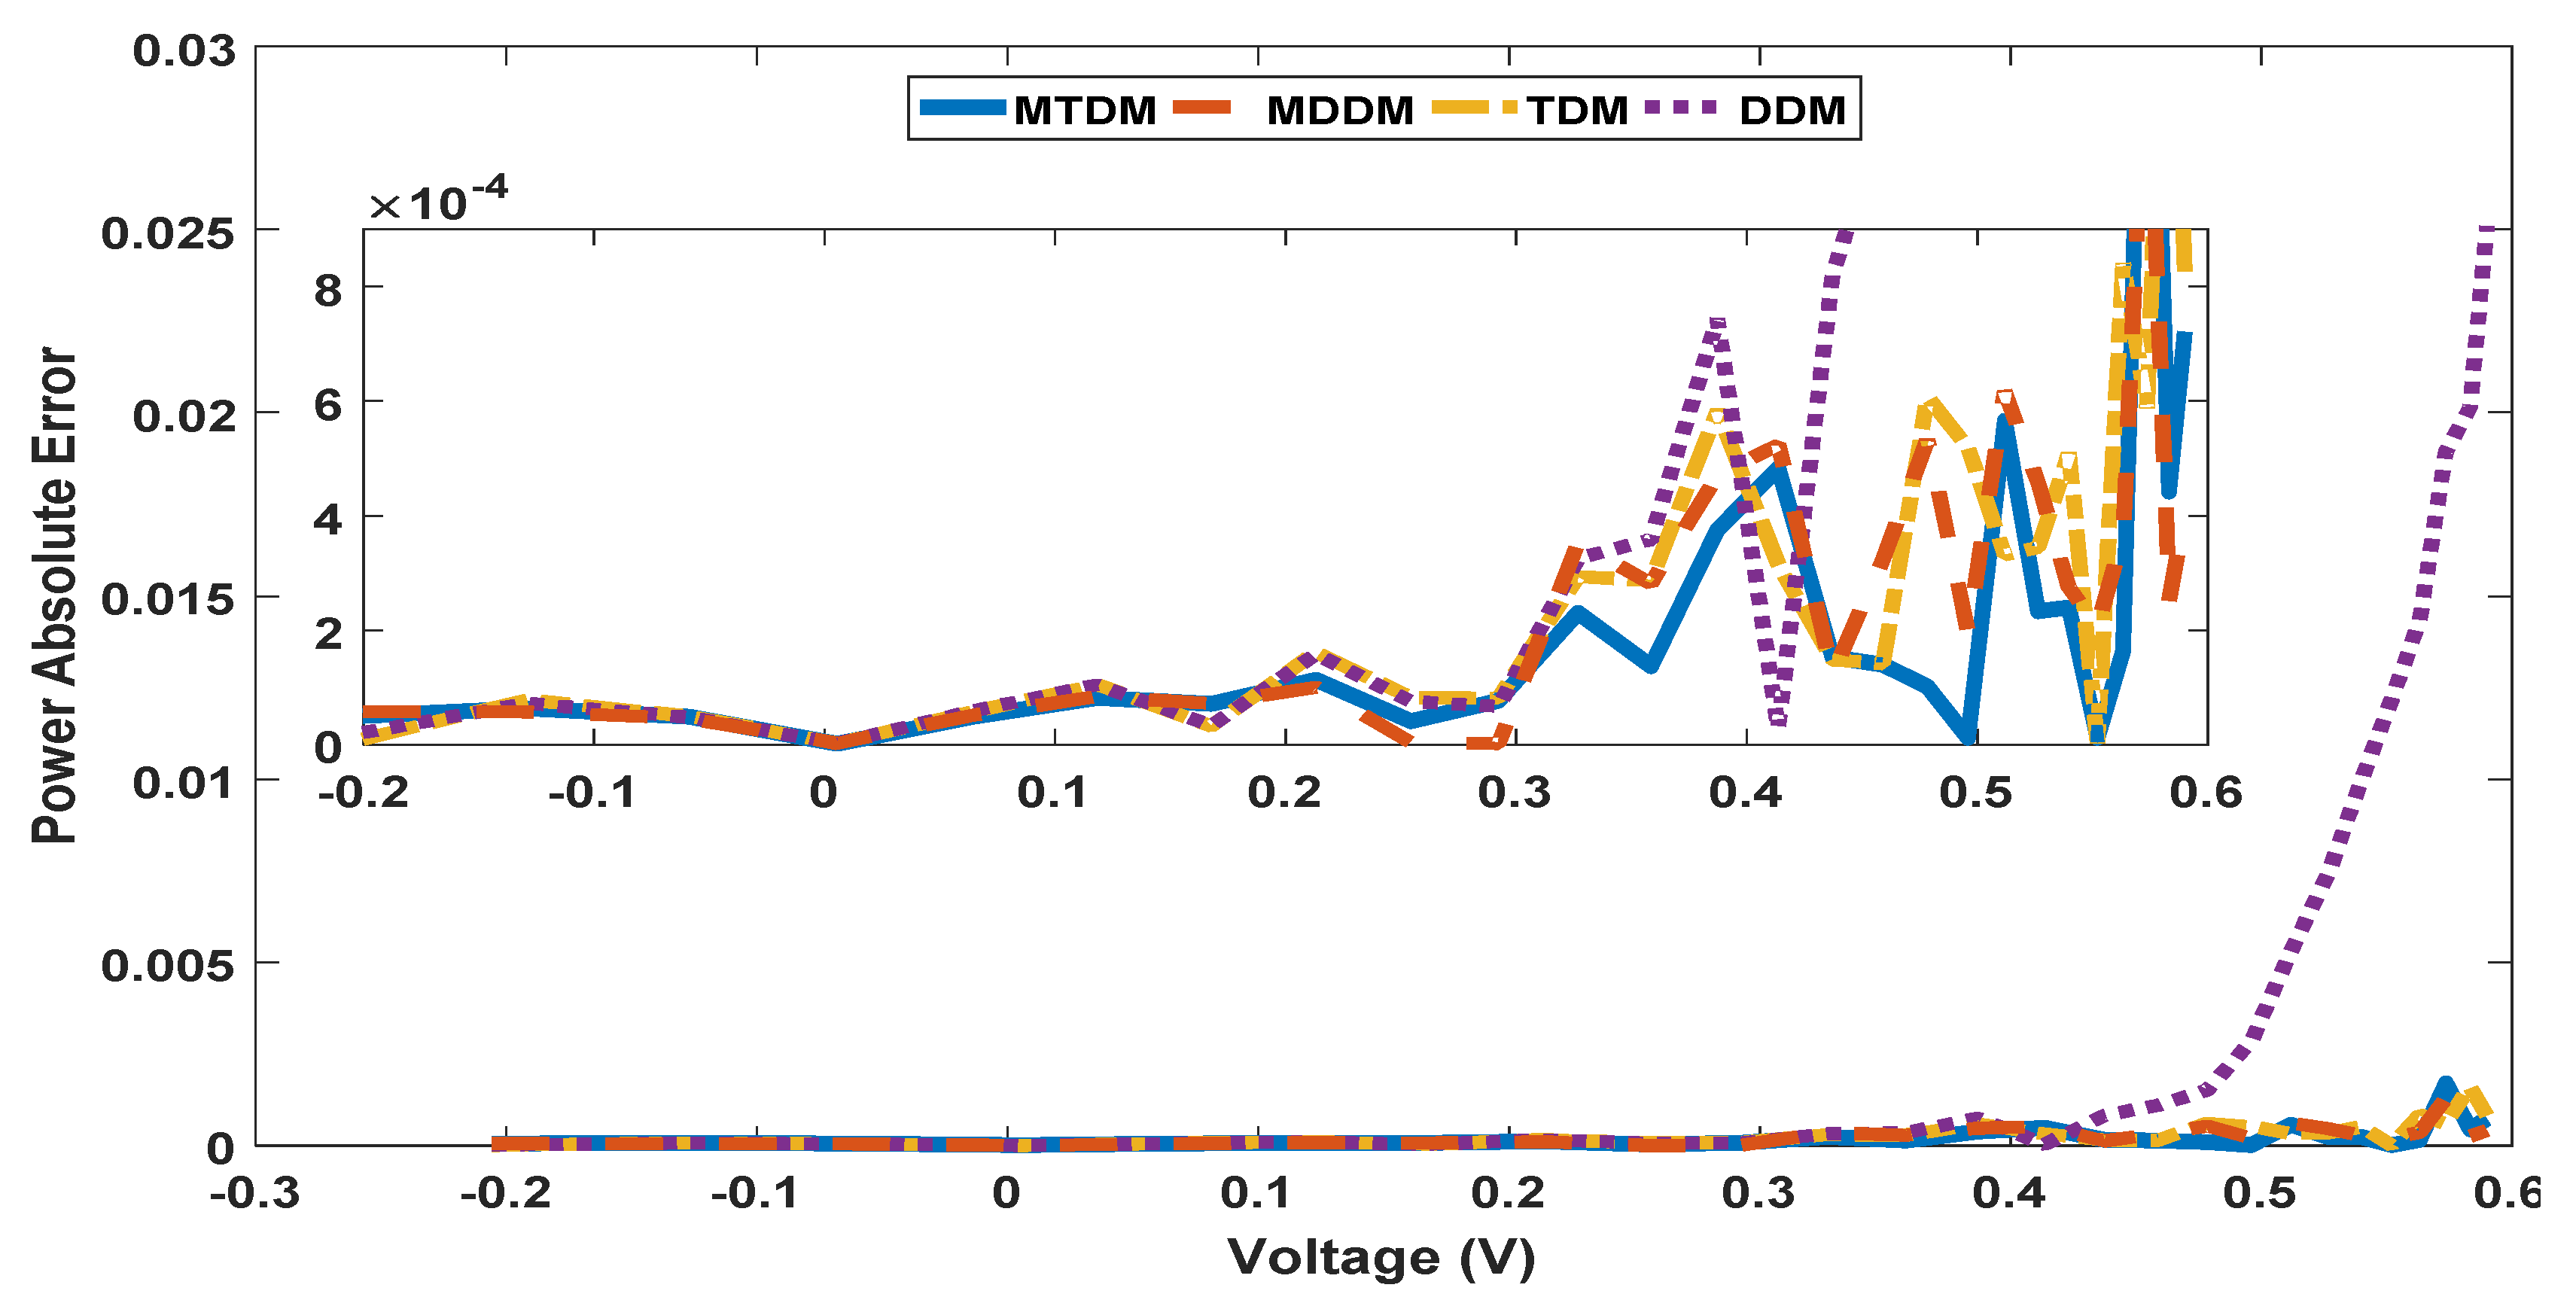
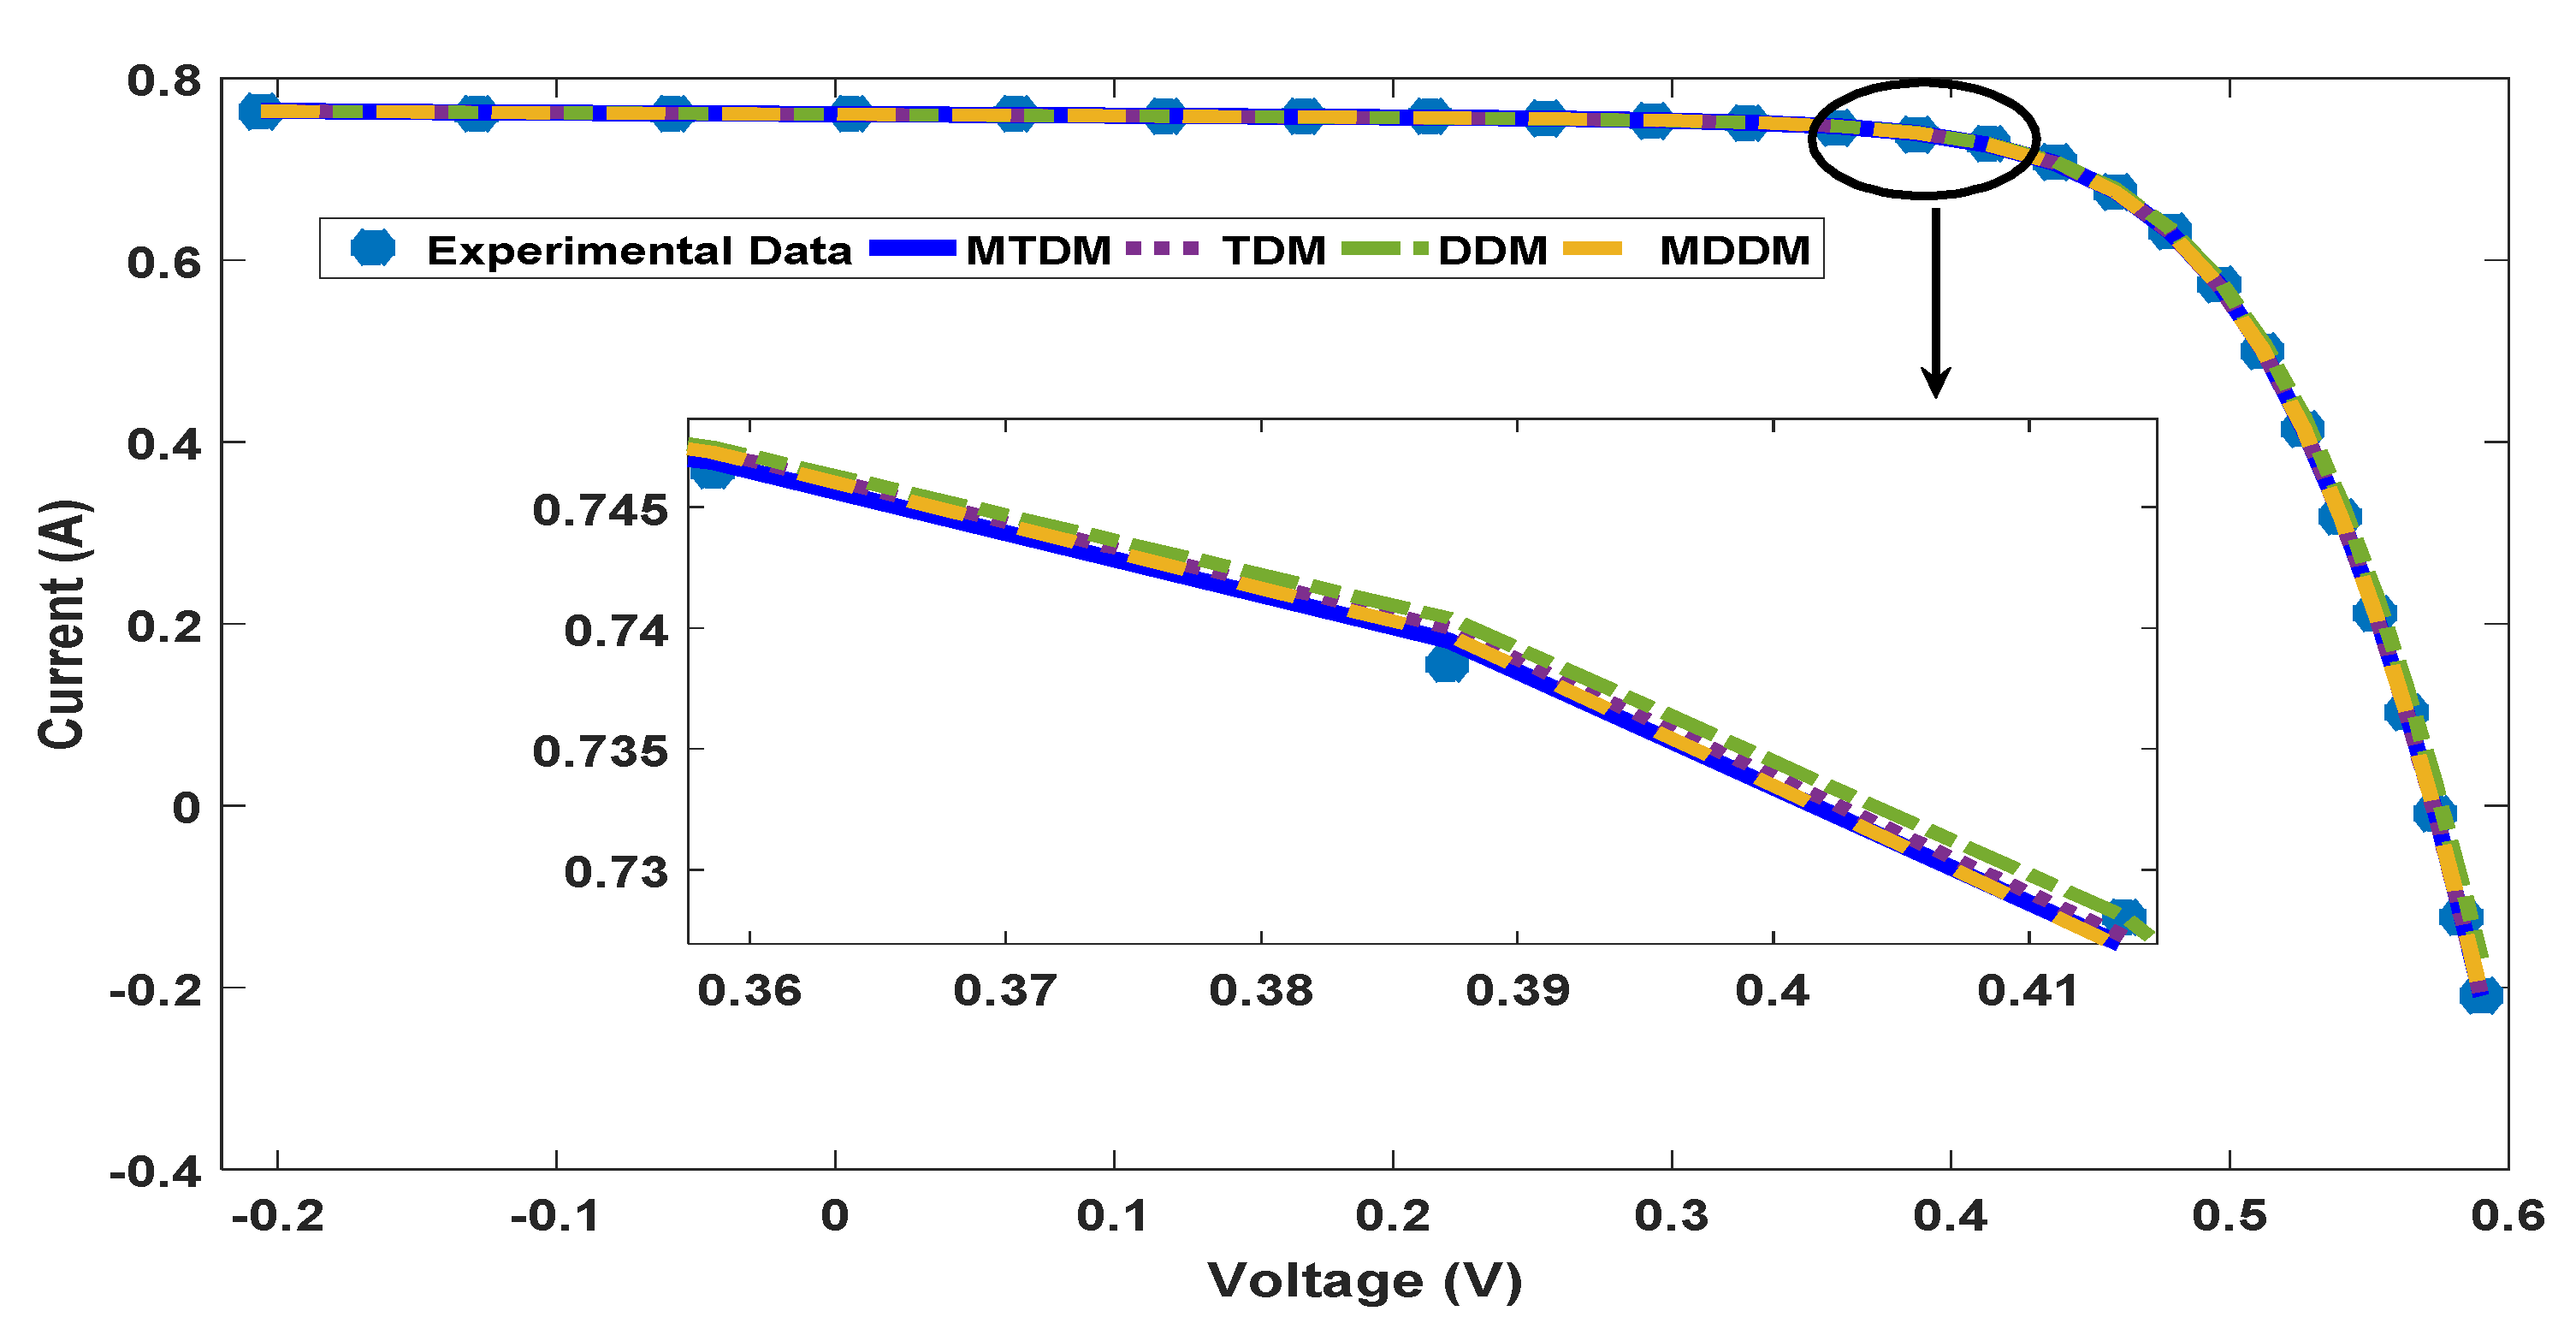
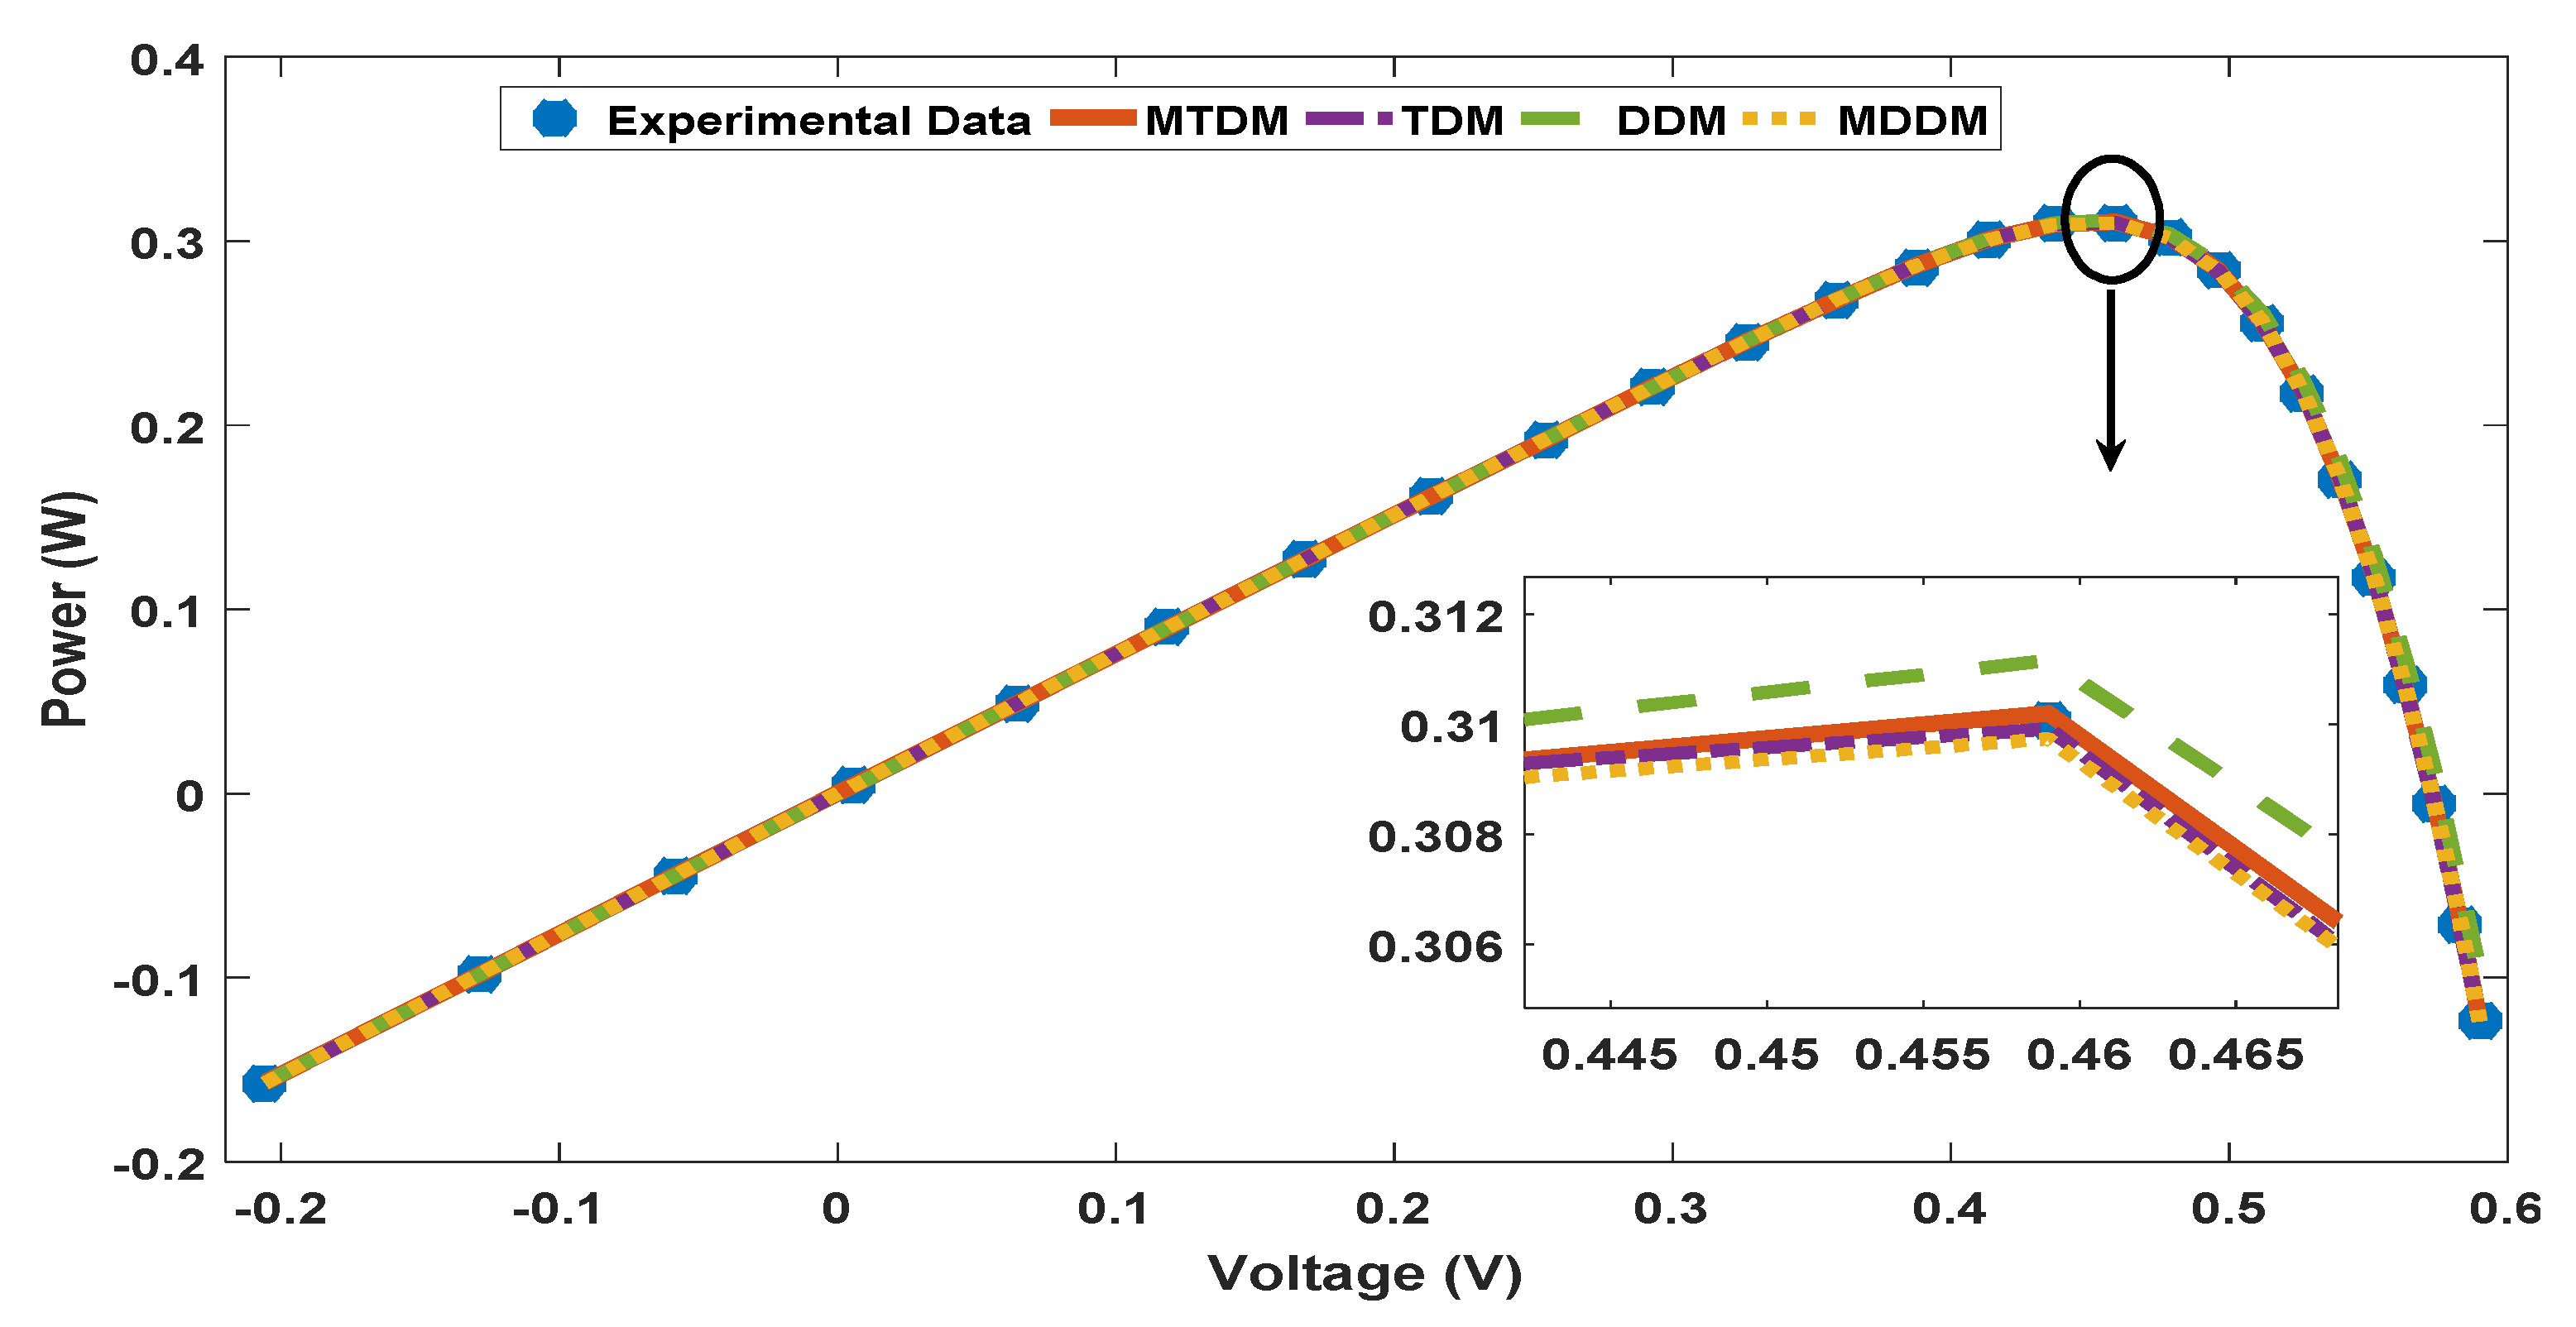
4.1. Results of Radiotechnique Compelec (RTC) Furnace
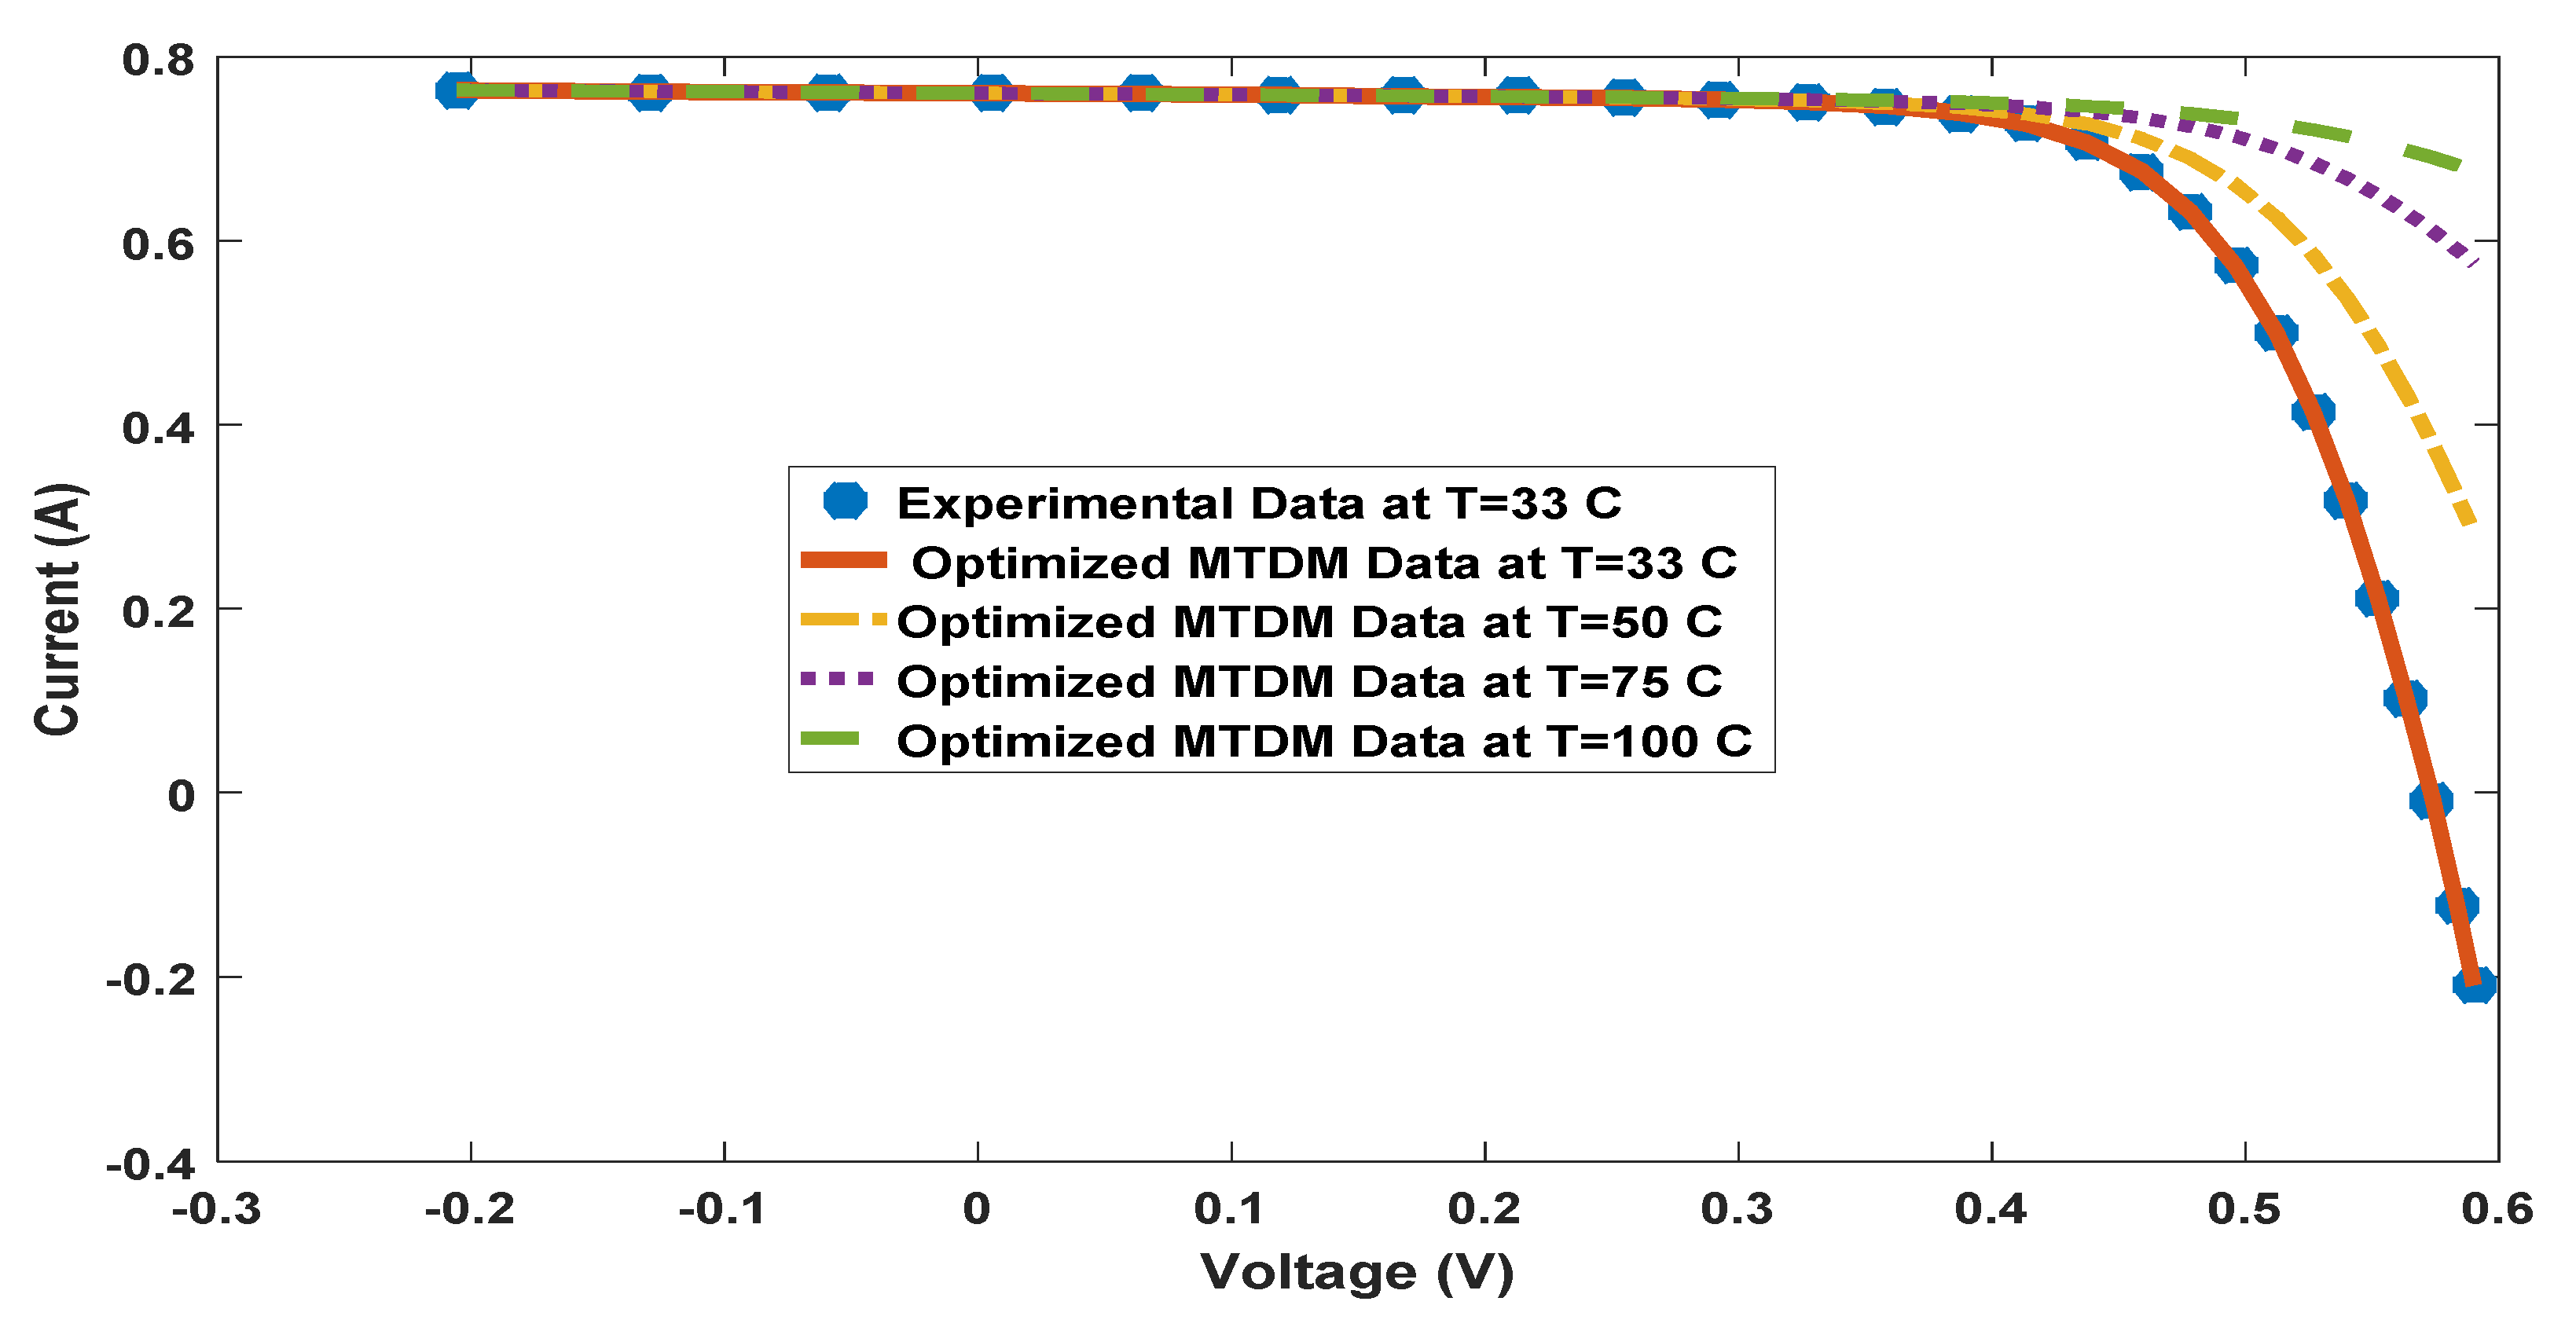
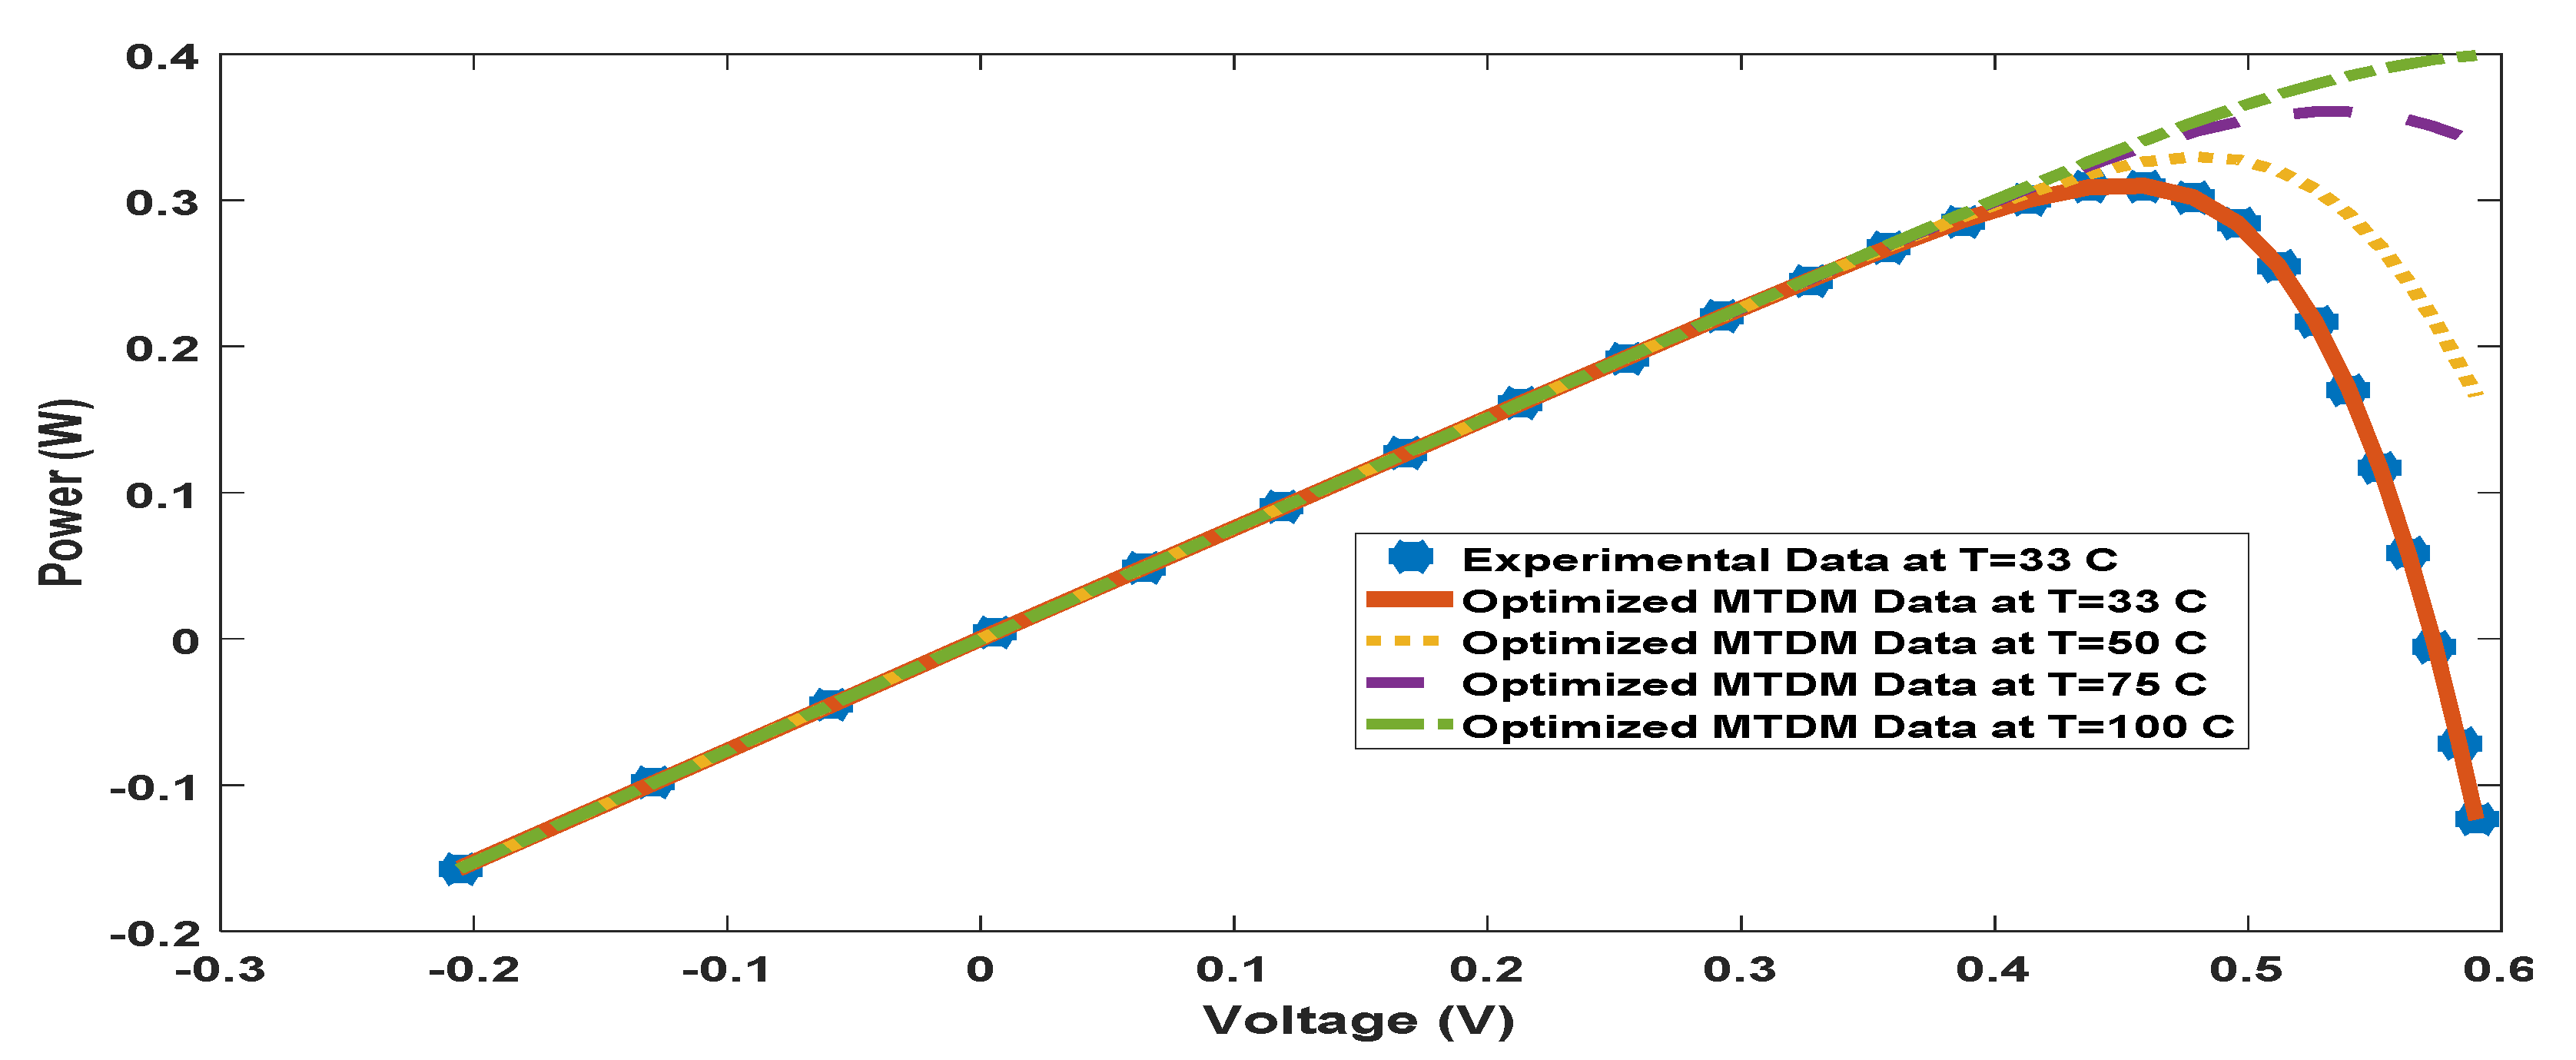
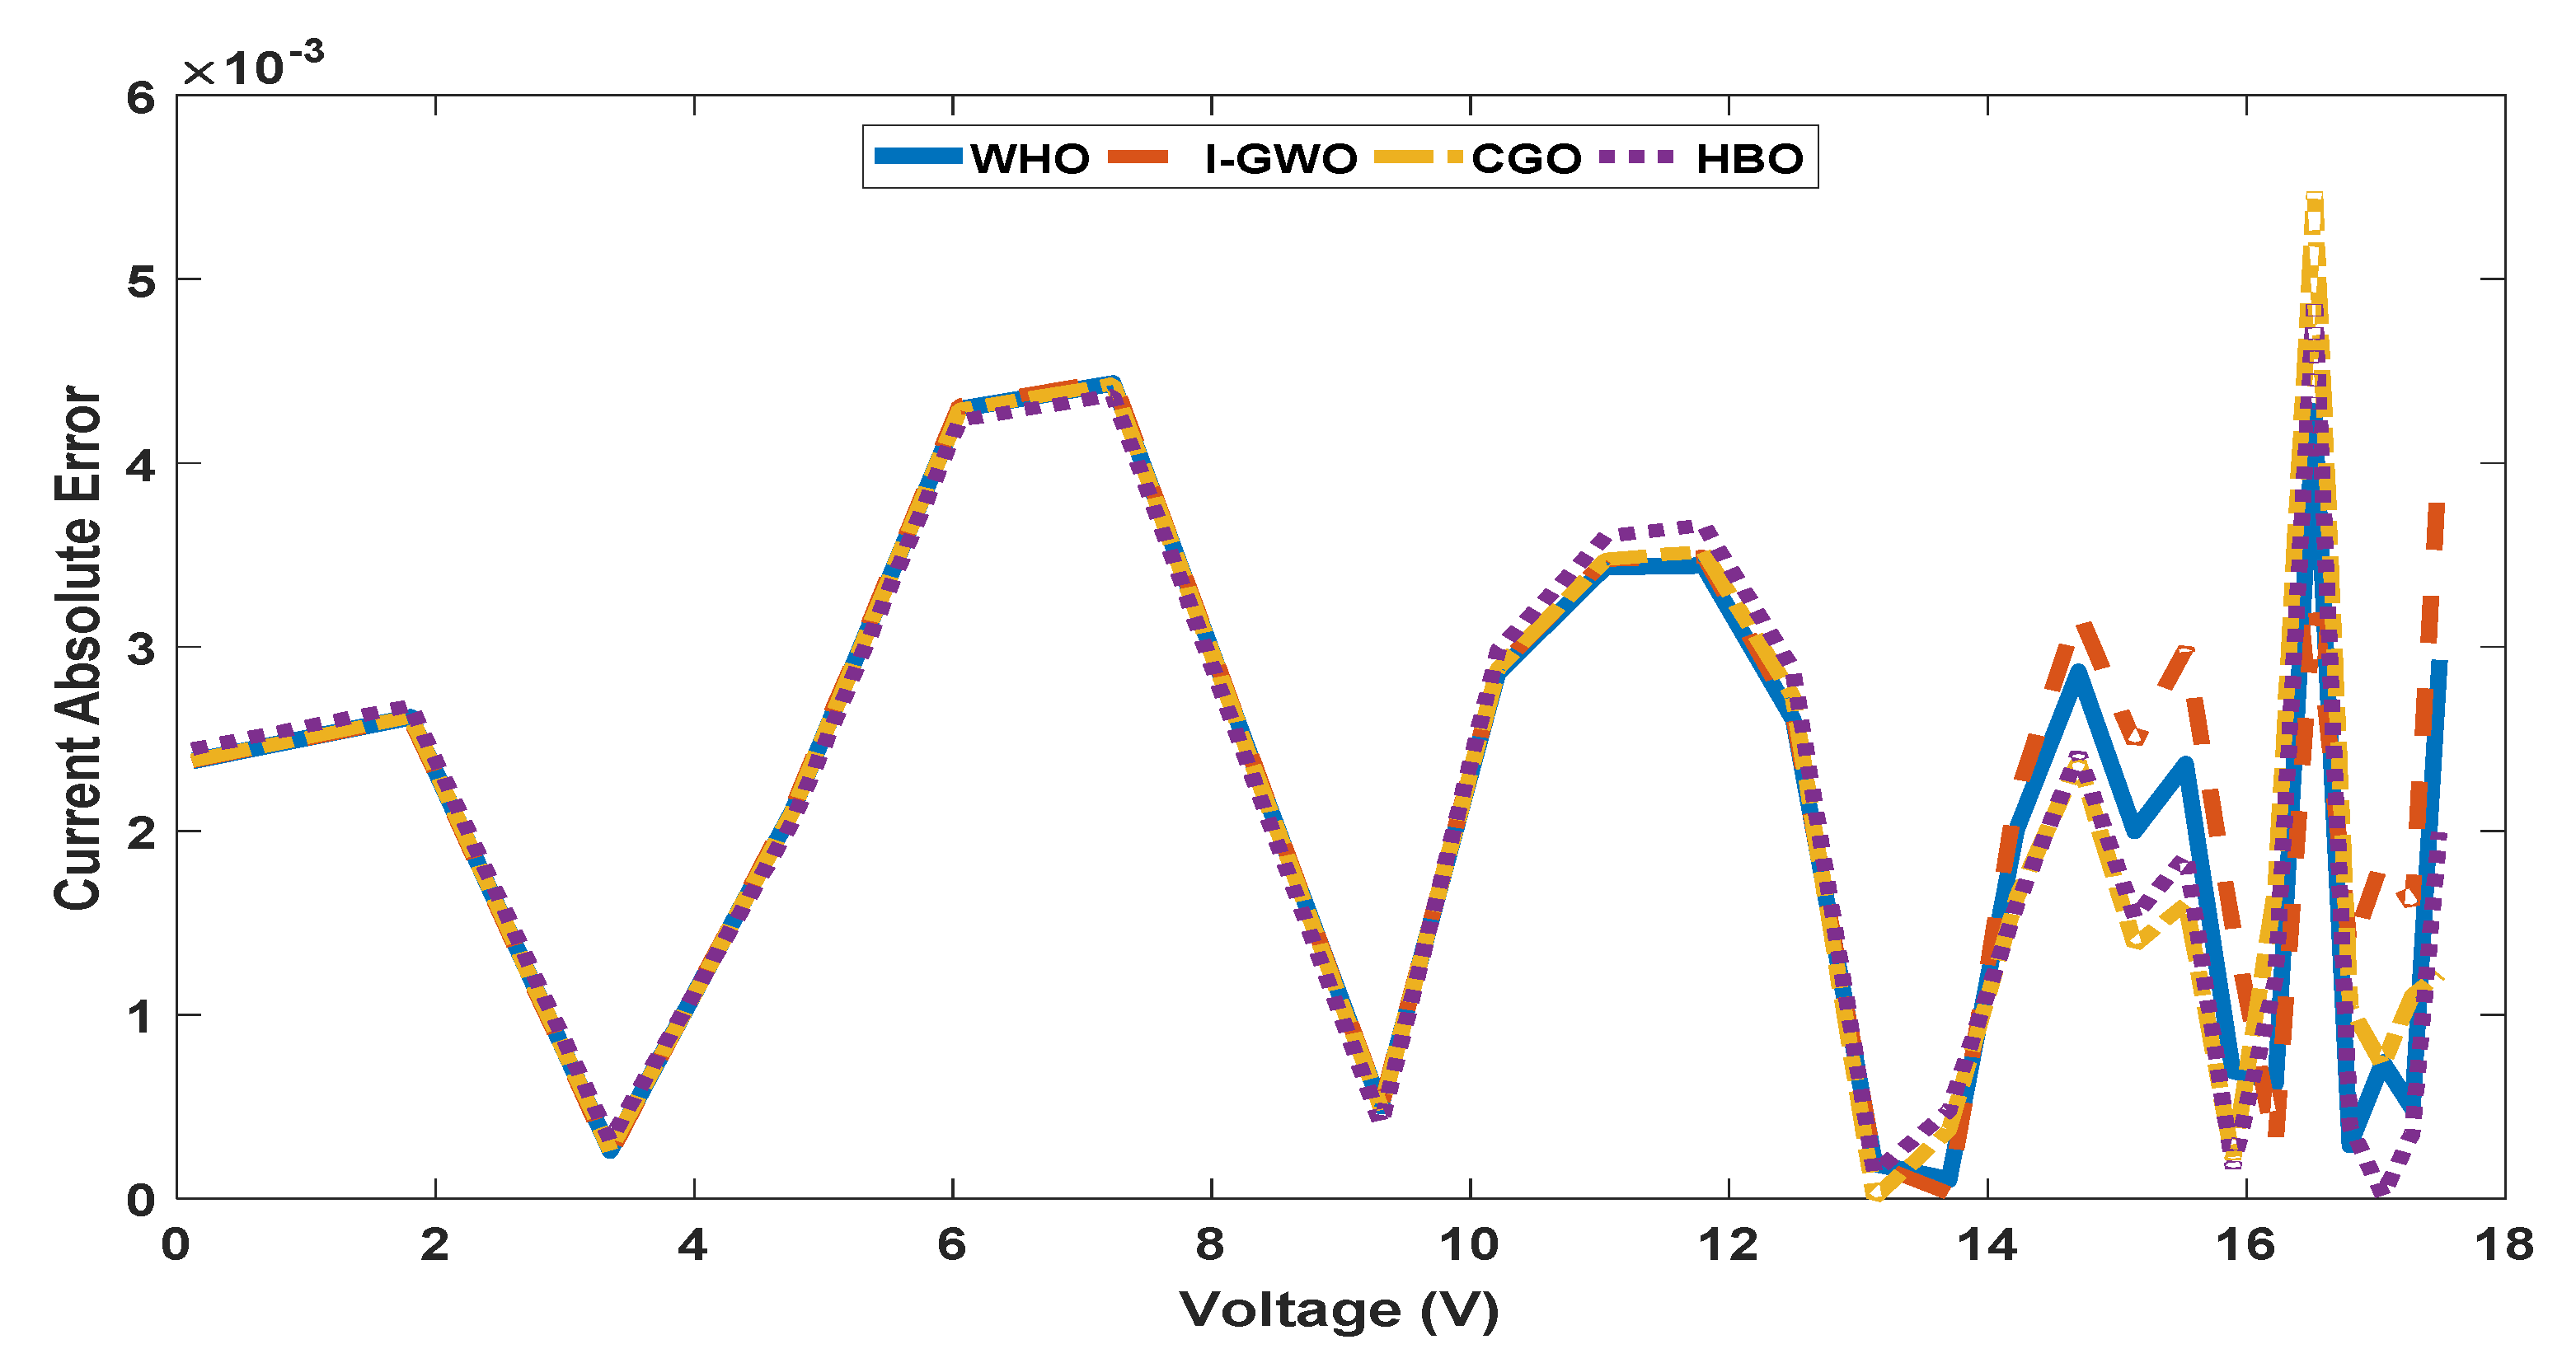
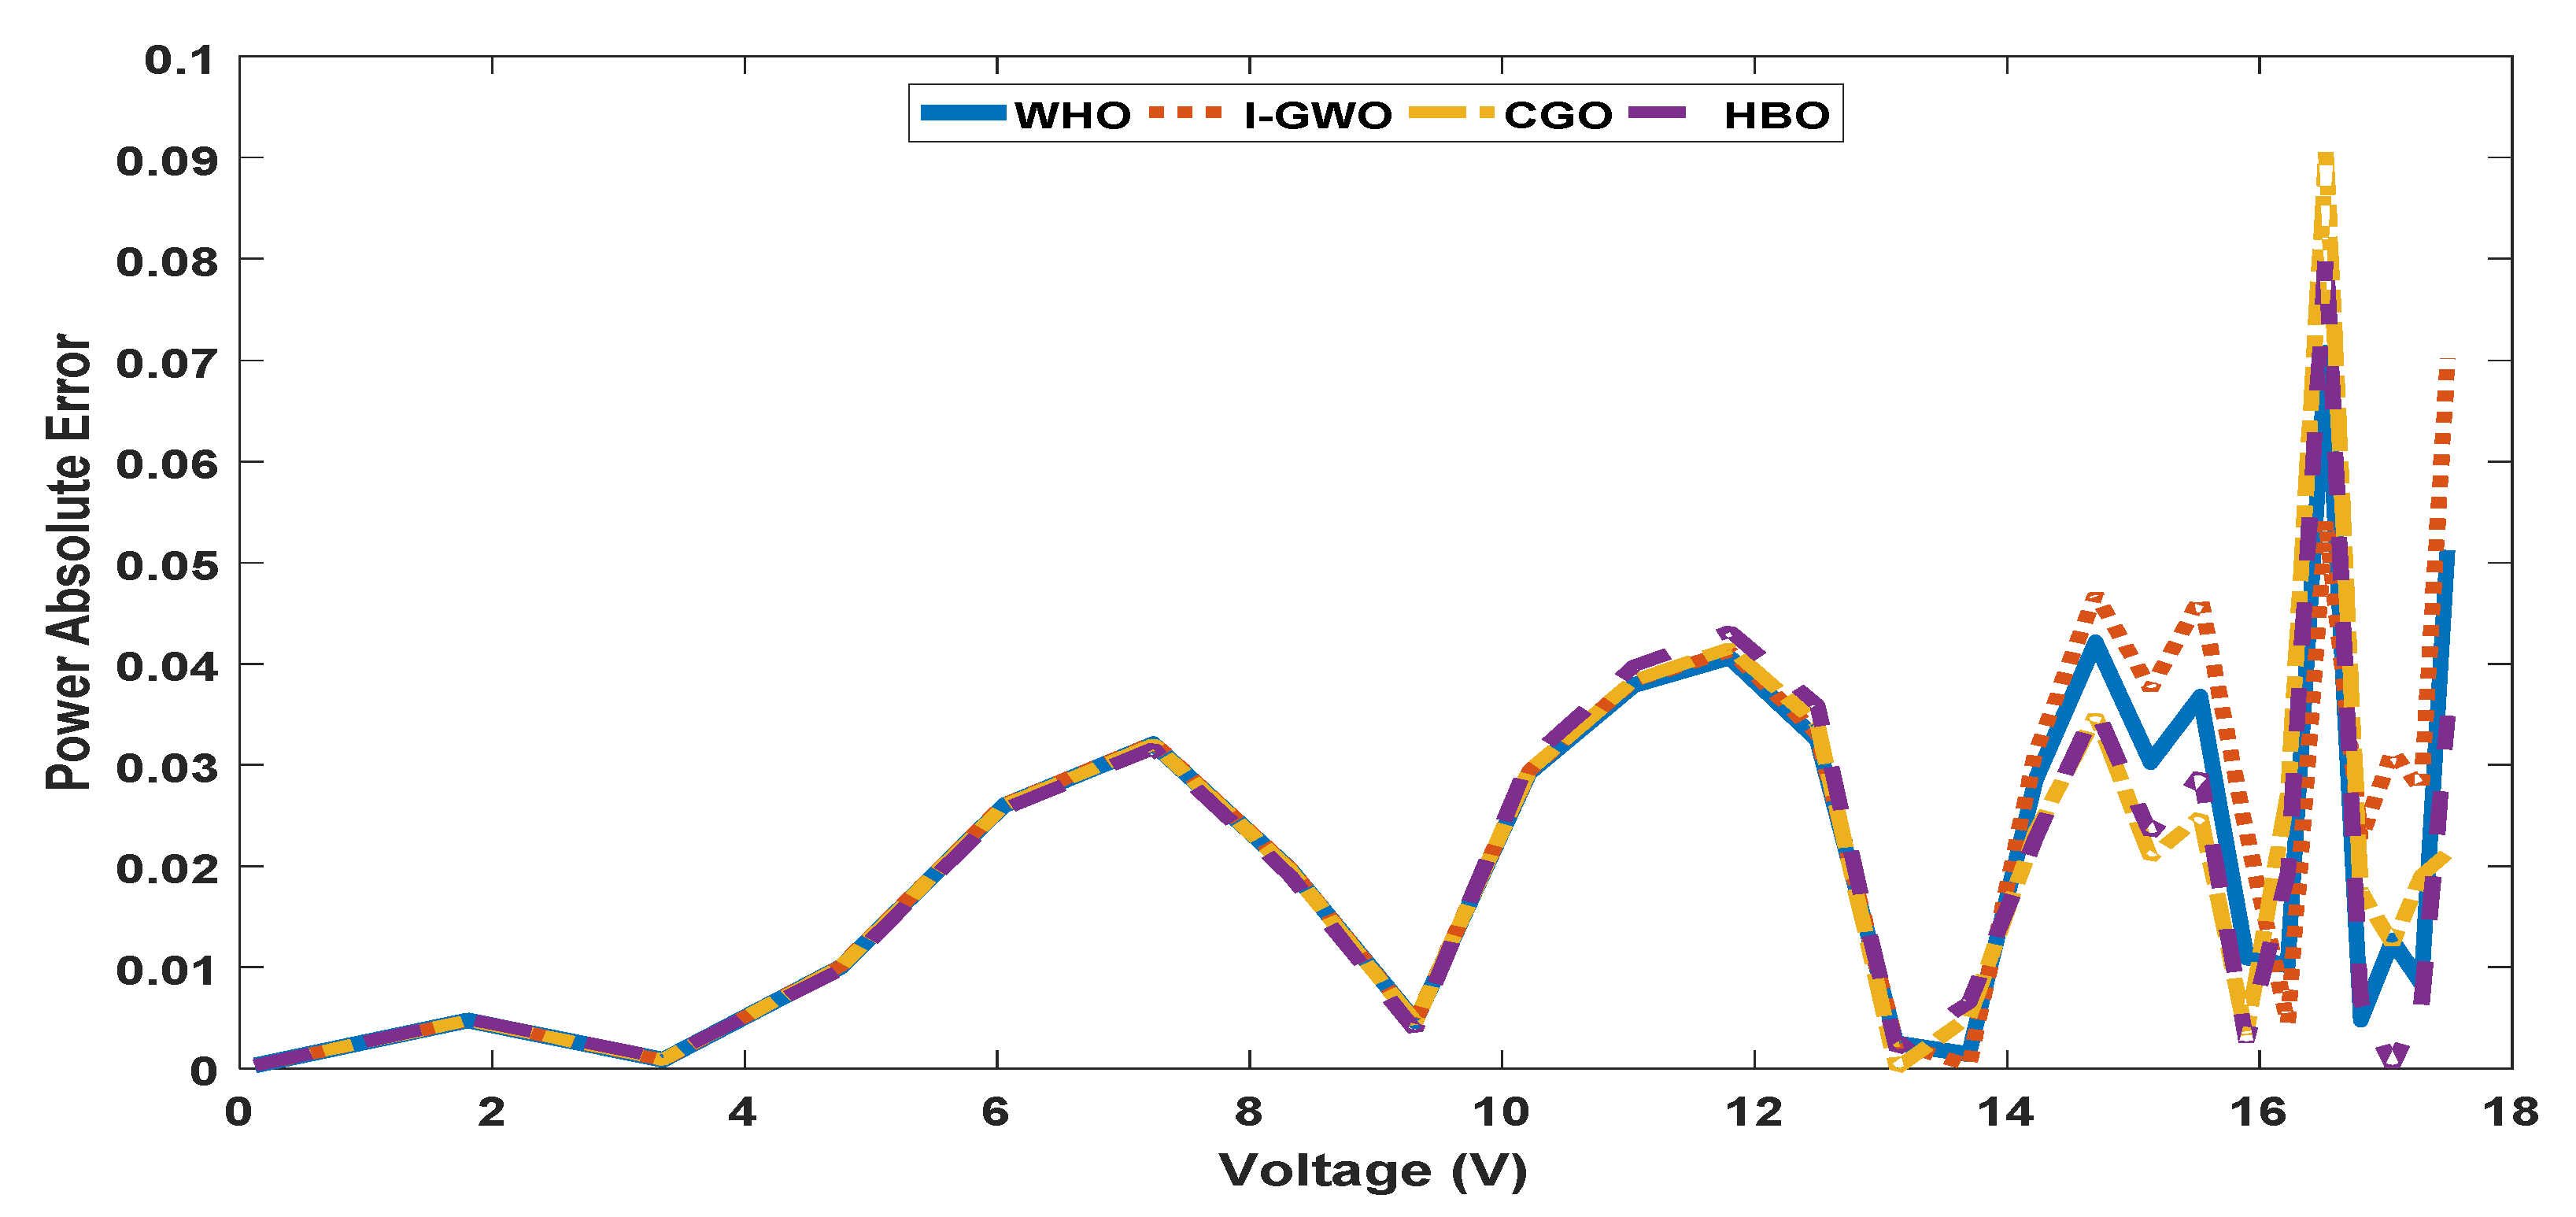
4.2. Results of Potassium Titanate Whisker (PTW) Polycrystalline PV Panels
5. Conclusions
Author Contributions
Funding
Acknowledgments
Conflicts of Interest
Nomenclature
| Symbol | Description |
| TDM | Triple-Diode Model |
| DDM | Double-Diode Model |
| PV | Photo Voltaic |
| I | PV module output current |
| V | Terminal voltage |
| Iph | Current source generated from photons |
| ɳ1 | Ideality factor for the first diode (Diffusion current components) |
| ɳ3 | Ideality Factor for the third diode (Leakage current components) |
| Rs | Series resistance to represent the total semiconductor material at neutral regions resistance. |
| Is1 | Current passing through the First diode |
| Is2 | Current passing through the Second diode |
| MTDM | Modified Triple-Diode Model |
| MTDM | Modified Double-Diode Model |
| SDM | Single-Diode Model |
| Rsm | Series resistance for the losses in different regions |
| RMSE | Root Mean Square Error |
| Is3 | Third diode current |
| ɳ2 | Ideality Factor for the second Diode (Recombination current components) |
| Rsh | Shunt resistance to represent the total current leakage resistance across the P-N junction of solar cell |
| K | constant of = 1.38 × 10⁻²³ (J/Ko) |
| q | 1.602 × 10⁻¹⁹ (C) Coulombs. |
| T (Ko) | Photocell temperature (Kelvin) |
References
- Solaymani, S. A Review on Energy and Renewable Energy Policies in Iran. Sustainability 2021, 13, 7328. [Google Scholar] [CrossRef]
- Mohammadi, V.; Mozaffari Shamsi, H.; Asadi, F. Investigating the Relationship between Economic Growth, Energy Consumption and Human Development in Selected MENA Countries. J. Energy Econ. 2019, 8, 811–850. [Google Scholar]
- Saleem, A.; Rashid, F.; Mehmood, K. The efficiency of solar PV system. In Proceedings of the 2nd International Multidisciplinary Conference, Jakarta, Indonesia, 15–16 November 2016. [Google Scholar]
- Yousri, D.; Rezk, H.; Fathy, A. Identifying the parameters of different configurations of photovoltaic models based on recent artificial ecosystem-based optimization approach. Int. J. Energy Res. 2020, 44, 11302–11322. [Google Scholar] [CrossRef]
- Tamrakar, V.; Gupta, S.C.; Sawle, Y. Single-Diode PV Cell Modeling and Study of Characteristics of Single and Two-Diode Equivalent Circuit. Electr. Electron. Eng. Int. J. 2015, 4, 12. [Google Scholar] [CrossRef]
- Teyabeen, A.A.; Elhatmi, N.B.; Essnid, A.A.; Jwaid, A.E. Parameters estimation of solar PV modules based on single-diode model. In Proceedings of the International Renewable Energy Congress (IREC), Hammamet, Tunisia, 29–31 October 2020. [Google Scholar]
- Abdelghany, R.Y.; Kamel, S.; Ramadan, A.; Sultan, H.; Rahmann, C. Solar cell parameter estimation using school-based optimization algorithm. In Proceedings of the International Conference on Automation/XXIV Congress of the Chilean Association of Automatic Control (ICA-ACCA), Santiago, Chile, 22–26 March 2021. [Google Scholar]
- Sabadus, A.; Mihailetchi, V.; Paulescu, M. Parameters Extraction for the One-Diode Model of a Solar Cell. In AIP Conference Proceedings; AIP Publishing LLC: Melville, NY, USA, 2017. [Google Scholar]
- Shannan, N.M.; Yahaya, N.; Singh, B. Single-diode model and two-diode model of PV modules: A comparison. In Proceedings of the IEEE International Conference on Control System, Computing and Engineering, Penang, Malaysia, 29 November–1 December 2013. [Google Scholar]
- Ramadan, A.; Kamel, S.; Korashy, A.; Yu, J. Photovoltaic Cells Parameter Estimation Using an Enhanced Teaching Learning Based Optimization Algorithm. Iran. J. Sci. Technol. 2019, 44, 767–779. [Google Scholar] [CrossRef]
- Barth, N.; Jovanovic, R.; Ahzi, S.; Khaleel, M.A. PV Panel Single and Double-Diode Models: Optimization of the Parameters and Temperature Dependence. Sol. Energy Mater. Sol. Cells 2016, 148, 87–98. [Google Scholar] [CrossRef]
- Ramadan, A.; Kamel, S.; Ibrahim, A.A. Parameters Estimation of Photovoltaic Cells Using Self-Adaptive Multi-Population Rao Optimization Algorithm. Aswan Univ. J. Sci. Technol. 2021, 31, 34. [Google Scholar]
- Messaoud, R.B. Extraction of Uncertain Parameters of Double-Diode Model of a Photovoltaic Panel Using Ant Lion Optimization. Appl. Sci. 2018, 2, 1–8. [Google Scholar] [CrossRef] [Green Version]
- Mohammed, H.; Qais, H.; Hasanien, M.; Alghuwainem, S. Parameters Extraction of Three-Diode Photovoltaic Model Using Computation and Harris Hawks Optimization. Energy 2020, 195, 117040. [Google Scholar]
- Qais, M.H.; Hasanien, H.M.; Alghuwainem, S. Identification of Electrical Parameters for Three-Diode Photovoltaic Model Using Analytical and Sunflower Optimization Algorithm. Appl. Energy 2019, 250, 109–117. [Google Scholar] [CrossRef]
- Elazab, O.S.; Hasanien, H.; Alsaidan, M.; Almoataz, I.; Abdelaziz, Y.; Muyeen, S.M. Parameter Estimation of Triple-Diode Photovoltaic Model Using Grasshopper Optimization Algorithm. Energies 2020, 13, 497. [Google Scholar] [CrossRef] [Green Version]
- Chin, V.J.; Salam, Z. A New Three-point-based Approach for the Parameter Extraction of Photovoltaic Cells. Appl. Energy 2019, 237, 519–533. [Google Scholar] [CrossRef]
- Ramadan, A.; Kamel, S.; Hassan, M.H.; Khurshaid, T.; Rahmann, C. An Improved Bald Eagle Search Algorithm for Parameter Estimation of Different Photovoltaic Models. Processes 2021, 9, 1127. [Google Scholar] [CrossRef]
- Bayoumi, A.S.; El-Sehiemy, R.A.; Mahmoud, K.; Lehtonen, M.; Darwish, M.M.F. Assessment of an Improved Three-Diode against Modified Two-Diode Patterns of MCS Solar Cells Associated with Soft Parameter Estimation Paradigms. Appl. Sci. 2021, 11, 1055. [Google Scholar] [CrossRef]
- Abdelminaam, D.S.; Said, M.; Houssein, E.H. Turbulent Flow of Water-Based Optimization Using New Objective Function for Parameter Extraction of Six Photovoltaic Models. IEEE Access 2021, 9, 35382–35398. [Google Scholar] [CrossRef]
- Reis, L.R.D.; Camacho, J.R.; Novacki, D.F. The Newton-Raphson method in the extraction of parameters of PV modules. In Proceedings of the International Conference on Renewable Energies and Power Quality (ICREPQ 2017), Malaga, Spain, 4–6 April 2017. [Google Scholar]
- Nayak, B.K.; Mohapatra, A.; Mohanty, K.B. Parameters estimation of photovoltaic module using nonlinear least square algorithm: A comparative study. In Proceedings of the Annual IEEE India Conference (INDICON 2013), Mumbai, India, 13–15 December 2013. [Google Scholar]
- Sharma, A.; Sharma, A.; Averbukh, M.; Jately, V.; Azzopardi, B. An Effective Method for Parameter Estimation of a Solar Cell. Electronics 2021, 10, 312. [Google Scholar] [CrossRef]
- Giagkiozis, I.; Purshouse, R.C.; Fleming, P.J. An Overview of Population-Based Algorithms for Multi-Objective Optimization. Int. J. Syst. Sci. 2013, 46, 1572–1599. [Google Scholar] [CrossRef]
- Saha, V.O.C.; al Bazi, A.; Guha, K. Optimisation of Solar Photovoltaic (PV) Parameters Using Metaheuristics. Microsyst. Technol. 2021, 27, 3161–3169. [Google Scholar]
- Said, M.; Abdullah, M.; Shaheen, A.; Ginidi, R.; El-Sehiemy, R.A.; Mahmoud, K.; Lehtonen, M.; Darwish, M.M.F. Estimating Parameters of Photovoltaic Models Using Accurate Turbulent Flow of Water Optimizer. Processes 2021, 9, 627. [Google Scholar] [CrossRef]
- Abdel-Basset, M.; Mohamed, R.; Mirjalili, S.; Chakrabortty, R.K.; Ryan, M.J. Solar Photovoltaic Parameter Estimation Using an Improved Equilibrium Optimizer. Sol. Energy 2020, 209, 694–708. [Google Scholar] [CrossRef]
- Ramadan, A.; Kamel, S.; Hussein, M.M.; Hassan, M.H. A New Application of Chaos Game Optimization Algorithm for Parameters Extraction of Triple-Diode Photovoltaic Model. IEEE Access 2021, 9, 51582–51594. [Google Scholar] [CrossRef]
- Ramadan, A.; Kamel, S.; Khurshaid, T.; Oh, S.; Rhee, S. Parameter Extraction of Triple-Diode Solar Photovoltaic Model Using Improved Grey Wolf Optimizer. Sustainability 2021, 13, 6963. [Google Scholar] [CrossRef]
- Naruei, I.; Keynia, F. Wild Horse Optimizer: A New Meta Heuristic Algorithm for Solving Engineering Optimization Problems. Eng. Comput. 2021. [Google Scholar] [CrossRef]


| Parameter | Solar Cell | PV Module | ||
|---|---|---|---|---|
| Lower Limit | Upper Limit | Lower Limit | Upper Limit | |
| Rs | 0 | 5 | 0 | 5 |
| Rsh | 0 | 100 | 0 | 1000 |
| Iph | 0 | 2 | 0 | 2 |
| Is1 | 0 | 1 | 0 | 1 |
| Is2 | 0 | 1 | 0 | 1 |
| Is2 | 0 | 1 | 0 | 1 |
| ɳ1 | 1 | 2 | 1 | 50 |
| ɳ2 | 1 | 2 | 1 | 50 |
| ɳ3 | 1 | 2 | 1 | 50 |
| Rsm | 1 | 0.1 | --- | --- |
| MTDM | TDM | MDDM | DDM | |
|---|---|---|---|---|
| Rs (Ω) | 0.031719 | 0.036743 | 0.0045190 | 0.036783 |
| Rsh (Ω) | 60 | 55.50765 | 60 | 56.07530 |
| Iph (A) | 0.760734 | 0.760781 | 0.760347 | 0.760752 |
| Is1 (A) | 1.97 × 10⁻⁶ | 7.66 × 10⁻⁷ | 2.05 × 10⁻⁷ | 8.002 × 10⁻⁷ |
| Is2 (A) | 4.73 × 10⁻⁹ | 1.00 × 10⁻¹⁰ | 8.71 × 10⁻⁷ | 2.2046 × 10⁻⁷ |
| Is3 (A) | 1.00 × 10⁻¹⁰ | 2.26 × 10⁻⁷ | ---- | ----- |
| ɳ1 | 1.783574 | 2 | 1.48504 | 1.999973 |
| ɳ2 | 1.197584 | 1.446786 | 1.579685 | 1.448974 |
| ɳ3 | 1 | 1.446794 | ----- | ----- |
| Rsm | 0.090031 | ------ | 0.04941 | ------ |
| RMSE | 0.00076511 | 0.000982417 | 0.000783 | 0.0009832 |
| PE5DSSE | 1.52205 × 10⁻⁵ | 2.50944 × 10⁻⁵ | 1.59406 × 10⁻⁵ | 2.51344 × 10⁻⁵ |
| MTDM | Minimum | Average | Maximum | STD |
|---|---|---|---|---|
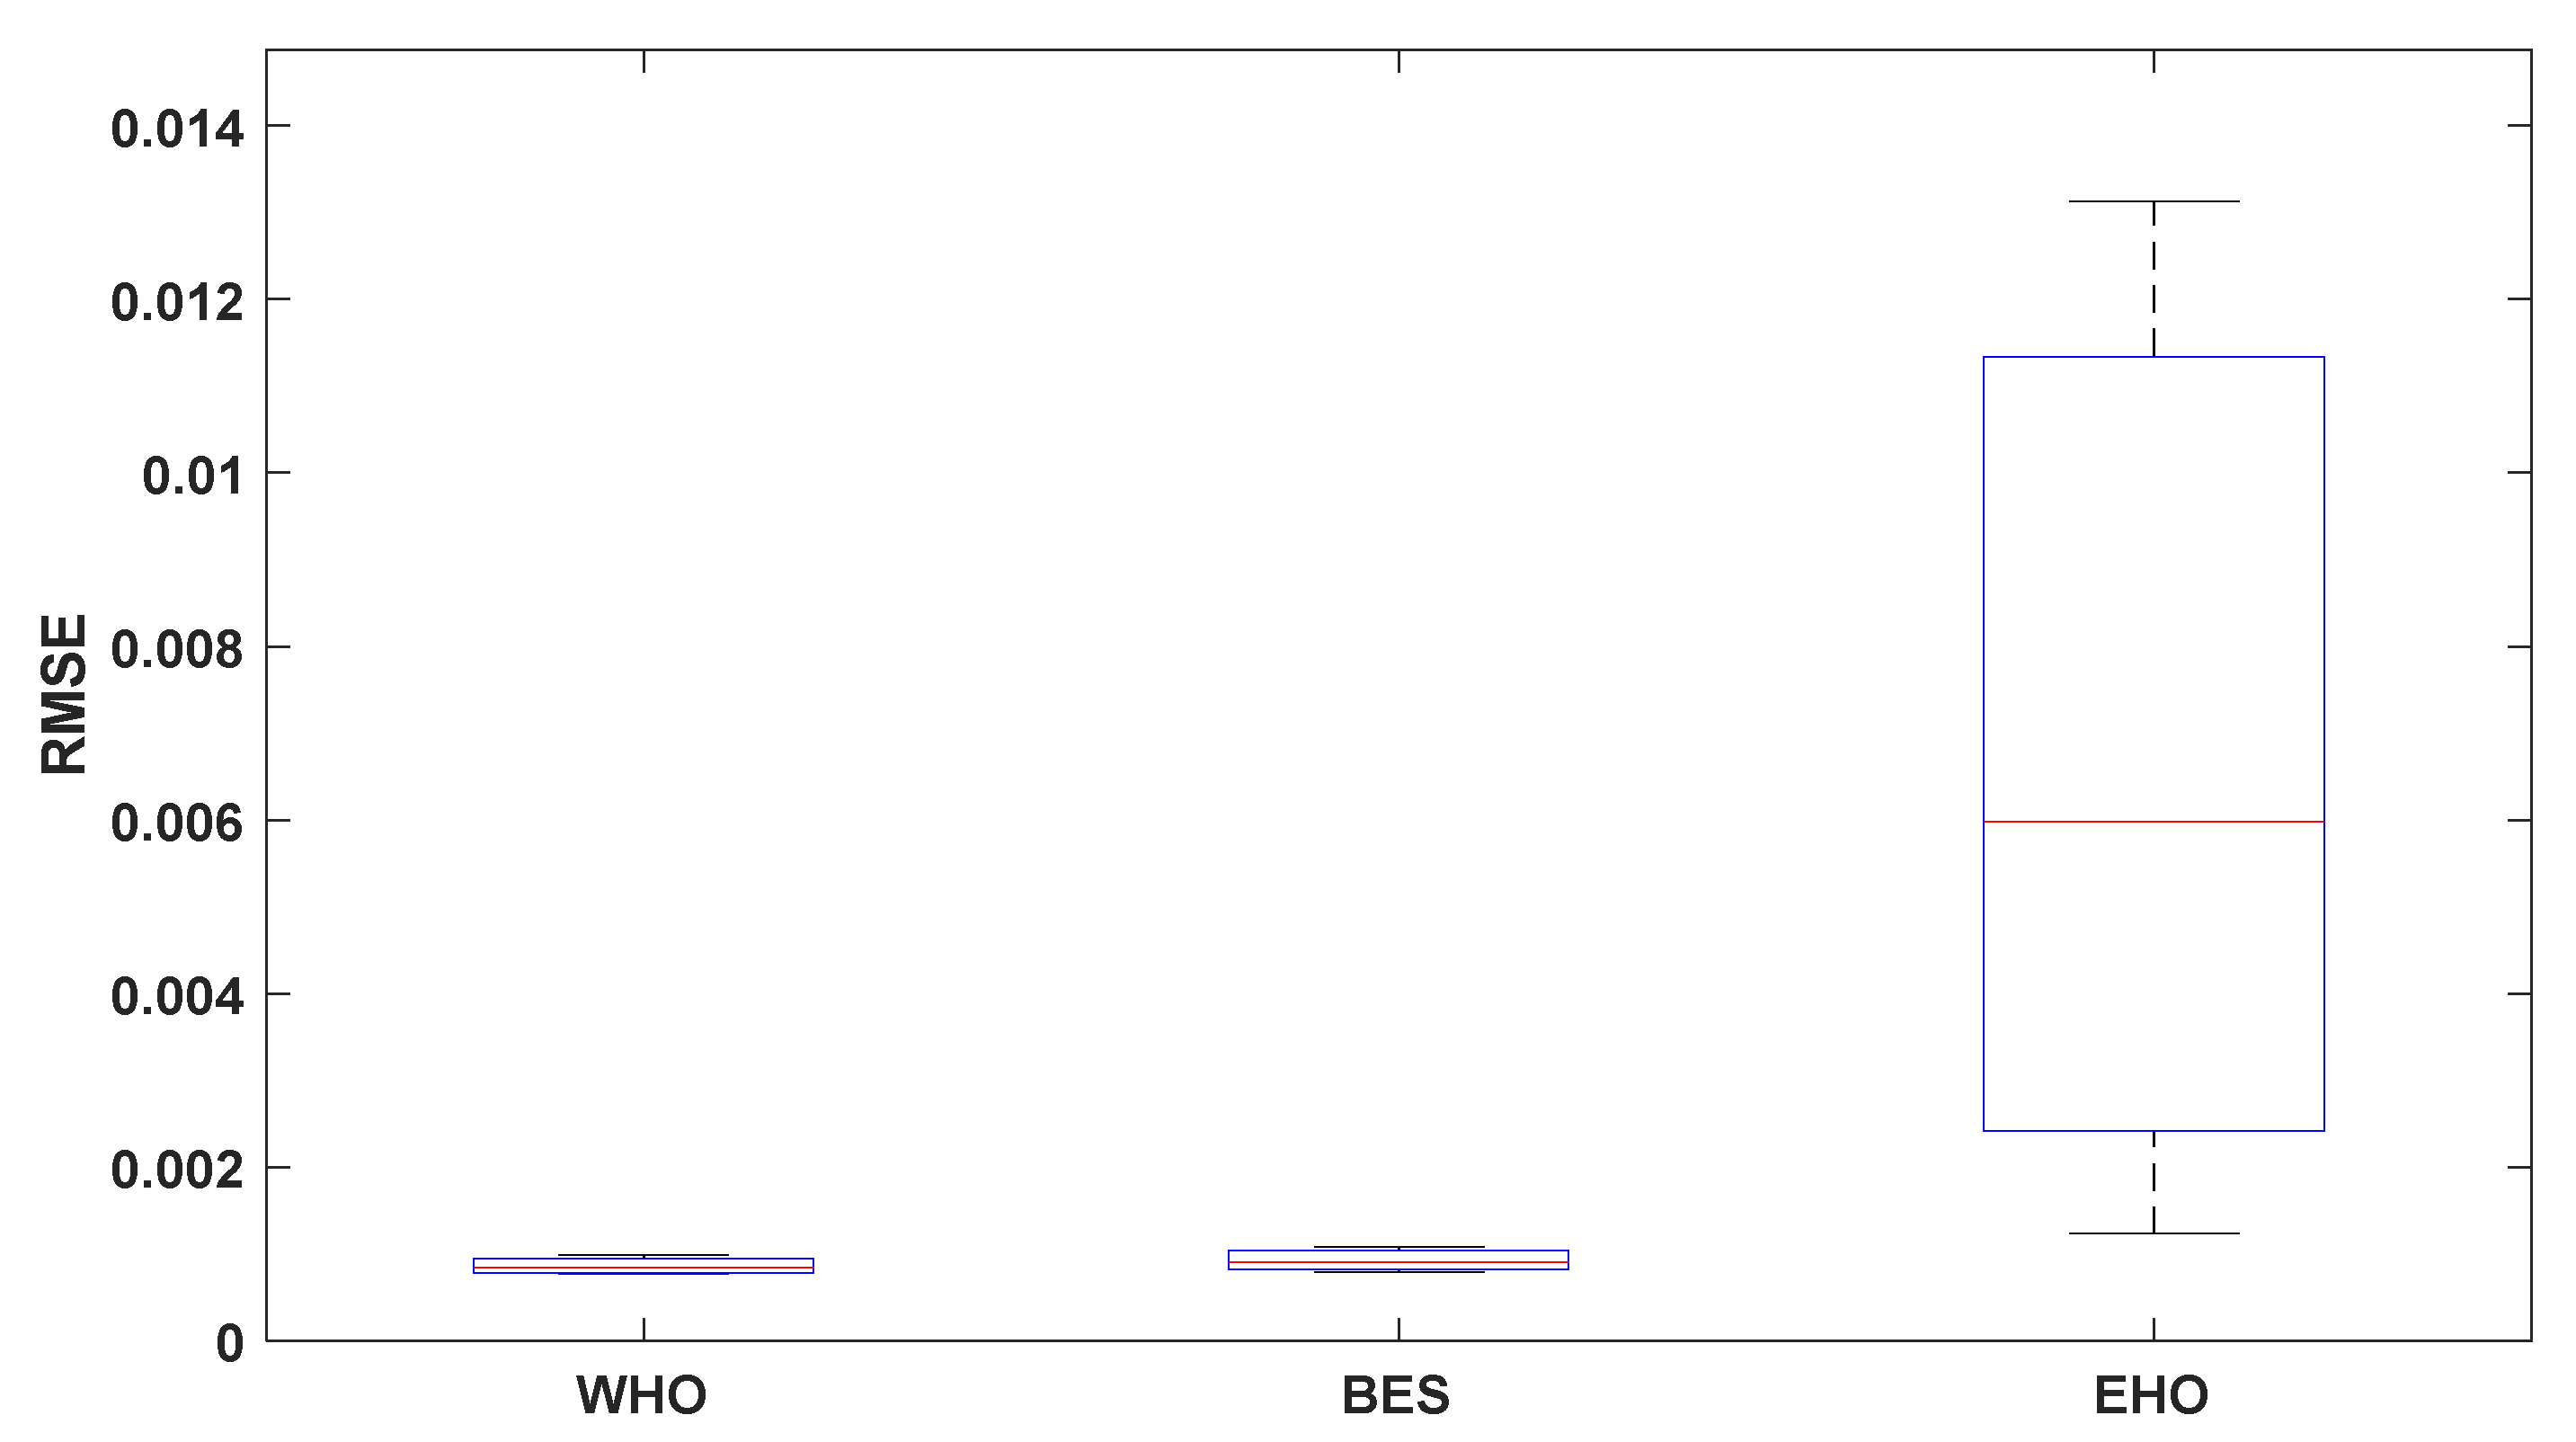
| WHO | 0.00076511 | 0.000842 | 0.000986 | 0.000125 |
| BES [18] | 0.000790747 | 0.000901 | 0.00107848 | 0.00015509 |
| EHO [19] | 0.001233 | 0.0059761 | 0.0131253 | 0.0039343 |
| MDDM | Minimum | Average | Maximum | STD |
|---|---|---|---|---|
| WHO | 0.000783 | 0.000842 | 0.000960371 | 0.000103 |
| BES [18] | 0.000824 | 0.001109 | 0.001603713 | 0.00043 |
| EHO [19] | 0.001557 | 0.0065934 | 0.0132005 | 0.0037673 |
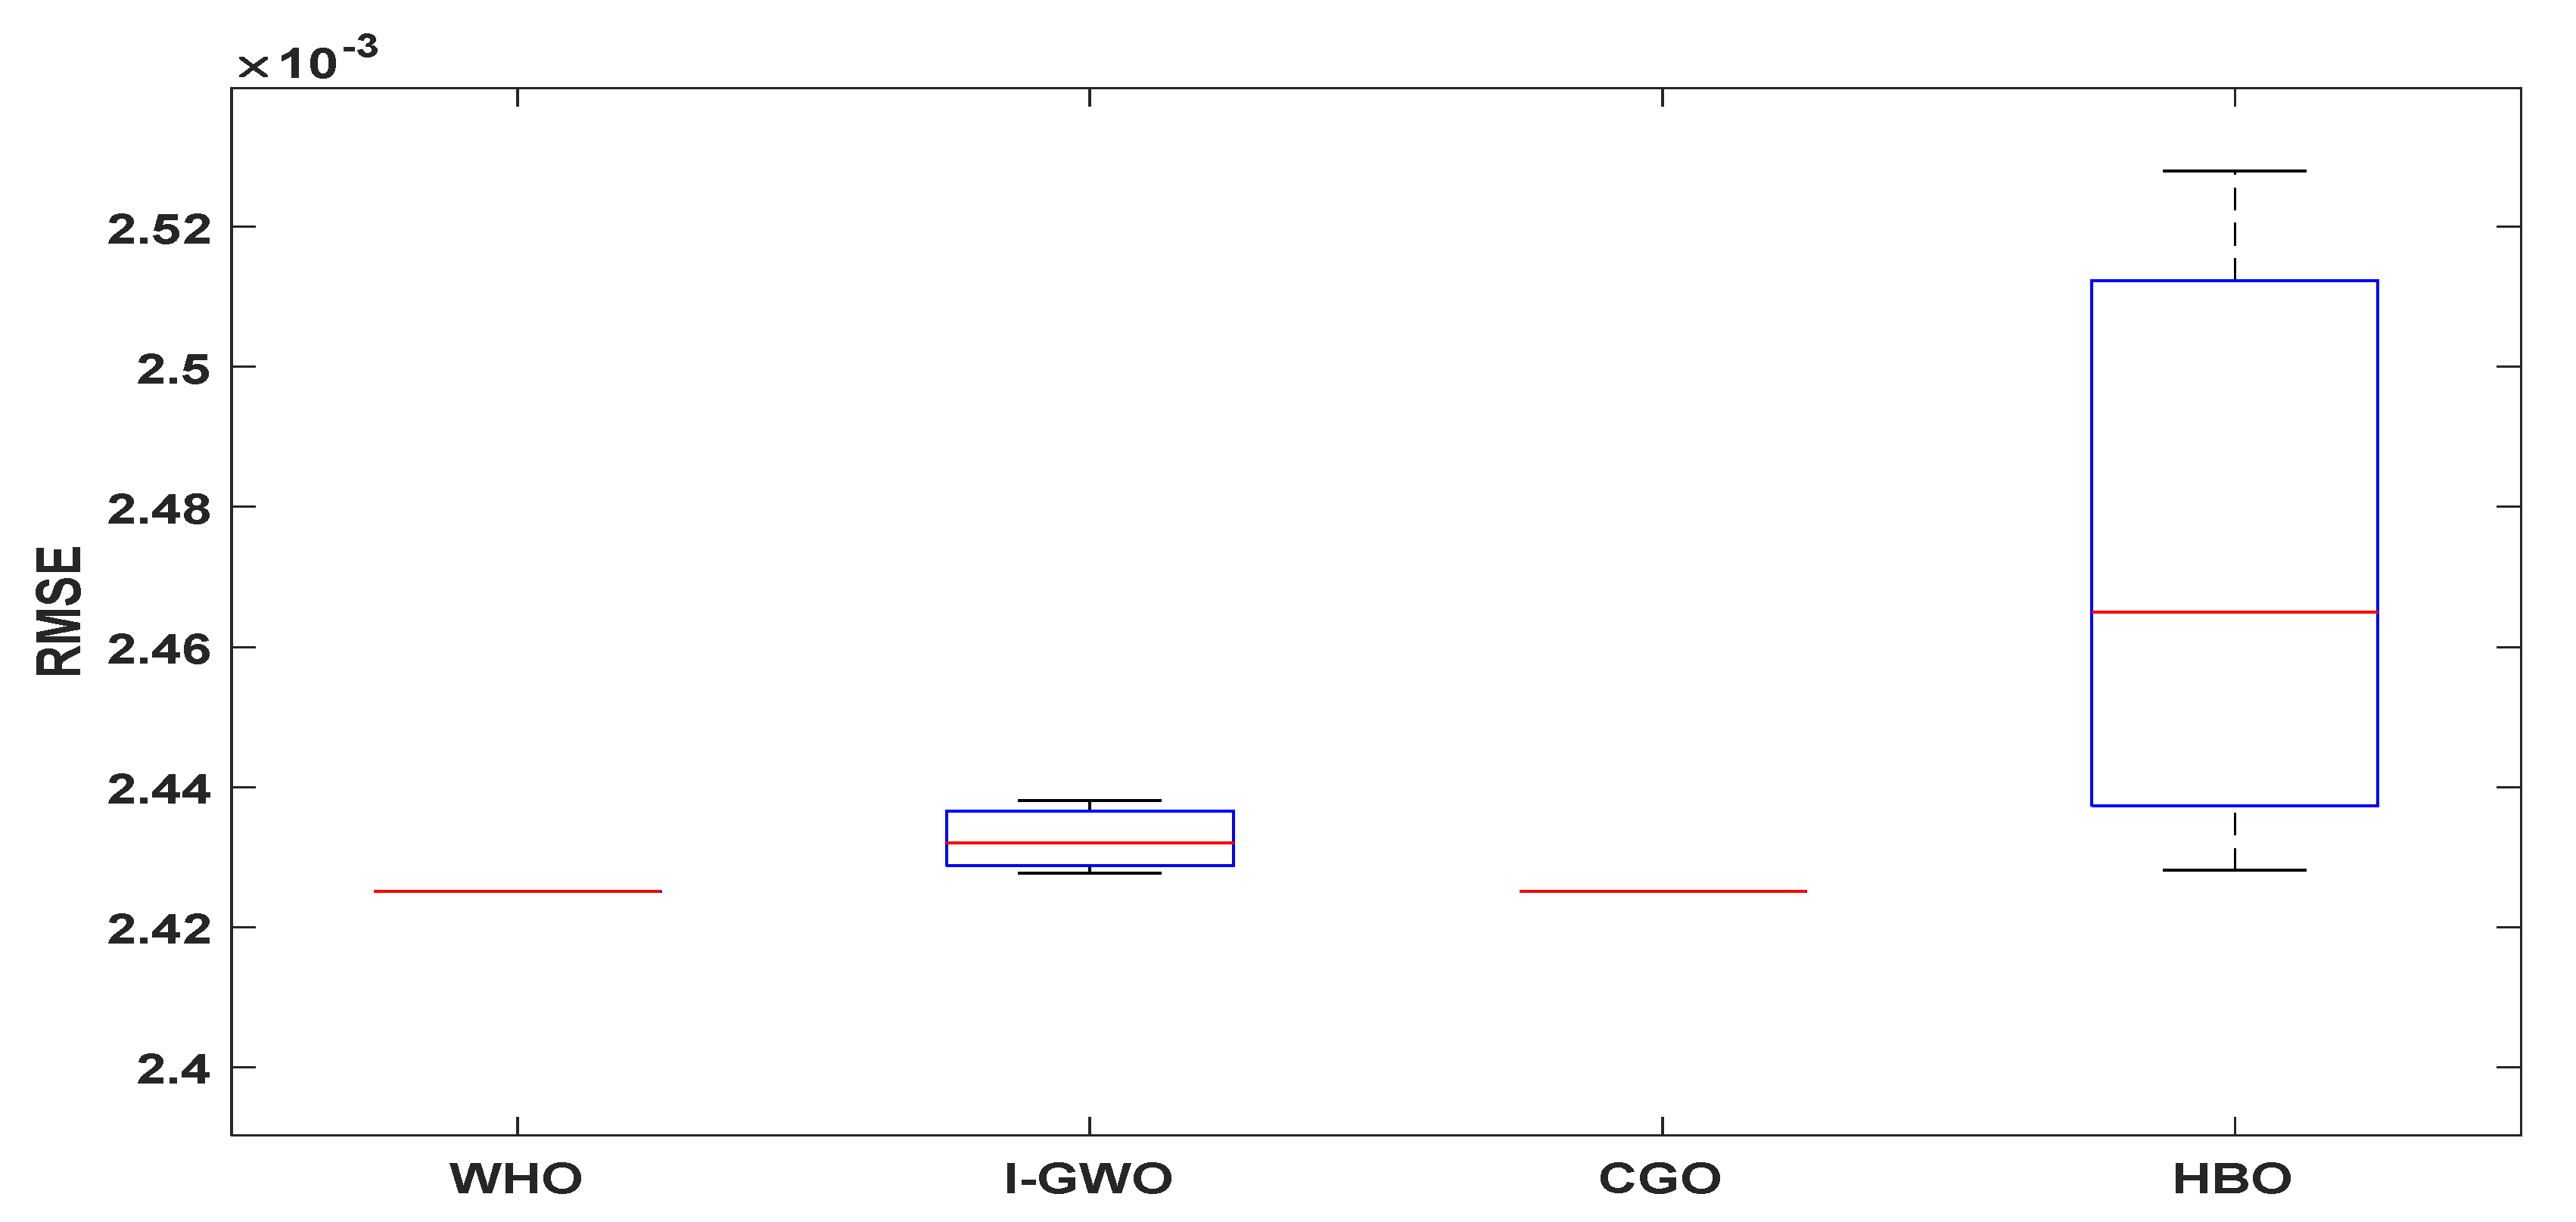
| WHO | I-GWO | CGO | HBO | |
|---|---|---|---|---|
| Rs (Ω) | 1.201271011 | 1.198683773 | 1.201271 | 1.199582 |
| Rsh (Ω) | 981.9822265 | 986.3365886 | 981.9828 | 983.629 |
| Iph (A) | 1.030514299 | 1.030508846 | 1.030514 | 1.030447 |
| Isd1 (A) | 3.48 × 10⁻⁶ | 1.25 × 10⁻⁶ | 4.25 × 10⁻⁹ | 3.48 × 10⁻⁷ |
| Isd2 (A) | 1.00 × 10⁻¹⁰ | 7.77 × 10⁻⁷ | 4.50 × 10⁻¹⁰ | 1.00 × 10⁻¹⁰ |
| Isd3 (A) | 1.00 × 10⁻¹⁰ | 1.54 × 10⁻⁶ | 3.48 × 10⁻⁶ | 3.19 × 10⁻⁶ |
| ɳ1 | 48.50792821 | 49.2667226 | 48.50769 | 48.60267 |
| ɳ2 | 48.50787128 | 48.38422661 | 48.5083 | 49.52947 |
| ɳ3 | 49.82604479 | 48.25593375 | 48.50793 | 48.56558 |
| RMSE | 0.002425075 | 0.0024276291 | 0.0024251 | 0.0024281 |
| Minimum | Average | Maximum | STD | |
|---|---|---|---|---|
| WHO | 0.002425075 | 0.002425075 | 0.002425075 | 2.16891 × 10⁻¹⁶ |
| I-GWO | 0.002427629 | 0.002432 | 0.002438 | 5.26003 × 10− |
| CGO | 0.002425075 | 0.002425092 | 0.0024251 | 1.45 × 10⁻⁸ |
| HBO | 0.0024281 | 0.002465 | 0.002528 | 5.50757 × 10⁻⁵ |
Publisher’s Note: MDPI stays neutral with regard to jurisdictional claims in published maps and institutional affiliations. |
© 2021 by the authors. Licensee MDPI, Basel, Switzerland. This article is an open access article distributed under the terms and conditions of the Creative Commons Attribution (CC BY) license (https://creativecommons.org/licenses/by/4.0/).
Share and Cite
Ramadan, A.; Kamel, S.; Taha, I.B.M.; Tostado-Véliz, M. Parameter Estimation of Modified Double-Diode and Triple-Diode Photovoltaic Models Based on Wild Horse Optimizer. Electronics 2021, 10, 2308. https://doi.org/10.3390/electronics10182308
Ramadan A, Kamel S, Taha IBM, Tostado-Véliz M. Parameter Estimation of Modified Double-Diode and Triple-Diode Photovoltaic Models Based on Wild Horse Optimizer. Electronics. 2021; 10(18):2308. https://doi.org/10.3390/electronics10182308
Chicago/Turabian StyleRamadan, Abdelhady, Salah Kamel, Ibrahim B. M. Taha, and Marcos Tostado-Véliz. 2021. "Parameter Estimation of Modified Double-Diode and Triple-Diode Photovoltaic Models Based on Wild Horse Optimizer" Electronics 10, no. 18: 2308. https://doi.org/10.3390/electronics10182308
APA StyleRamadan, A., Kamel, S., Taha, I. B. M., & Tostado-Véliz, M. (2021). Parameter Estimation of Modified Double-Diode and Triple-Diode Photovoltaic Models Based on Wild Horse Optimizer. Electronics, 10(18), 2308. https://doi.org/10.3390/electronics10182308