Article

Implementation of an Award-Winning Invasive Fish Recognition and Separation System

1
School of Computer Science and Engineering, South China University of Technology, Guangzhou 510641, China
2
School of Electrical and Computer Engineering, Nanfang College Guangzhou, Guangzhou 510970, China
3
Electrical and Computer Engineering, Brigham Young University, Provo, UT 84602, USA
4
Smart Vision Works, Inc., Orem, UT 84058, USA
*
Author to whom correspondence should be addressed.
Electronics 2021, 10(17), 2182; https://doi.org/10.3390/electronics10172182
Submission received: 15 August 2021 / Revised: 3 September 2021 / Accepted: 3 September 2021 / Published: 6 September 2021
(This article belongs to the Special Issue Convolutional Neural Networks and Vision Applications)

Abstract

:
The state of Michigan, U.S.A., was awarded USD 1 million in March 2018 for the Great Lakes Invasive Carp Challenge. The challenge sought new and novel technologies to function independently of or in conjunction with those fish deterrents already in place to prevent the movement of invasive carp species into the Great Lakes from the Illinois River through the Chicago Area Waterway System (CAWS). Our team proposed an environmentally friendly, low-cost, vision-based fish recognition and separation system. The proposed solution won fourth place in the challenge out of 353 participants from 27 countries. The proposed solution includes an underwater imaging system that captures the fish images for processing, fish species recognition algorithm that identify invasive carp species, and a mechanical system that guides the fish movement and restrains invasive fish species for removal. We used our evolutionary learning-based algorithm to recognize fish species, which is considered the most challenging task of this solution. The algorithm was tested with a fish dataset consisted of four invasive and four non-invasive fish species. It achieved a remarkable 1.58% error rate, which is more than adequate for the proposed system, and required only a small number of images for training. This paper details the design of this unique solution and the implementation and testing that were accomplished since the challenge.

1. Introduction

In the 1970s, several species of invasive carp were imported into the southern United States to keep commercial fish facilities clean and to improve the water quality in wastewater ponds. These species escaped into the local waterways and have been swimming northward ever since, overwhelming the Mississippi and Illinois River systems and eventually invading other states across the country. According to the document released by the Great Lakes Invasive Carp Challenge [1], the sheer size and abundance of these fish in local waterways have a severe and detrimental impact to the native ecosystems of any waterway they colonize.
Research has shown that an individual bighead or silver carp is capable of consuming food over 20% of its body weight a day, weighing over 90 pounds, and laying up to 3 million eggs per year [2]. In some southern waters where bighead and silver carp are well established, they comprise more than 95% of the living matter in an area, displacing the native species and changing the local habitat and recreational opportunities. They have implications for the food web, native species, and other ecosystems poised to be invaded [3]. In addition to causing ecological harm, silver carp are known to leap as high as ten feet out of the water when disturbed by sounds or other movement. They land in boats, damage property, and routinely injure people, discouraging the recreational use of prized lakes, rivers and streams [4]. This puts local economies that depend on natural resource-based tourism activities at risk.
Great efforts have been made to prevent invasive carp movement, directly or indirectly, without damage to the ecosystem, other species or waterway navigation. Some technologies have been studied, but not all of them are ideal, or even feasible. The most well-known deterrent to the movement of invasive carp into the Great Lakes is the system of three electric dispersal barriers at the Lockport Lock and Dam near Chicago [5]. It applies an electric gradient current in the water that paralyzes the fish the further they go into the zone. The main challenges are that the system is not effective on small fish and is harmful to humans. The U.S. Geological Survey tested the use of broadband sound as barriers to prevent invasive carp movement or as a way to direct them to desired locations for removal [6]. Bubble barriers using CO2 as a chemical barrier and the dangers that the chemical could cause to humans or other species when used in this way were studied [7]. Water jets were used as a “curtain” to deter fish from moving past a point [8].
Changing the temperature of the water (usually warmer) will deter fish from entering an area, but the big drawback is changes to the environment by continually adding heat unless there is a way to remove it afterwards, which is expensive [9]. Researchers have also been looking for some type of biological/chemical effect that will kill/sterilize/stun invasive carp selectively, but it is quite difficult to be that selective [10]. Physical barriers are not ideal because they prevent navigation on the waterway or the movement of all species. Similarly, lock controls, without closing them permanently, cannot prevent invasive carp from being carried through by larger boats and barrages. Commercial finishing has also been used to limit invasive carp population but is not sustainable, especially when the fish population is already established. There are a few natural predators for invasive carp. Introducing them could also have unforeseeable negative impacts to the ecosystems.
As defined by the challenge, the ideal solution must not do the following:
  • Threaten endangered species.
  • Affect commercial or recreational navigation.
  • Prevent water flow and wastewater or storm discharge.
  • Have negative effects on resident fish, plans, or insects.
  • Limit commercial and sport fishing.
  • Fail to maintain state and federal standards for water quality.
  • Introduce another potentially invasive species.
Most aforementioned efforts face different levels and types of challenges. They are either expensive, harmful to humans, have uncertain effectiveness, inconvenient to navigation, or have an adverse impact on the environment or ecosystems, rendering them unfeasible. The ability to selectively capture invasive fish species without disrupting other fish is currently not available. Different from other finalists in the challenge [1] that proposed using high-speed jets of water to deter fish, chlorine treatment to clean vessels passing through the lock, adjustable physical velocity barriers to create water barriers, our team proposed the only solution that did not employ any of these conventional technologies and had great potential to meet all requirements.
Our proposed solution was a machine vision system capable of capturing fish images, recognizing fish species and selectively separating and restraining invasive fish species for removal. It was designed to prevent invasive carp from moving past the installation point by directing all fish through an automated imaging and sorting system that uses a fish species recognition algorithm to help divert invasive fish to a holding area for removal. This unique solution comprises three main components: an underwater imaging system, a fish species recognition algorithm, and a fish separation mechanism. The design of this unique solution and the implementation and testing have been accomplished since the challenge, and are discussed in the next section.

2. Materials and Methods

We first discuss the implementation of an underwater imaging system and the dealings with the challenge of water turbidity in this section. It is followed by the design and control of the fish separation mechanism and the description of the overall function of the system. Fish species recognition is deservedly the most challenging task of this research and is discussed at the end of this section. The test results are reported in Section 3.

2.1. Underwater Imaging System

Lighting requirements and camera and lens selections are essential to building an underwater imaging system to capture images that highlight problems that are faced in various types of water. The submersible MV 30-25 camera and lens housing from Sexton [11] were selected in combination with a BlackFly-S GigE camera from Point Grey [12]. The Fujinon FE185C057HA lens has a focal length of 1.8 mm, referred to as a “fish-eye” lens, and a minimum object distance of 4 inches. The assembled camera and lens housing is shown in Figure 1a. A custom light chamber was designed and manufactured, using aluminum and a grid of high-power LEDs potted in epoxy resin. The completed imaging system used for capturing fish images and test images in water with varying levels of turbidity is shown in Figure 1b. Figure 1c shows a large water tank used for testing the prototype underwater imaging system.
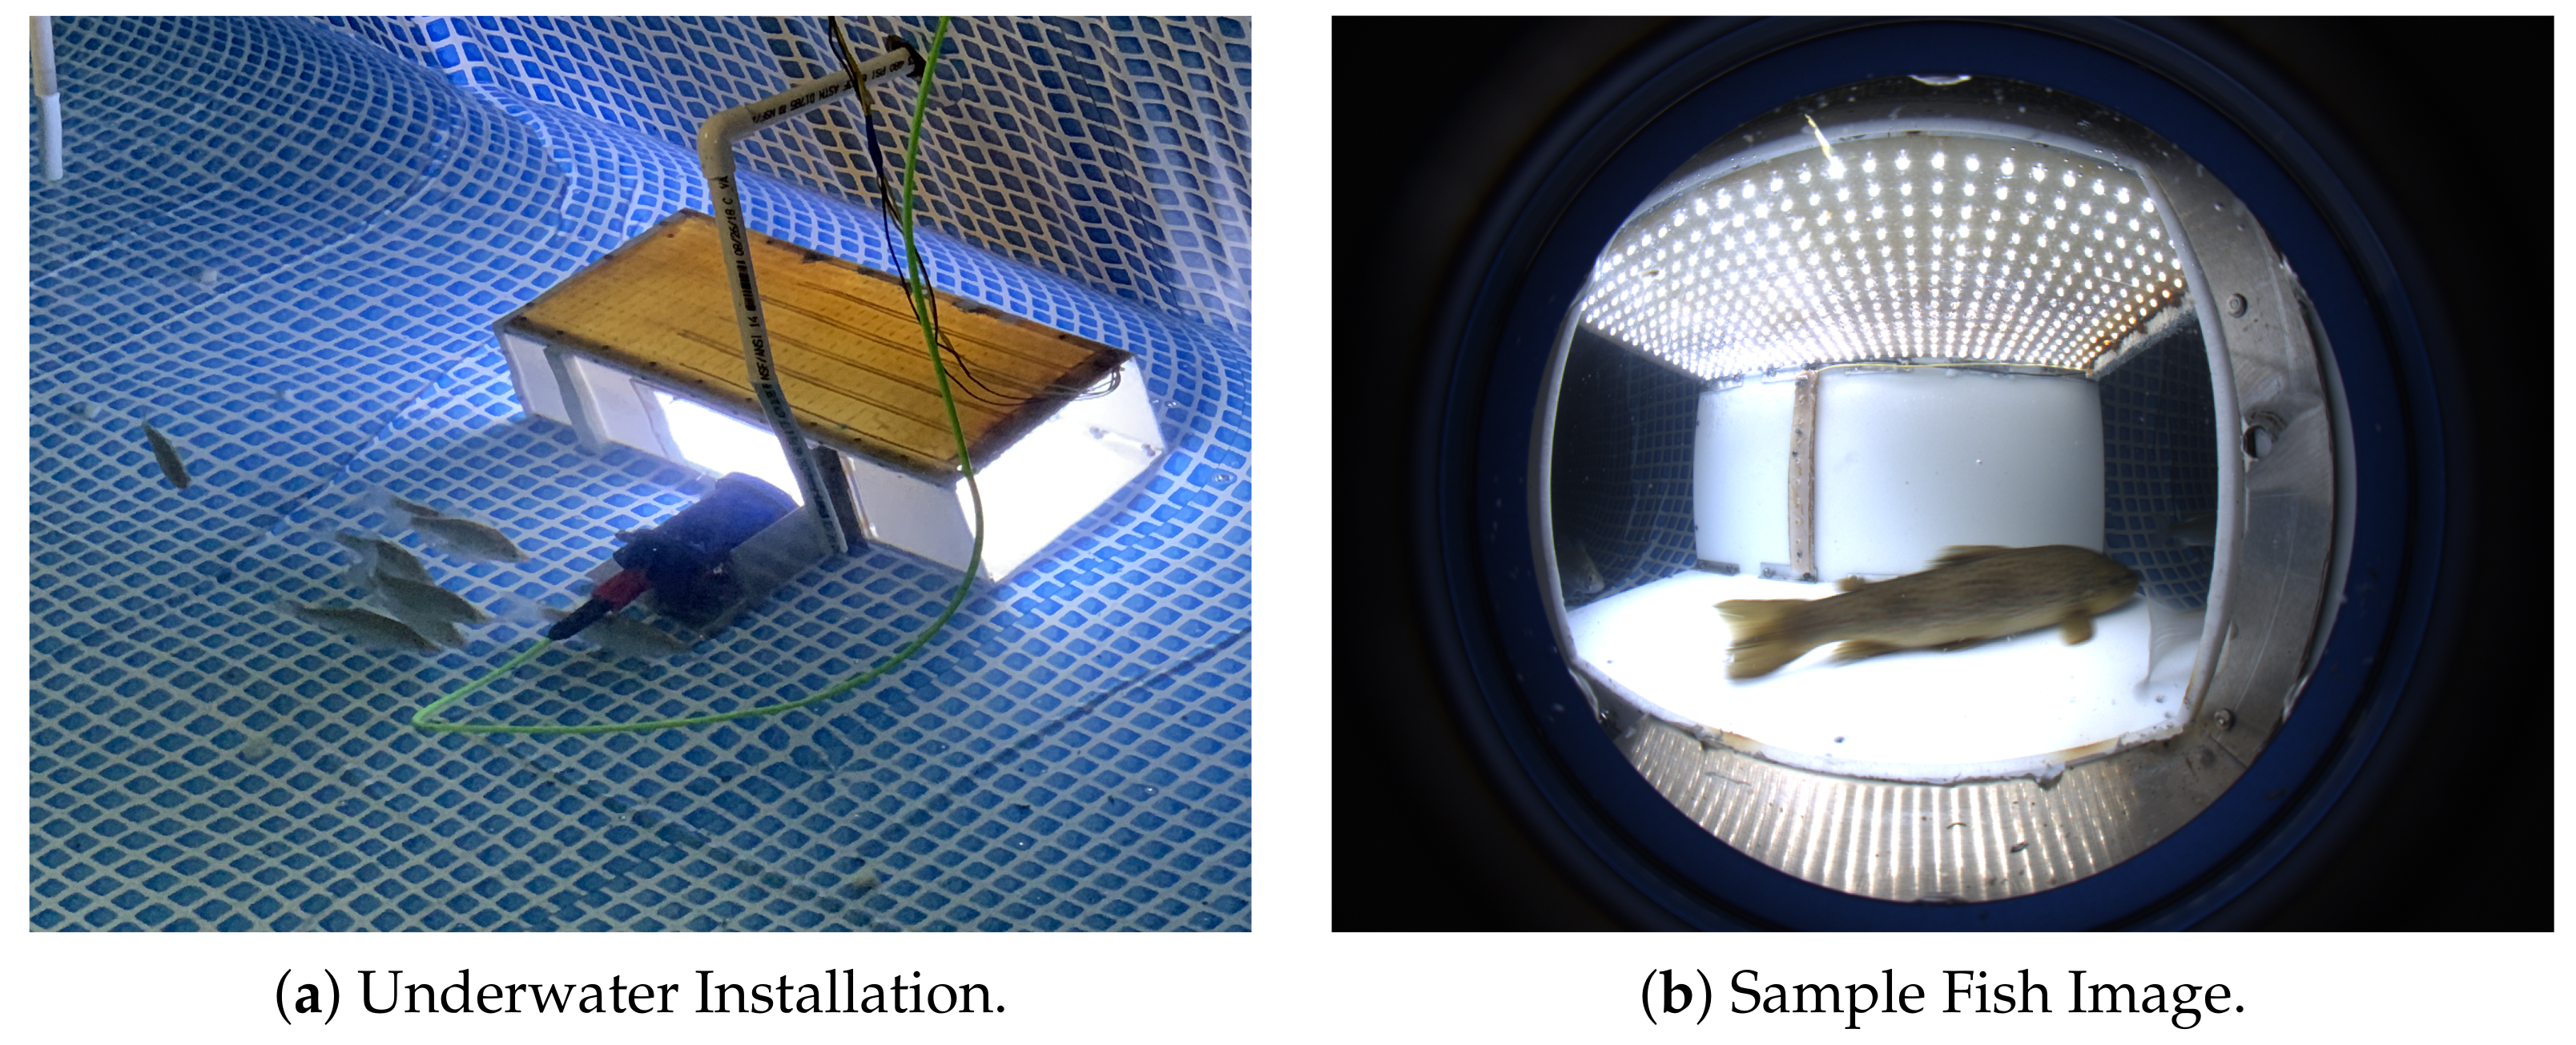
Figure 2a shows the installation of the underwater imaging system in the water tank. Figure 2b shows a sample image captured by the imaging system.

2.2. Water Turbidity

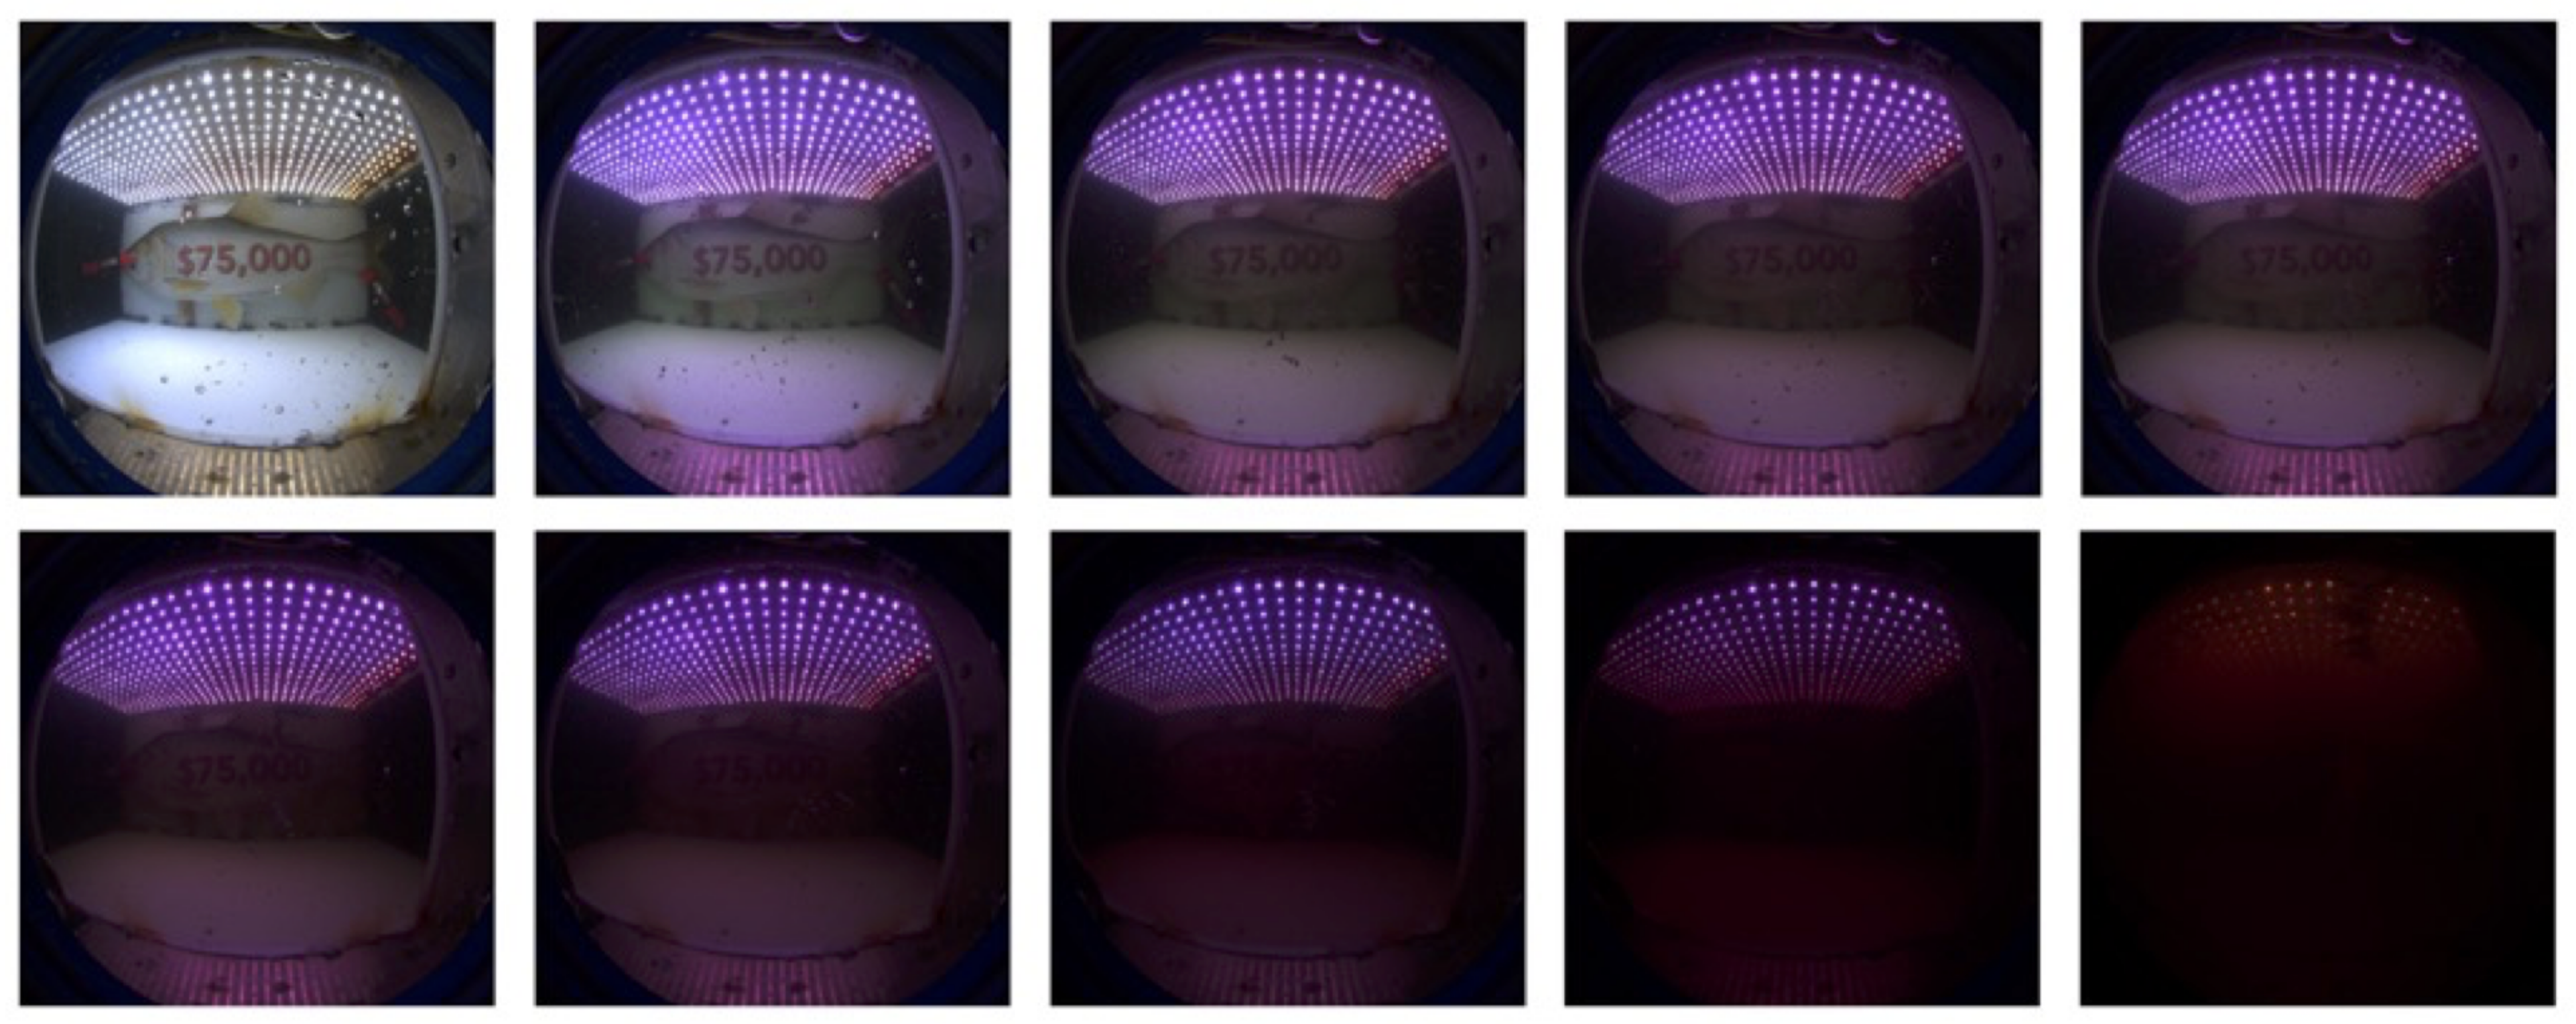
Images of water with varying levels of turbidity were captured in a water tank, where the turbidity could be incrementally increased while being measured with a digital turbidity meter. Readings were also taken with a Secchi disk as a secondary measurement. Figure 3 shows a few of the images taken during this testing. Since the fish species recognition algorithm relies on visual characteristics, such as color and texture patterns and shape, to distinguish between species, acceptable levels of turbidity must allow the fish to be visible anywhere in the imaging chamber. After performing these tests, the upper limit of turbidity of the current system was determined to be approximately 13 NTU or approximately 28 inches, using a Secchi disk.
While turbidity levels less than 13 NTU or 28 inches with a Secchi disk are sufficient to identify invasive fish species in many locations and for many applications, there are many bodies of water that are more turbid than this that could benefit from this fish species recognition and separation system. With this in mind, the following options could be considered to increase the maximum turbidity limits of the system. The first is to increase the amount of light in the chamber. While the chamber was manufactured with as many LEDs as could fit in the physical space, more efficient LEDs that can be placed more densely in the chamber have been made available.
Another option to deal with turbid waters is using flocculant blocks to reduce the turbidity of the water. There are several manufacturers that supply these kinds of products. Flocculant blocks consist of fine granules of powder-grade flocculant dispersed in a solid but readily soluble polymer. The carrier polymer is non-toxic and safe for use in aquatic applications. As water flows over the blocks, flocculant is released, which reacts with sediment, causing solids to settle rapidly, leaving clear, treated water. They do not affect the water pH or salinity, and they are low cost and safe for fish.
The image quality can be used for providing feedback to form a closed-loop system to control the LED illumination and the release of flocculant blocks. A quite powerful image quality assessment method without human input, hand-crafted features, or reference images was reported [13]. In our case, images shown in Figure 3 could be used as references, so a less sophisticated image quality assessment method could be employed for this purpose.

2.3. Fish Separation Mechanism

The proposed fish separation mechanism is designed to guide the fish to enter the system, allow it to pass in front of an imaging system, then direct it into one of two outlets based on the fish species recognition results from the fish species recognition algorithm. As a fish moves in front of the camera, the imaging system captures several images of each fish, allowing multiple images to be classified by the algorithm to ensure accurate recognition. The mechanism then detects when the fish has moved out of the system, and then it is ready to accept a new fish.
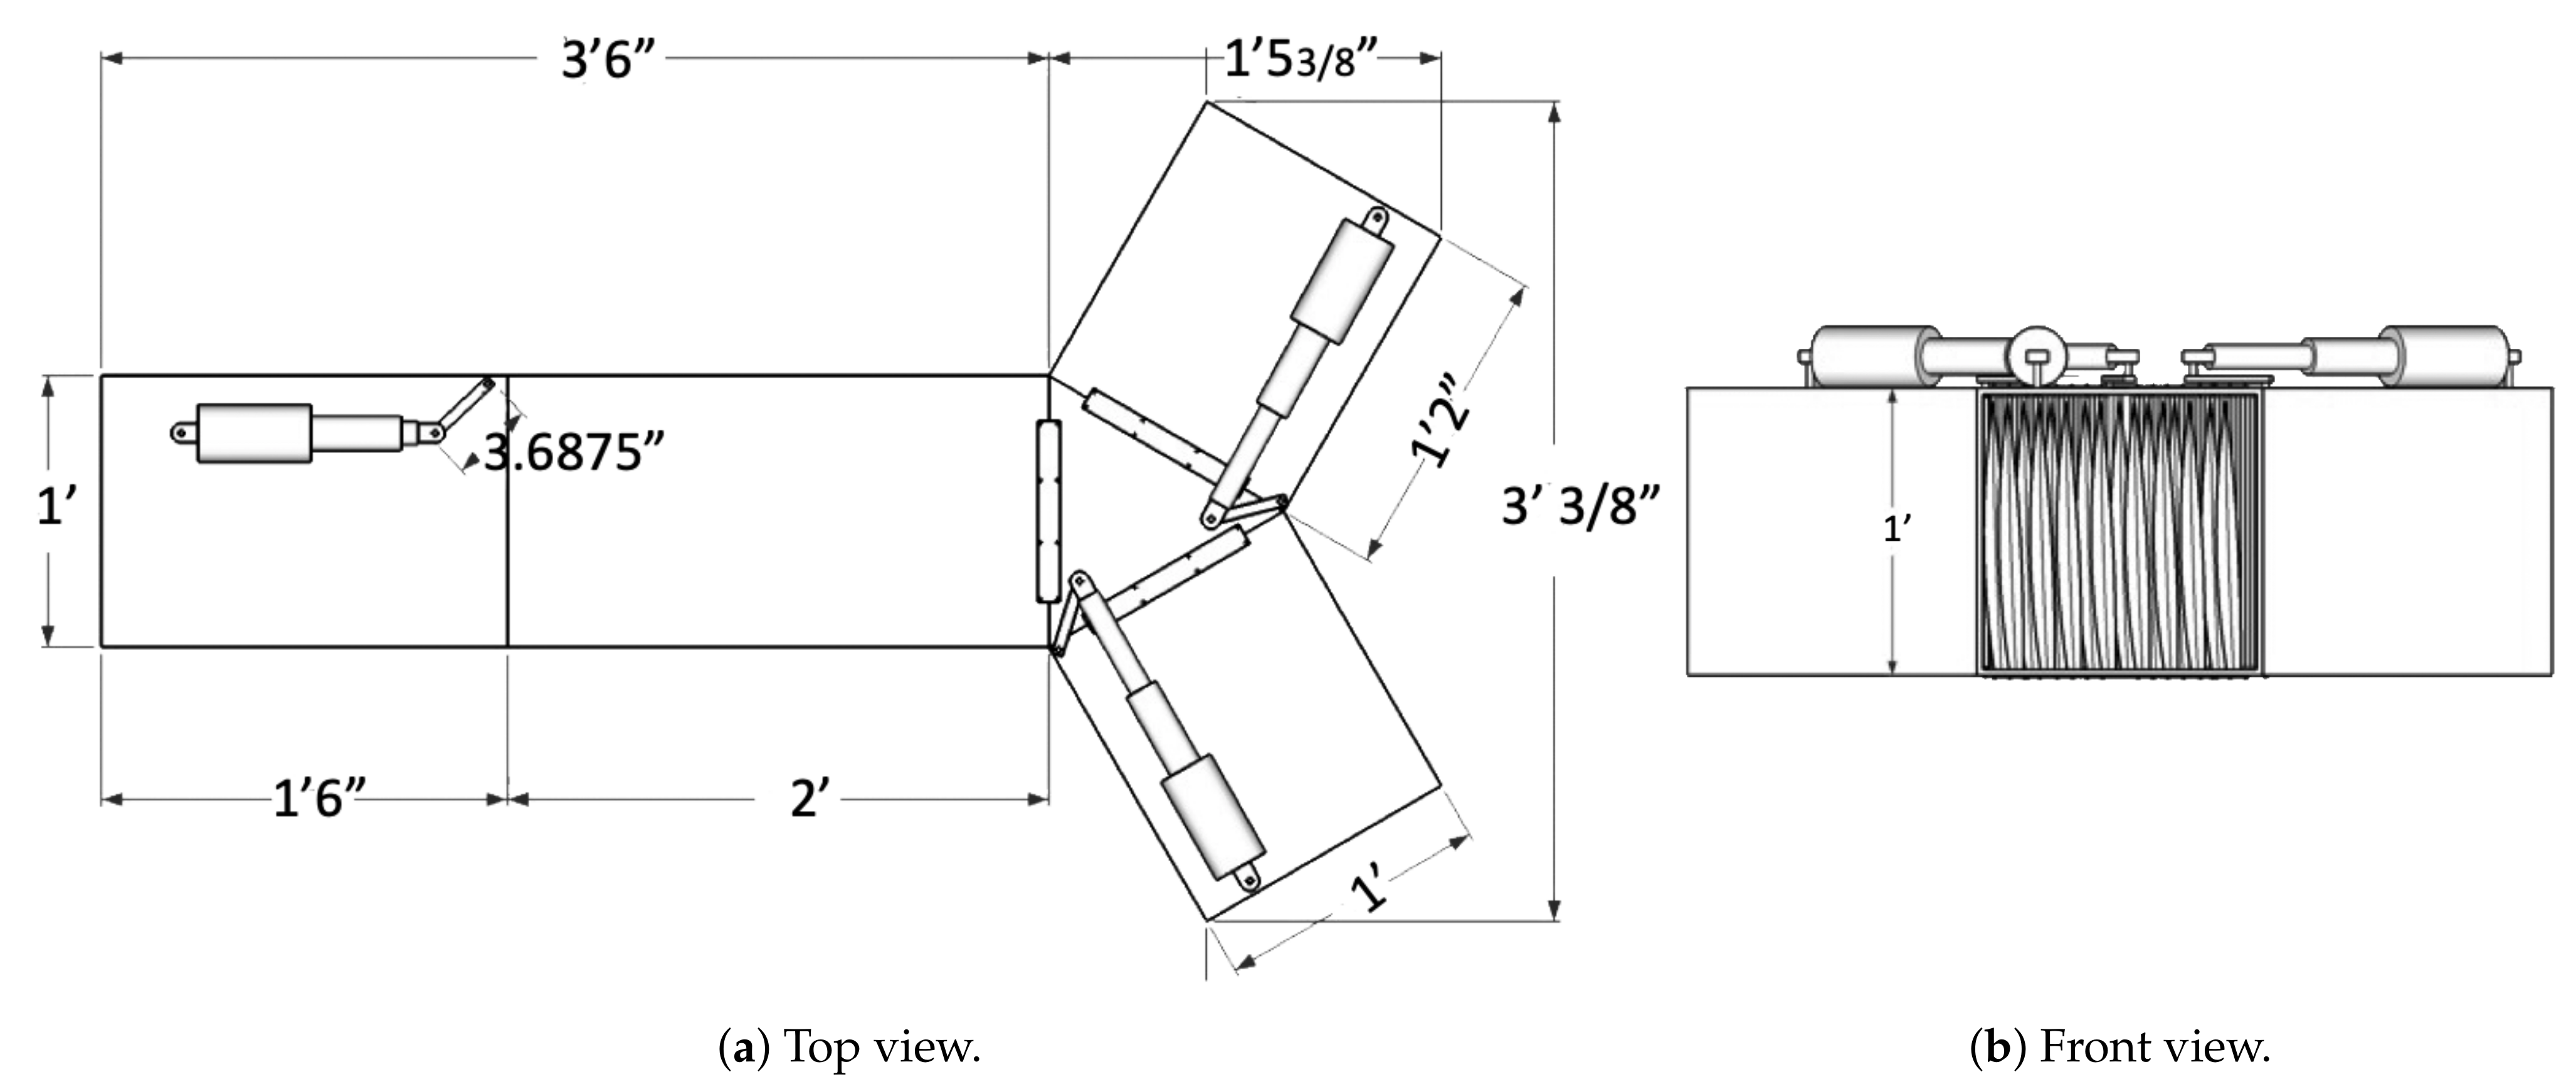
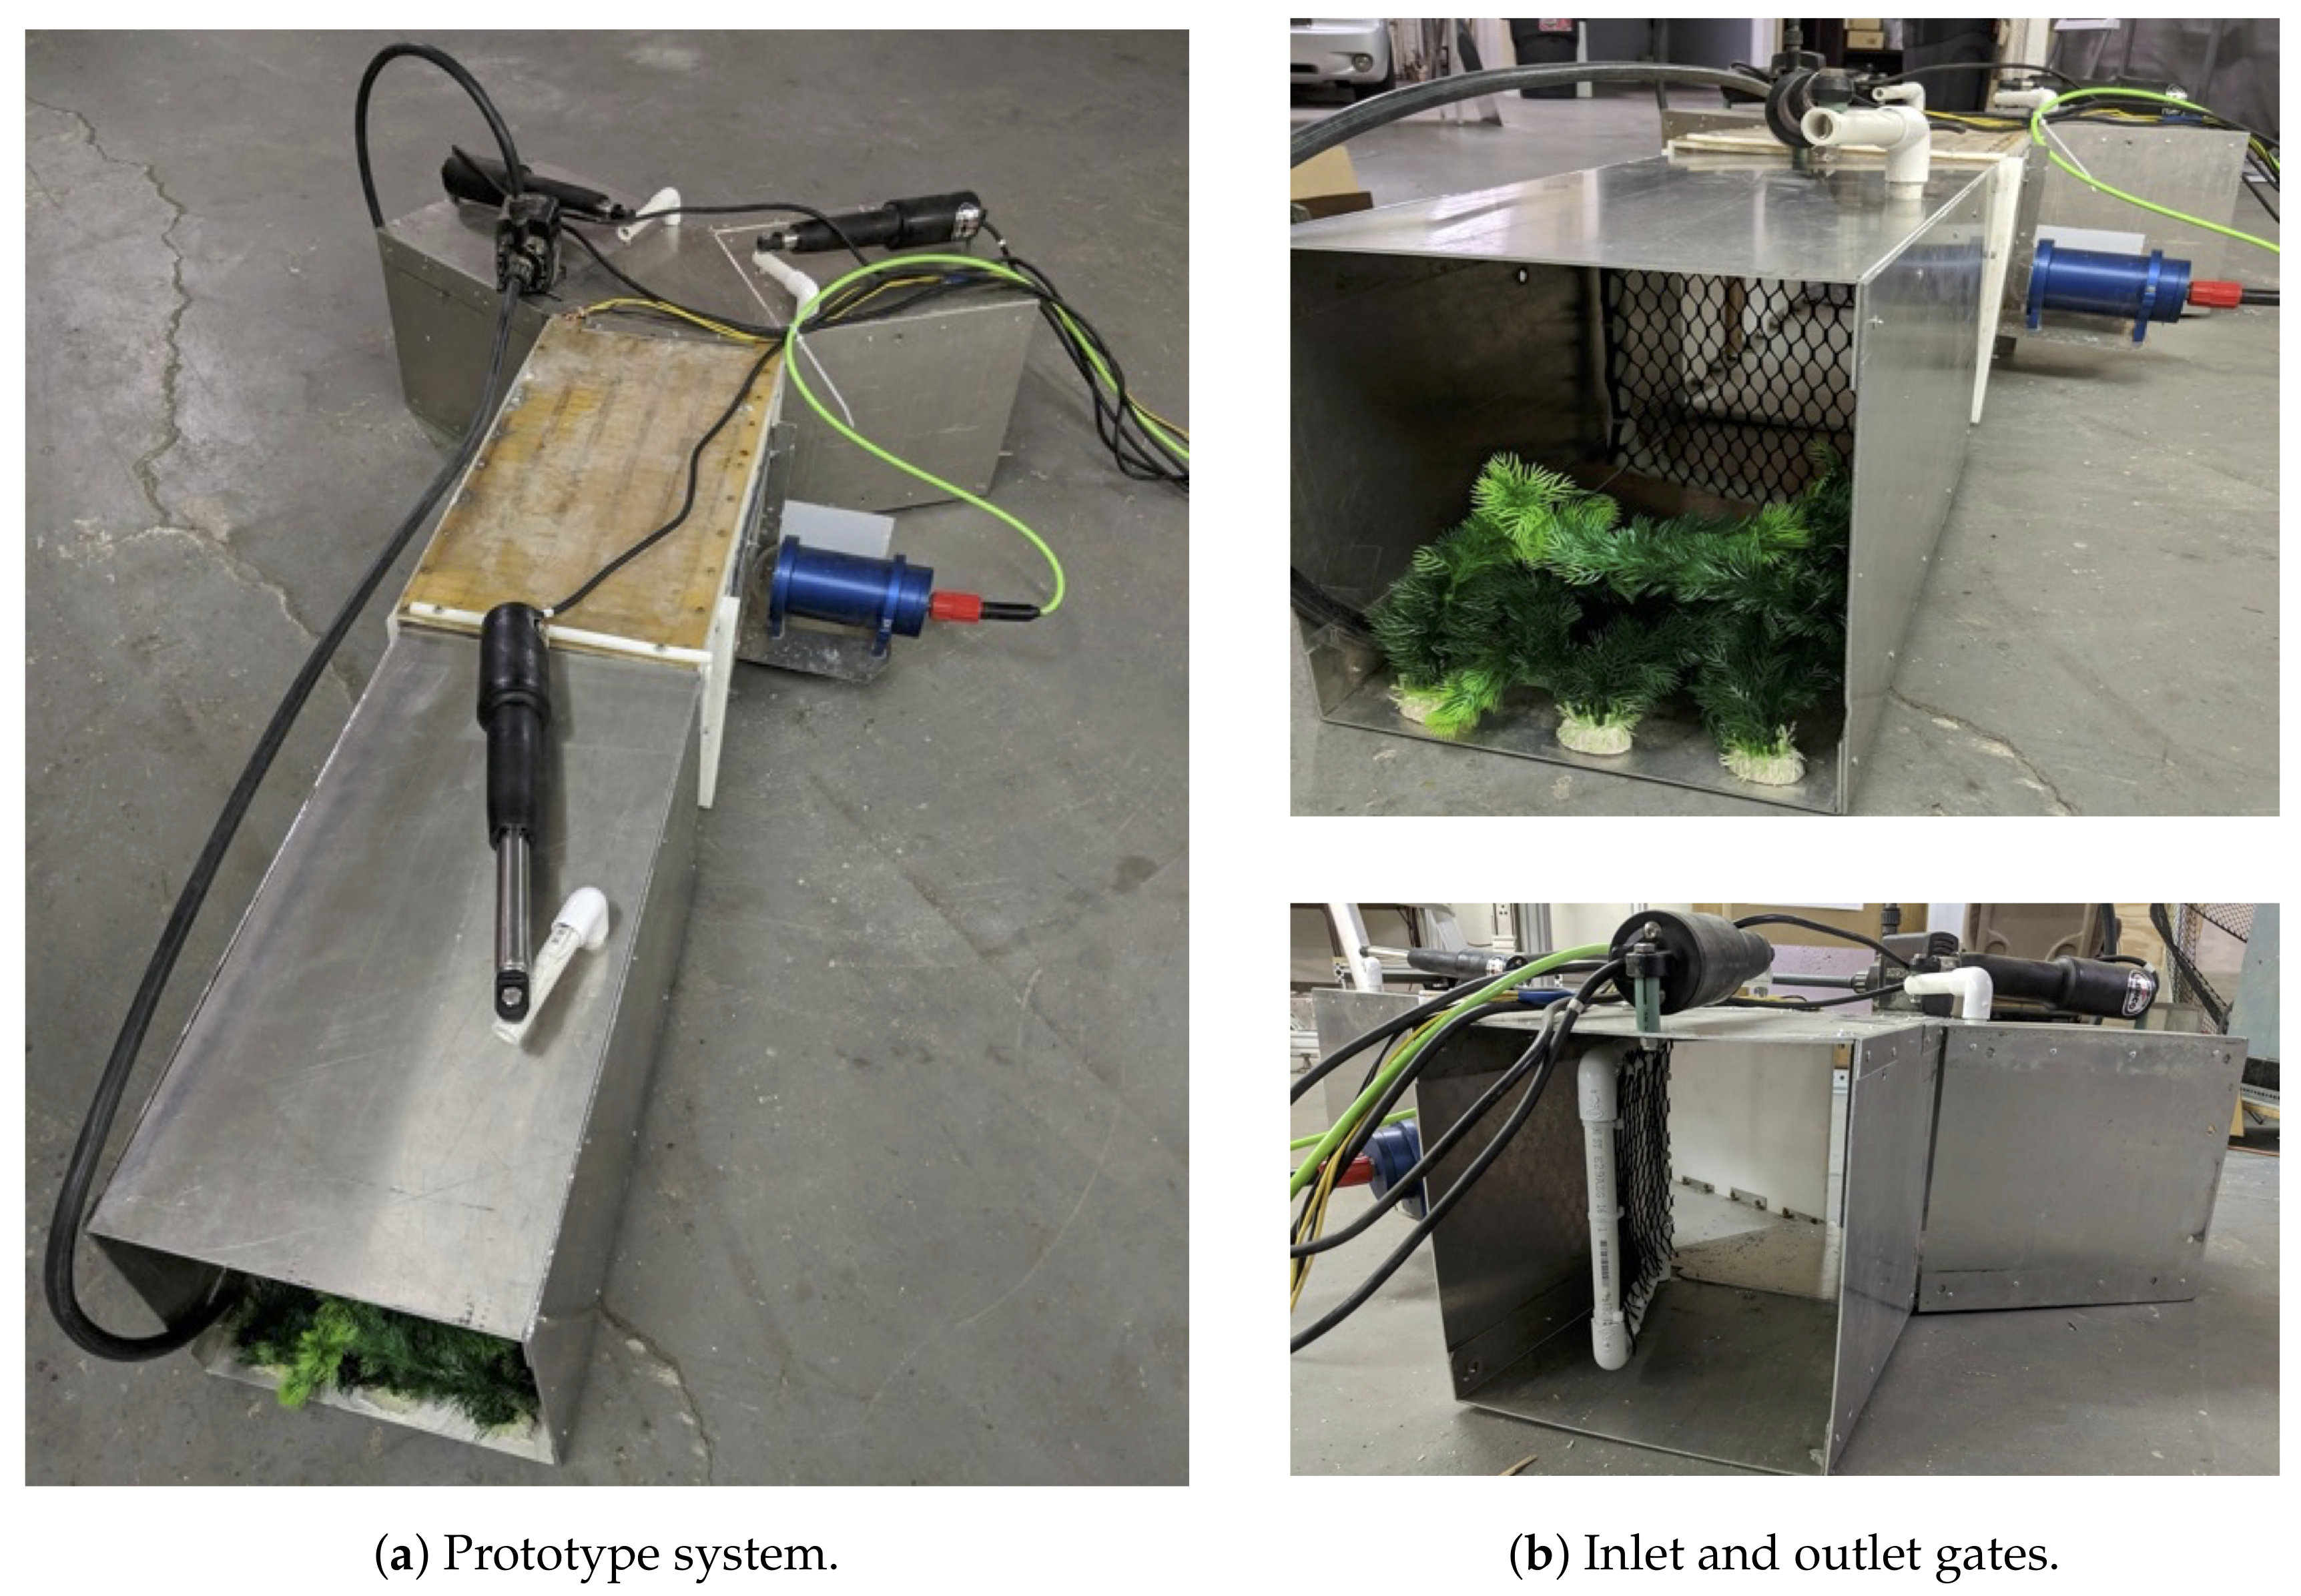
The design and dimensions of our fish separation mechanism are shown in Figure 4. It consists of 4 chambers: the inlet gated chamber (left section), the illuminated imaging chamber (middle section), the invasive species outlet gated chamber (top right section), and the non-invasive species outlet gated chamber (bottom right section). Figure 5a shows the finishing prototype of the four-chamber mechanism. Figure 5b shows the inlet and one of the two outlet gates.
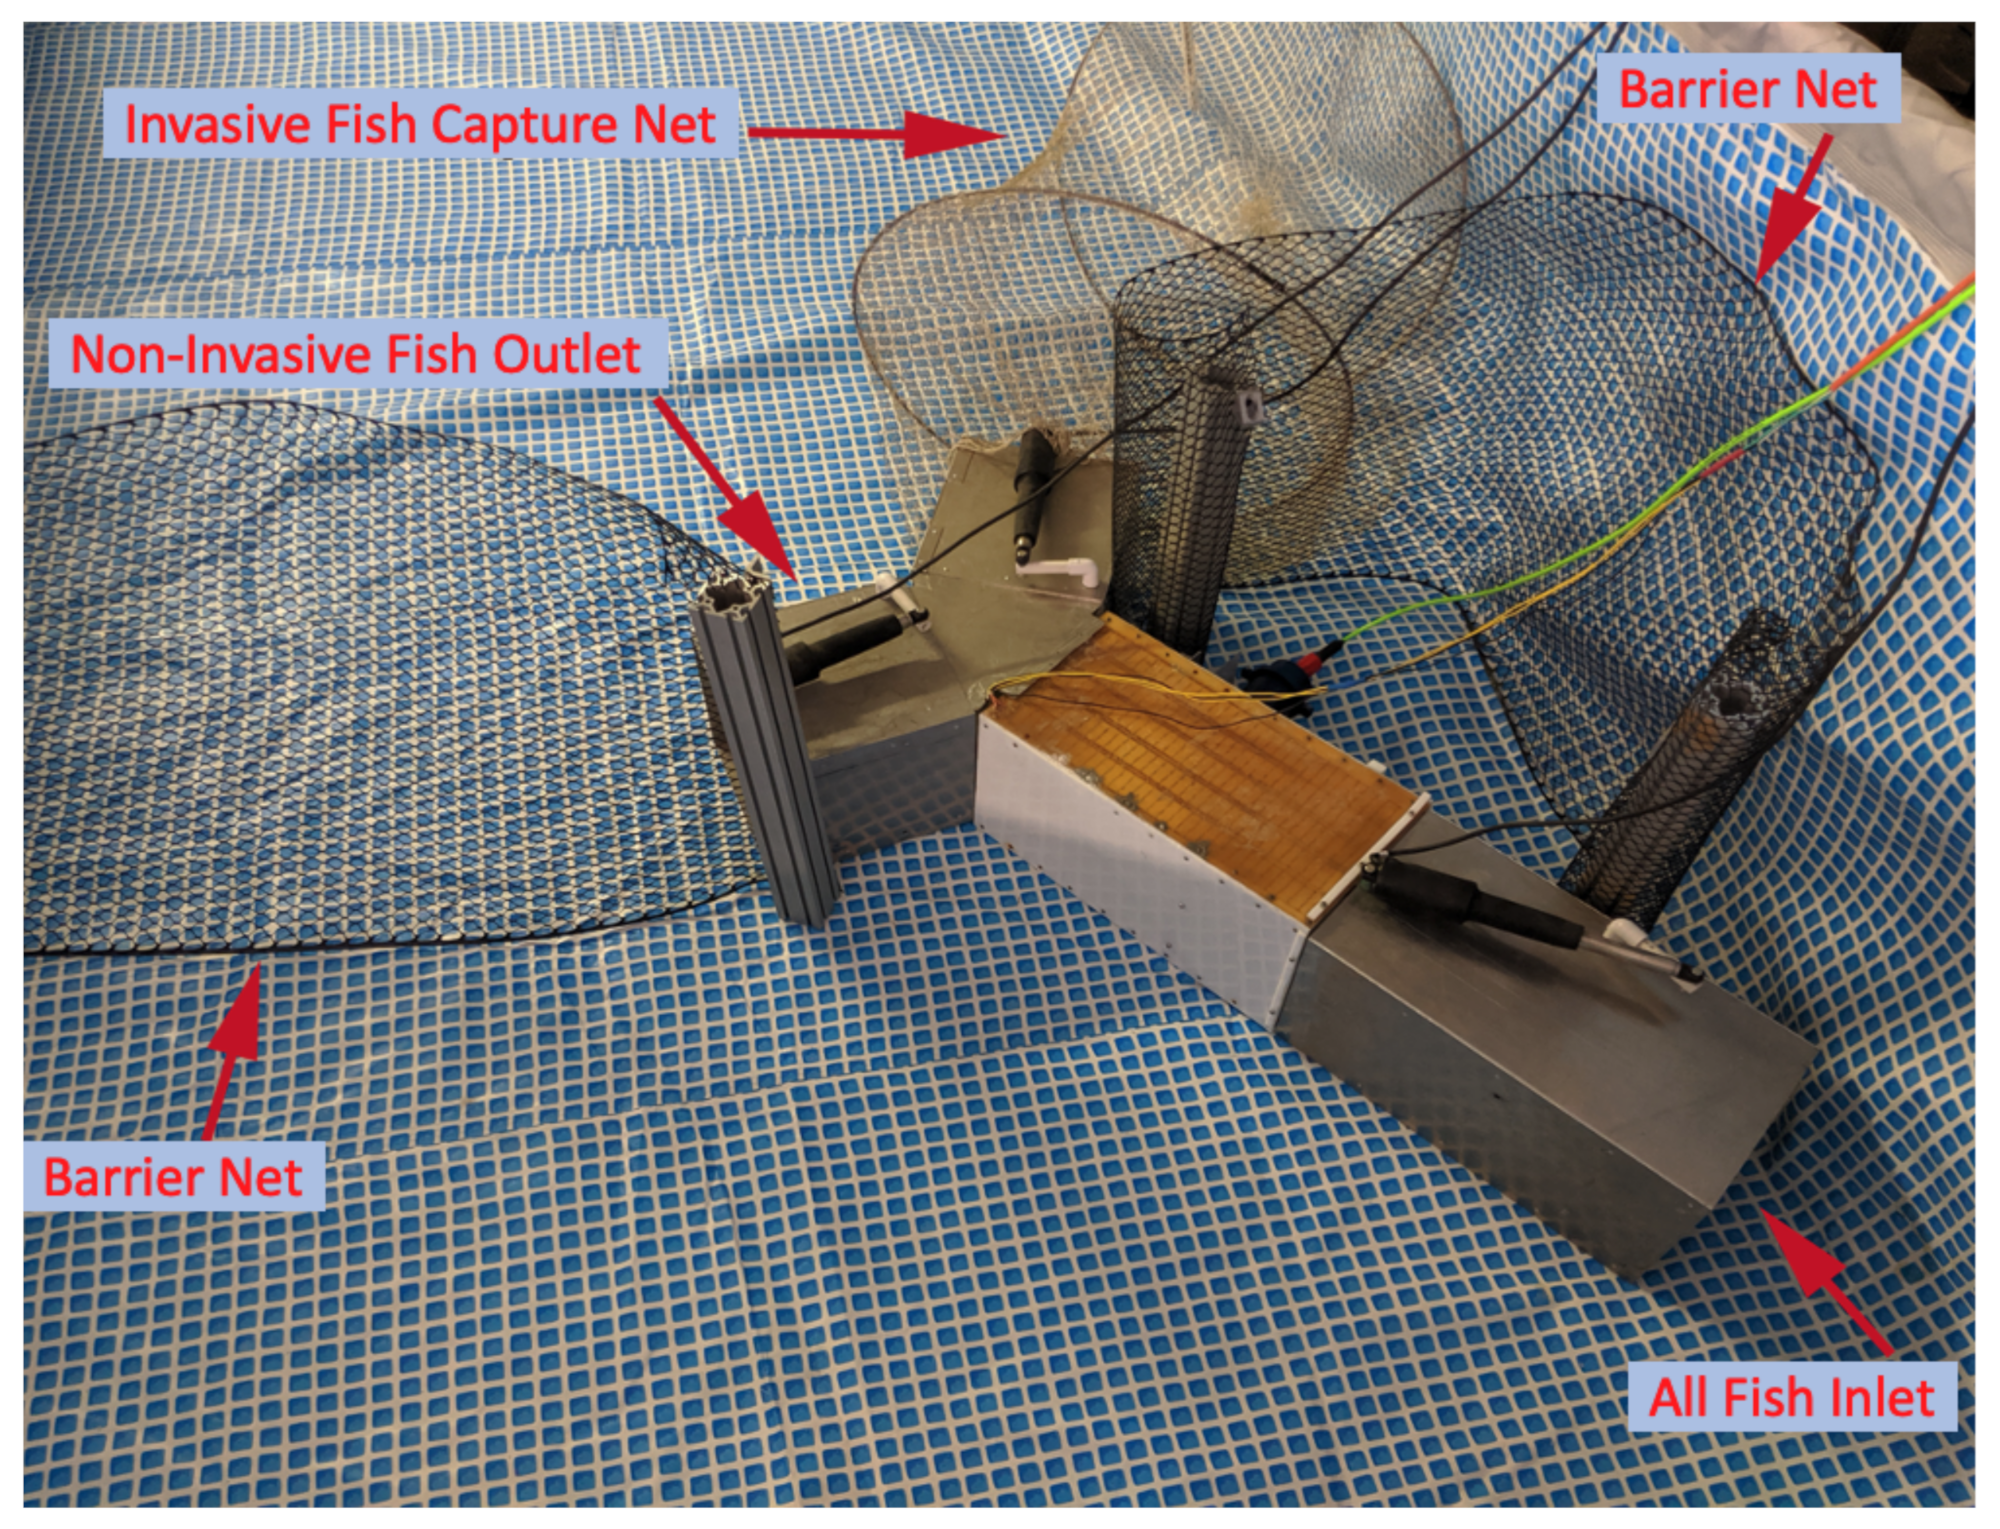
The system uses an Arduino to communicate with the vision system and control the three high current relays for the marine actuators to open and close the inlet and outlet gates. Since this application does not require high frame rates nor real-time processing, any basic computer is sufficient. An industrial NUC PC was used for this system. The fish separation mechanism was installed in a large water tank for experiments as shown in Figure 6. Two barrier nets were installed to guide the fish to enter the inlet gate and pass through the imaging chamber. An invasive fish capture net was attached to the invasive fish outlet gate to capture the invasive fish.

2.4. Control and Functionality

The fish separation mechanism is intended to allow fish to pass in front of an imaging system, then direct the fish into one of two output gates based on the recognition results. The vision system and the separation mechanism are most effective if fish pass through the system one at a time. To properly identify the species of fish, the whole fish needs to be visible in the image. As a fish moves in front of the camera, the system either needs to be able to take only the image where the fish is in full view, or it needs to take several images, tracking the fish from image to image in order to know when the fish is in full view, which direction it is moving, and when the fish is out of view and the system is ready to accept a new fish.
The gate system for letting fish in and out of the system can be in 1 of 5 states: waiting for fish, waiting for a determination from the recognition algorithm, letting an invasive fish species out, letting a native fish species out, and verifying the empty chamber. The system starts in the waiting-for-fish state, where the input gate is open and both output gates are closed. When motion is detected, the state changes and the recognition algorithm captures images to determine whether there is a fish present, and if so, what fish species it is. All input and output gates are closed in this state. Once a determination is made about the species, it moves to one of the two exit states that opens the appropriate output gate. The input gate is still closed. Once no motion is detected for several seconds, the output gates are closed, and the system moves back to the waiting-for-fish state. The fish separation mechanism was tested successfully in the water in a confined space where fish could be chased through the imaging system.

2.5. Fish Species Recognition

Computer vision technology was applied to fish identification for aquaculture and marine biology research. Fish identification is an important step for precision farming and fish behavior analysis [14,15], tracking fish abundance [15,16], and a mobile application that helps the user identify fish species in certain regions [17]. Demertzis et al. used an advanced intelligent machine hearing framework for marine species recognition [18]. It is a very unique method, although not applicable to fish species recognition.
A few different approaches using visual information for fish species recognition have been reported. Examples are graph embedding eiscriminant analysis [15], genetic programming for content-based image analysis [16], contour or silhouettes analysis [19,20], K-nearest neighbors algorithm [17], and the more popular convolutional neural networks approaches [21,22,23,24]. Most of them perform very well and could be easily adapted for detecting invasive fish species. Unlike our algorithm, some were developed for research and publication purposes and may not be suitable for real-time embedded applications or hardware implementations, such as the field programmable gate array (FPGA).
Building upon our previous success and with the support of a three-year grant from the U.S. Department of Agriculture (USDA), we have extended evolution-constructed feature (ECO-Feature, U.S. Patent# 9.317.779) [25] beyond the inspection of food products [26] into the aquaculture industries [27] and invasive fish species recognition and removal [28]. In this section, we discuss the improved ECO-Feature, using evolutionary learning of boosted features [29] and its application for fish species recognition.
The motivation of our previous work [25] was to develop a learning algorithm that automatically discovers salient features from a training dataset without the involvement of a human expert to design hand-crafted features. It is a fully automated feature construction method that can construct non-intuitive features that are often overlooked by human experts. As an example, dot patterns on fish skin was used as the identifier for each individual fish, similar to fingerprints for human identification [30]. Identification is a much more challenging task than fish species recognition. Dot pattern features must be identified and incorporated for this purpose, whereas our learning algorithm attempts to differentiate all classes by automatically generating useful features from combining some generic image transformations.
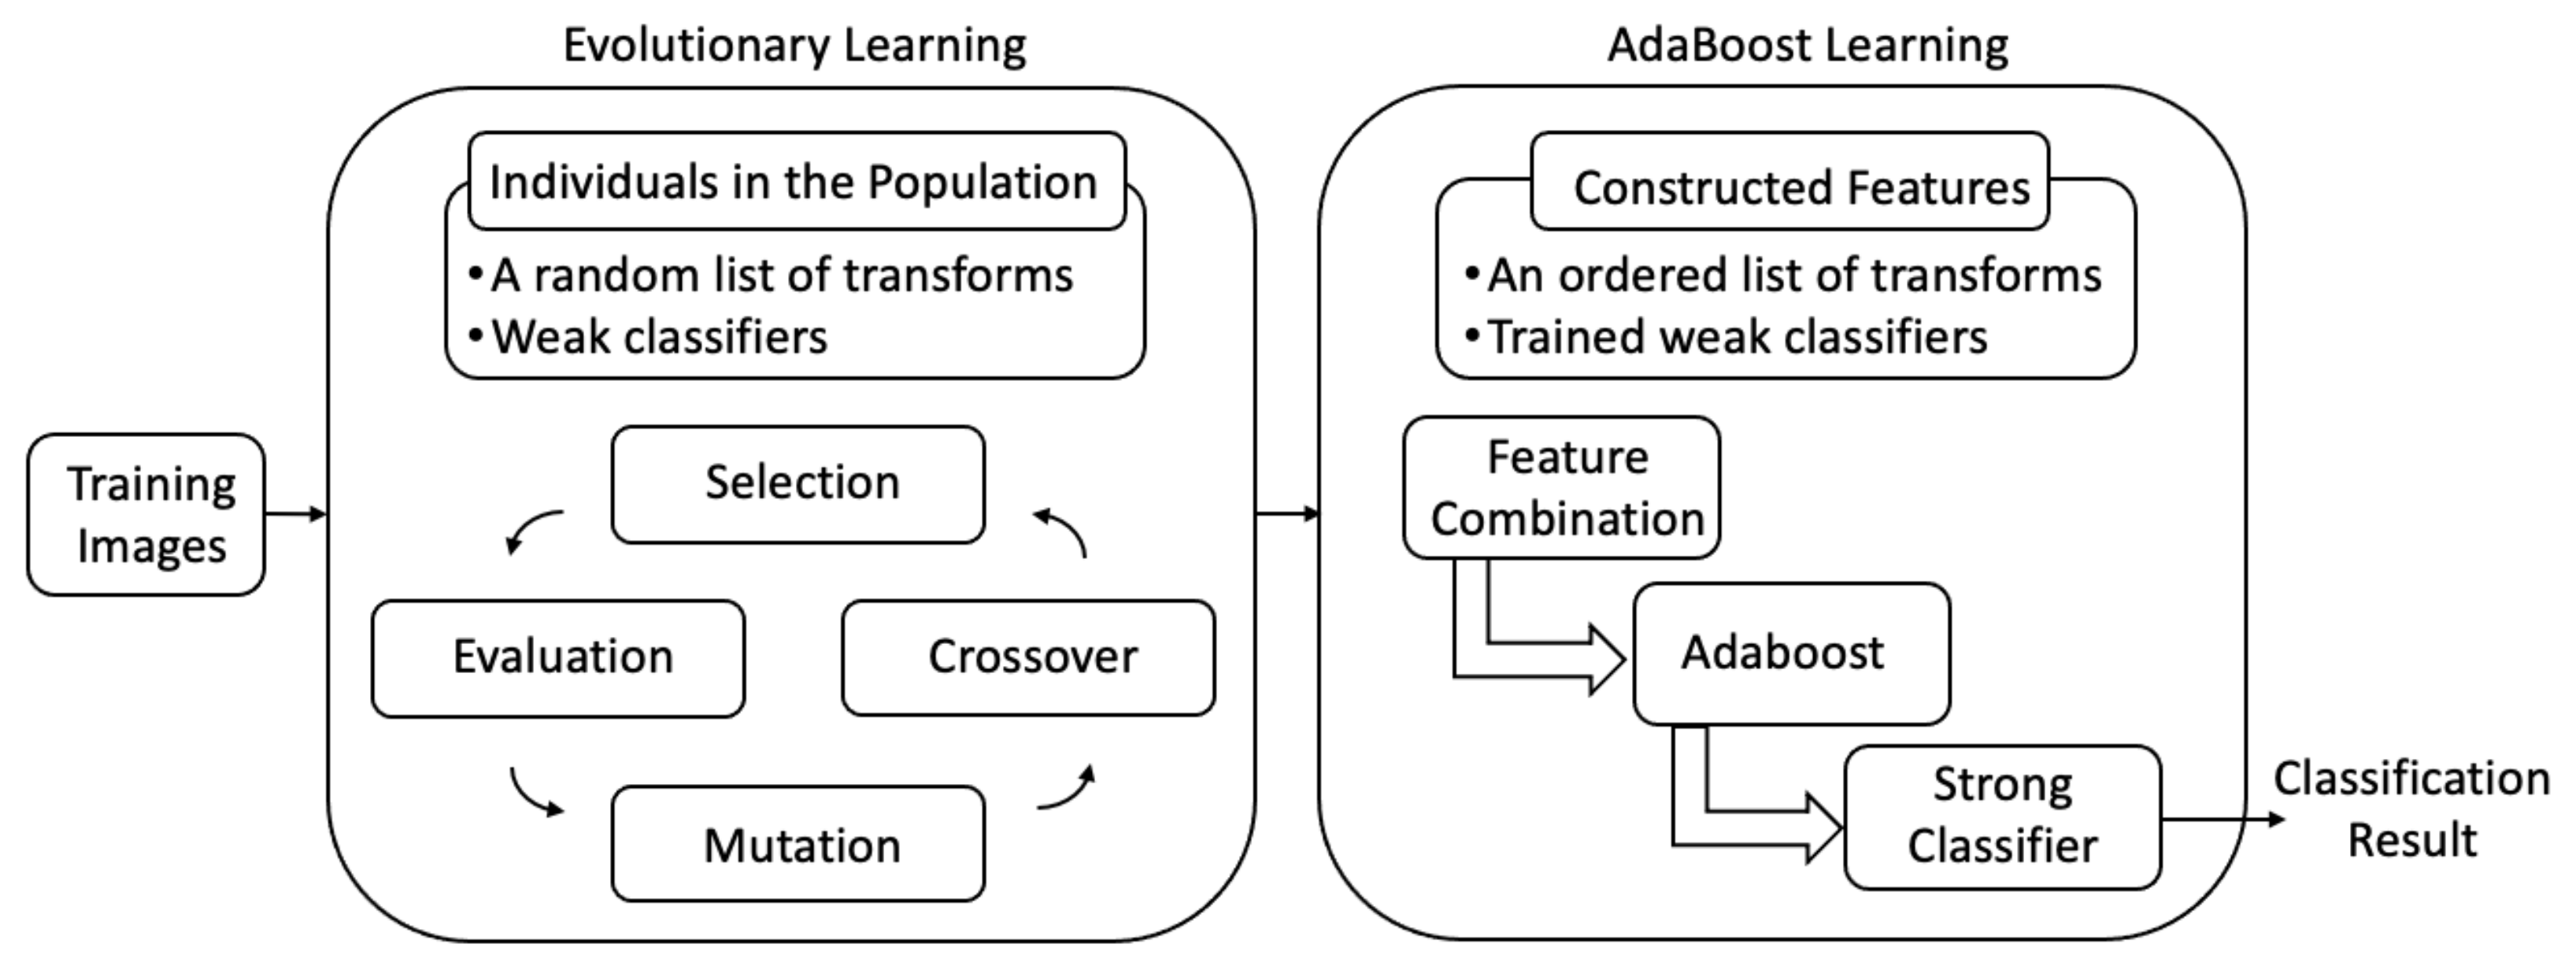
We modified our original ECO-Feature algorithm [25] with evolutionary learning and boosted features for fish species recognition. This method uses the genetic algorithm to find the phenotypes or image transformations that provide the best classification result. The genes which make up a phenotype consist of a number of select basic image transforms and their corresponding parameters. Table 1 shows the candidate transforms to be selected through the training process. The number of genes depends on both the number of transforms and the number of parameters for each transform. A fitness score is computed for each phenotype, using a fitness function. A portion of the population is then selected to create a new generation.
We use a tournament selection method to select phenotypes from the overall population in the genetic algorithm. In order to produce a new phenotype, a pair of parent phenotypes is selected to undergo certain evolution operations, including crossover and mutation. The crossover in our method is achieved by rearranging the image transforms from both parents. By using crossover and mutation, a new phenotype, typically sharing many characteristics of its parents, is created. This evolution operation results in the next generation of phenotypes that are different from their parent generation. This process is repeated for several generations, evolving image features with better fitness. The evolution is terminated when a satisfactory fitness score is reached or the best fitness score remains stable for several iterations.
An evolutionary image transformation (phenotype) is learned from the raw pixel images for each specific object classification application. It is difficult to determine how many image transformations (phenotypes) are needed for a specific application, and due to the randomness of our method, it may require a large pool of image transformations in order to maintain stable performance. For this reason, boosting is employed in our framework to maintain high classification performance, even with a small number of image transformations.
AdaBoost is used to combine the weak classifiers that are associated with the image transformations to form a strong classifier. The training process of AdaBoost classifier involves the training examples reweighting within each iteration. AdaBoost iteratively builds an ensemble of binary classifiers and adjusts the weights of each training example based on the performance of the weak classifiers in the current iteration. Examples that are misclassified will have their weights increased, while those that are correctly classified will have their weights decreased. Therefore, in subsequent iterations, the resulting strong classifier is more likely to correctly classify examples that are misclassified in the current iteration.
Figure 7 shows the flow chart of this evolutionary learning of the boosted features algorithm. The block on the left is the evolutionary learning process that learns the best image transformation and forms candidate weak classifiers. The block on the right combines the weak classifiers to form a strong classifier for fish species recognition.

3. Results

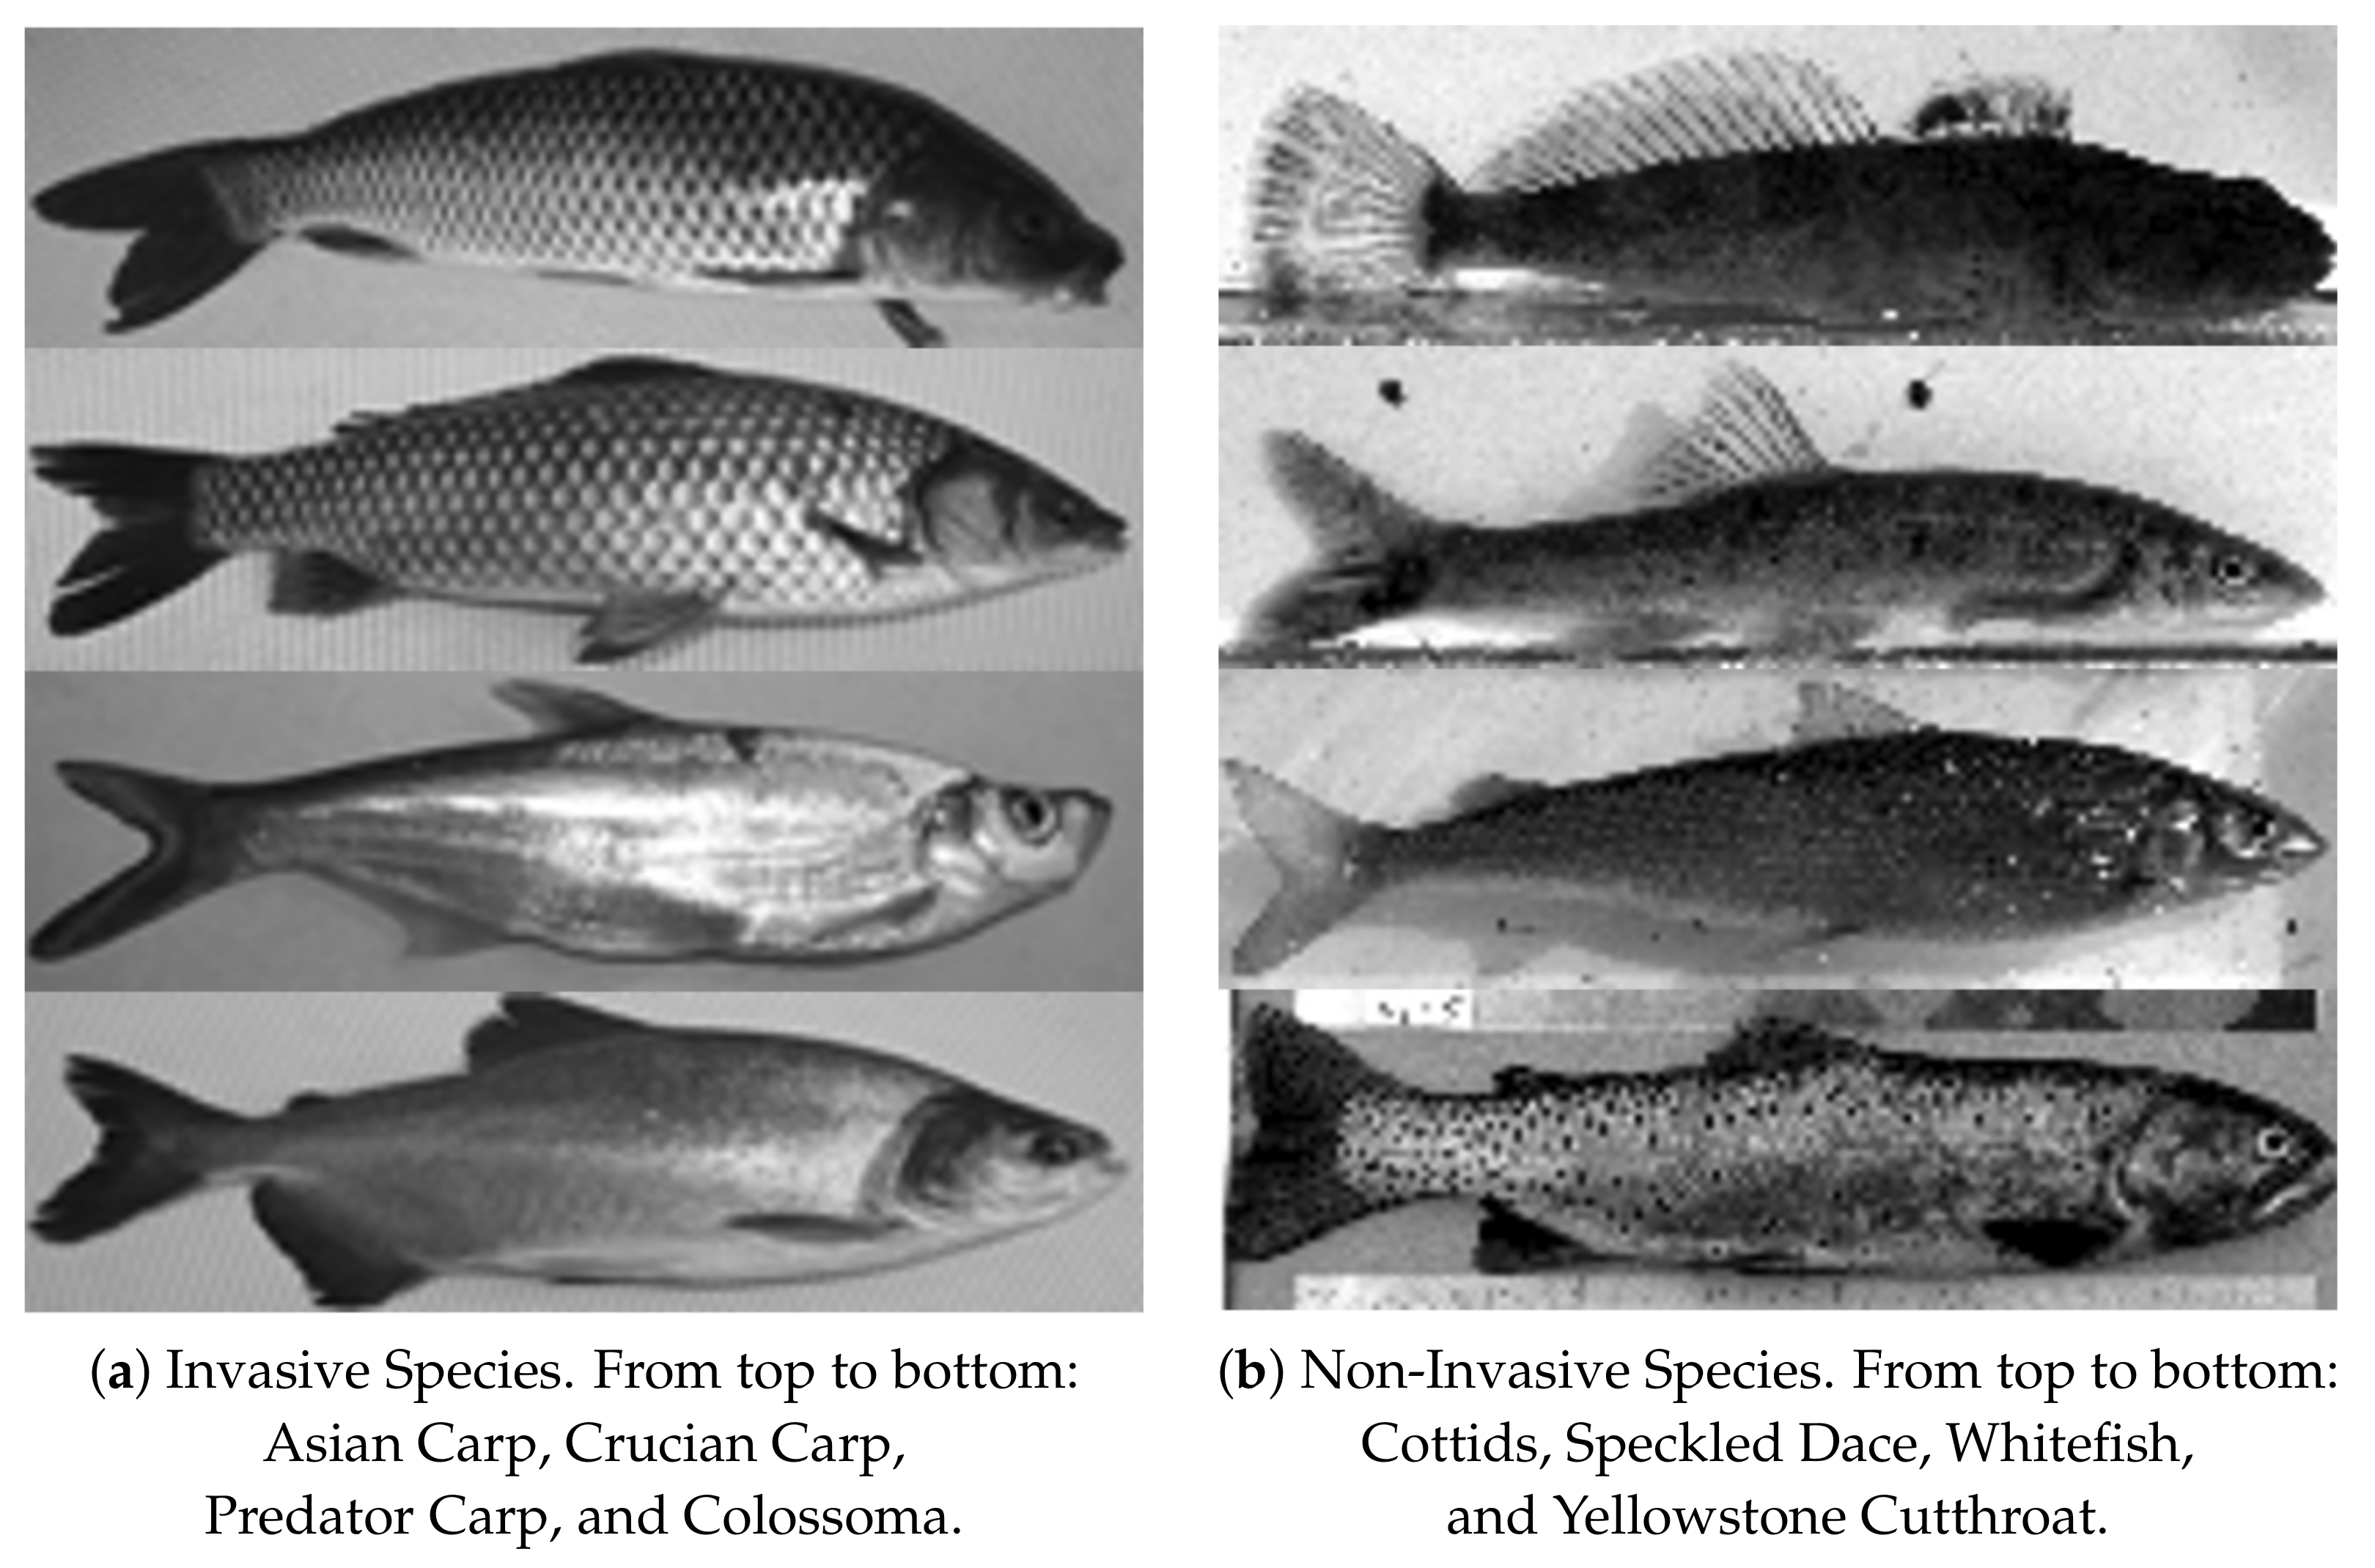
Because of the scarcity of fish in rivers or lakes, it is time-consuming to use our underwater imaging system to collect sufficient image samples of a variety of fish species for experiments. We decided to use the BYU Fish dataset [31] to validate the performance of our fish species recognition algorithm. Figure 8 shows sample images of these species. This dataset was created specifically for invasive carp recognition and for our fish species recognition algorithm, which does not require a large dataset for training. It includes four invasive species (90 Asian Carp, 110 Crucian Carp, 74 Predatory Carp, and 89 Colossoma images) shown in Figure 8a and four non-invasive species (120 Cottids, 137 Speckled Dace, 172 Whitefish, and 240 Yellowstone Cutthroat images) shown in Figure 8b. All fish images were oriented the same way. All images were sized to 161 pixels wide and 46 pixels high. They include shape and fin position variations, caused by the fish movement.
We report the performance of our original and the improved versions of the learning algorithm in Section 3.1. Comparisons with other methods mentioned in Section 2.5 are not included. Our focus of this paper is to report on our implementations of all five major aspects of the system, rather than a slight accuracy improvement on fish recognition, like some other research papers. As shown in Section 3.1 below, our accuracy for a mix of eight species was more than adequate for practical use. Comparing the accuracy with other methods will most likely not provide much more information.
After the features are learned, the classification can be performed with the strong classifier as shown in Figure 7. We used an embedded system (Ordroid-XU4) equipped with a Cortex-A15 2GHz processor to test the classification speed. The classification time depends on the number of features used. For 30 features, it took approximately 10 milliseconds for each classification or 100 frames per second. The main goal of our proposed solution was to provide a low-cost and environmental-friendly system that can be deployed for detecting invasive fish species. We believe that the accuracy and processing speed of our algorithm meet this objective.

3.1. Error Rate

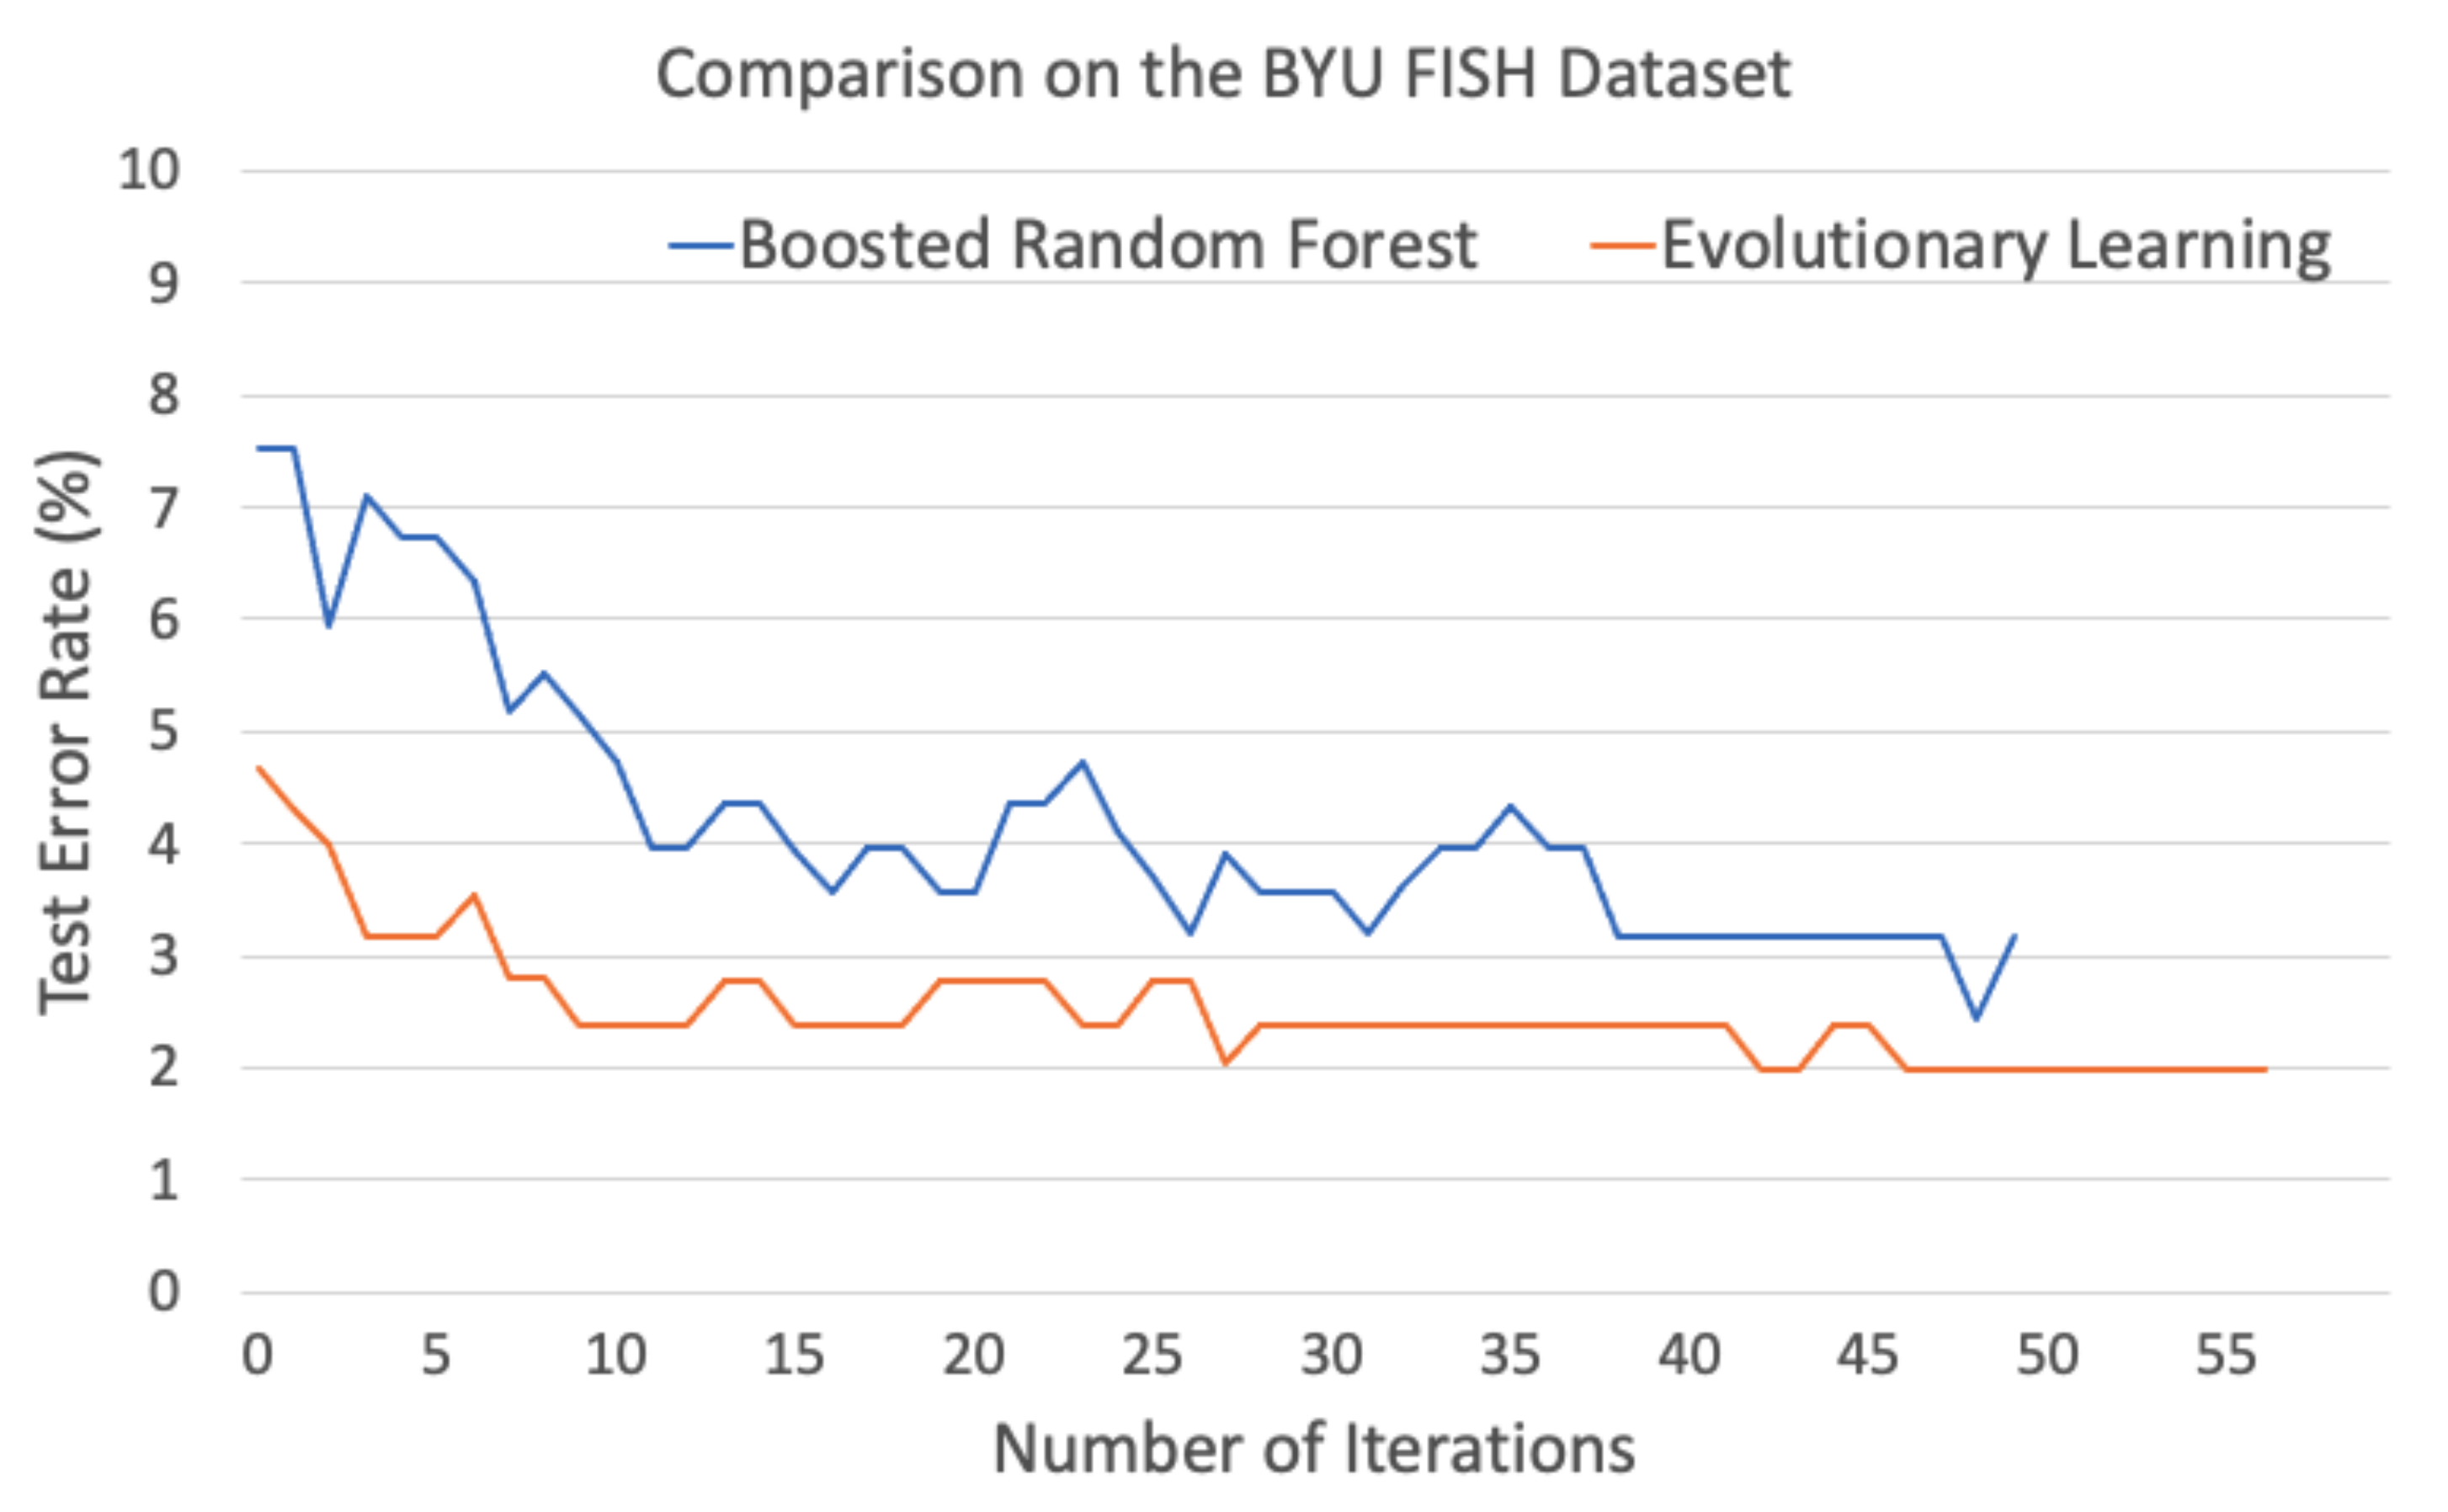
We carried out two experiments to test our evolutionary learning algorithm. In the first experiment, we experimented on the BYU Fish dataset, using only the boosted random forest method, which works on the raw image without evolutionary learning. The test error rate for the random forest method was 3.55% with as many as 50 features. We then tested our evolutionary learning method on the same dataset. The test error rate on this dataset was 1.58% with an average of only 30 features in the model. Figure 9 shows the error rate comparison of these two approaches with respect to the number of iterations for training. This demonstrates that our evolutionary approach discovered distinctive features that are good for fish species recognition.
In the second experiment, we replaced the random forest classifier that is associated with each learned feature with a single decision tree in our evolutionary learning framework to evaluate each candidate feature. The decision tree did not perform as well as the random forest classifier. Our result showed that the random forest classifier was able to find good features at very early stages of the evolution, and reduce the error rate faster than the decision tree.
Our recent work based on the original ECO-Feature using the same dataset obtained slightly better accuracy (0.48%) [28] than the improved version reported in this paper. The improved version addresses three main challenges in the original version. It focuses on learning global image features instead of local features. It is designed for multi-class classification as opposed to binary classification. Using a binary classifier for classification requires one binary test for one class at a time, which is not efficient. It also enhances the performance, using a boosted ensemble of classifiers, and thus, requires training for fewer features but still maintains good classification performance. These improvements allow the improved algorithm to run on an embedded system for real-time applications without sacrificing its performance.

3.2. Population and Training Data

We conducted experiments using two different population sizes of 10 and 100 in our genetic algorithm. It seemed that using a relatively small population of 10 resulted in better performance than the population size of 100. This was likely because using a small population size allows for the exploration of those transform combinations that tend to mature more slowly than others but could eventually reach a higher fitness score. We ran our genetic algorithm in our experiments using a population size of 10. The advantages of this population size are its computational efficiency and its ability to provide diversity in the learned evolutionary image transformations or image features.
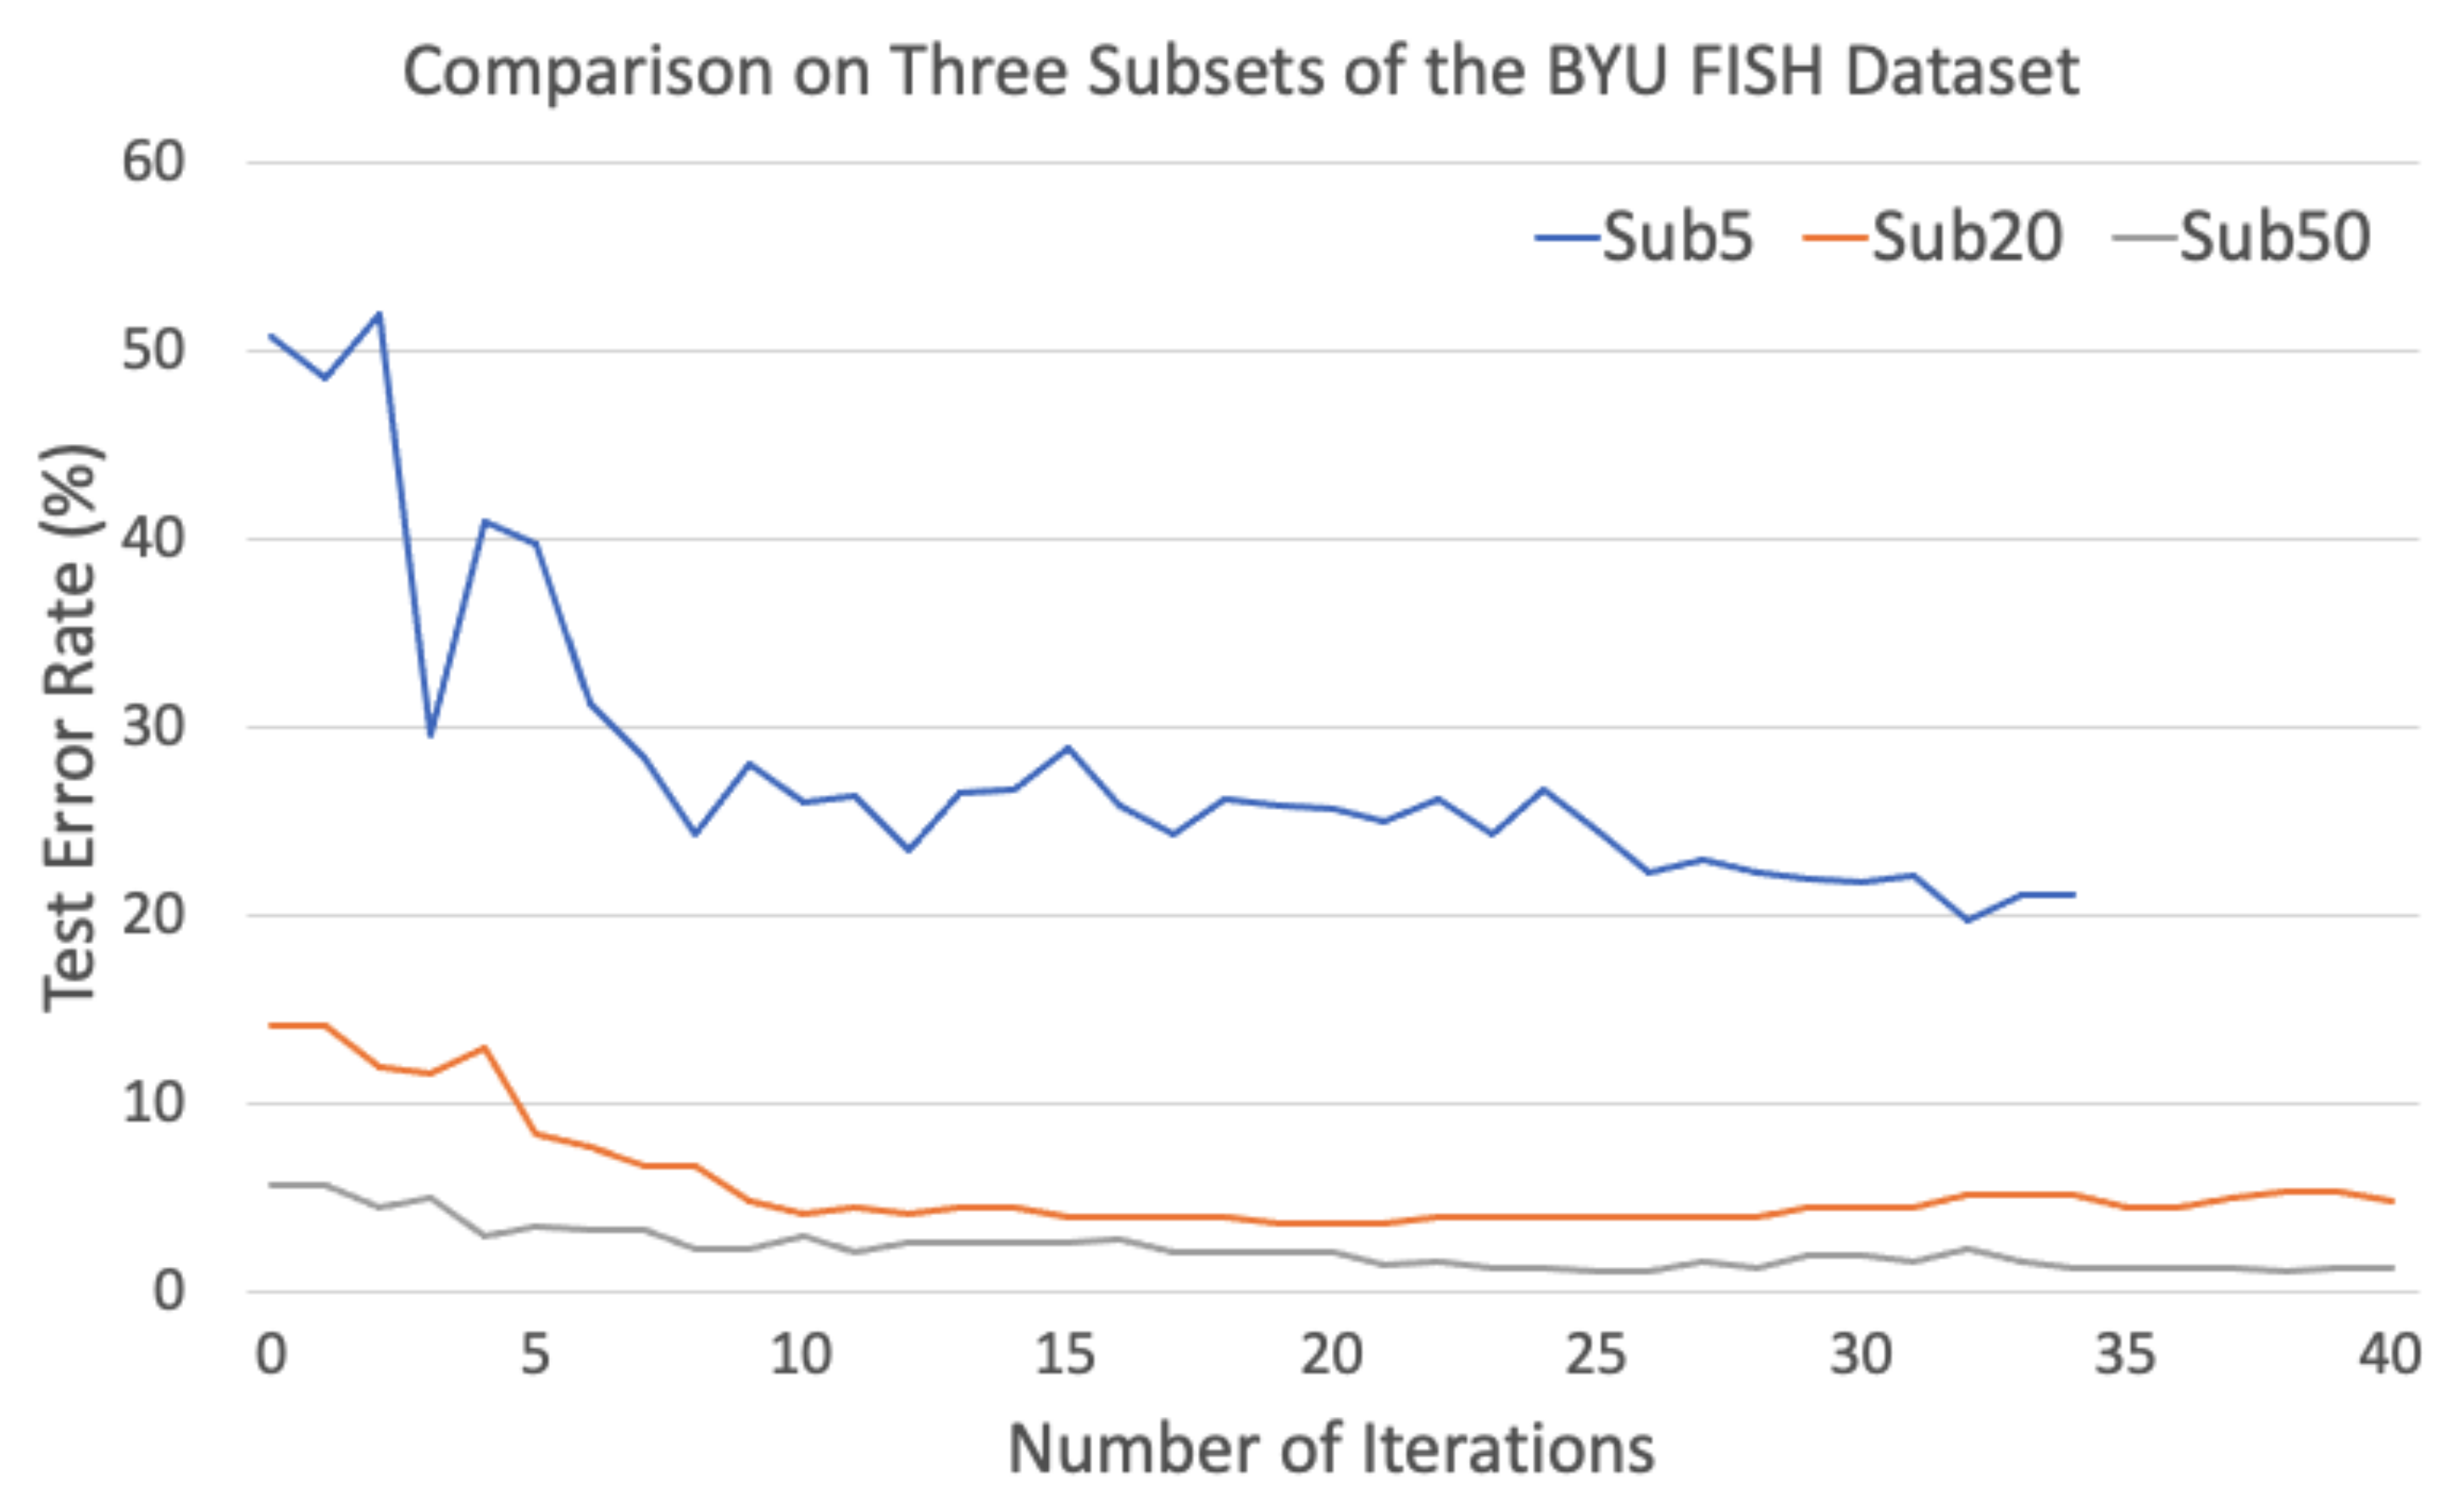
We also trained our models on three randomly created subsets of the fish training data, with 5, 20 and 50 training images per class. Figure 10 shows the performance on these three subsets, using the same model. It shows that our method obtained impressive results, even when using only 20 images per class for training and no data augmentation was used for training. It required only approximately 10 training iterations to reach its steady performance.

3.3. Visualization of Features

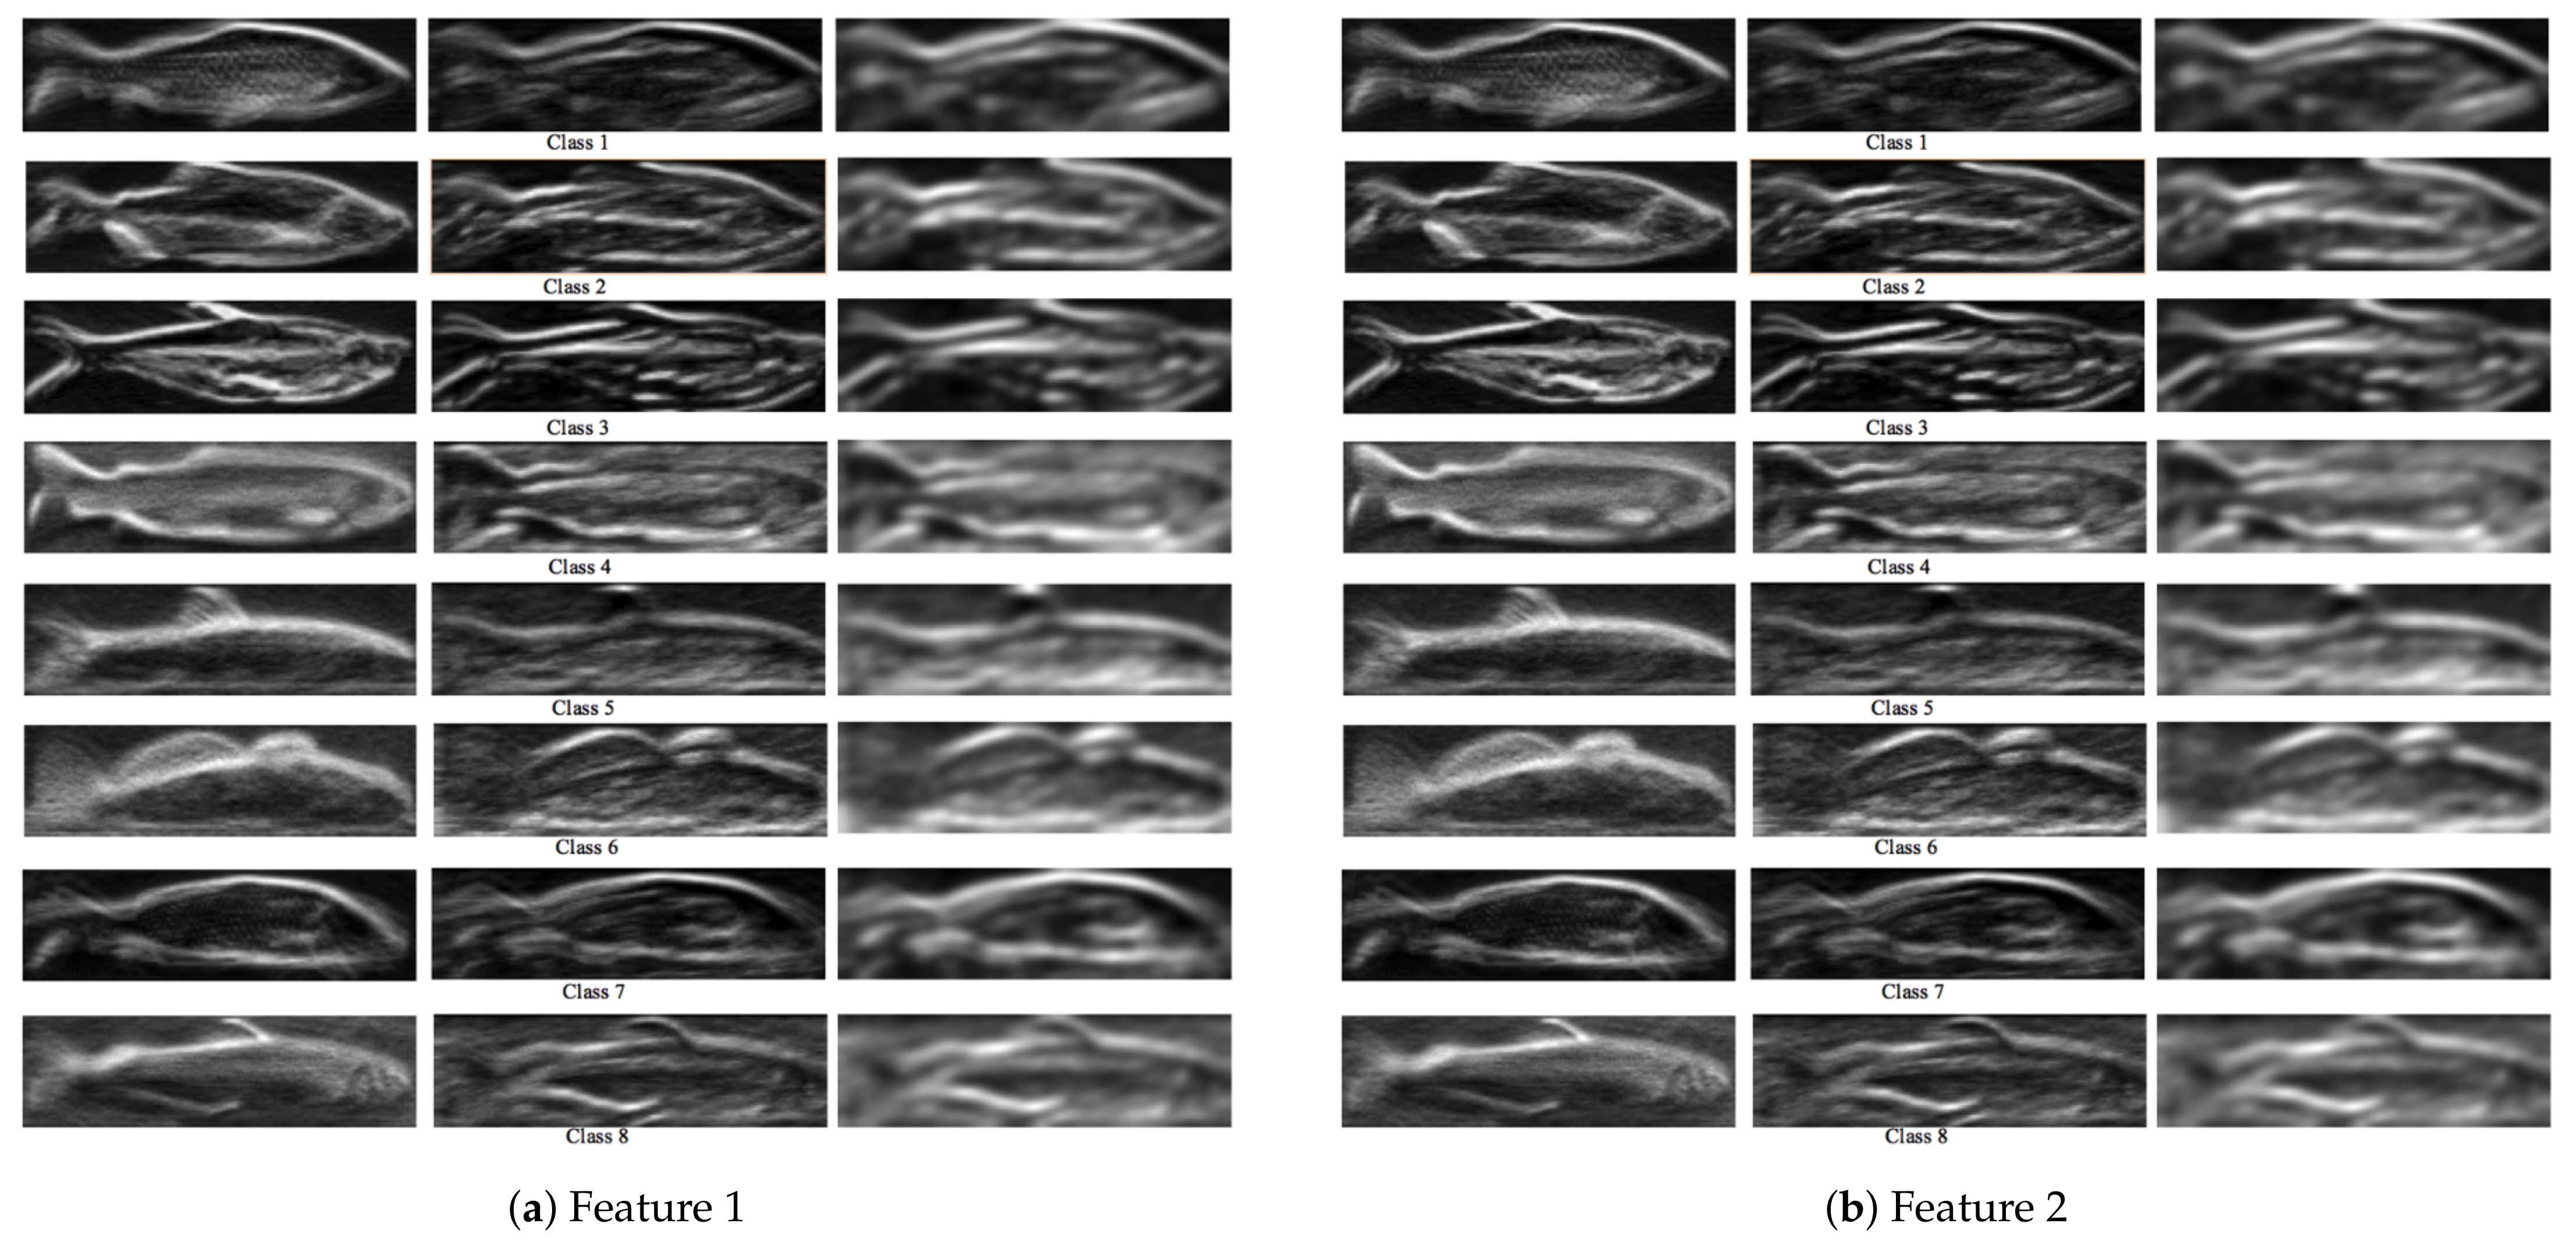
Our evolutionary learning method is generalized so that it can be easily applied to different applications without a human expert to adjust any parameters or design specific image features. We took a closer look at how those evolutionary image transformations or image features obtained from our learning process are composed and what our evolutionary learning method constructed for the two datasets. Our evolutionary learning method constructed a group of evolutionary image transformations or features that are composed of a series of image transforms. The information that these transformations discovered is analyzed by examining the output of each image transform in the learned transformation sequences. The image transform output of each training image is different because every training image in the same class is slightly different. To visualize them, we averaged the image transform outputs of the training images used for each specific class. The resulting average outputs are normalized to be viewed as images. The normalization is not part of our algorithm for training and testing. It is performed to help visualize the constructed features and provide a clearer sense of what the evolutionary image information has found.
In Figure 11, each row represents one species of the Fish dataset (total of eight fish species), and each column represents a specific transform that appears in that feature. These transforms are also shown in the order that they appear in the feature. There are three transforms in each feature shown in Figure 11. The first feature (Figure 11a) consists of a gradient transform (column 1), a Gabor transform (column 2), and a Gaussian transform (column 3). The second feature (Figure 11b)) consists of a gradient transform (column 1), a Gaussian transform (column 2), and a Sobel transform (column 3).
Figure 11 shows that shape information is the most important piece of information that is extracted from the images. From a human expert’s point of view, shape information is probably the most important information to be used to classify the eight fish species in the BYU Fish dataset. The first feature emphasizes more on the shape. Whereas, the second feature emphasizes both the shape and texture information.

4. Conclusions

We used our evolutionary learning algorithm, which learns a high-quality feature set to perform efficient multi-class fish species recognition. This method is capable of constructing highly discriminative features automatically from the training data. It constructs features that are often overlooked by humans, and is robust to minor image distortion and geometric transformations. It uses a genetic algorithm to evolve and construct prominent features that are defined as a series of elementary image transforms on the input images. Boosting techniques are used to select the candidate features during evolution and merge them to achieve accurate prediction. The use of boosting techniques improves performance by using a set of combined features instead of using individual features. It also makes it possible to use fewer features while maintaining classification performance.
The full invasive fish species recognition and separation system prototype showed successful results of identifying invasive fish species so that they can be diverted into a holding net while other species are released back into open water. The system was able to obtain high accuracy in the targeted indoor pool testing environment but also showed that it can handle more challenging lighting and water conditions with similar accuracy because of its multiple detection criteria. Our future work includes the implementation of the closed-loop control system using image quality assessment and the deployment of the system in Utah Lake to collect more fish images for algorithm improvement as well as the testing of the whole system in a real-world environment.

Author Contributions

Conceptualization, J.C. and D.-J.L.; methodology, D.-J.L., B.T., K.L.; software, D.-J.L.; validation, J.C. and D.-J.L.; formal analysis, J.C. and D.-J.L.; investigation, D.-J.L., B.T. and K.L.; resources, B.T. and K.L.; data curation, J.C. and D.-J.L.; writing—original draft preparation, J.C. and D.-J.L.; writing—review and editing, J.C. and D.-J.L.; visualization, J.C. and D.-J.L.; supervision, B.T. and K.L.; project administration, B.T. and K.L.; funding acquisition, D.-J.L., B.T. and K.L. All authors have read and agreed to the published version of the manuscript.

Funding

This research was funded by Utah Science Technology Research Initiative, Technology Acceleration Program Grant #181506 and The State of Michigan Great Lakes Invasive Carp Challenge.

Conflicts of Interest

The funders had no role in the design of the study; in the collection, analyses, or interpretation of data; in the writing of the manuscript, or in the decision to publish the results.

References

  1. The Great Lakes Invasive Carp Challenge. Available online: https://www.michigan.gov/dnr/0,4570,7-350-84430_84439---,00.html (accessed on 20 July 2021).
  2. Facts About Invasive Bighead and Silver Carps. Available online: https://pubs.usgs.gov/fs/2010/3033/pdf/FS2010-3033.pdf (accessed on 20 July 2021).
  3. Sass, G.; Hinz, C.; Erickson, A.; McClelland, N.; McClelland, M.; Epifanio, J. Invasive Bighead and Silver Carp Effects on Zooplankton Communities in the Illinois River, Illinois, USA. J. Great Lakes Res. 2014, 40, 911–921. [Google Scholar] [CrossRef]
  4. Asian Carp—Aquatic Invasive Species. Available online: https://www.fws.gov/midwest/fisheries/library/fact-asiancarp.pdf (accessed on 20 July 2021).
  5. Electric Barriers. Available online: https://www.lrc.usace.army.mil/Missions/Civil-Works-Projects/ANS-Portal/Barrier/ (accessed on 20 July 2021).
  6. Application of Broadband Sound for Bigheaded Carp Deterrence. Available online: https://www.usgs.gov/centers/umesc/science/application-broadband-sound-bigheaded-carp-deterrence?qt-science_center_objects=0#qt-science_center_objects (accessed on 20 July 2021).
  7. Evaluating the Behavioral Response of Silver and Bighead Carp to CO2 across Three Temperatures. Available online: https://www.usgs.gov/centers/umesc/science/evaluating-behavioral-response-silver-and-bighead-carp-co2-across-three?qt-science_center_objects=0#qt-science_center_objects (accessed on 20 July 2021).
  8. Asian Carp Behavior in Response to Static Water Gun Firing. Available online: https://pubs.er.usgs.gov/publication/fs20133098 (accessed on 20 July 2021).
  9. Tix, J.A.; Cupp, A.R.; Smerud, J.R.; Erickson, R.A.; Fredricks, K.T.; Amberg, J.J.; Suski, C.D. Temperature Dependent Effects of Carbon Dioxide on Avoidance Behaviors in Bigheaded Carps. Biol. Invasions 2018, 20, 3095–3105. [Google Scholar] [CrossRef]
  10. Chicago Canal Flooded With Toxin To Kill Asian Carp. Available online: https://www.npr.org/templates/story/story.php?storyId=121104335 (accessed on 31 August 2021).
  11. The Sexton Corporation. Available online: https://thesextonco.com/ (accessed on 20 July 2021).
  12. Teledyne FLIR. Available online: https://www.flir.com/ (accessed on 20 July 2021).
  13. Mukherjee, S.; Valenzise, G.; Cheng, I. Potential of Deep Features for Opinion-Unaware, Distortion-Unaware, No-Reference Image Quality Assessment. In Proceedings of the International Conference on Smart Multimedia in Lecture Notes in Computer Science, San Diego, CA, USA, 16–18 December 2019; Volume 12015. [Google Scholar]
  14. Yang, L.; Liu, Y.; Yu, H.; Fang, X.; Song, L.; Li, D.; Chen, Y. Computer Vision Models in Intelligent Aquaculture with Emphasis on Fish Detection and Behavior Analysis: A Review. Arch. Comput. Methods Eng. 2021, 28, 2785–2816. [Google Scholar] [CrossRef]
  15. Hasija, S.; Buragohain, M.J.; Indu, S. Fish Species Classification Using Graph Embedding Discriminant Analysis. In Proceedings of the International Conference on Machine Vision and Information Technology, Singapore, Singapore, 17–19 February 2017. [Google Scholar]
  16. Marini, S.; Fanelli, E.; Sbragaglia, V.; Azzurro, E.; RioFernandez, J.D.; Aguzzi, J. Tracking Fish Abundance by Underwater Image Recognition. Sci. Rep. 2018, 8, 13748. [Google Scholar] [CrossRef] [PubMed] [Green Version]
  17. Pudaruth, S.; Nazurally, N.; Appadoo, C.; Kishnah, S.; Vinayaganidhi, M.; Mohammoodally, I.; Ally, Y.A.; Chady, F. SuperFish: A Mobile Application for Fish Species Recognition using Image Processing Techniques and Deep Learning. Int. J. Comput. Digit. Syst. 2021, 10. [Google Scholar] [CrossRef]
  18. Demertzisa, K.; Iliadisb, L.S.; Anezakis, V.D. Extreme Deep Learning in Biosecurity: The Case of Machine Hearing for Marine Species Identification. J. Inf. Telecommun. 2018, 2, 492–510. [Google Scholar] [CrossRef]
  19. Urbanova, P.; Bozhynov, V.; Císař, P.; Železný, M. Classification of Fish Species Using Silhouettes. In Proceedings of the International Work-Conference on Bioinformatics and Biomedical Engineering, Granada, Spain, 6–8 May 2020; pp. 310–319. [Google Scholar]
  20. Lee, D.J.; Archibald, J.K.; Schoenberger, R.B.; Dennis, A.W.; Shiozawa, D.K. Contour Matching for Fish Species Recognition and Migration Monitoring. In Applications of Computational Intelligence in Biology: Current Trends and Open Problems; Smolinski, T., Milanova, M., Hassanien, A., Eds.; Springer: Berlin, Germany, 2008; Chapter 8; pp. 183–207. [Google Scholar]
  21. Ding, G.; Song, Y.; Guo, J.; Feng, C.; Li, G.; He, B.; Yan, T. Fish Recognition Using Convolutional Neural Network. In Proceedings of the Oceans 2017, Anchorage, AK, USA, 18–21 September 2017. [Google Scholar]
  22. Hridayami, P.; Putra, K.G.D.; Wibawa, K.S. Fish Species Recognition Using VGG16 Deep Convolutional Neural Network. J. Comput. Sci. Eng. 2019, 13, 124–130. [Google Scholar] [CrossRef]
  23. Pramunendar, R.A.; Wibirama, S.; Santosa, P.I. Fish Classification Based on Underwater Image Interpolation and Back-Propagation Neural Network. In Proceedings of the International Conference on Science and Technology, Yogyakarta, Indonesia, 30–31 July 2019. [Google Scholar]
  24. Deep, B.V.; Dash, R. Underwater Fish Species Recognition Using Deep Learning Techniques. In Proceedings of the International Conference on Signal Processing and Integrated Networks, Noida, India, 7–8 March 2019. [Google Scholar]
  25. Lillywhite, K.; Tippetts, B.; Lee, D.J. Self-tuned Evolution-COnstructed Features for General Object Recognition. Pattern Recognit. 2012, 45, 241–251. [Google Scholar] [CrossRef]
  26. Guo, Z.; Zhang, M.; Lee, D.J.; Simons, T. Smart Camera for Quality Inspection and Grading of Food Products. Electronics 2020, 9, 505. [Google Scholar] [CrossRef] [Green Version]
  27. Zhang, D.; Lillywhite, K.; Lee, D.J.; Tippetts, B. Automatic Shrimp Shape Grading Using Evolution Constructed Features. Comput. Electron. Agric. 2014, 100, 116–122. [Google Scholar] [CrossRef]
  28. Zhang, D.; Lee, D.J.; Zhang, M.; Tippetts, B.; Lillywhite, K. Object Recognition Algorithm for the Automatic Identification and Removal of Invasive Fish. Biosyst. Eng. 2016, 145, 65–75. [Google Scholar] [CrossRef]
  29. Guo, Z.; Zhang, M.; Lee, D.J. Efficient Evolutionary Learning Algorithm for Real-Time Embedded Vision Applications. Electronics 2019, 8, 1367. [Google Scholar] [CrossRef] [Green Version]
  30. Cisar, P.; Bekkozhayeva, D.; Movchan, O.; Saberioon, M.; Schraml, R. Computer Vision Based Individual Fish Identification Using Skin Dot Pattern. Sci. Rep. 2021, 11, 16904. [Google Scholar] [CrossRef]
  31. BYU Fish Dataset. Available online: https://brightspotcdn.byu.edu/33/c5/1cdd22624b88bbff648161bca828/8fish.zip (accessed on 22 July 2021).
Figure 1. Imaging system and water tank for experiment.
Electronics 10 02182 g001
Figure 2. Underwater imaging system installation and sample fish image.
Electronics 10 02182 g002
Figure 3. Water turbidity sample images with increasing turbidity from left to right.
Electronics 10 02182 g003
Figure 4. The design and dimensions of the four-chamber fish separation mechanism.
Electronics 10 02182 g004
Figure 5. The prototype four-chamber system.
Electronics 10 02182 g005
Figure 6. Deployment of the fish separation mechanism.
Electronics 10 02182 g006
Figure 7. Flowchart of the evolutionary learning of the boosted features algorithm.
Electronics 10 02182 g007
Figure 8. Sample images from the BYU Fish dataset.
Electronics 10 02182 g008
Figure 9. Performance comparison on the BYU Fish dataset between the boosted random forest method and the evolutionary learning method with respect to different numbers of training iterations.
Electronics 10 02182 g009
Figure 10. Performance comparison on three subsets of the BYU Fish training data for different number of training iterations.
Electronics 10 02182 g010
Figure 11. Visualization of features that are learned from the BYU Fish dataset. Both features have 3 transforms. Each row represents a class of the Fish dataset (8 fish species), and each column represents the output of each transform.
Electronics 10 02182 g011
Table 1. Candidate image transforms and the number of parameters.
Image TransformNumber of Parameters
Gabor6
Gaussian1
Laplacian1
Median Blur1
Sobel4
Gradient1
Publisher’s Note: MDPI stays neutral with regard to jurisdictional claims in published maps and institutional affiliations.